Abstract
Forests cover 30 percent of the Earth’s land surface, almost four billion hectares, and they are necessary to sustain human health, economic growth, and environmental health. Approximately 25 percent of the global population depends on forests for food and work. The world population is expected to reach 9.6 billion by 2050. Therefore, there is a need for urgent action plans at all levels to ensure sustainable forest management and policy collaboration among all stakeholders, in order for forests to continue to serve our ecosystem and life in the future. The study compares 30 countries using 15 indicators related to forest and air quality. This was performed with TOPSIS (Technique for Order Preference by Similarity to Ideal Solution) and VIKOR (VIseKriterijumska Optimizacija I Kompromisno Resenje, meaning Multi-Criteria Optimization and Compromise Solution), which are among the most used multi-criteria decision-making methods in the literature. According to the analysis results, Denmark, Luxembourg, Lithuania, and Germany are the best performing countries in terms of indicators, whereas Slovakia, Estonia, Turkey, Latvia, Chile, and Canada are the worst performing. The paper aims to present the current situation of some developed and developing countries and compare them to each other in terms of forest and air quality indicators. In addition, the article aims to inform all stakeholders and raise awareness to achieve the Sustainable Development Goals (SDGs) and Global Forest Goals of the United Nations Strategic Plan for Forests 2017–2030 targets.
1. Introduction
Forests represent undoubtedly the richest biological diversity among terrestrial ecosystems. Forests serve people in economic, ecological, social, and cultural aspects and are the natural environments of plants, animals, and other living creatures, which are an essential part of natural life. They supply fundamental ecosystem services, such as wood, food, non-wood goods, and habitat, as well as soil and water protection and clean air. Forests stop soil degradation and desertification and decrease the danger of floods, landslides and snow slide, shortage of water, dust and sandstorms, and other disasters. Forests are home to almost 80 percent of all terrestrial species. Forests mainly reduce climate change and ensure acclimatization and biodiversity [1]. Although the negativities affecting the natural environment are generally perceived as regional, the major effects of these negativities are experienced globally. Therefore, solutions should be produced on a global scale. Forests and each tree need to be monitored and managed in a sustainable manner, in order to reach the Sustainable Development Goals (SDGs) and especially the goals of SDG 15, which is particularly relevant for the sustainable management of forests. In order to emphasize that forests are of great importance for people and all other living things, the UN General Assembly has determined 21 March as International Forest Day, which is celebrated worldwide every year in order to create awareness and an action plan on forest issues [2].
The yearly levels of some air pollutants in Europe and the factors causing them are presented in Figure 1 and Figure 2. It is observed that these values decrease over the years with the measures taken and changes in the production systems.
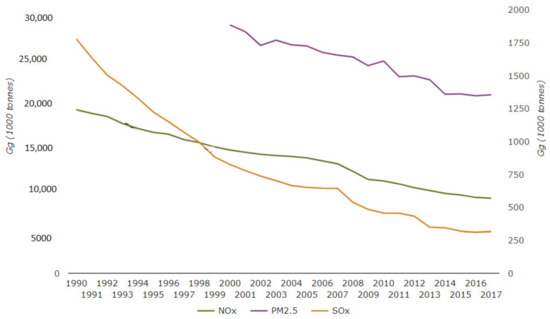
Figure 1.
Emissions of the main air pollutants in Europe [3].
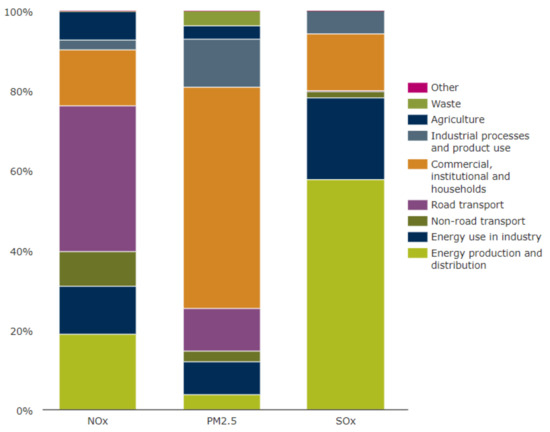
Figure 2.
Emissions of the main air pollutants by sector group in the EEA-33 countries (2017) [3].
Figure 1 shows the emissions of the main air pollutants (NOx, PM2.5, and SOx) in Europe (1990–2017)
Figure 2 shows the emissions of the main air pollutants by sector group in the EEA-33 countries (2017). The 33 member countries include the 27 European Union member states together with Iceland, Liechtenstein, Norway, Switzerland and Turkey.
When the European Union tried to develop sustainable environmental policies, “the environment knows no frontiers” was a popular motto in the 1970s [4]. This significant slogan clearly states that water and air will carry the environmental problems to different geographies rapidly and thus the dimensions that appear to be the problems of a specific region will change dimension and gain global dimensions. Therefore, from the 1970s to the present, studies on environmental problems have been carried out with a regional and global dimension. For example, on a regional basis are the European Union Environmental Legislation Preparations (1970), the European Single Act (1987), the Treaty of Maastricht (1992), and the Treaty of Amsterdam (1997) [5]. Including the main conventions such as the Kyoto Protocol on climate change, more than 3000 international environmental instruments have been recognized by the International Environmental Agreements (IEA) Database Project [6]. Also in recent years, many agreements have been made such as the New York Declaration on Forests (NYDF), the Paris Agreement, the 2030 Agenda for Sustainable Development and its Sustainable Development Goals (SDGs), and the UN Strategic Plan for Forests 2017–2030 (UNSPF) and its Global Forest Goals (GFGs). On the other hand, no significant progress has been made in solving global environmental issues despite all the efforts of international organizations, particularly the United Nations. The United Nations Strategic Plan for Forests 2017–2030 (UNSPF) presents a global plan for operations at all levels to sustainably manage all kinds of forests and trees and prevent forest degradation. The plan considers all forest-related frameworks and agreements for a sustainable environment and its vision is to supply economic, social, environmental, and cultural benefits for present and future generations. UNSPF, in addition to six Global Forest Goals, has set 26 more goals planned to be reached by 2030. Some of the action plans for the Global Forest Goals and the objectives of the United Nations strategic plan for forests are [7]:
- With sustainable forest management, the loss of forest cover around the world should be reversed and the degradation of trees and forests should be prevented;
- Regular monitoring of forests, sustaining and improving forest health;
- Forest biodiversity should be monitored and any losses that may occur should be prevented;
- Losses that may be caused by air, water and soil pollutants and disease risks should be observed and their impact on forest health should be reduced;
- Innovative methods to sustainable forest management should be improved;
- Cooperation should be provided between institutions or individuals that can contribute at all levels;
- Investment environments should be developed to increase the resources required for sustainable forest management;
- The importance of research for sustainable forest management should be understood, and criteria and indicators should be established;
- Methods for obtaining reliable forest inventories and data and statistics should be developed at national and global levels; and
- Reinforced and harmonized data obtaining and reporting periods and formats should be created.
The foremost objectives of national forest action plans are the development and implementation of forest policy among stakeholders. In doing so, they must conduct and direct the processes correctly [8]. Under the influence of these global forest policies and developments, governments have begun to include the evaluation of the forest ecosystem in development policies and plans. However, these initiatives are still in their early stages. Efforts to actively monitor habitats and trees, to collect data and to identify sources of damage in the light of these data, and to take necessary measures are developing and expanding [9].
However, national forest observation programs are very different from one nation to another. The main reason is that these technologies, which are used to evaluate the structural features of forests, are generally practiced by few experts and are mostly limited to the research sector. In other words, numerous national agencies are not able to benefit from current technologies and open or relatively fewer expensive data [10]. At the global level, there is a requirement to defeat the disruption of information exchange and increase coordination among many international organizations, institutions, and researchers who seek solutions to forest issues and to conduct research [11]. The effective monitoring of the changes in forest cover with modern technologies will raise awareness of the threatening factors of forests and will enable policymakers and law enforcement agencies to prepare action plans that are specific to these issues.
Acid rains, the most common environmental pollution, are the result of sulfur oxides (SOx) and nitrogen oxides (NOx) released into the environment by industrial enterprises; when they spread into the atmosphere in form of acidic particles and react with the water vapor in clouds, the reaction results in sulfuric acid and nitric acid, which then precipitate in the form of elements such as snow, rain, dew, or fog [12]. Such acidic compounds landing in rain or other forms of precipitation on the earth increase the acidity of the soil. Since elements such as calcium and magnesium within the composition of the soil are washed down to the underground water, this negatively influences the chemical structure and biological conditions of soil [13].
The indirect effect of acidification on the environment turns into a direct effect with the acid moisture resulting from industrial activities. Toxic substances such as mercury, cadmium, or aluminum, which are considered non-soluble under normal conditions, land on the soil or lakebeds as a result of their reaction with acidic moisture and have toxic effects on plants, animals, and humans through the food chain or potable water. Natural environmental issues have rapidly and increasingly become a global problem. Therefore, remote sensing technologies can be useful in taking preventive measures and quickly detecting the extent of environmental pollution. In short, remote sensing is the process of detecting and monitoring the physical characteristics of an area by measuring its reflected and emitted radiation at a distance (typically from satellites or aircraft). Special cameras collect remotely sensed images, which help researchers “sense” things about the Earth [14].
Just like Earth objects react differently to the natural radiation reaching them and remission values differ by the biological structures of natural objects, natural objects with the same biological structure have different remission values based on their health. This creates a very important opportunity to detect natural environmental damages. For example, if annual plants, agricultural products, wheat and corn, etc., are influenced by heavy flue gas, they cannot give a yield. The degree of effect on the forest trees, on the other hand, varies by species and type, be it coniferous or deciduous [15].
The effects of flue gas on the immediate surroundings of an industrial facility are easily seen by anyone since trees rapidly deform and die shortly afterwards. However, the effects of flue gas on the areas further from the facility are not visible for long years. Detection of the effects of flue gas beyond visible damages is very important to preventing the destruction of nature. Detection of such a limit scientifically is possible through the remote sensing technique and its fundamental operating principles and outputs [16,17,18].
This article utilizes the TOPSIS (Technique for Order Preference by Similarity to Ideal Solution) and VIKOR (VIseKriterijumska Optimizacija I Kompromisno Resenje, meaning Multi-Criteria Optimization and Compromise Solution), which are two popular multi-criteria decision-making (MCDM) methods to make some inferences and suggestions in the framework of air pollutants and loss of natural and semi-natural vegetated land. The indicators were selected from the OECD (Organization for Economic Co-operation and Development) Environment indicators and data were obtained from the OECD [19] database. The article aims to compare the 30 countries, most of which are European countries, in terms of indicators of air, climate, and forest. The data of 15 indicators used in the study were obtained from the OECD database. When determining countries, countries that had data on all indicators were preferred. Countries that did not have data on any of these criteria were excluded from the study. The study aims to present the current situation of some selected developed countries and European countries together using the relevant indicators. In addition, the study aims to compare these countries according to the scores they obtained from the analyses.
There are many similar MCDM comparison and ranking studies in the literature. Bagheri et al. [20] proposed a comparative survey of the condition of tourism infrastructure in Iranian provinces using VIKOR and TOPSIS. Minarcíková [21] used TOPSIS and VIKOR methods for the evaluation of regional innovation performance. Mateusz et al. [22] analyzed the possibilities of using the methods of multidimensional comparative analysis of TOPSIS and VIKOR to study the level of sustainable development of EU countries. Ture et al. [23] assessed the Euro 2020 strategy using VIKOR and TOPSIS. Eyüboğlu [24] compared the financial performances of banking sectors in developing countries with TOPSIS. Bilbao-Terol et al. [25] used TOPSIS for assessing the sustainability of government bond funds. Shiraz et al. [26] ranked development levels of countries with VIKOR and TOPSIS methods. Poledníková and Kashi [27] evaluated the regional innovation performance in the Czech Republic using the TOPSIS method. Wang et al. [28] proposed a TOPSIS analysis framework to evaluate multiple factors of air pollutants and economic development. Ozkaya and Erdin [29] compared 44 cities in six dimensions, including a sustainable environment, using the ANP (Analytic Network Process) and TOPSIS methods. Narayanamoorthy et al. [30] evaluated five alternatives among the four criteria using an improved MULTIMOORA (The Multi-Objective Optimization by Ratio Analysis) method and select the best method for improving air quality in Tamil Nadu, India. Finally, a numerical example was illustrated to show the efficiency of the proposed method. Chen et al. [31] employed a multiple-criteria decision-making model and a substitution method based on causal relationships to analyze potential improvement strategies for air quality in Kaohsiung, Taiwan. Results revealed that coal-fired power plants and factory emissions are the major sources of pollution in Kaohsiung. Dang [32] used the entropy method to determine the weights of criteria. The VIKOR method is also used to rank different OECD countries based on their environmental quality.
2. Methodology and Data
Determining the development of a region and comparing it with others is a multi-criteria decision-making (MCDM) problem [33]. Thus, it requires evaluation of many conflicting criteria [33,34]. According to the sort of problem, proper MCDM techniques have been determined after experiments carried out over the years [35]. Therefore, TOPSIS (Technique for Order Preference by Similarity to Ideal Solution) and VIKOR (VIseKriterijumska Optimizacija I Kompromisno Resenje, meaning Multi-Criteria Optimization and Compromise Solution) methods have been proposed for comparing and ranking countries according to the selected criteria. TOPSIS was developed by Yoon [36] and uses the basic approaches of the ELECTRE (ELimination Et Choix Traduisant la REalité, meaning ELimination and Choice Expressing REality) method. It is based on the principle of the closeness of decision points to the ideal solution, and the solution process is shorter than the ELECTRE method [37]. VIKOR, which is one of the multi-criteria decision-making techniques, is used to evaluate the indicators and compare the countries according to the indicators. VIKOR is a merge-based method that represents the solution closest to the ideal solution [38].
2.1. TOPSIS (Technique for Order Preference by Similarity to Ideal Solution)
TOPSIS (Technique for Order Preference by Similarity to Ideal Solution) was developed by Yoon [39]. It involves a 6-step solution process. The steps of the TOPSIS method are described below.
Step 1: In the rows of the decision matrix, there are decision points whose superiorities are to be listed, and in the columns, there are evaluation factors to be used in decision making. Matrix A is the initial matrix created by the decision maker. The decision matrix is shown as Equation (1):
where m represents the number of decision points and n represents the number of evaluation factors. In addition, whereas i represents the country, j represents the criterion.
Step 2: Creating the standard decision matrix (R): Step 2 standardizes the columns of A so that scale differences in the measures do not matter. The standard decision matrix is calculated by using the elements of matrix A and the following Equation (2):
The matrix R is defined by the matrix shown below:
Step 3: Creating the weighted standard decision matrix (V): wi represents the weights of the criteria, expressing the decision-maker’s preference as the relative importance of the criteria. Therefore, first the weight values (wj) of the evaluation factors are chosen (). Then the elements in each column of the R matrix are multiplied by the corresponding wj value to form the V matrix. The V matrix is shown below:
Step 4: Creating ideal () and negative ideal () solutions: finding the ideal solution set is shown in the following Equation (5):
The set calculated from Equation (5) can be shown as
The set of negative ideal solutions is formed by selecting the smallest of the weighted evaluation factors in the V matrix. Creating the negative ideal solution set is shown in the following Equation (6):
The set calculated from Equation (6) can be shown as . In both formulas, represents the benefit (maximization) and indicates the loss (minimization).
Step 5: In the TOPSIS method, the Euclidian distance approach is used to find the deviations of the evaluation factor value for each decision point from the ideal and negative ideal solution set. The calculation of the ideal discrimination () measure is shown in Equation (7) and the calculation of the negative ideal discrimination () measure is shown in Equation (8):
Step 6: The ideal and negative ideal separation measures are used to calculate the proximity of each decision point relative to the ideal solution. The calculation of the proximity to the ideal solution is shown in the following Equation (9):
The value is in the range where indicates the absolute proximity of the corresponding decision point to the ideal solution and indicates the absolute proximity of the corresponding decision point to the negative ideal solution.
2.2. VIKOR (Multi-Criteria Optimization and Compromise Solution)
VIKOR is a multi-criteria decision-making (MCDM) method. It was originally developed by Opricović [38] to solve decision problems with conflicting and non-commensurable (different units) criteria. The VIKOR method is used for the selection of a set of alternatives or the ordering of alternatives if there are conflicting criteria. Under the assumption that each alternative is evaluated for each criterion, the comparative order is reached by comparing the closeness values to the ideal alternative.
The idea of a compromise solution was introduced in MCDM by Yu [40] and Zeleny [41]. The different J alternatives are indicated as a1, a2, …, aJ. For alternative aj, the rating of the ith feature is indicated by ƒij. ƒij is the value of ith criterion function for the alternative aj; n is the number of criteria. The compact solution Fc is the closest suitable solution to the ideal solution F*. f* represents ideal solution values in Figure 3. As shown in Figure 3, compromise refers to an agreement created by mutual privileges by Δƒ1 = ƒ1*−ƒ1c and Δƒ2 = ƒ2*−ƒ2c.
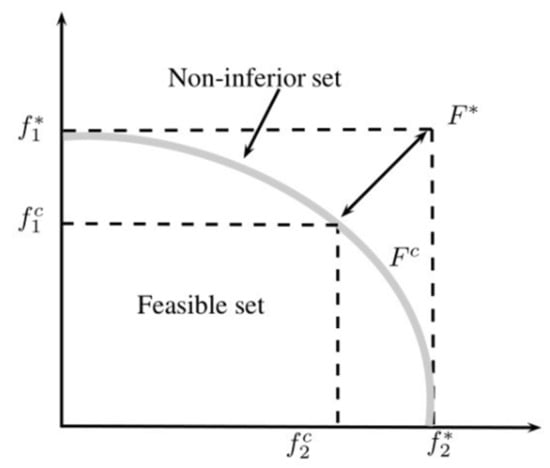
Figure 3.
Ideal and compromise solutions [23].
The compromise ranking algorithm VIKOR has the following steps:
Step 1. If the criterion j is a “benefit” criterion for the model created, then,
ƒj* = max xij
ƒj- = min xij
ƒj- = min xij
If the criterion j is a “cost” evaluation criterion, then,
ƒj* = min xij
ƒj- = max xij
ƒj- = max xij
Step 2. Calculation of Sj and Rj values, j = 1, 2, …, J, by the relation,
Sj is the weighted and normalized Manhattan distance, Rj is the weighted and normalized Chebyshev distance, and wi is the weight of the criteria, expressing the decision-maker’s preference as the relative importance of the criteria.
Step 3. Compute the values Qj, j = 1, 2, ..., J.
S *, S-, R *, and R- parameters used in the calculation of Qj values are calculated with the following:
S* = MinSj S− = MaxSj R* = MinRj R− = MaxRj
The parameter v used in the calculation of the Qj values expresses the weight for the strategy. v represents the maximum group benefit, and (1 − v) represents the weight of the minimum regret of the opponents. It is usually used as v = 0.5.
Step 4. Rank the alternatives, sorting by the values S, R, and Q in decreasing order. The alternative with the smallest Qj value is determined as the best option in the group of alternatives. In order for the obtained result to be valid, two conditions must be met.
- a)
- Condition (C1)—(Acceptable advantage)It proves that there is a distinct difference between the best and the closest one to the best option. A1 is the first best alternative with at least Q, and A2 is the second-best alternative. An acceptable advantage is:
- b)
- Condition (C2)—Acceptable stability in decision making
This condition must be met in order to prove that the resulting solution is stable: The alternative A1 with the best Q value must have obtained the best score in at least one of the S and R values.
If one of the two specified conditions cannot be met, then a compromise solution set is recommended as follows:
- If the acceptable stability condition is not met, both the alternatives A1 and A2 are considered as compromise solutions.
- If an acceptable advantage condition is not met, the alternatives A1, A2, …, Am are all included in the compromise best common solution set. Here, the upper bound value max M is determined by the relationship “Q (Am) − Q (A1) < DQ”.
The ranking is decided according to the Q values in the compromise solution set. The best alternative is one of the alternatives with a minimum Q value.
The TOPSIS method performs operations between two reference points using vector normalization. However, the relative importance of the distances to these points is not taken into account. In the VIKOR method, linear normalization is used to reach the solution closest to the ideal solution. Although both the PROMETHEE (Preference ranking organization method for enrichment evaluation) and VIKOR methods use the maximum group benefits, the VIKOR method also takes into account the minimum regret.
The data were normalized using the following Equation (16) in order to evaluate the indicators that have different units and value range together. Thus, the data in all the indicators were rearranged to take on values in the range of 0–1. It is also provided to use indicators with different units together.
Xnorm = (X − Xmin)/(Xmax − Xmin)
Data
The indicators selected for comparison analysis are shown in Table 1:

Table 1.
Criteria and their definitions.
These selected indicators are among the important threats to the development of a sustainable environment and air. Table 2 shows the decision matrix used in TOPSIS and VIKOR analyses. Wi values represent the weights of the indicators, and Ci values represent the indicators. Due to the lack of information about the superiority of the criteria relative to each other, equal weight was given to all indicators in the evaluation. It is also stated in the decision matrix whether each indicator value should be minimum or maximum.
Table 2.
Decision matrix used in TOPSIS and VIKOR methodologies.
3. Results
When the decision matrix stated in Table 2 was analyzed with TOPSIS, the ideal and negative ideal values shown in Table 3 were first calculated.
Table 3.
Ideal and negative ideal solution results using TOPSIS methodology.
The values specified in Table 3 were used in Equation (9) calculations so that the ideal solution (Ci *) value and the general ranking given in Table 4 were obtained. The country with the highest value of Ci * is determined as the country with the highest score.
Table 4.
Closeness to ideal solution and ranking results using TOPSIS methodology.
In VIKOR analysis, the parameters of S *, S-, R *, and R-, which were used in the calculation of Qi values, were first calculated. The values are as follows:
S* = 0.23657; S- = 0.50734; R * = 0.04900; R- = 0.06667; v = 0.5
Whereas the parameter v used in the calculation of the Qi values expresses the weight for the strategy that provides the maximum group benefit, (1 − v) expresses the weight of the minimum regret of the opponents. It is usually used as v = 0.5. When the calculations in step 3 specified in the VIKOR method are made, the Qi values and the general ranking of the countries shown in Table 5 are obtained.
Table 5.
Ranking results of VIKOR methodology.
Afterward, the acceptable advantage and acceptable stability conditions in Step 5 were evaluated. The results of these evaluations are shown in Table 6. It is observed that all countries meet both conditions. It is understood that all countries provide an acceptable advantage and acceptable stability as a result of the evaluation. In other words, the condition is provided, which includes proving that there is a distinct difference between the best and the closest to the best option. Both conditions must be met in order to obtain valid results.
Table 6.
Acceptable advantage and acceptable stability results using VIKOR methodology.
Air quality deterioration and forest degradation are the foremost environmental threat to public health. The study ranks 30 countries on 15 performance indicators across two issue categories covering environmental health and ecosystem vitality. Denmark, Luxembourg, and Switzerland lead the world in sustainability, followed by the United Kingdom, Austria, and France.
Denmark has very good values on air-related indicators, except for “production-based CO2 productivity” and “GDP per unit of energy-related CO2 emissions” indicators. It has a poor value in the “loss of natural and semi-natural vegetated land since 1992” indicator. Denmark has values slightly above the average in the indicators of “gain of natural and semi-natural vegetated land since 1992” and “forests under sustainable management certification FSC, % total forest area,” which are related to the forest. Denmark ranks at the top of the analysis results with air quality scores rather than forest-related scores.
Luxembourg, which is in the top two of the rankings, has good values in air-related indicators except for the “GDP per unit of energy-related CO2 emissions” indicator. On the other hand, although it has low values in indicators related to forest, especially in the “gain of natural and semi-natural vegetated land since 1992” indicator, it has values close to average in the other two forest indicators.
Switzerland, the third country with the best performance in both of the rankings, has very good values except for the “production-based CO2 productivity” and “GDP per unit of energy-related CO2 emissions” indicators. It is the country with the worst value in the “production-based CO2 productivity” indicator. In terms of forest indicators, it has better values than the average scores in the other two indicators except for the “gain of natural and semi-natural vegetated land since 1992” indicator. Switzerland has a very bad value in this indicator as well. Switzerland is the country with the best values in the indicators of sulfur oxides, nitrogen oxides, particulates (PM10), particulates (PM2.5), and “non-methane volatile organic compounds” among these countries. Like the other two countries, Switzerland is in the top three because of its good air indicators rather than forest indicators.
France, Austria, and the UK are very close to each other and these countries are in the top four to six in both rankings. In terms of air indicators, France has a very good value for the “coal support, % total fossil fuel support” indicator. On the other hand, France has particularly bad values for the “production-based CO2 productivity” and “GDP per unit of energy-related CO2 emissions” indicators. The United Kingdom shows worse performance than average in the “coal support, % total fossil fuel support” and “gas support, % total fossil fuel support” indicators. In forest indicators, these three countries have poor scores in the “gain of natural and semi-natural vegetated land since 1992” indicator, whereas Austria and France have very poor values in the “forests under sustainable management certification FSC, % total forest area” indicator. Austria is the country with the worst value in this indicator.
Finland (TOPSIS 7th, VIKOR 8th), Sweden (TOPSIS 8th, VIKOR 7th), and Norway (TOPSIS 9th, VIKOR 11th) show similarity according to the indicator values and analysis scores. Norway and Sweden have considerably worse values in the “production-based CO2 productivity” and “GDP per unit of energy-related CO2 emissions” indicators. Sweden also has a very poor value in “demand-based CO2 productivity,” which is one of the air indicators. Finland also has very poor values in the indicators of “nitrogen oxides” and “gas support, % total fossil fuel support.” If we make an assessment in terms of the forest dimension, Norway has bad values in the indicator of “gain of natural and semi-natural vegetated land since 1992,” whereas Norway and Finland have bad values in the “forests under sustainable management certification FSC, % total forest area” indicator. These countries are ranked higher in the results of both analyses with the values they have in air indicators. On the other hand, they have near or worse than average values in terms of forest indicators.
Germany (TOPSIS 10th, VIKOR 12th) has very good values in air-related indicators, except that the “demand-based CO2 productivity” indicator is slightly worse than the average. Germany has a value close to the average in the “loss of natural and semi-natural vegetated land since 1992” indicator. It draws attention with its poor values in the indicator of “gain of natural and semi-natural vegetated land since 1992” and especially “forests under sustainable management certification FSC, % total forest area.” Due to these values, it cannot be placed in higher ranks.
Japan ranks 9th in the VIKOR analysis and 12th in the TOPSIS analysis. As a result of both analyses, it is the only non-European country to be among the top 14 countries. Japan has very bad values in the “particulates (PM2.5)” and “mean population exposure to PM2.5” indicators. It has very good values compared to the averages in other air-related indicators. It has very bad values in all three indicators related to forest. This causes Japan to be in the 9th or 12th place, although it has very good values in 10 out of 15 indicators.
When Canada (TOPSIS 17th, VIKOR 15th) and the United States (TOPSIS 20th, VIKOR 19th) are evaluated in terms of indicators, they rank behind some important industrialized nations, such as France (2nd), the United Kingdom (4th), Sweden (7th), Japan (9th), Germany (10th), and Spain (16th). The United States has some strong scores on some issues, such as “mean population exposure to PM2.5,” “production-based CO2 productivity,” “coal support, % total fossil fuel support,” and “loss of natural and semi-natural vegetated land since 1992.” On the other hand, it has weak performance scores on others, including “nitrogen oxides,” “particulates (PM10),” “particulates (PM2.5),” “carbon monoxide,” “gain of natural and semi-natural vegetated land since 1992,” and “forests under sustainable management certification FSC, % total forest area.”
Canada has the worst scores in nitrogen oxides, particulates (PM10) and particulates (PM2.5) indicators, and this country has quite poor values in the sulfur oxides, carbon monoxide, “gain of natural and semi-natural vegetated land since 1992,” and “forests under sustainable management certification FSC, % total forest area” indicators compared to average values. When all these scores and rankings are taken into account, Canada has very bad values in some air and forest indicators compared to average values and many other countries. On the other hand, it has the best score in the “loss of natural and semi-natural vegetated land since 1992” indicator.
Hungary (TOPSIS 25th, VIKOR 26th), Lithuania (TOPSIS 26th, VIKOR 25th), Latvia (TOPSIS 27th, VIKOR 27th), Poland (TOPSIS 28th, VIKOR 29th), Chile (TOPSIS 29th, VIKOR 30th), and Turkey (TOPSIS 30th, VIKOR 28th) are at the bottom of the lists according to the results of both analyses.
Hungary has good values compared to the average in the “loss of natural and semi-natural vegetated land since 1992” and “gain of natural and semi-natural vegetated land since 1992” indicators. On the other hand, it has quite bad values in “mean population exposure to PM2.5,” “GDP per unit of energy-related CO2 emissions,” and “forests under sustainable management certification FSC, % total forest area.”
Latvia has the best value in terms of the “demand-based CO2 productivity” indicator. This country also has a very good value compared to the average in the indicator of “forests under sustainable management certification FSC, % total forest area.” But it has quite bad values in nitrogen oxides, carbon monoxide, mean population exposure to PM2.5, GDP per unit of energy-related CO2 emissions, coal support, gas support, “loss of natural and semi-natural vegetated land, since 1992,” and “gain of natural and semi-natural vegetated land since 1992.”
Lithuania has the best value in terms of the “gain of natural and semi-natural vegetated land since 1992” indicator. It also has a very good value compared to the average in the indicator of “forests under sustainable management certification FSC, % total forest area.” On the other hand, it has quite bad values in nitrogen oxides, “GDP per unit of energy-related CO2 emissions,” “gas support,” and “loss of natural and semi-natural vegetated land since 1992” indicators.
While Poland has good values in forest-related indicators, it does not have such good values in air indicators. It has the best value in terms of the “forests under sustainable management certification FSC, % total forest area” indicator. It also has a very good value compared to the average in the indicator of “loss of natural and semi-natural vegetated land since 1992,” and “gain of natural and semi-natural vegetated land since 1992.” On the other hand, it has quite bad values in the sulfur oxides, nitrogen oxides, carbon monoxide, mean population exposure to PM2.5, and demand-based CO2 productivity indicators.
Turkey has a good value in the indicator of “gain of natural and semi-natural vegetated land since 1992”. On the other hand, it has quite bad values in the “mean population exposure to PM2.5,” “GDP per unit of energy-related CO2 emissions,” “gas support, % total fossil fuel support,” “loss of natural and semi-natural vegetated land since 1992,” and “forests under sustainable management certification FSC, % total forest area” indicators.
Chile has the best value in terms of the “demand-based CO2 productivity” indicator. It also has a very good value compared to the average in the indicator of “loss of natural and semi-natural vegetated land since 1992.” On the other hand, it has quite bad values in the sulfur oxides, “gas support, % total fossil fuel support,” “gain of natural and semi-natural vegetated land since 1992,” and “forests under sustainable management certification FSC, % total forest area” indicators. Also, it has the worst value in the carbon monoxide, “non-methane volatile organic compounds,” and “mean population exposure to PM2.5” indicators. In addition, other indicator values of these countries, which are at the end of the rankings, are close to the average.
When the scores and rankings formed as a result of both analyses are evaluated, Denmark, Luxembourg, and Switzerland positively distinguish themselves from other countries, whereas Turkey, Poland, and Chile are distinguished as negative.
4. Discussions
The most important limitation of this study is the absence of a comprehensive database that would enable all countries or a significant majority to be evaluated together. In order to solve this problem, it is necessary to determine common indicators and to create a common database. The novelty of the study is that it both tries to show the current situation of 30 countries with relevant indicators and proposes an integrated decision support system to improve this situation.
Sustainable forest and quality air are very important requirements for all living beings. The study shows the current situation of 30 countries on these issues and compares their performances. There are also indicators that countries with good scores show poor performance. On the other hand, some countries with poor scores and rankings perform well in some indicators. But for sustainable forest and air quality, all these and similar indicators need better and satisfactory values. In order to achieve these satisfactory results, the goals determined by international organizations and institutions should also be taken into consideration on a national basis. Therefore, there is a need to establish a monitoring and prevention organization structure in line with the common participation and contribution of all countries. Currently, the desired success cannot be achieved due to the production systems of some developed and developing countries. Some countries are also unable to provide financial and technological support to these systems.
When the indicator values of the countries in the decision matrix in Table 2 are examined, it is seen that the countries generally show bad performance in the indicators related to economy and production. The preferred type of energy in production plays a critical role.
Since MCDM methods such as the Analytic Network Process (ANP) and Analytic Hierarchy Process (AHP) are based on subjective evaluations, very different results can be obtained in different analyses for the same index. If even the criterion weights are determined by subjective evaluations, the results obtained by the same method for the same index will be different. In this study, the TOPSIS and VIKOR methods were used, with the criteria being equally weighted and not requiring any subjective evaluation, and only processing and evaluating the criteria values. In other words, the evaluations were carried out in a completely objective framework. Due to the computational differences that the methods have, there are some differences in the rankings obtained. However, when the results obtained from both methods are generally evaluated, the results are consistent with each other.
The most environmentally friendly country or country with the best air quality has been discussed in many studies. In the introduction section of the study, MCDM studies carried out on this or similar subjects in the last five years were examined. Considering the number of studies, the methods they used, and their applications, it is seen that the application of this study brings a novelty to the field with its scope, methods, and the number of countries it includes. As a future study proposal, different MCDM methods may be applied to solve this problem and the outputs may be compared with this article.
5. Conclusions
The article evaluates 30 countries, mostly European, based on 15 indicators related to forest and air quality. In addition, while the article aims to demonstrate the current status of sustainable forest and air health, it aims to offer an integrated decision support system in order to achieve future goals. Indicators used in article analysis and related issues are very important topics in terms of climate and human health. The fact that a country has a bad score in terms of forest and air quality also means that the health of that country’s people is under threat. In addition, the problems in these climate issues have important effects not only in the local dimension but also in global aspects. Therefore, it is very important to create an integrated decision support system that covers all relevant stakeholders in order to ensure sustainable forest health and air health.
While 15 indicators and two dimensions were specified in the study, 30 countries were evaluated with TOPSIS and VIKOR methods, which are among the Multi-Criteria Decision-Making (MCDM) methods. The rankings obtained from both methods are consistent with each other. The results of the analyses carried out in this study can be compared with the results of studies involving different methods by other researchers in the future. Although the countries evaluated in the study are mostly European countries, the study evaluated countries such as the United States, Canada, Japan, and Chile, and the study analyzed the positions of these countries in the ranking according to other countries. Countries that do not have data for all indicators of the study were excluded from the study. Indicators were selected from OECD environment indicators and data were obtained from the OECD [19] database.
Denmark and Luxembourg have become the countries with the best scores as a result of the analysis made by both methods. In the rankings, these countries are followed by Switzerland, France, Austria, and the United Kingdom. In terms of evaluation criteria, Finland, Sweden, Norway, Japan, Germany, and The Netherlands are among the top 10 countries in the rankings. According to the results of both analyses, the countries with the worst scores are Lithuania, Hungary, Poland, Latvia, Turkey, and Chile.
While Denmark and Luxembourg have good values in air-related indicators, they should improve their forest-related indicator values. Switzerland has good values in air-related indicators, except for CO2 emissions. These three countries have low performance in forest indicators, primarily in the criterion of “gain of natural and semi-natural vegetated land.” France, Austria, and the United Kingdom have very low performances in CO2 emission, coal, and gas support indicators due to their production systems and the types of energy they depend on. These three countries have very bad values in the forest indicators evaluated in the study. Norway and Switzerland have bad values for “production-based CO2 productivity” and “GDP per unit of energy-related CO2 emissions,” and Sweden has very poor values in CO2 emission indicators. This is due to the industrial and production model of this country and the energy resources it utilizes. Also, Finland has a negative view on the nitrogen and gas support indicators. While Norway has insufficient values in “gain of natural and semi-natural vegetated land” and “forests under sustainable management certification FSC, % total forest area,” Finland has a low performance in the FSC ratio. It can be said that the main reason why these countries are in the top 10 is that they have above-average values in some air indicators.
Germany has a very bad value in the “demand-based CO2 productivity” indicator due to its economy and production system. It has good values compared to the average in other air indicators. In terms of forest, it has bad values in the “gain of natural and semi-natural vegetated land” and “forests under sustainable management certification FSC, % total forest area” indicators. Germany could rank higher if it had better values in forest-related indicators.
Japan, on the other hand, has good values in air indicators except for PM 2.5, but it performs poorly in terms of forest indicators evaluated in the study. If these values were good, they could be among the top five countries.
When Canada (15th) and United States (19th) are evaluated in terms of indicators, they rank behind some important industrialized nations, such as France (2nd), the United Kingdom (4th), Sweden (7th), Japan (9th), Germany (10th), and Spain (16th). The main reason for this result is that these countries have bad scores compared to average values in the PM2.5, PM10, sulfur oxides, carbon monoxide, “gain of natural and semi-natural vegetated land since 1992,” and “forests under sustainable management certification FSC, % total forest area” indicators. An estimated 15,000 premature deaths are caused by air pollution each year in Canada.
Exposure to nitrogen oxides (NOx) and sulfur oxides (SOx) can irritate the lungs, reduce lung function, and increase sensitivity to allergens in people with asthma. The health effects of PM2.5, NOx, and SOx, can impose economic costs from lost productivity, increased need for medical care, decreased quality of life, and increased risk of premature death. The total economic valuation of the health impacts attributable to air pollution in Canada is 114 billion per year [42].
In the United States, one out of every 25 deaths occurs prematurely because of exposure to outdoor air pollution. It kills more Americans than all transportation accidents and gun shootings combined—more than diabetes or breast cancer plus prostate cancer [43].
Poland, Lithuania, Hungary, and Latvia have low scores on air indicators, but they have good values on forest indicators. It seems that these countries urgently need to identify and implement national action plans on air quality.
Both Chile and Turkey have the worst value in general as both air and forests indication. The growth targets and economic concerns set by the Turkish government are pushing the environment and air quality to the second plan. In Turkey, encouragement of coal-based industrial production, insufficient investments in renewable energy resources, and opening of forest areas to construction and mining activities are the biggest reasons for these.
Chile is home to almost one third of the few remaining major lands in the world of relatively undisturbed temperate forests. It is also home to the second largest coastal temperate rainforest on the planet. Globally, more than half of these highly productive and species-rich coastal forests have been cleared to date. In addition, Chile has very unsatisfactory values in the “gain of natural and semi-natural vegetated land since 1992” and “forests under sustainable management certification FSC, % total forest area” indicators. According to the Ministry of the Environment, Chile is one of the countries with the highest air pollution in the world, and this situation is widespread across the country. The biggest cause of this also occurs with PM2.5, which is a small respirable particulate matter. This pollution is also triggered by SOx, PM10, CO, and NOx. These are Chile’s main air pollutants. Medical issues due to the polluted air in Chile will continue to increase if nothing is done to clean up the air.
While all these countries are concerned about the sustainable economy, they should bear in mind that they have responsibilities for the sustainable environment. It is very important for future generations that policymakers should take into account the results and suggestions of this and similar studies in terms of sustainable forest and air health and prepare the necessary action plans. Accomplishing the goals set on a local and global scale in these issues is critical for all living beings.
Author Contributions
G.O. and C.E. conceived and designed the experiments; performed the experiments; analyzed and interpreted the data; contributed reagents, materials, analysis tools, and data; and wrote the paper. All authors have read and agreed to the published version of the manuscript.
Funding
This research received no external funding.
Conflicts of Interest
The authors declare no conflict of interest.
References
- FAO. The State of the World’s Forests 2018—Forest Pathways to Sustainable Development; Food and Agriculture Organization (FAO): Rome, Italy, 2018. [Google Scholar]
- Assembly, U.N.G. International Day of Forests. 2012. Available online: http://www.fao.org/international-day-of-forests/en/ (accessed on 5 July 2020).
- European Environment Agency (EEA). Emissions of the Main Air Pollutants in Europe. 2019. Available online: https://www.eea.europa.eu/data-and-maps/indicators/main-anthropogenic-air-pollutant-emissions/assessment-6 (accessed on 20 August 2020).
- Jordan, A. The Environmental Case for Europe: Britain’s European Environmental Policy; CSERGE Working Paper EDM; University of East Anglia: Norwich, UK, 2006. [Google Scholar]
- Selin, H.; Van Deveer, S.D. EU Environmental policy making and implementation: Changing processes and mixed outcomes. In Proceedings of the 14th European Union Studies Association (EUSA), Biennial Conference, Boston, MA, USA, 4–7 March 2015. [Google Scholar]
- Mitchell, R.B. International Environmental Agreements (IEA) Database Project. 2002. Available online: https://iea.uoregon.edu/ (accessed on 20 June 2020).
- Nations, U. United Nations Strategic Plan for Forests, 2017–2030. 2017. Available online: https://www.un.org/esa/forests/wp-content/uploads/2016/12/UNSPF_AdvUnedited.pdf (accessed on 15 July 2020).
- Baynes, J.; Herbohn, J.; Smith, C.; Fisher, R.; Bray, D. Key factors which influence the success of community forestry in developing countries. Glob. Environ. Chang. 2015, 35, 226–238. [Google Scholar] [CrossRef]
- Cashore, B.; Gale, F.; Meidinger, E.; Newsom, D. Confronting Sustainability: Forest Certification in Developing and Transitioning Countries; Yale University Faculty of Environmental Studies Publication Series; Yale University: New Haven, CT, USA, 2006. [Google Scholar]
- Henry, M.; Réjou-Méchain, M.; Jara, M.C.; Wayson, C.; Piotto, D.; Westfall, J.; Fuentes, J.M.M.; Guier, F.A.; Lombis, H.C. An Overview of Existing and Promising Technologies for National Forest Monitoring. Ann. For. Sci. 2015, 72, 779–788. [Google Scholar] [CrossRef]
- Yamin, F.; Depledge, J. The International Climate Change Regime: A Guide to Rules, Institutions and Procedures; Cambridge University Press: Cambridge, UK, 2004. [Google Scholar]
- Gschwandtner, G.; Gschwandtner, K.; Eldridge, K.; Mann, C.; Mobley, D. Historic emissions of sulfur and nitrogen oxides in the United States from 1900 to 1980. J. Air Pollut. Control Assoc. 1986, 36, 139–149. [Google Scholar] [CrossRef]
- Moss, B.R. Ecology of Fresh Waters: Man and Medium, Past to Future; John Wiley & Sons: Hoboken, NJ, USA, 2009. [Google Scholar]
- USGS. What Is Remote Sensing and What Is It Used For? 2020. Available online: https://www.usgs.gov/faqs/what-remote-sensing-and-what-it-used?qt-news_science_products=0#qt-news_science_products (accessed on 9 September 2020).
- Seyfried, M.; Fukshansky, L. Light gradients in plant tissue. Appl. Opt. 1983, 22, 1402–1408. [Google Scholar] [CrossRef] [PubMed]
- Holmgren, P.; Thuresson, T. Satellite remote sensing for forestry planning—A review. Scand. J. For. Res. 1998, 13, 90–110. [Google Scholar] [CrossRef]
- Keller, T. Air Pollutant Deposition and Effects on Plants, in Effects of Accumulation of Air Pollutants in Forest Ecosystems; Springer: Berlin/Heidelberg, Germany, 1983; pp. 285–294. [Google Scholar]
- Ulrich, B.; Pankrath, J. Effects of Accumulation of Air Pollutants in FOREST ecosystems: Proceedings of a Workshop held at Göttingen, West, Germany, 16–18 May 1982; Springer Science & Business Media: Berlin/Heidelberg, Germany, 1983. [Google Scholar]
- OECD. Air and Climate. 2017. Available online: https://stats.oecd.org/ (accessed on 20 October 2019).
- Bagheri, M.; Shojaei, P.; Khorami, M. A comparative survey of the condition of tourism infrastructure in Iranian provinces using VIKOR and TOPSIS. Decis. Sci. Lett. 2018, 7, 87–102. [Google Scholar] [CrossRef]
- Minarcíková, E. MCDM Methods: Alternative for Evaluation of Regional Innovation Performance. In Proceedings of the European Conference on Innovation and Entrepreneurship, Genoa, Italy, 17–18 September 2015. [Google Scholar]
- Mateusz, P.; Danuta, M.; Małgorzata, Ł.; Mariusz, B.; Kesra, N. TOPSIS and VIKOR methods in study of sustainable development in the EU countries. Proced. Comput. Sci. 2018, 126, 1683–1692. [Google Scholar] [CrossRef]
- Ture, H.; Dogan, S.; Kocak, D. Assessing Euro 2020 strategy using multi-criteria decision making methods: VIKOR and TOPSIS. Soc. Indic. Res. 2019, 142, 645–665. [Google Scholar] [CrossRef]
- Eyüboğlu, K. Comparison the financial performances of developing countries’banking sectors with topsis method. Sos. Bilimler Arast. Derg. 2016, 14, 220–236. [Google Scholar]
- Bilbao-Terol, A.; Arenas-Parra, M.; Cañal-Fernández, V.; Antomil-Ibias, J. Using TOPSIS for assessing the sustainability of government bond funds. Omega 2014, 49, 1–17. [Google Scholar] [CrossRef]
- Eslemian Shiraz, S.; Şengüls, Ü.; Eren, M. Ranking of countries according to their level of development with the vikor and topsis using entropy. In Proceedings of the 6th International Conference of Iranian Operations Research Society, Research Center of Operations Research, Tehran, Iran, 8–9 May 2013. [Google Scholar]
- Poledníková, E.; Kashi, K. Using MCDM methods: Evaluation of regional innovation performance in the Czech Republic; Academic Conferences International. In Proceedings of the ECMLG 2014 10th European Conference on Management Leadership and Governance, Zagreb, Croatia, 13–14 November 2014. [Google Scholar]
- Wang, Q.; Dai, H.-N.; Wang, H. A smart MCDM framework to evaluate the impact of air pollution on city sustainability: A case study from China. Sustainability 2017, 9, 911. [Google Scholar] [CrossRef]
- Ozkaya, G.; Erdin, C. Evaluation of smart and sustainable cities through a hybrid MCDM approach based on ANP and TOPSIS technique. Heliyon 2020, 6, e05052. [Google Scholar] [CrossRef] [PubMed]
- Narayanamoorthy, S.; Anuja, A.; Kang, D.; Kureethara, J.V.; Kalaiselvan, S.; Manirathinam, T. A Distinctive Symmetric Analyzation of Improving Air Quality Using Multi-Criteria Decision Making Method under Uncertainty Conditions. Symmetry 2020, 12, 1858. [Google Scholar] [CrossRef]
- Chen, K.-H.; Yien, J.-M.; Chiang, C.-H.; Tsai, P.C.; Tsai, F.S. Identifying key sources of city air quality: A hybrid MCDM model and improvement strategies. Appl. Sci. 2019, 9, 1414. [Google Scholar] [CrossRef]
- Dang, W.V. Multi-criteria decision-making in the evaluation of environmental quality of OECD countries. Int. J. Ethics Syst. 2019. [Google Scholar] [CrossRef]
- Erdin, C.; Ozkaya, G. Turkey’s 2023 energy strategies and investment opportunities for renewable energy sources: Site selection based on electre. Sustainability 2019, 11, 2136. [Google Scholar] [CrossRef]
- Ishizaka, A.; Nemery, P. Multi-Criteria Decision Analysis: Methods and Software; John Wiley & Sons: Hoboken, NJ, USA, 2013. [Google Scholar]
- Erdin, C.; Ozkaya, G. The Performance Evaluation of the ASEAN Countries and Turkey in the Sustainable Development Index Framework with the TOPSIS Method. Yildiz Soc. Sci. Inst. J. 2017, 1, 150–163. [Google Scholar]
- Yoon, K.; Hwang, C.L. A state of the art survey. In Multiple Attribute Decision Making Methods and Applications; CRC Press: Boca Raton, FL, USA, 1980. [Google Scholar]
- Erdin, C.; Ozkaya, G. Contribution of small and medium enterprises to economic development and quality of life in Turkey. Heliyon 2020, 6, e03215. [Google Scholar] [CrossRef] [PubMed]
- Opricović, S. VIKOR method. In Multicriteria Optimization of Civil Engineering Systems; University of Belgrade, Faculty of Civil Engineering: Belgrade, Serbia, 1998; pp. 142–175. [Google Scholar]
- Yoon, K.; Hwang, C.L. TOPSIS (Technique for Order Preference by Similarity to Ideal Solution)—A Multiple Attribute Decision Making; Springer: Berlin/Heidelberg, Germany, 1980. [Google Scholar]
- Yu, P.-L. A class of solutions for group decision problems. Manag. Sci. 1973, 19, 936–946. [Google Scholar] [CrossRef]
- Zeleny, M. Compromise programming. In Multiple Criteria Decision Making; Cochrane, L.J., Zeleny, M., Eds.; University of South Carolina Press: Columbia, SC, USA, 1973; pp. 262–301. [Google Scholar]
- Canada, G.o. Air Pollution: Drivers and Impacts. 2020. Available online: https://www.canada.ca/en/environment-climate-change/services/environmental-indicators/air-pollution-drivers-impacts.html#shr-pg0 (accessed on 17 August 2020).
- Jason West, B.T. As air pollution increases in some US cities, the Trump administration is weakening clean air regulations. In Proceedings of the Farm Forestry Statistics Seminar, Helsinki and Joensuu, Finland, 8–11 July 1998; (julkaisu myös saksan-, ranskan-ja suomenkielisenä) 2019. Available online: https://theconversation.com/as-air-pollution-increases-in-some-us-cities-the-trump-administration-is-weakening-clean-air-regulations-115975 (accessed on 11 June 2020).
Publisher’s Note: MDPI stays neutral with regard to jurisdictional claims in published maps and institutional affiliations. |
© 2020 by the authors. Licensee MDPI, Basel, Switzerland. This article is an open access article distributed under the terms and conditions of the Creative Commons Attribution (CC BY) license (http://creativecommons.org/licenses/by/4.0/).