Article

Optical Sensing Approach to the Recognition of Different Types of Particulate Matters for Sustainable Indoor Environment Management

1
Building Information Research Center, Korea Institute of Civil Engineering and Building Technology, 283 Goyangdaero, Ilsanseogu, Goyang, Gyeonggi 10223, Korea
2
Living Environment Research Center, Korea Institute of Civil Engineering and Building Technology, 283 Goyangdaero, Ilsanseogu, Goyang, Gyeonggi 10223, Korea
*
Author to whom correspondence should be addressed.
Sustainability 2020, 12(24), 10568; https://doi.org/10.3390/su122410568
Submission received: 19 October 2020 / Revised: 11 December 2020 / Accepted: 16 December 2020 / Published: 17 December 2020
(This article belongs to the Special Issue ZEMCH International Research 2020)

Abstract

:
The indoor environment is a crucial part of the built environment where our daily time is mostly spent. It is governed not only by indoor activities, but also affected by interconnected activities such as door opening, walking and routine tasks throughout the inside and outside of buildings and houses. Pollutant control is one of the major concerns for maintaining a sustainable indoor environment, and finding the source of pollutants is a relatively hard part of that task. Pollutants are emitted from various sources, transformed by sunlight, react with vapor in ozone and are transported into cities and from country to country. Due to these reasons, there has been high demand to monitor the transportation of particulate matters and improve air quality. The monitoring of pollutants and identification of their type and concentration enables us to track and control their generation and consequently discover reliable suitable mitigation measures to control air quality at regulated levels by contaminant source removal. However, the monitoring of pollutants, especially particulate matter generation and its transportation, is still not fully operated in atmospheric air due to its open nature and meteorological factors. Even though indoor air is relatively easier to monitor and control than outdoor air in the aspect of specific volume and contaminant source, meteorological parameters still need to be considered because indoor air is not fully separated from outdoor air flow and contaminants’ transportation. In this study, an optical approach using a spectral sensor was attempted to reveal the feasibility of wavelength and chromaticity values of reflected light from specific particles. From the analysis of reflected light of various particulate matters according to different liquid additives, parameter studies were performed to investigate which experimental conditions can contribute to the enhanced selective sensing of particulate matter. Five different particulate matters such as household dust, soil, talc powder, gypsum powder and yellow pine tree pollen were utilized. White samples were selectively identified by the peak at 720 nm for talc and 433 nm and 690 nm in wavelength for gypsum under chemical additives. Other grey household dust and yellowish soil and pine tree pollen revealed a distinct chromaticity x, y coordinates shift in vector within the maximum range from (0.22, 0.19) to (0.55, 0.48). Applicable approaches to assist current particle matter sensors and improve the selective sensing were suggested.

1. Introduction

It has been continuously necessary to control indoor air quality more precisely and with more detailed information. However, indoor air is quite different from atmospheric air in the aspects of air flow characteristics and type of contaminants [1]. Depending on the type of building and purpose of usage, the contaminant type and its level vary due to different human activities and emission sources. For a residential house, cooking is reported as a primary factor for the emission of gaseous pollutants such as formaldehyde, CO and Total Volatile Organic Compounds (TVOC). Particulate pollutant PM2.5 is also one of the contaminants highly detected in indoor air during cooking [2]. In addition, human activities such as ironing, vacuum cleaning, lighting candles and smoking are also known to increase the level of pollutants, and even walking can increase the PM level by resuspension [3]. Relatively large particulate matters such as soil dust, flower pollen and PM10 are well-known to be transported into the indoors by air flow from the outside and their generation and behavior have been reported quite differently [4].
Even though various technologies to detect both gaseous and particulate contaminants have been developed and widely applied to practical fields, any sensing data to inform us with both the contaminant source and its concentration simultaneously does not exist, and even its accuracy remains low [5]. Most commercial sensors to detect particulate matters are generally used as dust sensors and are mostly based on the light scattering principle. As many particles exist in a specific volume of the sensor when used inside, more light is scattered and reflected to the detector and represented as particle levels. For this reason, it is necessary to introduce sufficient air containing contaminants that can represent a statistically mean concentration per volume into the sensor inside by fan or air compressor for reliable accuracy. The other factor to govern the dust level is the interaction between the light source and particulate matters. In previous research, light sources such as laser diode, infrared and LED photodiode were used to examine how light source can influence the sensing of particulate matters [6,7,8].
Depending on the light source, single point detection, uniformity issue and brightness difference were reported to limit the sensitivity of dust sensors [9]. For more accurate concentration, particle counters utilizing a beta ray absorption method were tested and authorized to report daily data of particulate matters that have an aerodynamic diameter of less than 10 and 2.5 μm in Korea [10]. According to the purpose of measurement, both optical sensing and beta attenuation monitoring (BAM) were adopted to research the area or air pollution forecast, but simple light-scattering-based sensors were mostly utilized in daily life measurement for a single household’s air quality monitoring, including a dust sensor, air conditioner and air purifier. As recognized in the above explanations, the concentration of particulate matter is primary information for sensors in monitoring particulate matter contaminants and is provided relatively sufficiently with various methods. However, other information such as the type of particle, and the chemical composition to inform us of its origin and where it is generated and transported from, is still under laboratory level observation [11].
Nowadays, characterization to determine the origin of contaminants, especially for particulate matters, is a major concern in Korea. This is because daily concentration of particulate matters PM2.5 and PM10 have caused a noticeable increase in the reported number of patients with respiratory disease, and personal protective equipment (PPE) including air pollution masks, filters and air purifiers are selling significantly above production amounts [12]. In several reports, particulate matters are characterized and chemical compositions have reported that PM10 and PM2.5 contain organic compound and heavy metal ions, which may cause health issues [13]. Furthermore, it is necessary to analyze particulate matters at the laboratory level to know the source of particulate matters and their chemical properties that can potentially be harmful to respiratory health. However, chemical analysis is expensive and it takes a long time to reach to the desired results. As a result, there is at least demand to identify the types of contaminants using a simple dust sensor at an economic cost as a prescreening level test.
In this study, two approaches were tested. A small-scale spectral sensor was utilized to find the feasibility of light wavelength in terms of position and intensity to discriminate the type of particulate matter. The other approach was to use a chromameter to reveal the color data of particulate matter in a chromaticity diagram. Five different particles, household dust, soil, pine tree pollen, talc and gypsum powder were chosen and tested to find the feasibility of optical approaches using color and reflected light to distinguish different particulate matters. It is our expectation that the intrinsic color of particles can be a key parameter to identify particulate matters having unique colors. Particulate matters which havea tendency to react easily with water and refractive index liquid can be selectively detected by observing reflected light and characterizing its spectrum. Our study can assist current light-scattering-based sensors to identify the type of particulate matter contaminants and concentration with higher accuracy for reliable indoor environment management.

2. Materials and Methods

Five different particulate matters were collected in Korea and prepared for the characterization as they were. Household dust was collected by a regular vacuum cleaner from a living room in a typical apartment complex in Goyang city. Korean pine tree pollen was collected during spring season by washing a glass plate located under a pine tree bush in Jeongbal mountain, located in Goyang city for one day. Illite powder, a commonly found yellow soil in Korea, was used for the representative soil sample. It was purchased from Yong Gung Illite® Inc., and the average size of illite powder was characterized to be less than 200 µm. Talc powder, a raw material widely used as a construction material and usually suspended in indoor air during the construction process was purchased from a chemical company to have the chemical formula Mg3H2(SiO3)4; H2Mg3O12Si4. Gypsum powder was prepared by grinding gypsum insulation board manufactured by KCC Inc., Korea, which has a 9.5 mm thickness, 900 mm width and 1800 mm length in general grade. A total of 20 samples for five different particulate matters were ground and filtered with Whatman® qualitative paper filter having 20 µm particle retention by flushing with distilled water to exclude the size-induced difference. After drying at room temperature, the collected powders were used for the experiment. All samples were prepared by cutting them into pieces small enough to grind and sieve to make a desired powder size of 20 µm. Those powders were denoted “as prepared” to distinguish between untreated powders and other powders treated by chemical additives.
Filters and liquid additives to modulate the reflected light of particle samples were tested. Cellophane filters ranged from red, orange, yellow, green, blue, pink and violet in a visible light range as shown in Figure 1. Three color filters, dark blue, green and yellow were utilized, having 400–450 nm, 500–550 nm, and 550–600 nm in wavelength, respectively. Two liquid additives, refractive index liquid (n = 1550, Cargille Inc. Cedar Grove, NJ, USA) and distilled water, were tested.
Reflected light was observed in the same 10 cm distance from the sample surface to the detectors, spectral sensor and chromameter. An 80 W–6500 K white LED light bulb was used for the light source to provide sufficient light in the visible light range and avoid a light color effect. In addition to this, a UV light with 365 nm in wavelength was used.
As shown in Figure 2, a schematic (a) and a picture (b) of the experimental apparatus, chromameter (c) and spectral sensor (d) were prepared. A spectral sensor, Apollo™, developed by NanoLambda in Korea, was used to differentiate reflected light into the light spectrum in a small chamber and to examine the applicability to a small-scale sensor. The configuration of the chamber and detailed experimental method was described in our previous study [14]. A chromameter CR-400 by Konica Minolta was used to acquire color data in terms of chromaticity values.

3. Results

As described in the Introduction, the main purpose of this study was to find the feasibility of optical approaches in identifying the specific types of particulate matters among whole particulate mixtures in the air and their influence on other parameters, filters and liquid additives on their selectivity in terms of light intensity, wavelength and chromaticity value. A spectral sensor and chromameter were tested, respectively, under the same conditions by liquid additives. Chromaticity values in a chromaticity diagram are shown in Figure 3, Figure 4 and Figure 5. Details of the conditions and results are denoted in Table 1, Table 2, Table 3, Table 4 and Table 5.

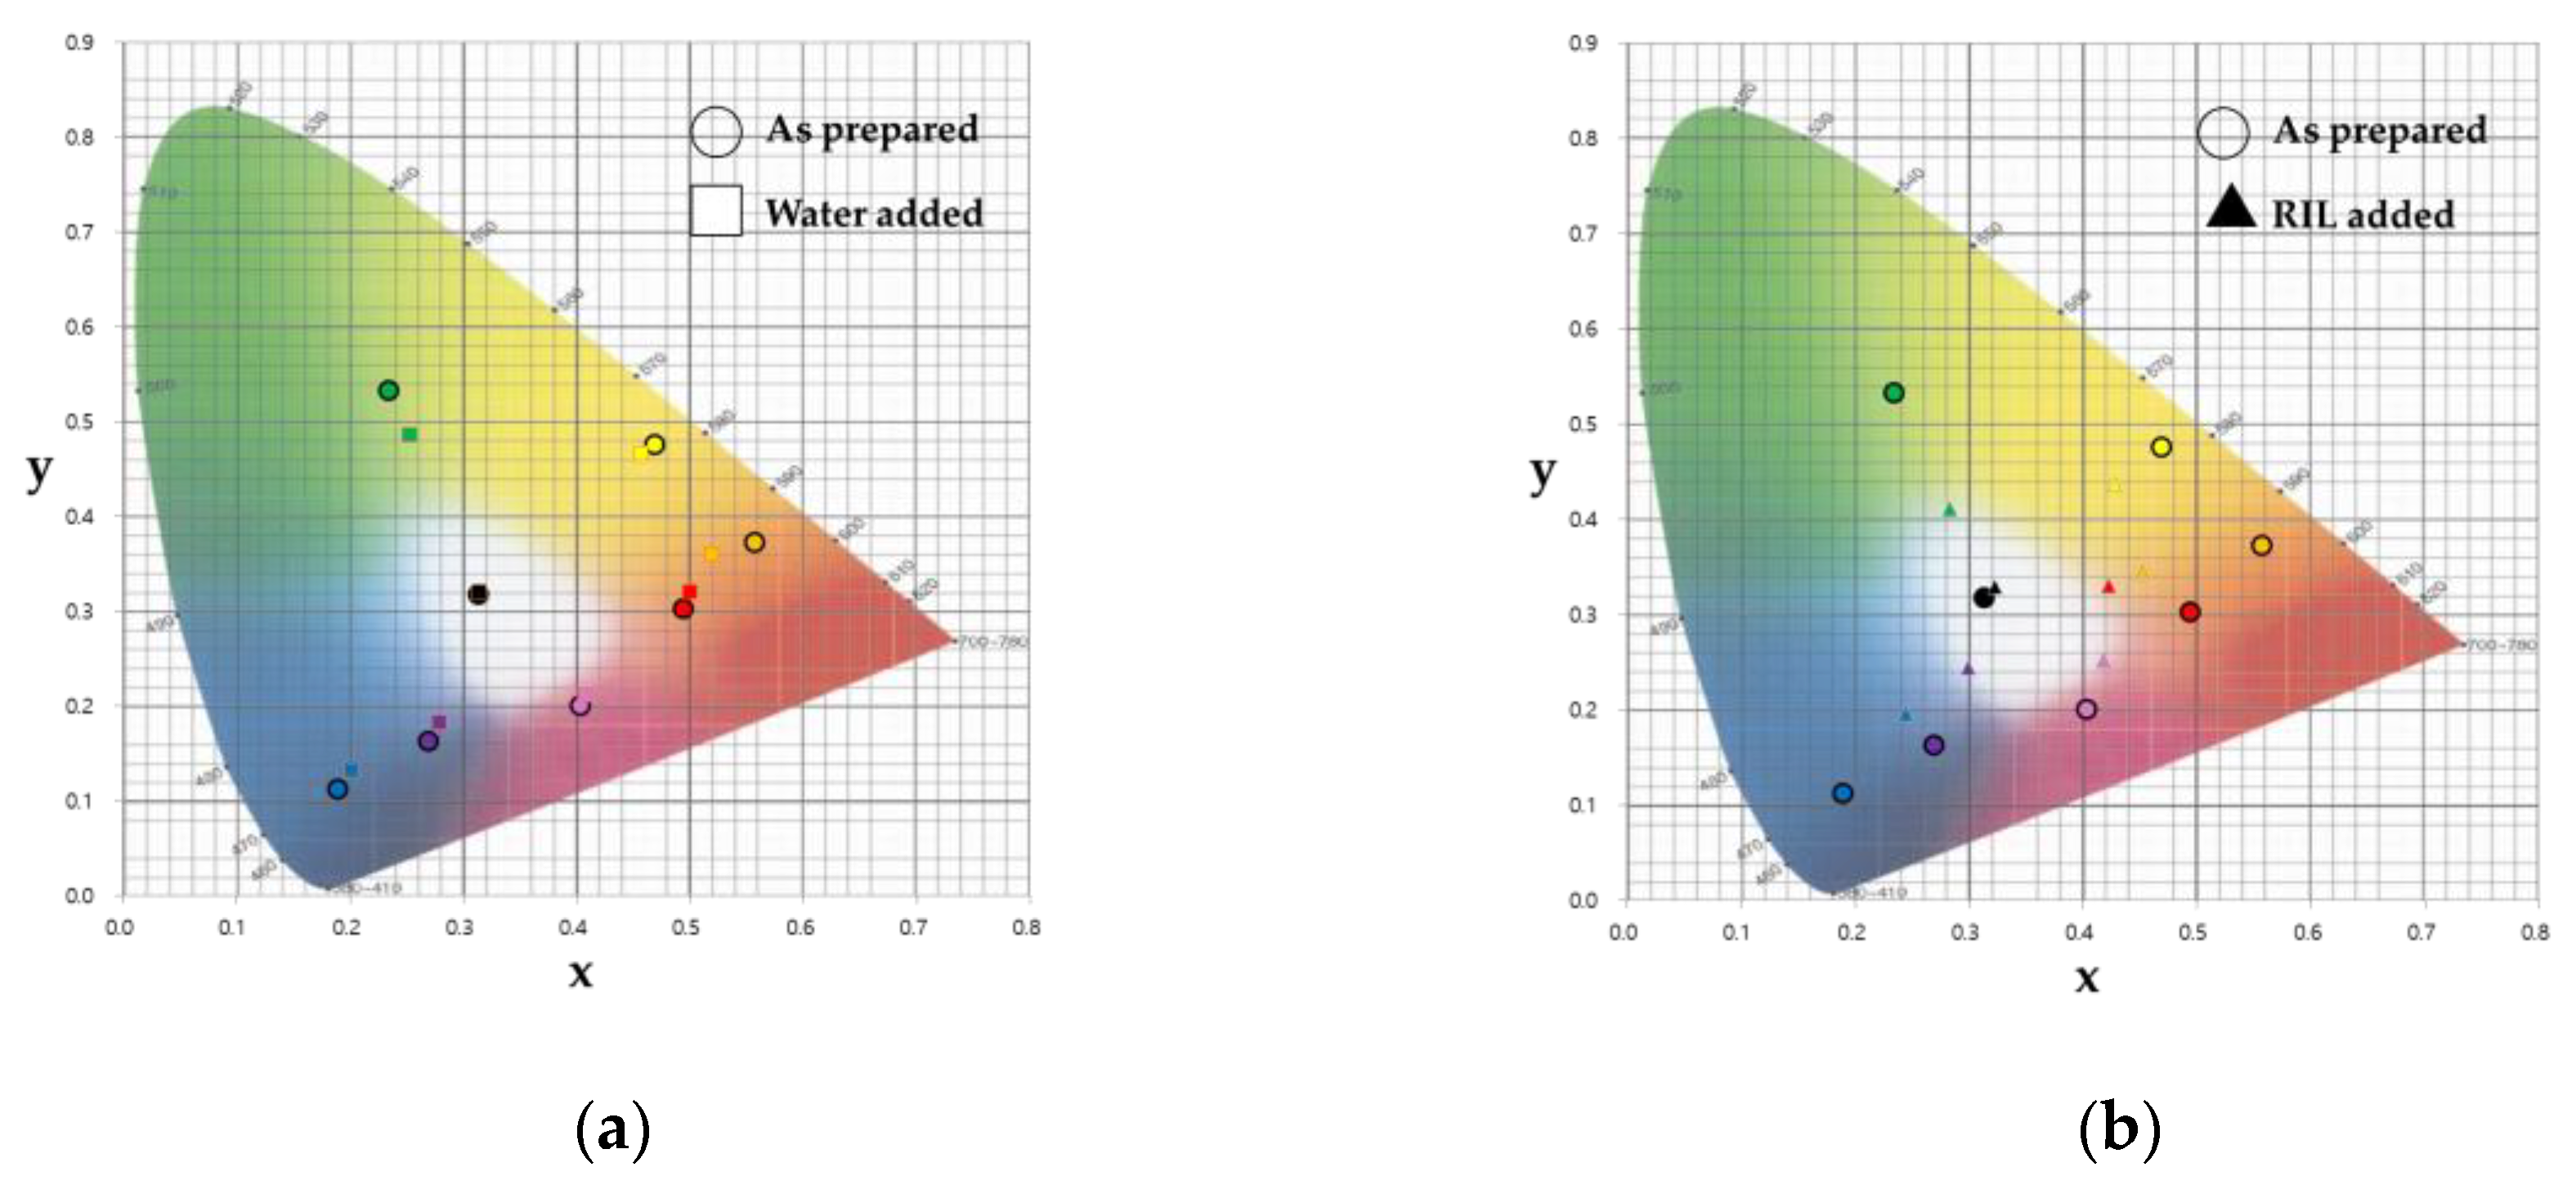
3.1. Color Detection

Chromaticity diagrams of five samples are shown in Figure 3, Figure 4 and Figure 5. As denoted in these Figures, all samples were prepared as dried, water added and refractive index liquid added. Water and refractive index liquid were utilized to investigate the additional effect of additives on the reflected light by also predicting changes to the refractive indices and associated colors. A cellophane filter was used to block a specific range of wavelength depending on its color. Details of the wavelength and color of each cellophane filter were drawn in consecutive color bars as shown in Figure 1. The prepared samples, denoted as circles in the diagram, were located with the coordinates x, y, Y in the diagram using matching color circles according to the color of the cellophane filter.
Here, coordinates; x, y, and Y represent the color space and luminance value, respectively, of the reflected light [15]. Details of the chromaticity values for household dust, soil, talc, gypsum and pine tree pollen are summarized in Table 1, Table 2 and Table 3, which correspond to the chromaticity diagram in Figure 3, Figure 4 and Figure 5. Water-added samples and refractive-index-liquid-added samples were depicted as a square and filled triangle, respectively, as in the above manner. Prior to a detailed explanation, the five samples can be simply divided into two groups, a white group and non-white group (grey and yellowish samples) after the bare-eye observation. Talc and gypsum powders belong to the white group and household dust, soil and pine tree pollen are regarded as part of the non-white group.
All chromaticity values in the tables represent the positions in the diagram. Seven colors of cellophane filters and no filter case were denoted. For household dust, the initial coordinates of x and y were recorded, ranging from (0.3163, 0.3177) to (0.3229, 0.3244) for the prepared sample. Most cases were observed in x and y ranges between (0.25, 0.2) and (0.45, 0.45), close to the center white regions regardless of the color of the filters. Indices in the range represent the boundary limit of the x and y coordinates. Even with the additions of water and refractive index liquid, no significant shift in coordinates value were measured. For soil dust, the initial coordinates of x and y were observed to be slightly close to the yellowish region as (0.3157, 0.3213), and coordinates corresponding to the seven filters were found to spread out to locate at each color region, which range from (0.22, 0.19) to (0.55, 0.48). For additive cases, the movements of the coordinates in the vector scale from the initial point were different depending on water and refractive index liquid and an increased shift was found in the case of the refractive index liquid. This might be attributed to the intrinsic yellowish color of soil dust and deep yellowish color of refractive index liquid.
In Table 2, the white color group, talc and gypsum powders are characterized. The intensity of color, Y values for the as prepared and additive cases under the yellow filter and no filter were found to be highest and similar to the previous soil dust case. This is also due to the intrinsic color of the two powders. White can easily reflect the colors of the yellow filter and refractive index liquid. Starting points (black dots) of white color powders were noticed to similarly position at (0.3127, 0.3191) and (0.3157, 0.3213), which are closer to the center white region than in previous cases. Seven color points were also found to locate at their own color region in the range of (0.18, 0.11) to (0.56, 0.54) for talc, and (0.18, 0.10) to (0.57, 0.53) for gypsum. Interesting results were observed for the additive cases. In the case of water, not much movement in the coordinates in the vector was seen in both cases, but a noticeable amount of shift was found for the refractive-index-added cases. As noted in the Figures of the talc and gypsum powders, the coordinates of the refractive-index-added cases ranged from (0.24, 0.19) and (0.46, 0.44) for talc and (0.20, 0.14) and (0.55, 0.48) for gypsum, respectively. The only exception was for the yellow filter in used condition and this was due to the similar color of the filter and refractive index liquid. Pine tree pollen was also characterized and it has a yellowish natural color. As expected, the initial coordinates were found to be around the yellow region in the diagram as (0.3938, 0.3796). Its intrinsic color is strong yellow. Thus, it appears that the influence of color and additives did not have an impact on the modulating of the coordinates in the diagram. The indices varied in a relatively narrow band from (0.24, 0.22) to (0.52, 0.45) for the as prepared, from (0.24, 0.19) to (0.53, 0.45) for water and (0.25, 0.44) for refractive index liquid.
Based on the coordinate value analysis, a noticeable difference was measured for the white-colored powders such as the talc and gypsum samples. For the white-colored powders, more distinct shifts to each color region were measured than for the yellowish pollen, soil and grey household dust. This may be attributed to the intrinsic color of the powder being close to white, more light reflected to the detector and induced to increased intensity to the spectral sensor. Meanwhile, other non-white, yellowish and grey powders were detected at lower intensity.
In addition, overall chromaticity values for the yellowish powders were observed to shift into the yellow region in the diagram, in an upper left direction from the central white region. Similar experiments were studied by Dang et al. In their report, the chromaticity value of five different colored inorganic pigments of drawing points revealed corresponding measured chromaticity value according to their color [16]. For water- and refractive-index-liquid-added cases, obvious differences in chromaticity values were observed. In Figure 3a,b, household dust revealed to shift more in the yellow and red regions, which correspond to a long wavelength range in the light spectrum. However, soil samples as shown in Figure 3c,d were detected to have more movement in the red and green regions. In the case of the pollen sample, no significant change in chromaticity values were observed under additive conditions. For the talc and gypsum powders, an obvious shift for the talc was observed only for the refractive-index-liquid case and chromaticity values were centered in the white region more than any other samples as shown in Figure 4a,b. This is well described in the previous study and in accordance with results [17]. This means that more white light is reflected to the chromameter detector. For the comparison with talc, the same experiments were executed for the gypsum powder as shown in Figure 4c,d. Under the chromameter measurement, no noticeable difference was observed. This means that similar intrinsic colors and particle shapes can be hardly differentiated under the chromameter study.

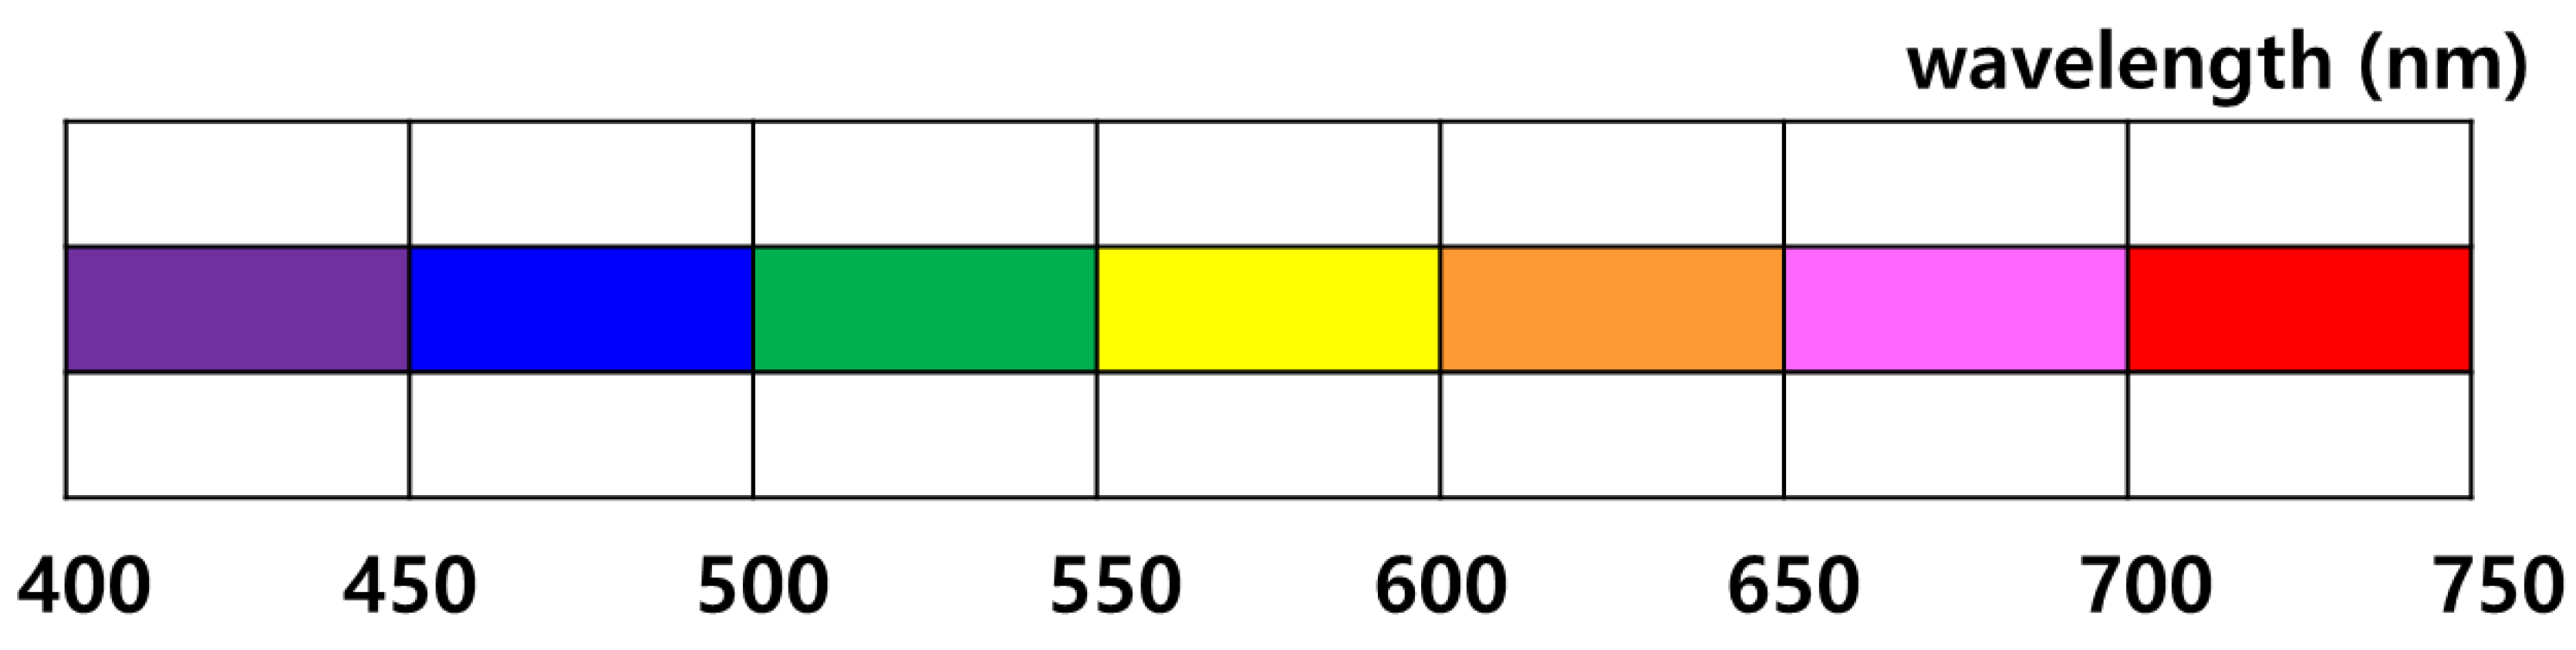
3.2. Light Spectrum Detection

A spectral sensor was used to characterize the light spectrum of samples under experimental conditions. Figure 6a,b shows the spectrum of reflected light for household dust and talc powder as a function of wavelength. The same measurement was performed under different conditions. Details of the measurements are summarized in Table 4 and Table 5 according to peak position and peak intensity ratio. As shown in Table 4 and Table 5, five samples revealed obvious difference in terms of peak position and peak intensity after the additive treatment and cellophane filter usage.
In Table 5, peak intensity at each wavelength was calculated in a ratio. The peak intensity values at low wavelength for samples are regarded to “1” as a base, then, peak intensities at other higher wavelengths were divided by base peak intensity. After pink filter usage, the overall light intensity decreased and was calculated with the same method for three household dust, talc and gypsum samples. Therefore, a higher ratio value means a relatively strong peak and vice versa. Two representative samples, household dust and talc powder, were graphed to scrutinize the light spectrum changes by additives and filter and compared by peak position in wavelength and peak intensity as well. In the case of household dust as shown in Figure 6, two peaks at 420 and 678 nm in wavelength were observed. Under the pink filter, the peak at 678 nm was observed to be removed and a peak shift from 420 to 440 nm was also observed. This is due to the light filtering at a long wavelength range by the pink cellophane. Even when water and refractive index liquid are added, no significant shift was observed. These results correspond well with the measured chromaticity values under additives. Chromaticity values are previously discussed in Figure 3,b; overall values are centered to the white region with relatively more shifts for the blue, red, and yellow regions observed after refractive index liquid was added. Meanwhile, the talc powder revealed slightly different results than that of the household dust. The light spectrum for as prepared talc powder shows three peaks at 420, 677, and 720 nm, respectively. Two peaks at 420 and 677 nm showed a relatively low ratio value of 6.32, but no noticeable changes were observed for both additives, which show ratio values of 4.51 and 6.21 in Table 5. Considering the combined conditions of the pink filter and water addition, a peak shift from 420 to 430 nm and an additional peak was observed at 490 nm. Other peaks at a long wavelength range were filtered the same as previously. For comparison, similar gypsum power was also characterized under pink filter and additives conditions. The peak at a short wavelength region shifted from 420 to 453 nm, but this was a big difference from the additional peak observed for the talc case at approximately 490 nm, which was not detected. Instead, an additional peak at approximately 820 nm was detected for the water-added gypsum sample. These results appear to be correlated with the absolute amount of shift in the chromaticity values which are larger for gypsum than for the talc powder.

4. Discussion

From the analysis of color and reflected light of five different particulate matters according to different liquid additives, chromaticity coordinate values in the diagram were effective by measuring the shift amount in the vector under the refractive-index-liquid-added case to identify the non-white color group particulate matters including yellowish pine tree pollen, soil dust and grey household dust from the white color group particulate matters. Soil dust under refractive index liquid and cellophane filters revealed the largest movement in coordinates. Talc and gypsum powder belonging to the intrinsic white color group were identified by comparing the peak at around the reflected light spectrum. For the light spectrum cases, peaks of approximately 420 nm can be regarded as the guideline peak to determine the influence of the filter and additives according to the type of sample. Relative peak intensities of the other peaks were compared with a ratio of the peak intensity at 420 nm. The peak at approximately 720 nm in wavelength was solely observed for talc powder. Water and refractive index liquid could selectively shift the peak at approximately 420 nm and 679 nm to 433 and 690 nm, respectively, only for gypsum powder. More distinct dependency on filter color was observed for gypsum powder rather than household dust, pollen, soil and even similar talc powder. This was in good agreement with the method called the “browning index” used in other color and light characterization methods using a spectrophotometer [18].
In this study, we were concerned with indoor particulate matters, which possibly can be generated by daily activities such as cooking, vacuum cleaning and installed construction materials, or transported from outdoors by daily activity. It was our intention to find the feasibility of an optical approach to assist in the identification of the source of particulate matters. In cases where a large portion of particulate matters are observed to inflow from outdoor sources, people can be air showered at the front door and contaminants are pre-removed before transporting these into the indoors. In other cases, more indoor sources are found to contribute to indoor air contamination, and mechanical ventilation can be operated with a priority to outflow the indoor air to maintain the air quality level. Our study can at least contribute to this decision making as the first stage at a pre-screening level, but results showed that it has limitations in distinguishing the similar intrinsic color of powders. Light intensity was also vulnerable to the light bulb’s source (>6500 k) and power. In addition, other particulate matters such as organic compounds and black carbon, generated from combustion, should be studied to assist in supporting these methods. In future studies, other chemical additives should be tested to reveal different colors after their reaction with white particulate matters. Another approach can be attempted to combine the presorting method by using a camera according to its color and shape to improve the identification rate by a simple method.

5. Conclusions

Color- and light-spectrum-assisted optical sensing of particulate matters was operated on a laboratory scale and under controlled experimental conditions. The chromaticity values and reflected light spectrum in terms of wavelength and intensity revealed the difference between samples according to color and water or refractive-index-liquid additives. Noticeable results can be summarized as below.
Five different particulate matters such as household dust, soil dust, pine tree pollen, talc and gypsum powders were optically characterized under as prepared, water-added and refractive-index-liquid-added cases combined with seven colors of light filter.
Depending on the intrinsic color of the as prepared sample, the non-white color group particulate matters including grey household dust, yellowish soil dust and pine tree pollen were selectively detected by observing the amount of chromaticity value shift in the vector. The white color group samples such as the talc and gypsum powders were distinguished by observing the unique peak positions in wavelength using a spectral sensor.
The intrinsic color of particulate matters can be the distinct point for identifying the types of non-white group samples such as household dust, soil dust and pine tree pollen under chromameter characterization rather than for the white color samples. Under the combined conditions of a cellophane filter and refractive index liquid, yellowish soil dust and pine tree pollen showed relatively large shifts in the chromaticity diagram in the vector. However, white color samples including talc and gypsum powers did not reveal a noticeable change. This was attributed to the intrinsic white color of powders under the xenon lamp.
In light spectrum measurements, the white color group samples showed more meaningful results than previous color measurements. All samples had consistent peaks at approximately 420 nm and 680 nm in wavelength. At other positions, a unique peak was observed depending on the type of particulate matter. Talc powder was the only sample that did not show any change in spectrum regardless of the additives and under no light filter conditions. An additional peak was observed at approximately 720 nm with water.
In the case of the pink filter, the gypsum sample revealed an obviously unique result in that a distinct peak at approximately 820 nm was detected for the as prepared case and peak position shifts from 439 nm to 453 nm were observed. When both water and the pink filter were used, the peak at approximately 490 nm was the index peak for talc powder. It can be concluded that the light spectrum study was more effective to identify white color powders and distinguish them from other non-white group powders in terms of distinct peak position and peak shift.
Two approaches using a chromameter and spectral sensor were attempted and meaningful results were observed. Simple color and reflectance change by water or refractive index liquid were able to draw the noticeable differences in observation. However, these still have limitations in intuitive observation, such as the way of the camera. Post analysis was inevitable to perform chromaticity value sorting and calculation.
It was our observation that there is a noticeable relationship between the intrinsic color of the particulate matter and the appropriate approach, whether it is chromaticity value, shift or the peak of the reflectance spectrum. In addition, water or refractive index liquid were found to be effective to enhance the relative deviation in color or reflected light depending on the type of particulate matter. An appropriate combination of chromameter and spectral sensor can be an alternative approach to detect particulate matters with higher selectivity. In future studies, various colors of particulate matters are required to be characterized to determine the relationship between the intrinsic color of particles and optical identification. It is also our hope that particulate matters less than 10 and 2.5 μm in aerodynamic diameter should be separated to investigate their size dependence under the above approaches.

Author Contributions

Conceptualization, methodology, validation, formal analysis, investigation, writing—original draft preparation, H.A.; data acquisition, experiments, data processing, H.-J.C.; writing—review and editing, G.-S.C.; resources, project administration, J.S.K. All authors have read and agreed to the published version of the manuscript.

Funding

This research was supported by a grant (20AUDP-B151639-02) from KAIA Urban Construction Research Program funded by Ministry of Land, Infrastructure and Transport of Korean government.

Acknowledgments

Authors would like to thank KICT supporting division members for their sincere assistance regarding this research related experiments, data acquisition, and sample preparation from the field and laboratories.

Conflicts of Interest

To the best of our knowledge, authors have no conflict of interest, finance or otherwise.

References

  1. Biliaiev, M.M.; Kharytonov, M.M. Numerical Simulation of Indoor Air Pollution and Atmosphere Pollution for Regions Having Complex Topography. In Air Pollution Modeling and Its Application XXI; Springer: Berlin/Heidelberg, Germany, 2011; pp. 87–91. [Google Scholar]
  2. Chafe, Z.; Brauer, M.; Klimont, Z.; Dingenen, R.V.; Mehta, S.; Rao, S.; Riahi, K.; Dentener, F.; Smith, K.R. Household cooking with solid fuels contributes to ambient PM2.5 air pollution and the burden of disease. Environ. Health Perspect. 2014, 12, 1314–1320. [Google Scholar] [CrossRef] [Green Version]
  3. Afshari, A.; Matson, U.; Ekberg, L.E. Characterization of indoor sources of fine and ultrafine particles: A study conducted in a full-scale chamber. Indoor Air 2005, 15, 141–150. [Google Scholar] [CrossRef]
  4. Colome, S.; Kado, N.; Jaques, P.; Kleinman, M. Indoor-outdoor air pollution relations: Particulate matter less than 10 μm in aerodynamic diameter (PM10) in homes of asthmatics. Atmos. Environ. Part A Gen. Top. 1992, 26, 2173–2178. [Google Scholar] [CrossRef]
  5. Tasić, V.; Jovašević-Stojanović, M.; Vardoulakis, S.; Milošević, N.; Kovačević, R.; Petrović, J. Comparative assessment of a real-time particle monitor against the reference gravimetric method for PM10 and PM2.5 in indoor air. Atmos. Environ. 2012, 54, 358–364. [Google Scholar] [CrossRef]
  6. Kelly, K.E.; Whitaker, J.; Petty, A.; Widmer, C.; Dybwad, A.; Sleeth, D.; Martin, R.; Butterfield, A. Ambient and laboratory evaluation of a low-cost particulate matter sensor. Environ. Pollut. 2017, 211, 491–500. [Google Scholar] [CrossRef]
  7. Vázquez, L.; Zorzano, M.; Jimenez, S. Spectral information retrieval from integrated broadband photodiode martian ultraviolet measurements. Opt. Lett. 2007, 32, 2596–2598. [Google Scholar] [CrossRef] [Green Version]
  8. Li, H.; Sang, X. LED array light source illuminance distribution and photoelectric detection performance analysis in dust concentration testing system. Sens. Actuators A Phys. 2018, 271, 111–117. [Google Scholar] [CrossRef]
  9. Vaca-Oyola, L.S.; Marín, E.; Rojas-Trigos, J.B.; Cifuentes, A.; Cabrera, H.; Alvarado, S.; Cedeño, E.; Calderón, A.; Delgado-Vasallo, O.A. Liquids refractive index spectrometer. Sens. Actuators B Chem. 2016, 229, 249–256. [Google Scholar] [CrossRef]
  10. Shin, S.; Jung, C.; Kim, Y. Analysis of the measurement difference for the PM10 concentrations between beta-ray absorption and gravimetric methods at gosan. Aerosol Air Qual. Res. 2011, 11, 846–853. [Google Scholar] [CrossRef] [Green Version]
  11. Sówka, I.; Chlebowska-Sty’s, A.; Pachurka, Ł.; Rogula-Kozłowska, W.; Mathews, B. Analysis of particulate matter concentration variability and origin in selected urban areas in Poland. Sustainability 2019, 11, 5735. [Google Scholar] [CrossRef] [Green Version]
  12. Jo, E.J.; Lee, W.S.; Jo, H.Y.; Kim, C.H.; Eom, J.S.; Mok, J.H.; Kim, M.H.; Lee, K.; Kim, K.U.; Lee, M.K.; et al. Effects of particulate matter on respiratory disease and the impact of meteorological factors in Busan, Korea. Respir. Med. 2017, 124, 79–87. [Google Scholar] [CrossRef] [Green Version]
  13. Zhang, K.; Shang, X.; Herrmann, H.; Meng, F.; Mo, Z.; Chen, J.; Lv, W. Approaches for identifying PM2.5 source types and source areas at a remote background site of South China in spring. Sci. Total Environ. 2019, 691, 1320–1327. [Google Scholar] [CrossRef]
  14. Ahn, H.; Jung, B.K.; Joo, J.C.; Park, J.R. Spectral sensing of asbestos according to concentration in various asbestos containing materials. Appl. Mech. Mater. 2014, 627, 7–11. [Google Scholar] [CrossRef]
  15. Mortimer, R.J.; Varley, T.S. Quantification of colour stimuli through the calculation of CIE chromaticity coordinates and luminance data for application to in situ colorimetry studies of electrochromic materials. Displays 2011, 32, 35–44. [Google Scholar] [CrossRef] [Green Version]
  16. Dang, R.Y.; Liu, Y.; Liu, G. Chromaticity changes of inorganic pigments in Chinese traditional paintings due to the illumination of frequently-used light sources in museum. Color Res. Appl. 2018, 43, 596–605. [Google Scholar] [CrossRef]
  17. Steuber, F.; Staudigel, J.; Stössel, M.; Simmerer, J.; Winnacker, A.; Spreitzer, H.; Weissörtel, F.; Salbeck, J. White light emission from organic LEDs utilizing spiro compounds with high-temperature stability. Adv. Mater. 2000, 12, 130–133. [Google Scholar] [CrossRef]
  18. Ferrer, E.; Alegría, A.; Farré, R.; Clemente, G.; Calvo, C. Fluorescence, browning index and color in infant formulas during storage. J. Agric. Food Chem. 2005, 53, 4911–4917. [Google Scholar] [CrossRef]
Figure 1. Color chart of seven cellophane filters in wavelength ranging in visible light from 400 nm to 750 nm. All colors represent the prepared colors of the cellophane filters in a specific wavelength range.
Sustainability 12 10568 g001
Figure 2. Schematics and pictures of experimental apparatus. (a) A schematic of chamber, (b) Black-coated closed chamber, (c) Chromameter, and (d) Spectral sensor (20 mm width and 60 mm length).
Sustainability 12 10568 g002
Figure 3. Chromaticity diagram of household dust, and soil dust. All dots are chromaticity values (Y, x, y) and only x, y coordinates are denoted. Each figure is listed as: (a) as prepared (○) and water added (□) household dust; (b) as prepared (○) and refractive index liquid (RIL) added (▲) household dust; (c) as prepared (○) and water added (□) soil dust; (d) as prepared (○) and RIL added (▲) soil dust.
Sustainability 12 10568 g003
Figure 4. Chromaticity diagrams of samples under pink cellophane filter; (a) as prepared (○) and water added (□) talc powder; (b) as prepared (○) and RIL added (▲) talc powder; (c) as prepared (○) and water added (□) gypsum powder; (d) as prepared (○) and RIL added (▲) gypsum powder.
Sustainability 12 10568 g004aSustainability 12 10568 g004b
Figure 5. Chromaticity diagram of pine tree pollen; (a) as prepared (○) and water added (□) pine tree pollen; (b) as prepared (○) and RIL added (▲) pine tree pollen.
Sustainability 12 10568 g005
Figure 6. (a) Spectrum of reflected light of household dust according to the sample as prepared (black), pink filter(red), water + pink filter (blue), and RIL + pink filter (green); (b) Spectrum of reflected light of talc powder according to sample status as: as prepared (black), water added (red), RIL added (blue), pink filter (green), water + pink filter (violet), and RIL + pink filter (brown).
Sustainability 12 10568 g006
Table 1. Chromaticity values of household dust and soil powder samples measured under cellophane filter conditions.
Chromaticity Values Chromaticity Values
SampleCellophaneYxySampleCellophaneYxy
Household DustAs prepared-13.400.32290.3244Soil PowderAs prepared-49.150.35760.3581
Red4.870.42160.3307Red7.630.49140.3031
Orange8.010.46250.3576Orange18.210.54720.3697
Yellow13.470.42300.4305Yellow34.440.46870.4546
Green5.080.29230.3853Green8.840.26170.4733
Blue3.160.25160.2058Blue4.710.22270.1778
Pink9.910.40980.2624Pink16.940.44960.2458
Violet4.400.29700.2686Violet3.460.30270.1933
Water Added-5.180.31900.3208Water Added-6.250.38240.3670
Red4.430.38690.3357Red4.560.39700.3341
Orange6.160.41970.3508Orange6.670.43320.3524
Yellow9.020.39550.4066Yellow9.910.41030.4069
Green4.410.30250.3586Green4.170.30020.3711
Blue3.110.26920.2320Blue3.090.27320.2384
Pink8.520.40810.2856Pink8.090.43490.2858
Violet4.350.30080.2851Violet4.320.30540.2890
Refractive Index Liquid Added-3.480.31630.3177Refractive Index Liquid Added-22.230.38180.3749
Red4.370.37680.3369Red5.570.46470.3254
Orange5.870.38590.3305Orange11.020.50440.3627
Yellow8.170.37560.3864Yellow19.050.44840.4310
Green3.920.30210.3635Green5.670.28140.4245
Blue4.290.28000.2699Blue3.240.24750.2012
Pink7.380.41700.2834Pink12.040.45010.2742
Violet3.390.30800.2797Violet3.340.31450.2454
Table 2. Chromaticity values of talc powder and gypsum powder samples measured under cellophane filter conditions.
Chromaticity Values Chromaticity Values
SampleCellophaneYxySampleCellophaneYxy
Talc PowderAs prepared-74.79 0.3127 0.3191 Gypsum PowderAs prepared-79.97 0.3157 0.3213
Red7.53 0.4932 0.3040 Red8.52 0.5498 0.3143
Orange22.17 0.5568 0.3732 Orange24.57 0.5630 0.3738
Yellow50.31 0.4682 0.4770 Yellow53.23 0.4719 0.4763
Green12.40 0.2337 0.5337 Green12.90 0.2382 0.5213
Blue3.84 0.1888 0.1134 Blue3.99 0.1816 0.1021
Pink20.73 0.4025 0.2020 Pink20.89 0.4078 0.1989
Violet4.57 0.2687 0.1634 Violet3.74 0.2681 0.1400
Water Added-47.390.31360.3205Water Added-19.090.30650.3134
Red6.690.49990.3211Red5.070.43320.3300
Orange15.500.51890.3610Orange9.480.46260.3495
Yellow32.180.45650.4669Yellow16.810.42240.4363
Green8.730.25290.4859Green6.000.28180.4111
Blue3.610.20120.1323Blue4.440.24310.2094
Pink14.180.40690.2127Pink10.710.40110.2453
Violet3.570.27830.1835Violet4.350.29060.2543
Refractive Index Liquid Added-15.300.32250.3297Refractive Index Liquid Added-56.700.31590.3217
Red4.910.42210.3310Red7.340.52390.3181
Orange8.700.45250.3457Orange18.510.54500.3724
Yellow14.580.42760.4370Yellow37.610.46290.4703
Green5.230.28280.4115Green9.900.24570.5043
Blue3.210.24430.1962Blue4.910.20430.1460
Pink7.380.41700.2834Pink17.270.40640.2135
Violet3.390.30800.2797Violet3.540.27570.1664
Table 3. Chromaticity values of pine tree pollen measured samples under cellophane filter conditions.
Chromaticity Values Chromaticity Values
SampleCellophaneYxySampleCellophaneYxy
Pine tree PollenAs prepared-32.770.39380.3796Pine tree PollenWater Added-28.760.39260.3846
Red6.790.47140.3017Red6.280.48870.3205
Orange14.020.5200 0.3524 Orange12.880.52470.3614
Yellow24.740.47450.4402Yellow23.080.46260.4336
Green6.840.27640.433Green6.300.27460.4422
Blue4.520.24790.2204Blue3.250.24320.1983
Pink13.510.48230.2669Pink13.540.47220.2769
Violet3.400.32860.2329Violet4.420.31740.2579
Refractive Index Liquid Added-22.620.38920.3804Refractive Index Liquid AddedGreen5.880.28440.4117
Red6.060.43740.3039Blue4.390.25890.2374
Orange11.170.51060.3595Pink11.280.47080.2735
Yellow19.140.46010.4351Violet3.350.32400.2506
Table 4. Peak positions of detected reflected light of samples as a function of wavelength by spectral sensor under experimental conditions.
Sample ConditionsAs PreparedWater Refractive Index Liquid
FilterMeasurementMaterials
No filterPeak IntensityLowHighOtherLowHighOtherLowHighOther
Peak Positions (nm)Pine tree pollen421681601421681591421676721
Soil421681597421677721421681-
Household Dust420678-420677720420677-
Talc420677720420680720420677720
Gypsum420679-433691-433690-
Pink filterPeak IntensityLowHighOtherLowHighOtherLowHighOther
Peak Positions (nm)Household Dust440--440--440--
Talc430--430490-430--
Gypsum439820-453--453--
Table 5. Peak intensity ratio of detected reflected light of samples as a function of wavelength by spectral sensor under experimental conditions.
Sample ConditionsAs PreparedWater Refractive Index Liquid
FilterMeasurementMaterials
No filterPeak IntensityLowHighOtherLowHighOtherLowHighOther
Peak Intensity RatioPine tree pollen110.460.9818.750.1415.860.81
Soil18.510.1414.610.4118.12-
Household Dust19.31-16.310.4419.56-
Talc16.320.4514.511.4116.210.68
Gypsum19.63-19.65-19.71-
Pink filterPeak in IntensityLowHighOtherLowHighOtherLowHighOther
Peak Intensity RatioHousehold Dust0.48--0.30--0.39--
Talc0.21--0.080.06-0.21--
Gypsum0.360.13-0.40--0.44--
Publisher’s Note: MDPI stays neutral with regard to jurisdictional claims in published maps and institutional affiliations.

