1. Introduction
Urban flooding is a major problem in many cities around the world. It is caused by several factors such as rainfall pattern modifications due to: (i) Aggressive and unplanned urbanization [
1,
2]; (ii) urban planning, which considers more physical rather than human resilience [
3]; (iii) outdated sewer capacity; or (iv) higher frequent extreme events related to climate change [
4]. Coastal cities in Latin America are growing rapidly as informal or semi-formal settlements occupy usually low-lying areas, thus degrading coastal wetlands. In consequence, communities are being impacted from recurrent flooding [
5].
Local governments are usually responsible for urban land use and planning. However, limited institutional capacities and spare data and information about hydro climatic risks make challenging to face climate hazards [
6,
7,
8]. Municipal governments need more decision tools to cope with urban flooding and ultimately solve inundation problems by maximizing efficiency along the stormwater system, and minimizing flooding damages [
4]. A well-calibrated flood model is, undoubtedly, an important tool for decision-making process. However, several locations, mainly in developing countries, do not have sufficient flooding data to calibrate models in the usual way (water depths or flow velocities at gauging stations). Alternate historical records (ancient paints, maps or on-site photos) could be complementary for the calibration process of several kind processes, such as morphological changes [
9], hurricane inundations [
10] and urban flooding [
11].
The aforementioned situation takes place in Duran, one of the top ten in population in Ecuador, where municipal authorities have an overwhelming challenge to tackle inundations with limited technical capacities, financial constraints and absence of proper policies enforcing continuous flooding monitoring. In order to enhance the level of information and disaster risk management, the Municipality of Duran and an interdisciplinary group of researchers from the Escuela Superior Politecnica del Litoral (ESPOL) developed a strategic alliance within the project entitled “Climate Resilience for cities, Strategies to reduce hydroclimate risks at Duran city (RESCLIMA)”, which analyzed multiple hazards such as flooding, urban heat islands and landslides. In this article we present the hydrodynamic analysis of a water storm system in Duran.
To carry out the present study, topographic and hydrological data and information were gathered leading to a hydrodynamic simulation. Nevertheless, limited data was an initial barrier as other researchers found on a previous project [
5]. This research presents a hydrodynamic evaluation using a Stormwater Management Model (SWMM) to identify zones that flood after a 2-year precipitation event at Duran city. Such initiative contributes to understand the underlying factors of stormwater system flooding at Duran, with poor flooding data, by using on-site photos, and local stakeholders’ information to calibrate the simulation. The outcomes of this model may provide crucial insight that could be included in urban planning, for the upcoming years.
2. Materials and Methods
2.1. Study Site
The selected study area is Duran, a fluvial city in Ecuador with around 230,000 inhabitants [
12], living in 103 km
2 of urban area. It is located on the eastern margin of the Guayas Estuary receiving tide influence of the ocean 60 Km out of the estuary mouth [
13,
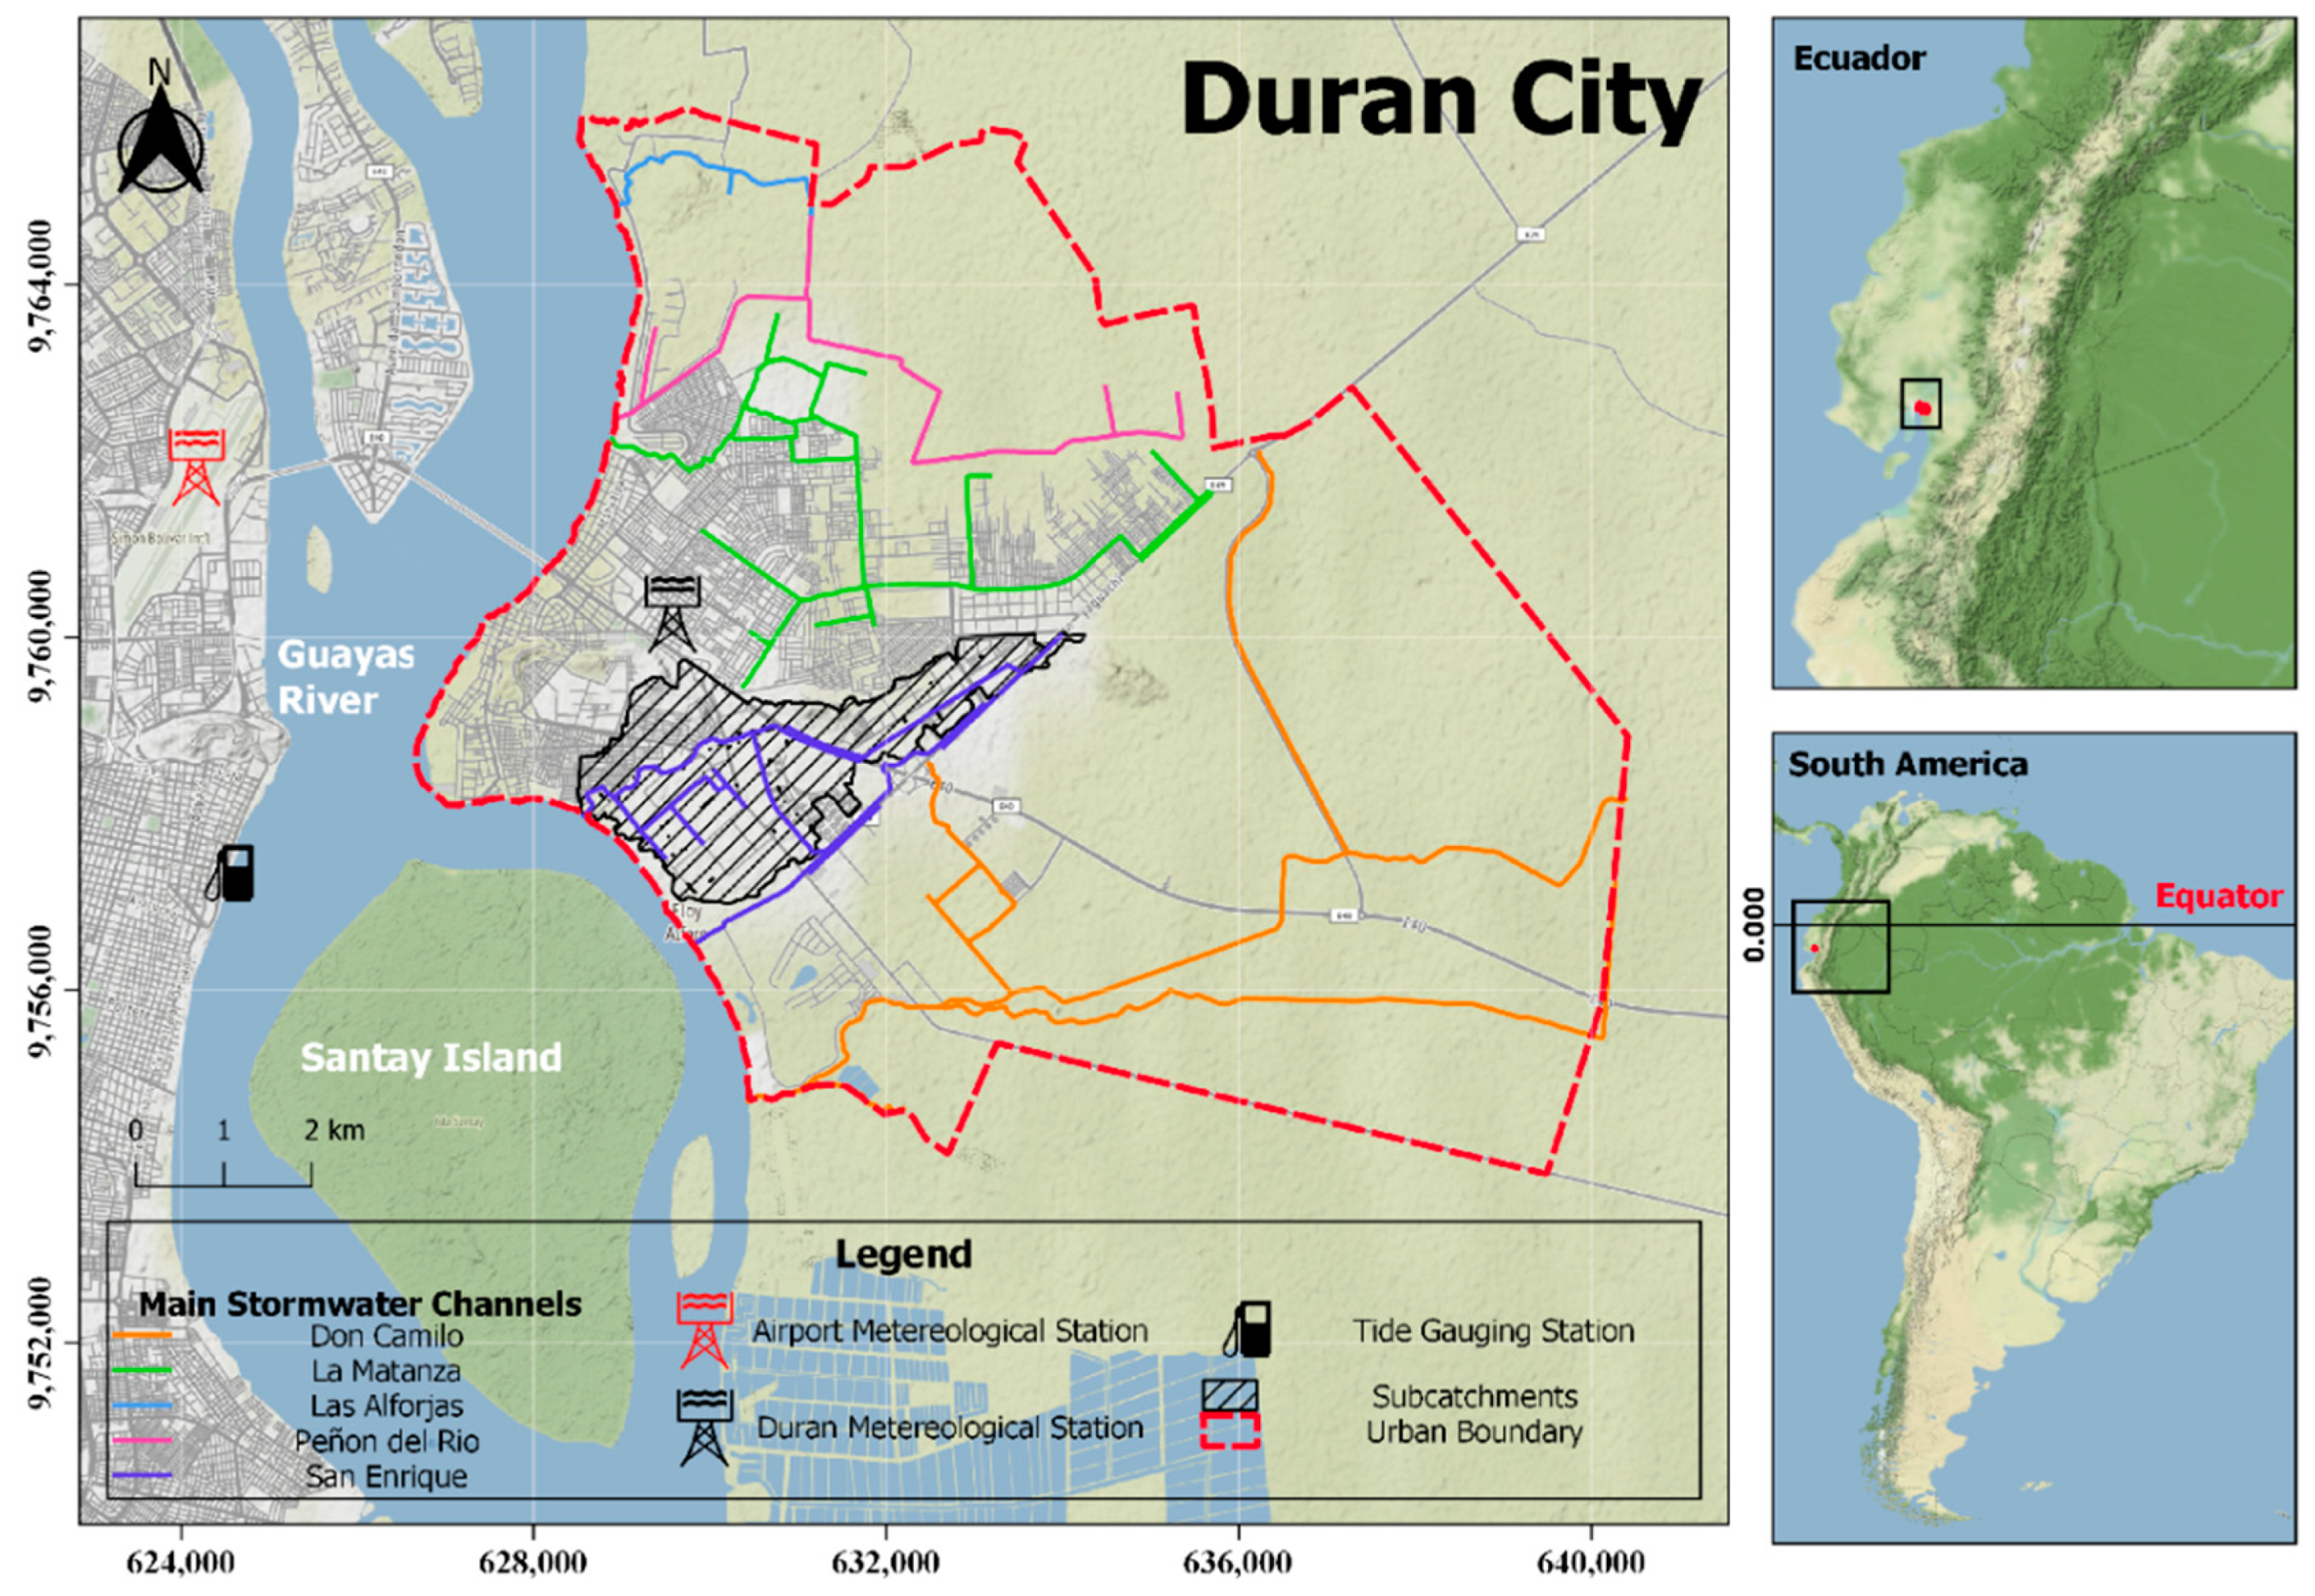
14], as seen in
Figure 1. The city lies mostly located on a floodplain at 4 m above sea level (m.a.s.l.), where inundation problems occur on a yearly basis. Original land use was swamp areas and mangroves. It is located at the east side of the Guayas river directly in front of Guayaquil, main port of the country. Durán is considered one of the most flood-prone cities of Ecuador due to its geographic position and unplanned urban growth. In addition, it is crossed by natural and artificial channels serving as the main stormwater network. In that regard, the most relevant are: the
Estero La Matanza, Estero
San Enrique, and
Don Camilo. The present study is focused on the
San Enrique. WGS84 is the spatial reference used in this article with UTM as coordinate system for Zone 17 M (South).
The current drainage system consists of a combination of pipes and channels which finally discharges onto the Guayas river. Noteworthy is that approximately 45% of the urban area are covered by informal settlements, lacking of stormwater system [
15].
The
San Enrique circuit, involves other minor open channels such as
El Recreo,
Panorama and some industrial channels that are integrated to the
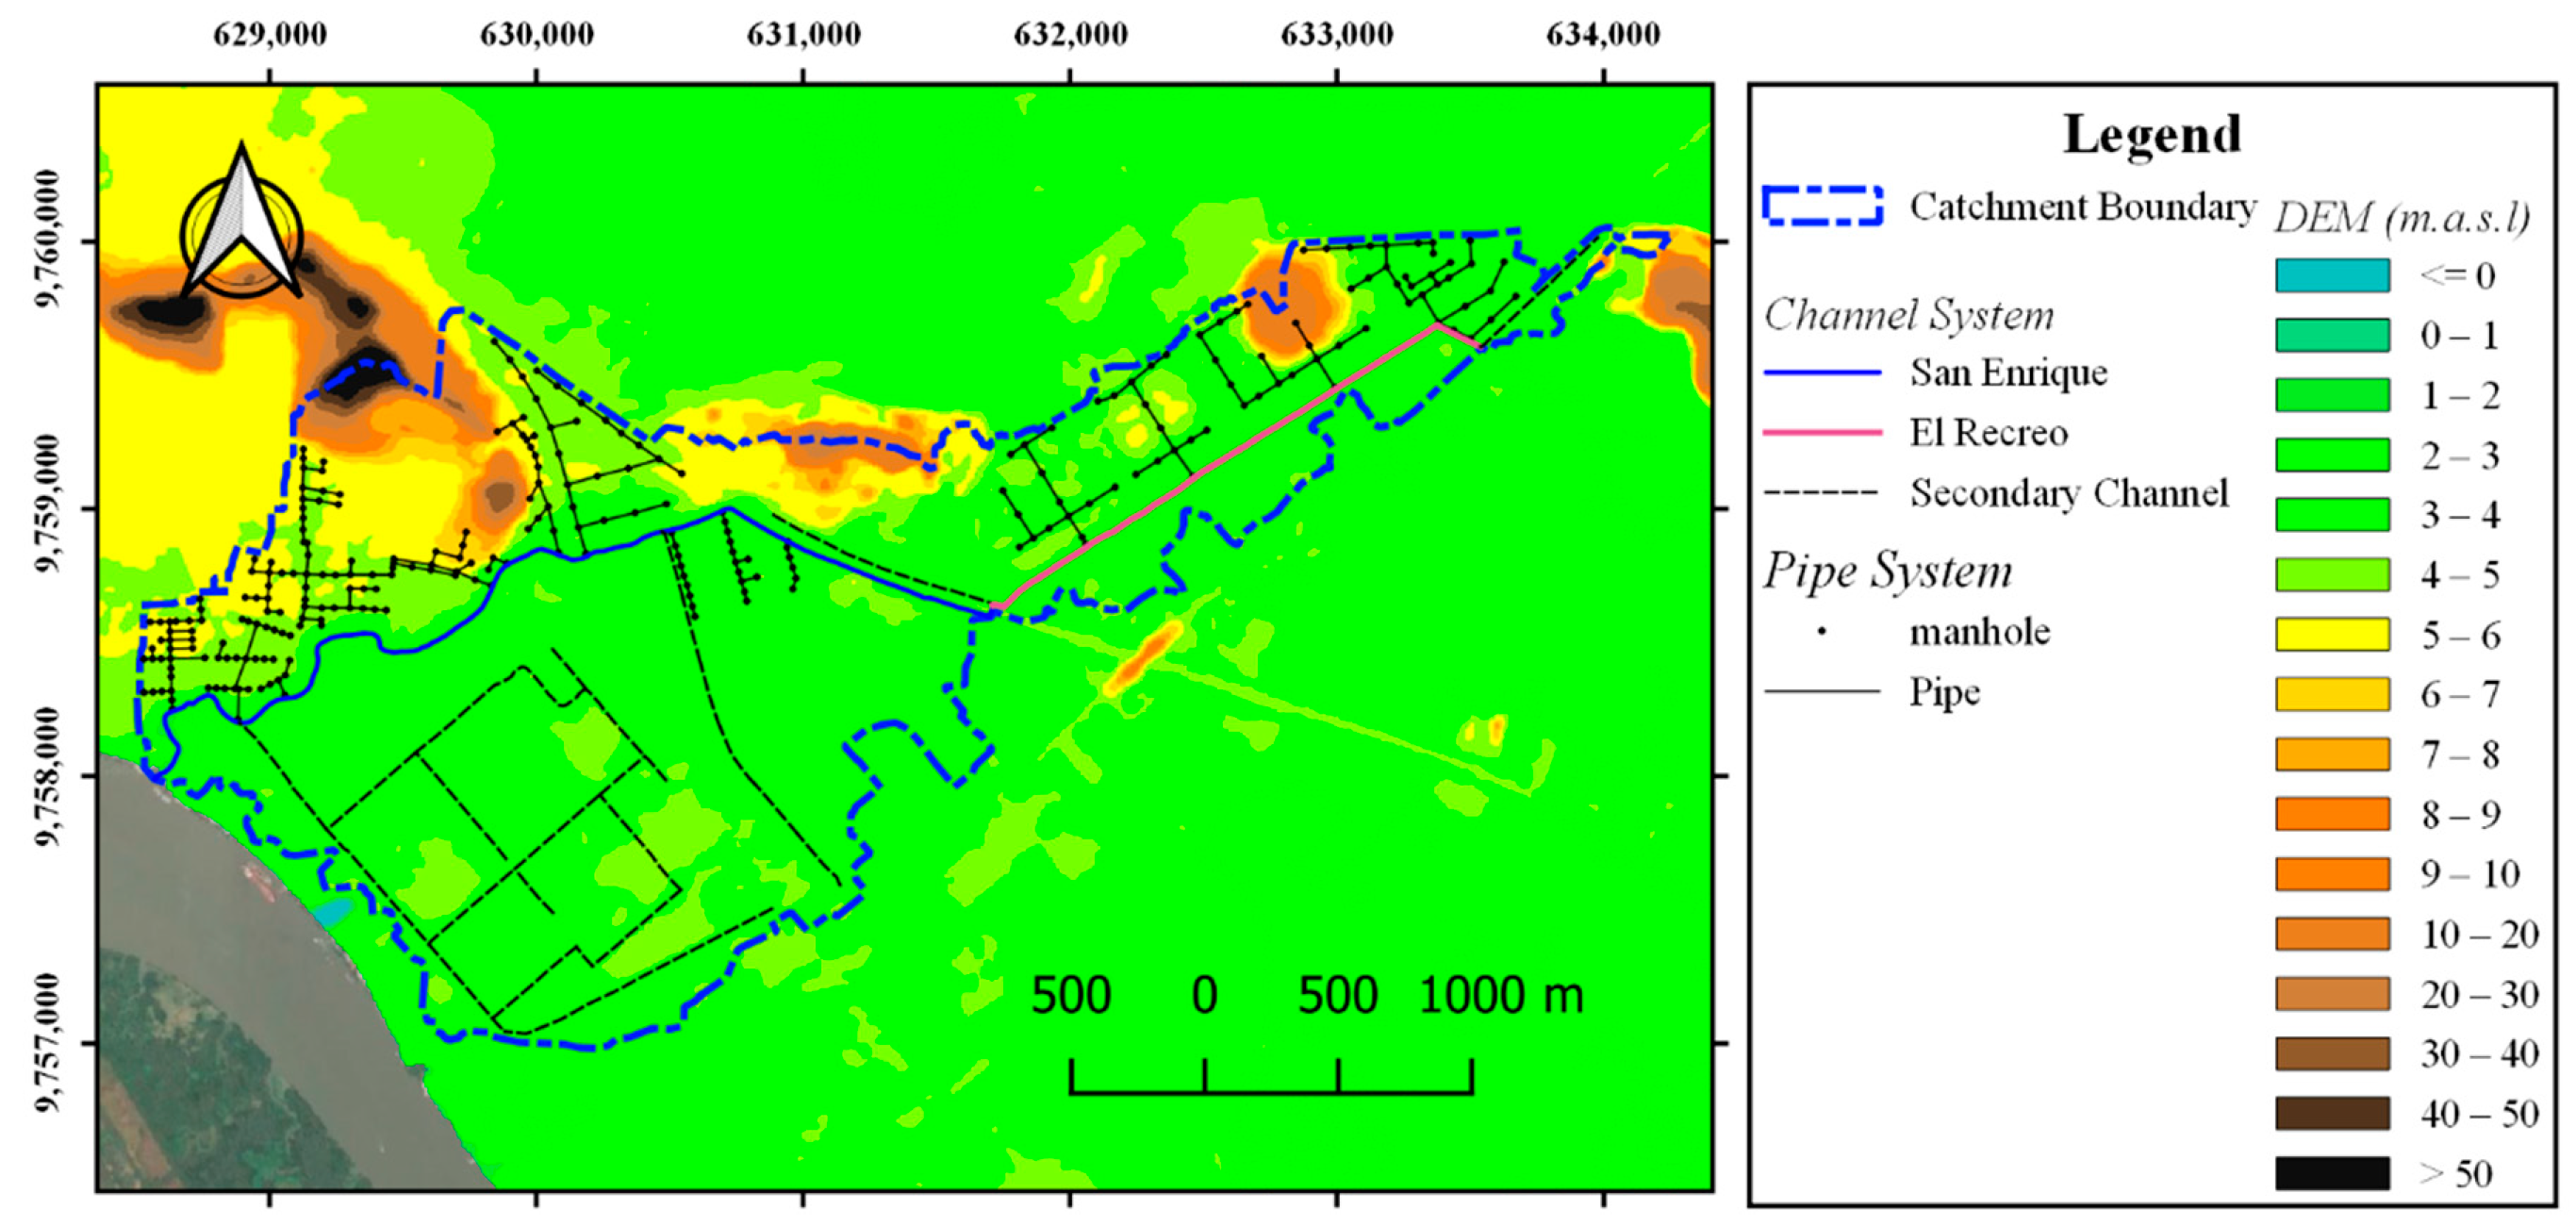
San Enrique urban basin (
Figure 2). As for the city, along the channels there are areas with and without stormwater service, for instance, El Recreo neighbourhood whose pipe network is connected to El Recreo channel, and is frequently affected by flood events (red line in
Figure 2). Due to near-flat terrain, drainage pattern in frequent flooded areas is mainly driven by size and slope of pipes connecting to channels, rather than terrain slope.
2.2. Hydrometeorological Information
Duran is characterized for a tropical climate with a wet and dry season: The former goes from December to May, while the latter takes place mostly from June to August, followed by a short transition period between seasons [
15]. Three main factors influence the hydrology across the city: Precipitation, streamflow from the upstream Guayas Basin, and tides.
There is only one meteorological station at Duran:
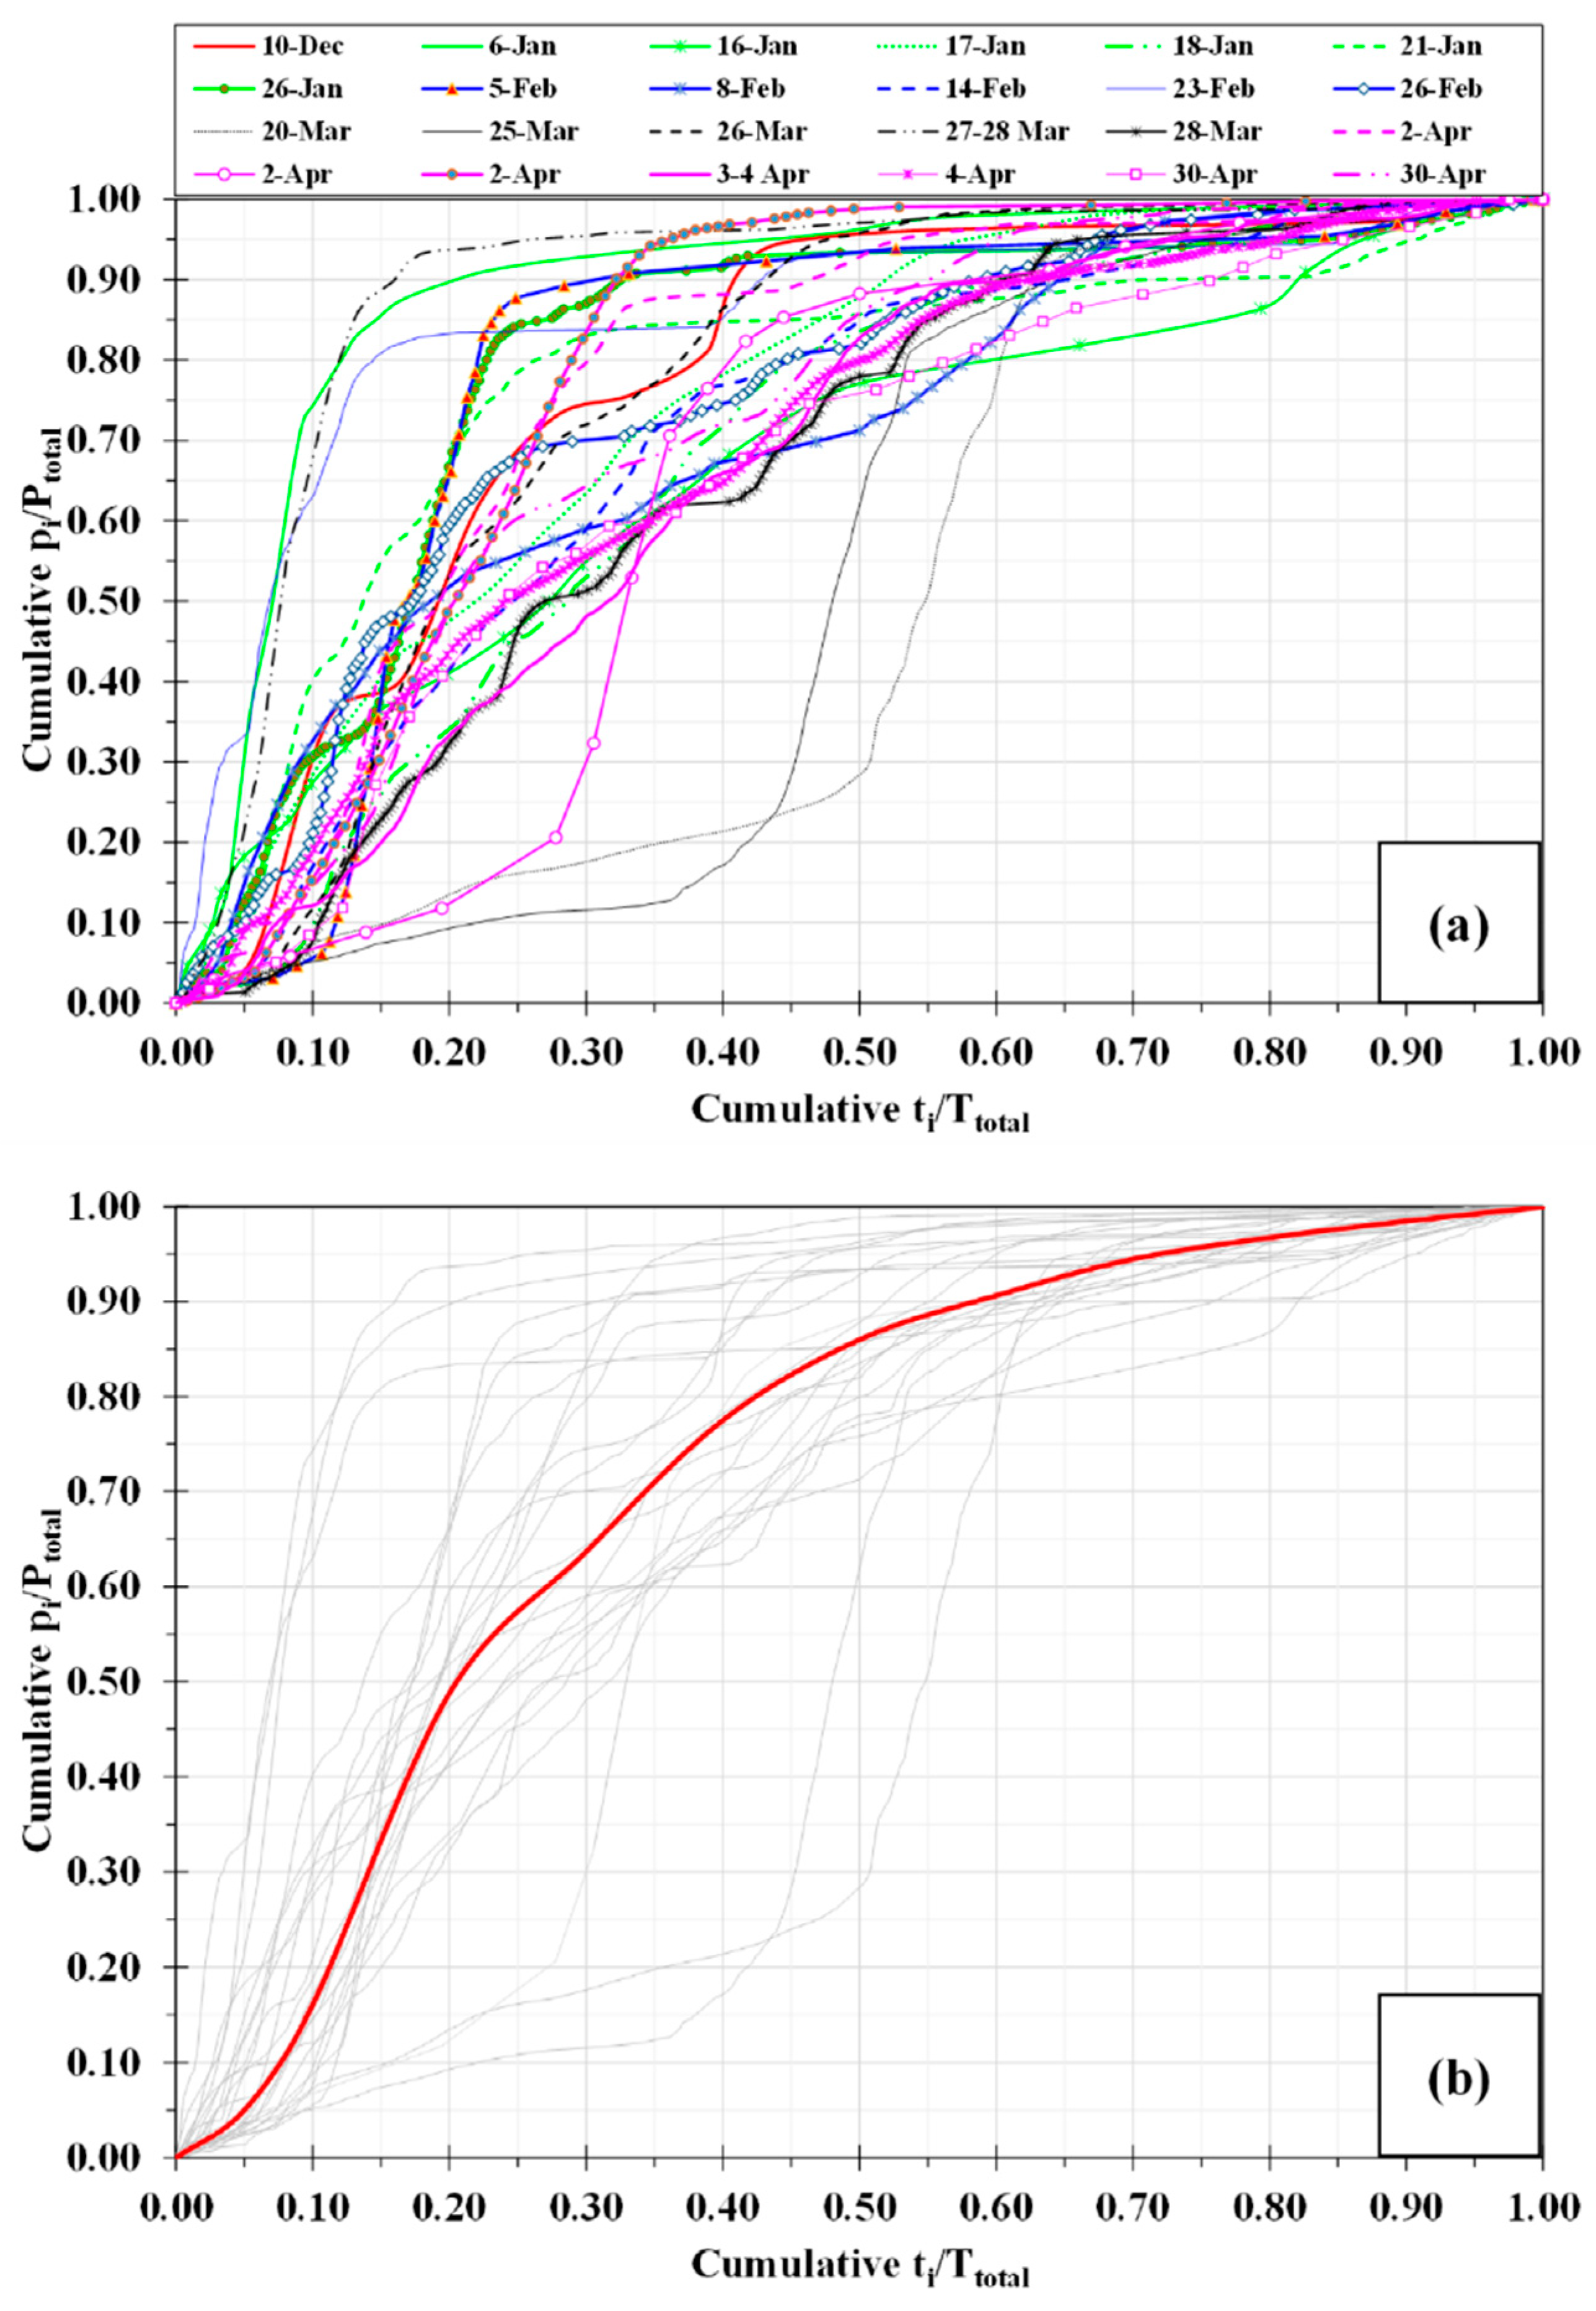
Divino Niño, operated by the National Hydrometeorological Institute (INAMHI). That observation spot is relatively new (deployed in 2013), thus having recorded 24 storms between December 2014 and April 2015. Each storm is recorded on a 1-min basis allowing the analysis of rainfall distribution by normalizing cumulative rainfall (p
i) and storm duration (t
i) to total rainfall (P
tot) and total duration (T
tot), respectively, for each storm event (
Figure 3a). Based on all normalized storms, a synthetic storm type was developed which represent the median of all curves (red curve in
Figure 3b). Duration of the rain was another useful information obtained from that station (220 ± 154 min).
Since
Divino Niño station did not have enough annual records to obtain precipitation for different return periods, the meteorological station located at the Guayaquil International Airport was used. It is located around 6 km west of Duran (
Figure 1) and has daily records from 1961 to 2017. Statistical (extreme) analysis was performed to obtained remaining needed information for flood modelling (
Table 1). The average annual precipitation is approximately 1100 mm per year. But during extreme events, rainfall increases dramatically, causing extreme flooding for many cities such as Duran, Guayaquil, Daule, Vinces, amongst many others. During
El Niño years, particularly in 1997–1998, annual precipitation at Guayaquil increased beyond 3400 mm per year. Recently in 2017, annual precipitation was up to 2023 mm [
16].
Regarding tidal behavior in the Guayas river, a gauging station located at Guayaquil city was selected (around 8 km far from the study site), as seen in
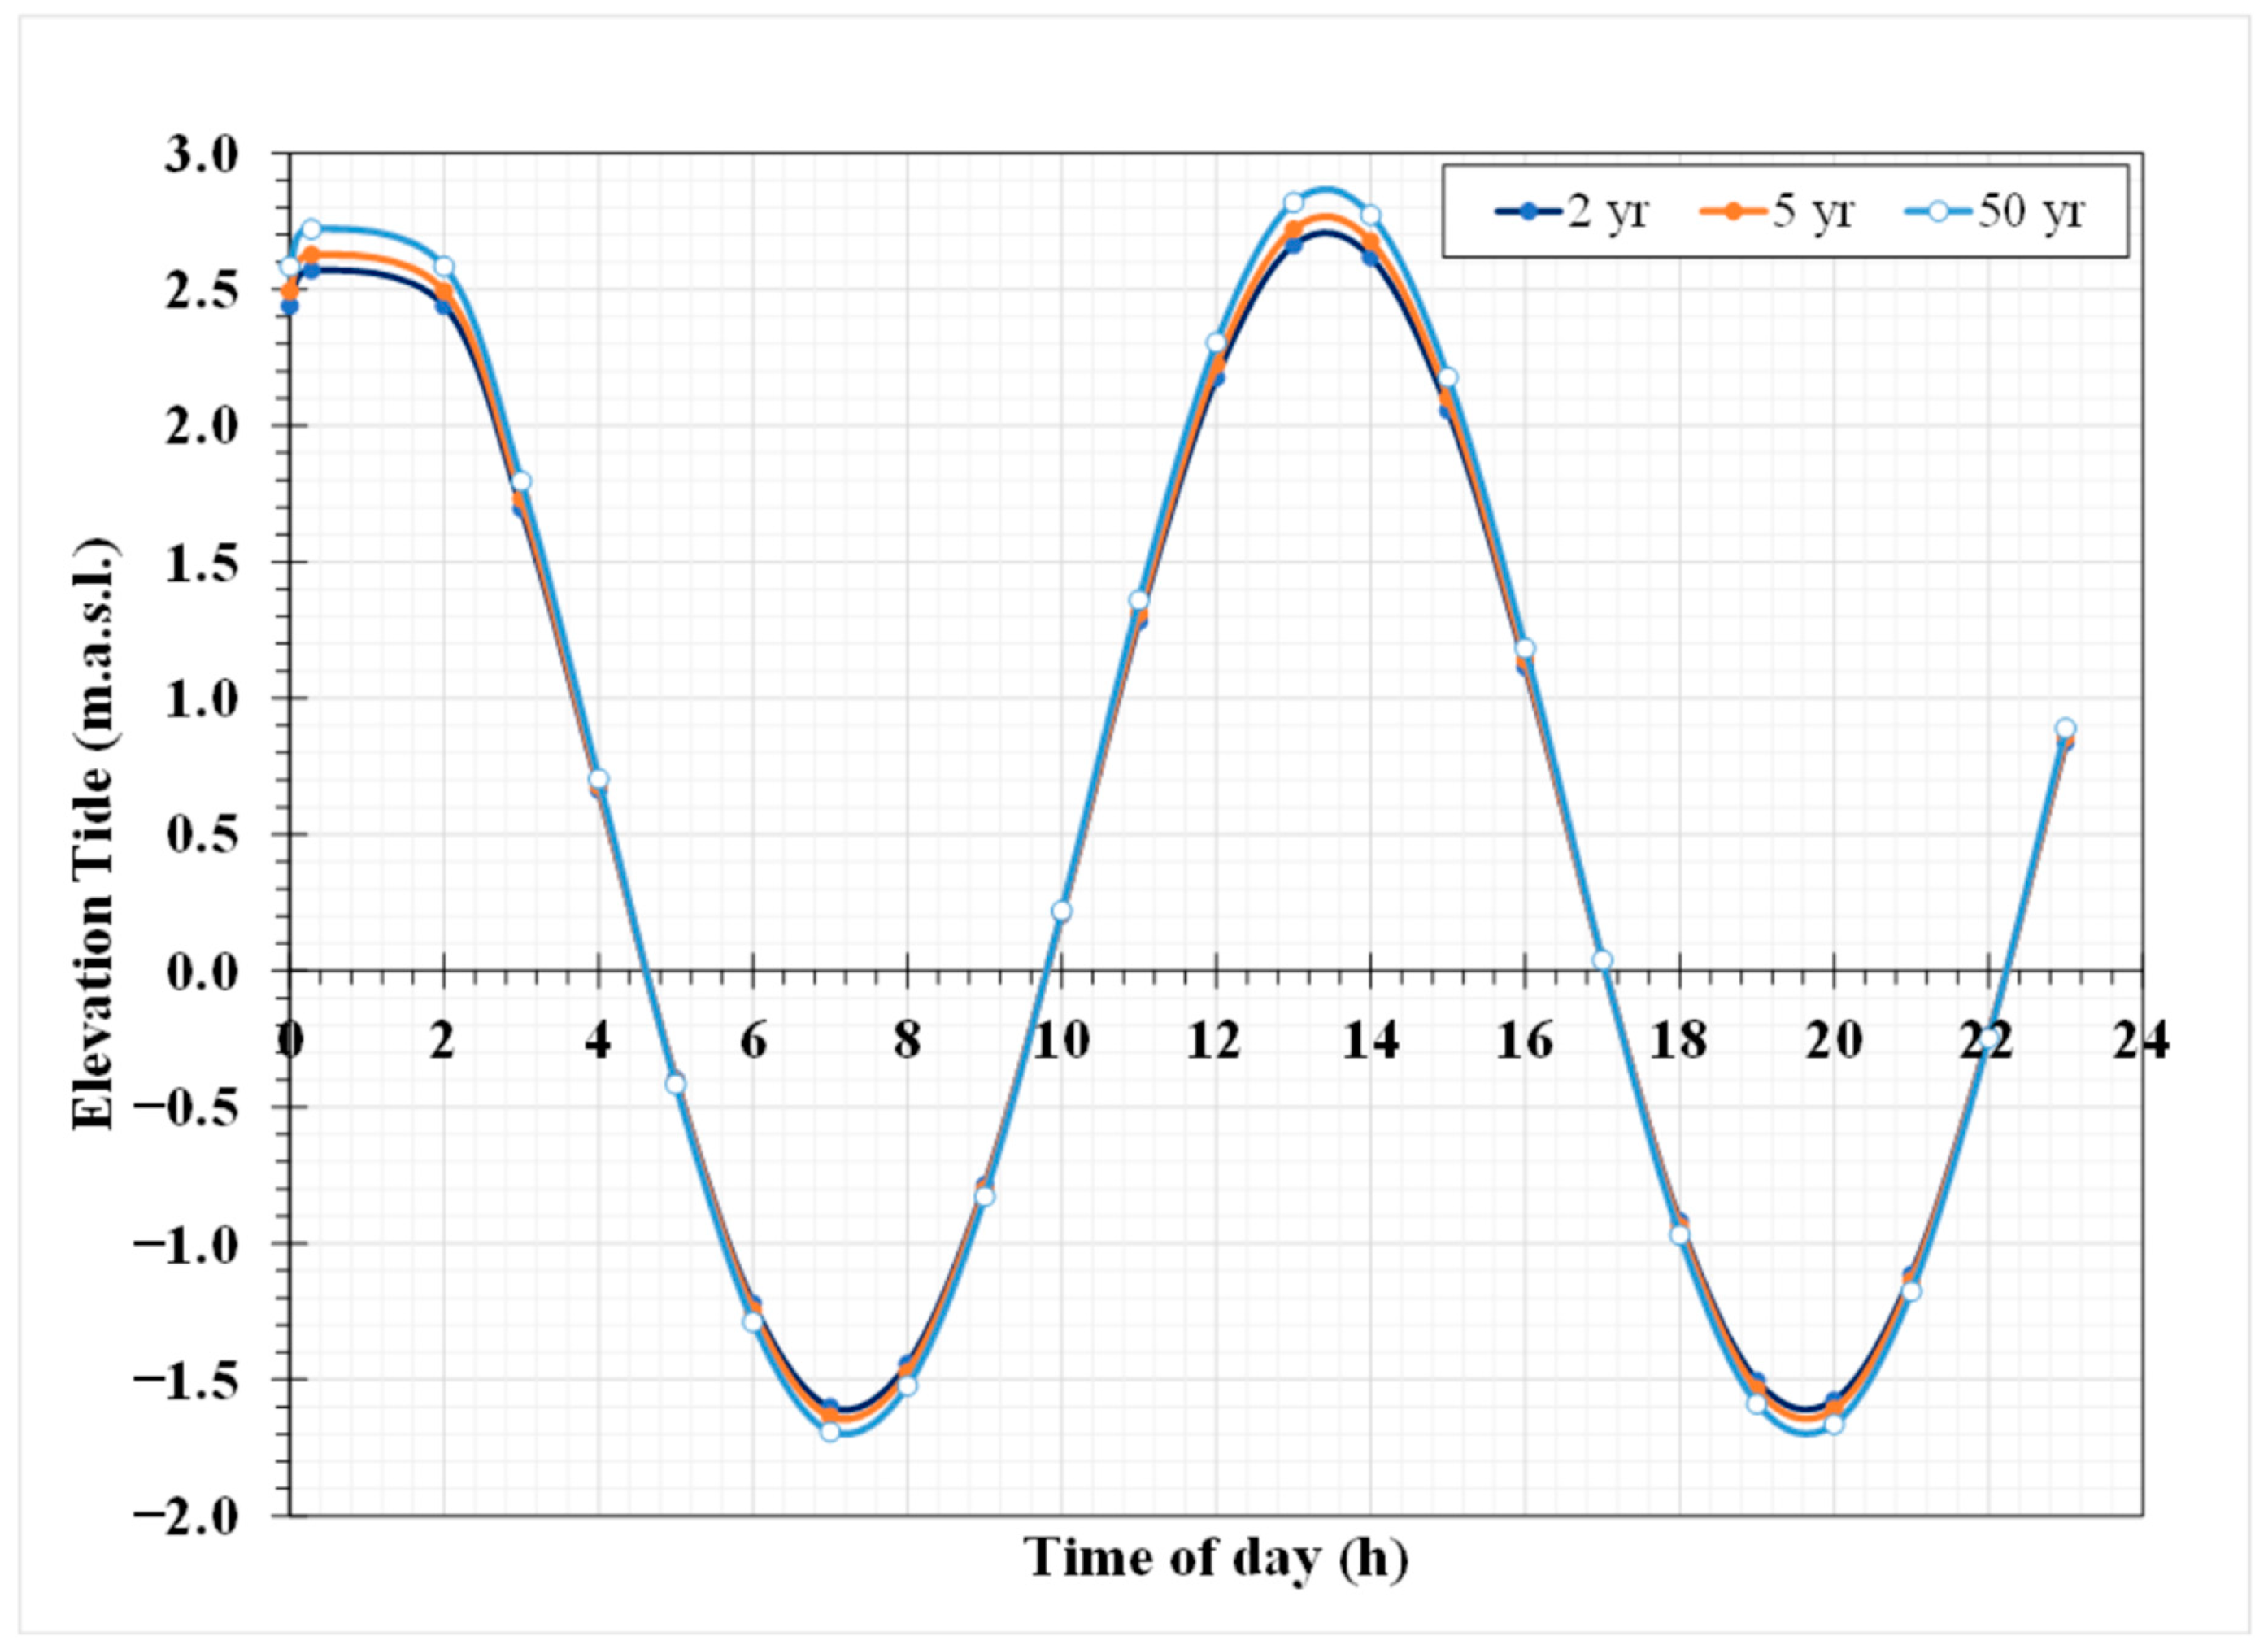
Figure 1. The peak flow tide occurs twice a day. Curves for 2-year, 5-year and 50-year scenarios were constructed based on records from 1990 to 2000, which were used in the flood model for the study area (
Figure 4). Noteworthy is that interval included the last strong
El Niño phenomenon experienced in the region (1997–1998) [
16].
2.3. Flood Model Scenarios
The Stormwater Management Model–SWMM [
17,
18,
19] was used for the flood evaluation. Dynamic Wave Flow Routing was the option used in the SWMM model because it can handle backwater effects such as tide influence at the outlet of the stormwater system. For the San Enrique stormwater system, information regarding elements such as nodes, links, subcatchments and at least one rain gage station had to be considered to properly run a simulation.
Allow_ponding setting in SWMM was fixed to allow excess runoff water be collected atop nodes and re-introduced into the system as conditions permit. This setting is linked to a node parameter named
Apond which is the maximum ponded area above a manhole before runoff water is drained into the system. A synthetic rain was used based on the rainfall distribution shown in
Figure 3b. Simulated time series considered 30 dry days previous to the synthetic rain occurrence in order to achieve stable conditions at headwater due to continuous tidal influence. The modelling was performed around two schemes:
The latter scenario was subdivided in rainfall events associated with 2, 5, and 50 years of return period. According to urban drainage design standards in Guayaquil city (as the closest proxy case for Duran), stormwater systems should be designed to withstand at least a 5-year event without any flooding along streets [
20].
2.4. Calibration Process
Along the San Enrique pipe network, there are 17 out of 229 manholes where flooding conditions occurs frequently.
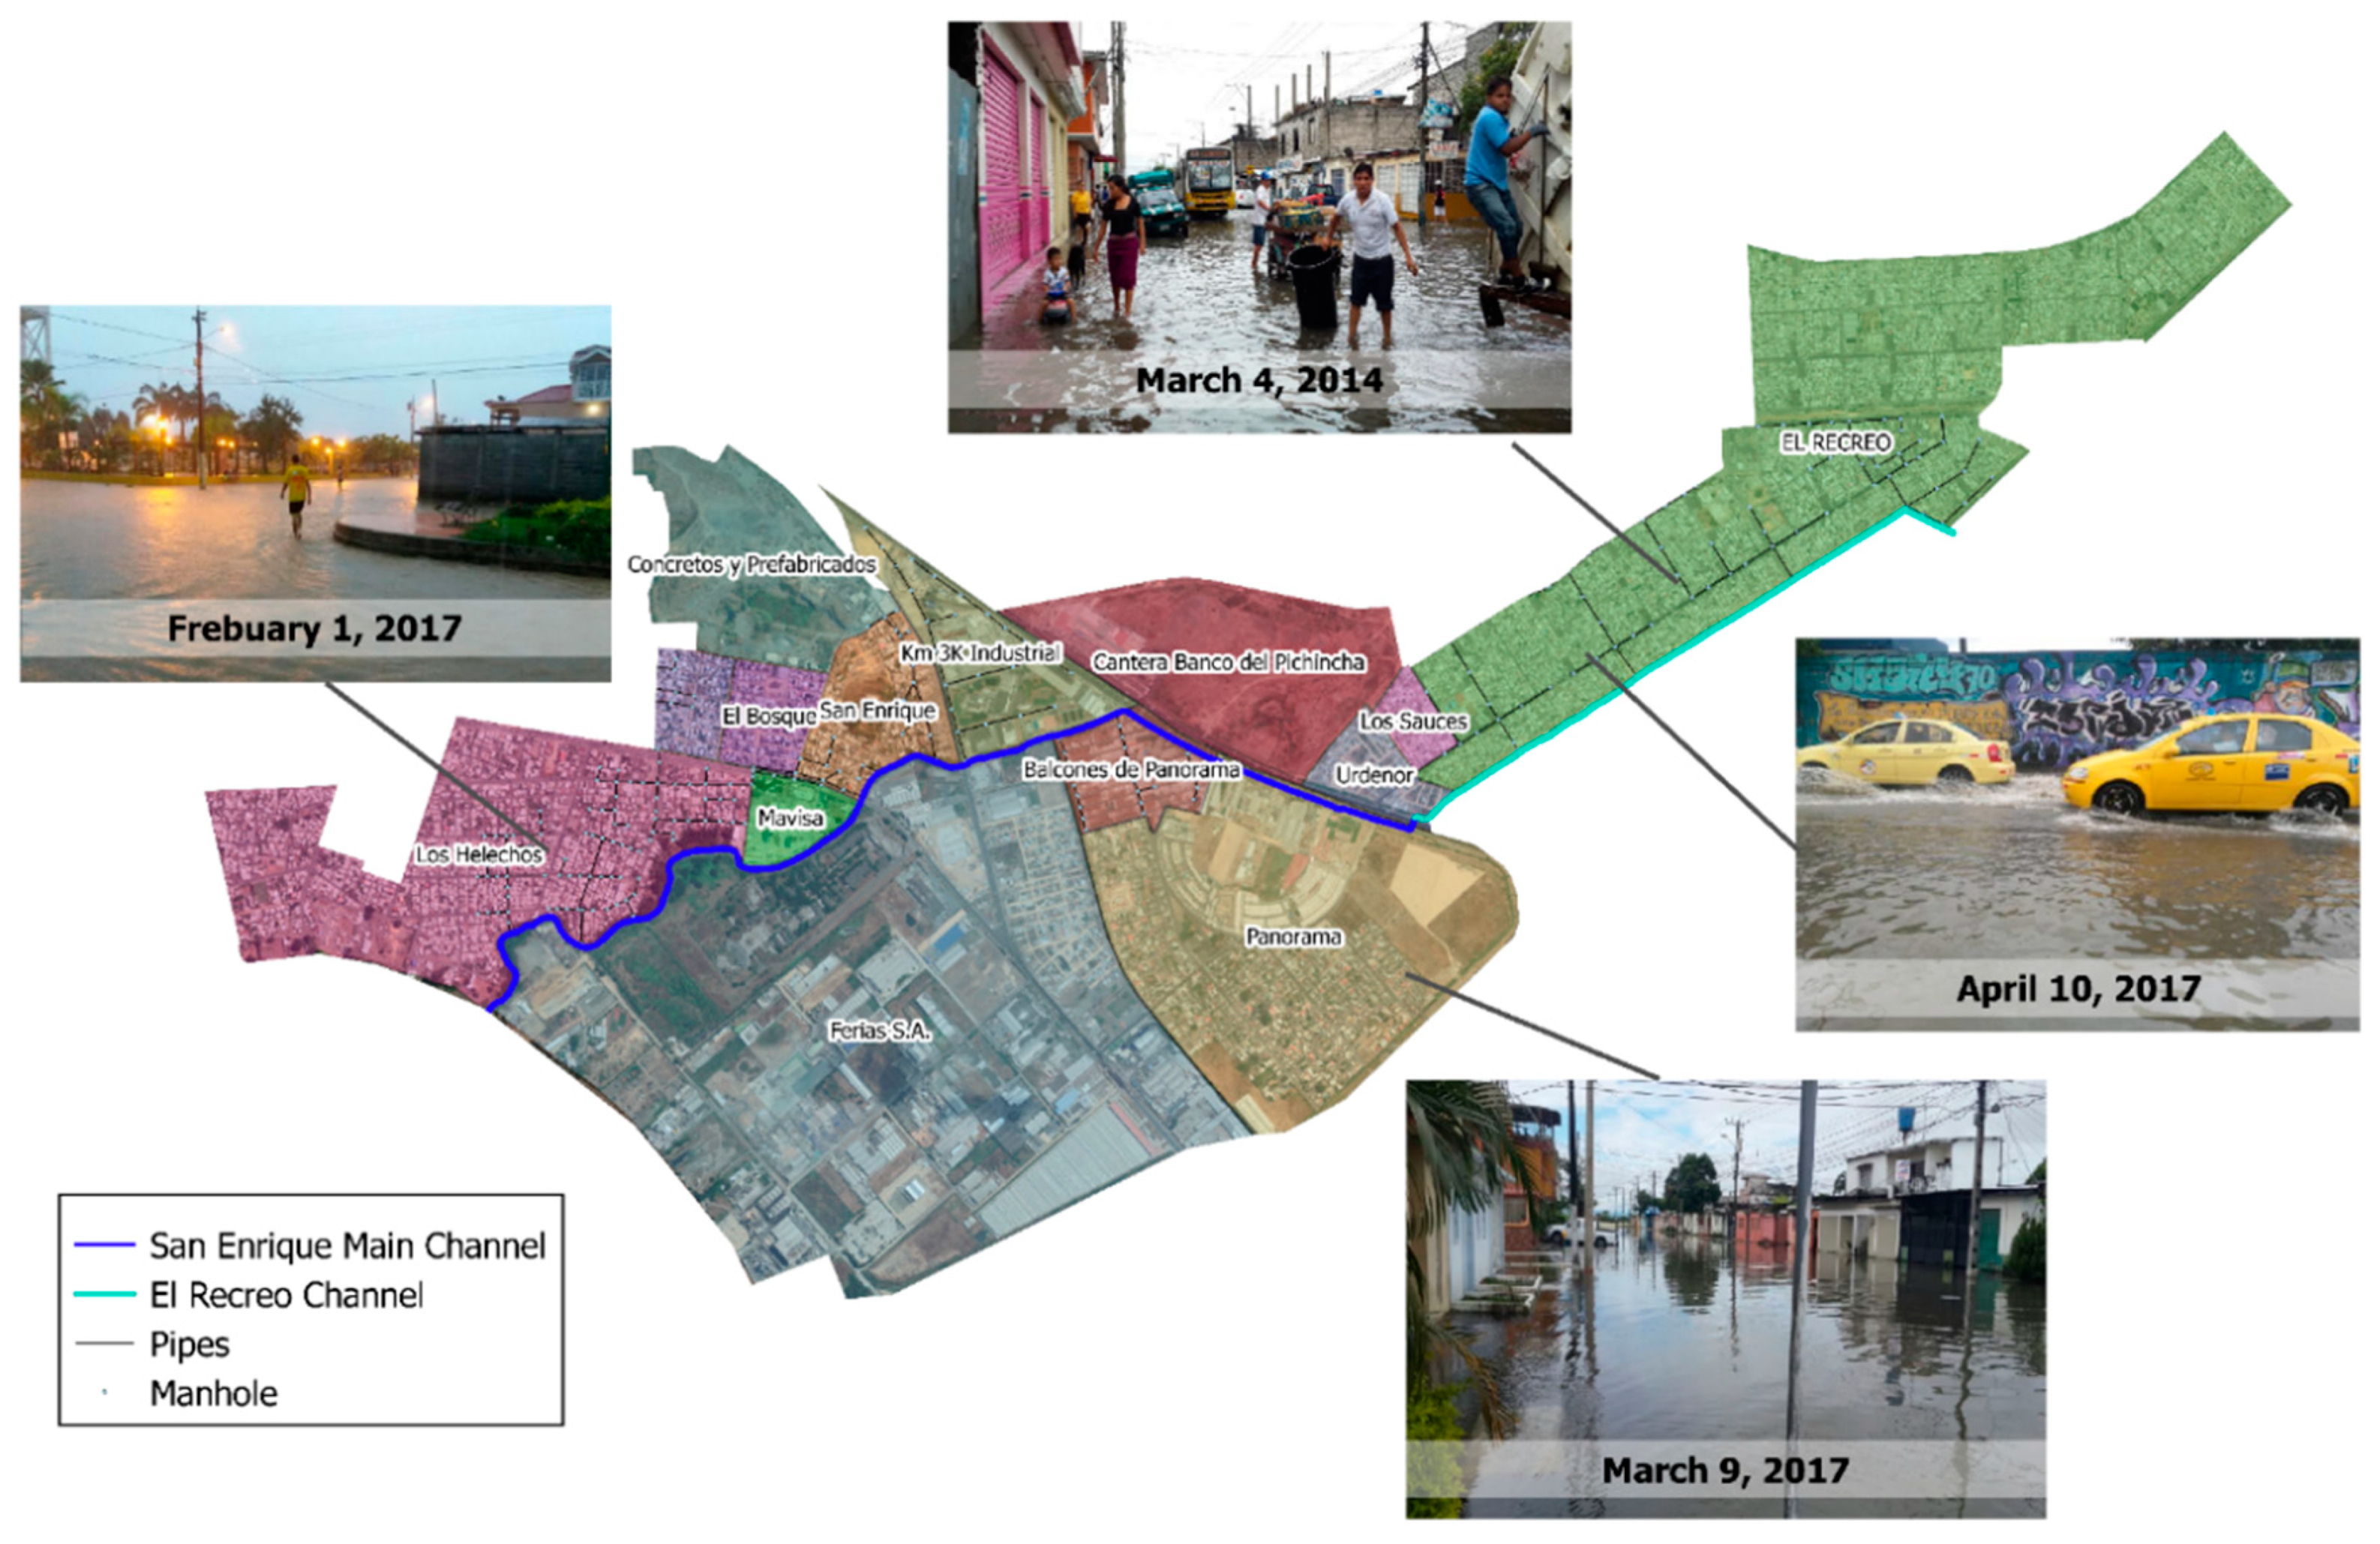
Table 2 shows the distribution of these manholes along 4 neighborhoods as well 10 available photographs showing inundations at those neighborhoods (not necessarily the same flooding location). Flood events at El Recreo neighborhood are the most reported at several media during the last decade. Some photos are shown in
Appendix A,
Figure A1.
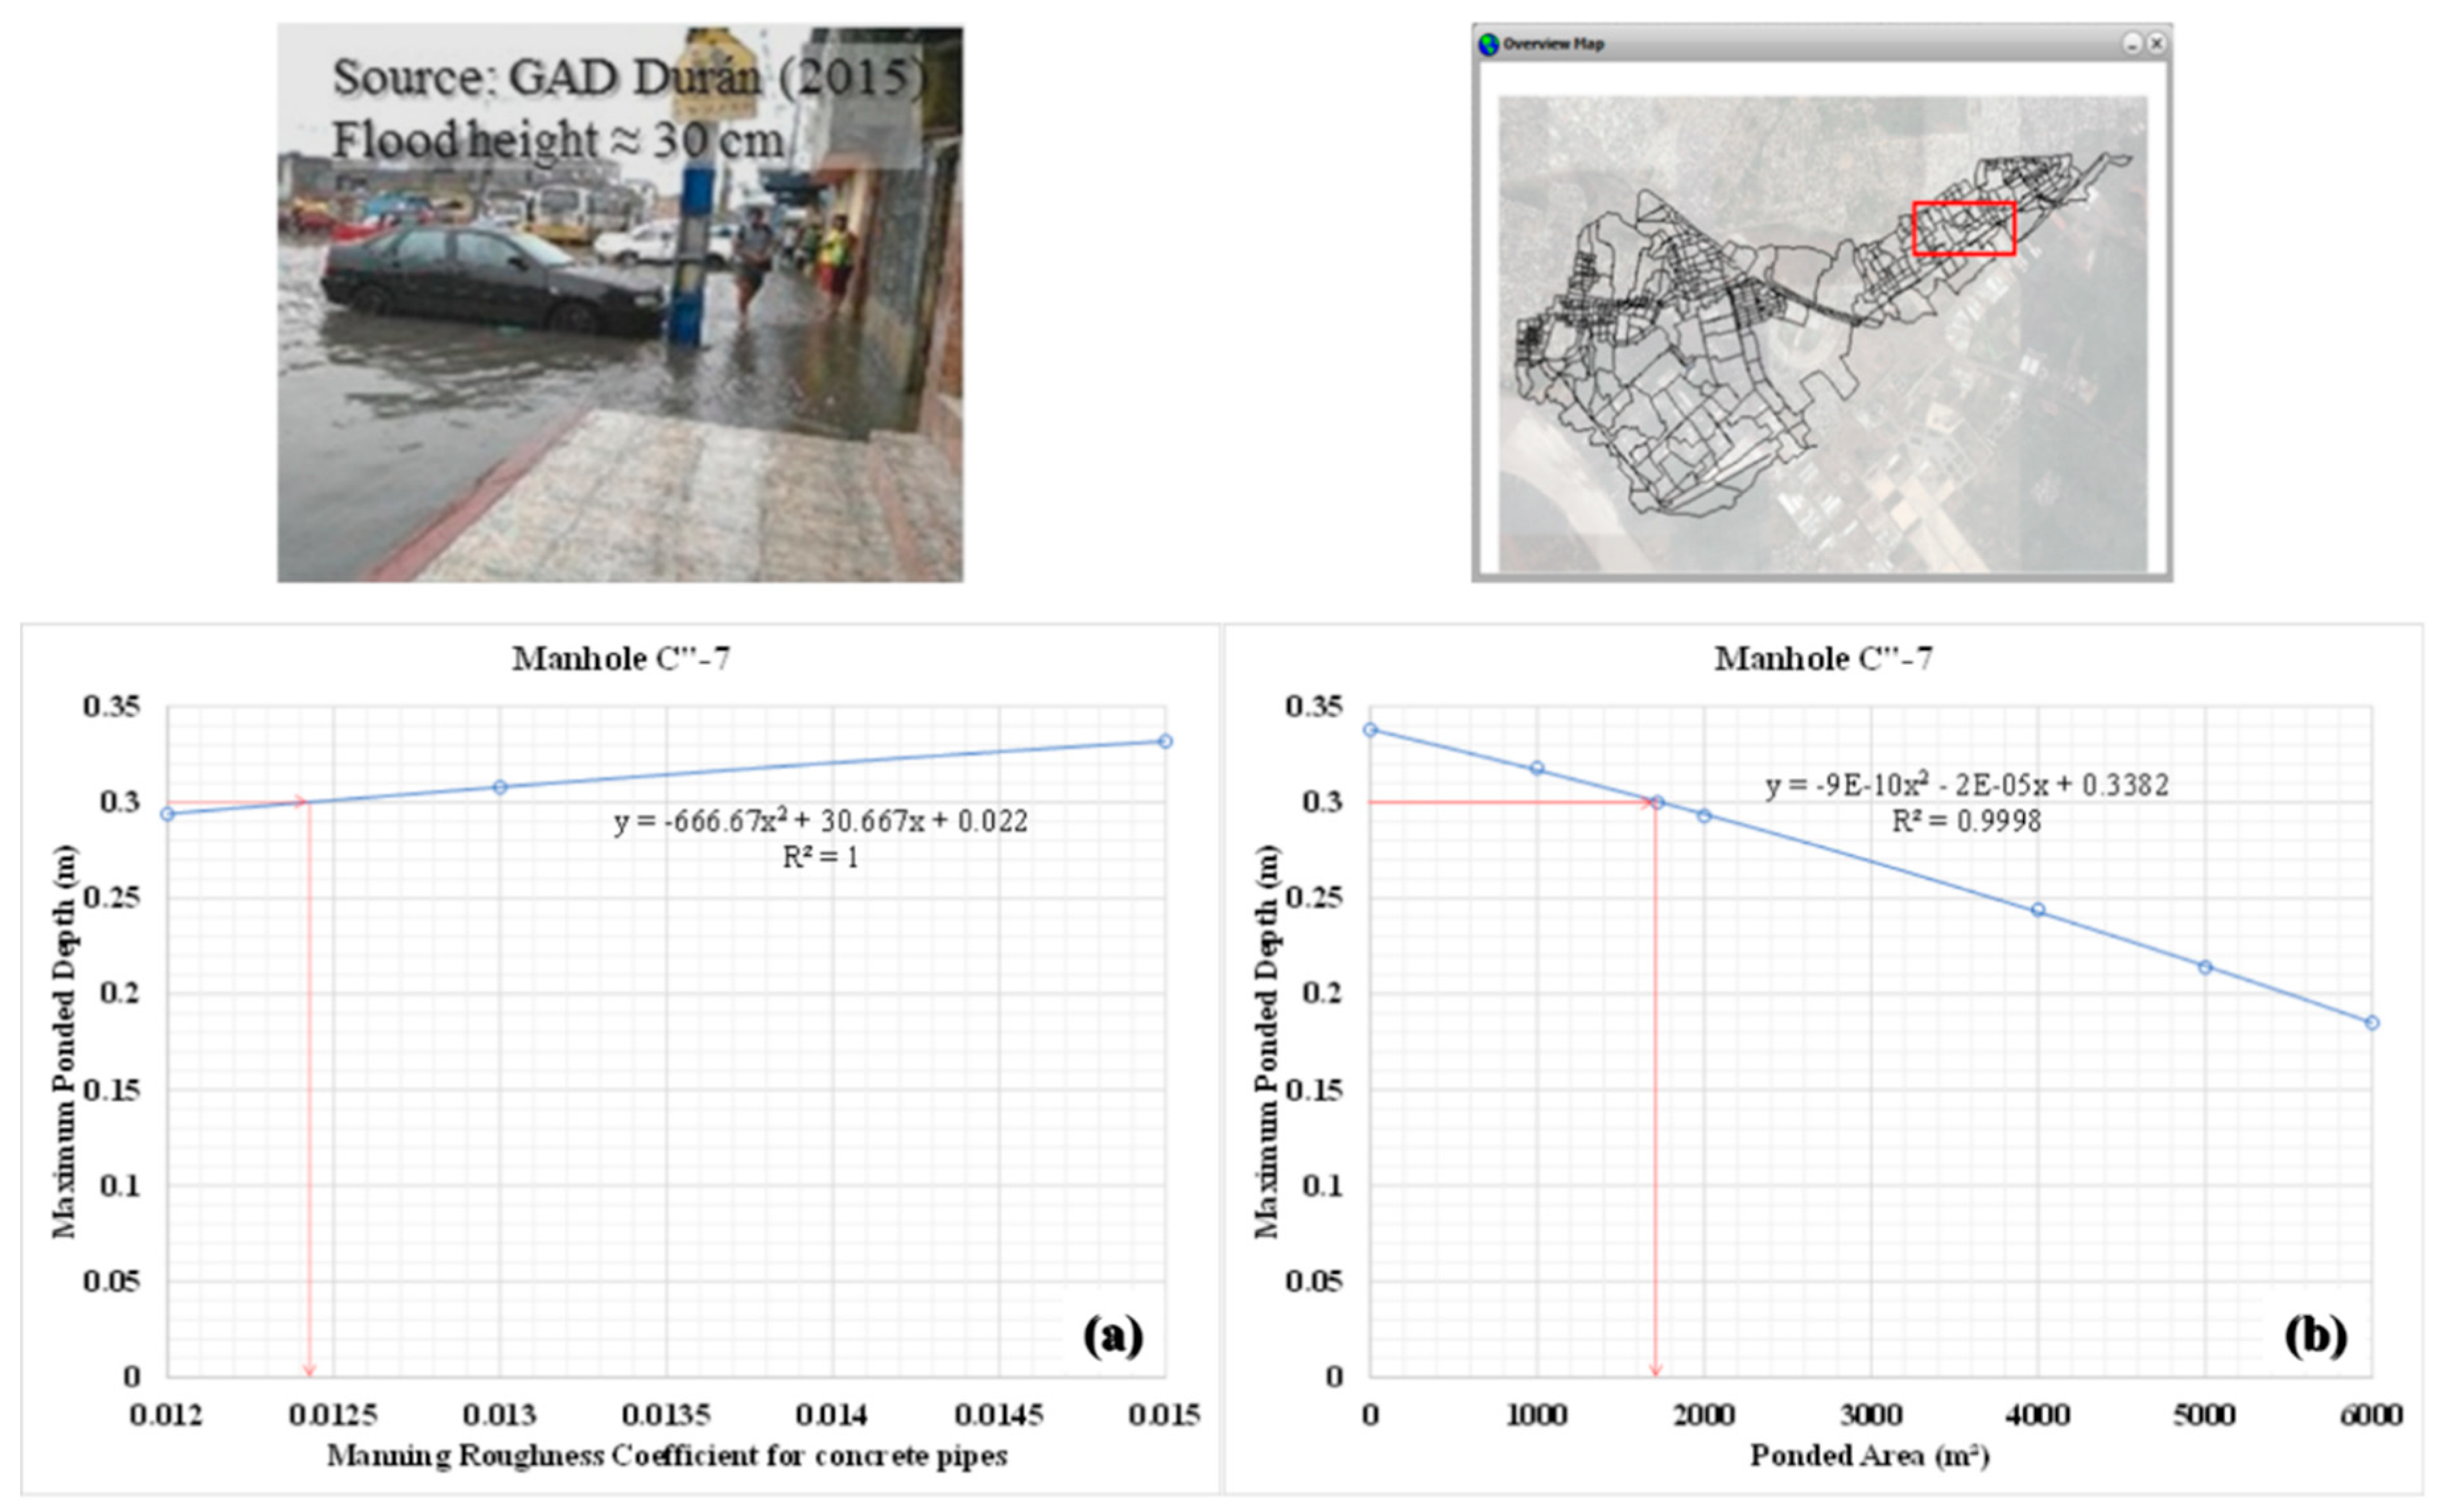
For calibration purposes, two parameters were adjusted to obtain flooding depths as similar as observed depths in photographs: Manning roughness coefficient (n) and ponded area above manholes. Manning roughness in concrete pipes varies from 0.012 (new pipe) to 0.015 (aged pipe). All pipes along the network are made of concrete and were deployed more than 15 years ago. However, Duran municipality has not up-to-date information regarding pipes age in the system. In contrast, maximum ponded area atop all manholes shows a median of 1780 m2, an average of 2695.50 m2 and a standard deviation value of 2737.55 m2. This parameter is estimated based on street-curb dimensions and street slope toward the manhole.
The simulation showed that modelled flooding depths are more sensitive to ponded area parameter than Manning roughness coefficient. Sensitivity analysis were performed in 5 locations (1 in Los Helechos and 4 in el Recreo).
Figure 5 shows sensitivity results for manhole C”-7 where depth varies in centimeter range for roughness variation, and in decimeter range for ponded area variation.
From the sensitivity analysis, the adoption of a Manning coefficient of 0.0013 for concrete pipes and a ponded area of 1720 m
2 showed coherence with reference water depths in photographs records of frequent flooded locations. Regarding earthen channels, they usually lack of regular and periodic maintenance. A lot of obstructions can be seen along such as construction debris, dense vegetation and solid wastes, which can change significantly theoretical values for the roughness coefficient. To overcome this problem, theoretical values were corrected by a methodology proposed by Cowan [
21], for both channels and floodplains, and traditionally applied by several projects and institutions such as the U.S. Department of Transportation and the US Geological Service (USGS), as well as widely reported in the literature [
22,
23,
24]:
- nb
a base value of n for the natural bare soil surface (texture).
- n1
the effect of surface irregularities, as well as, scour potential.
- n2
variation on shape and size of the cross section. Does not apply for floodplains.
- n3
obstructions along the channel or the floodplain.
- n4
presence of vegetation
- m
a correction factor for sinuosity along the channel (not floodplains).
Based on that methodology and observed characteristics across the evaluated channel system, Manning roughness coefficient values were set as seen on
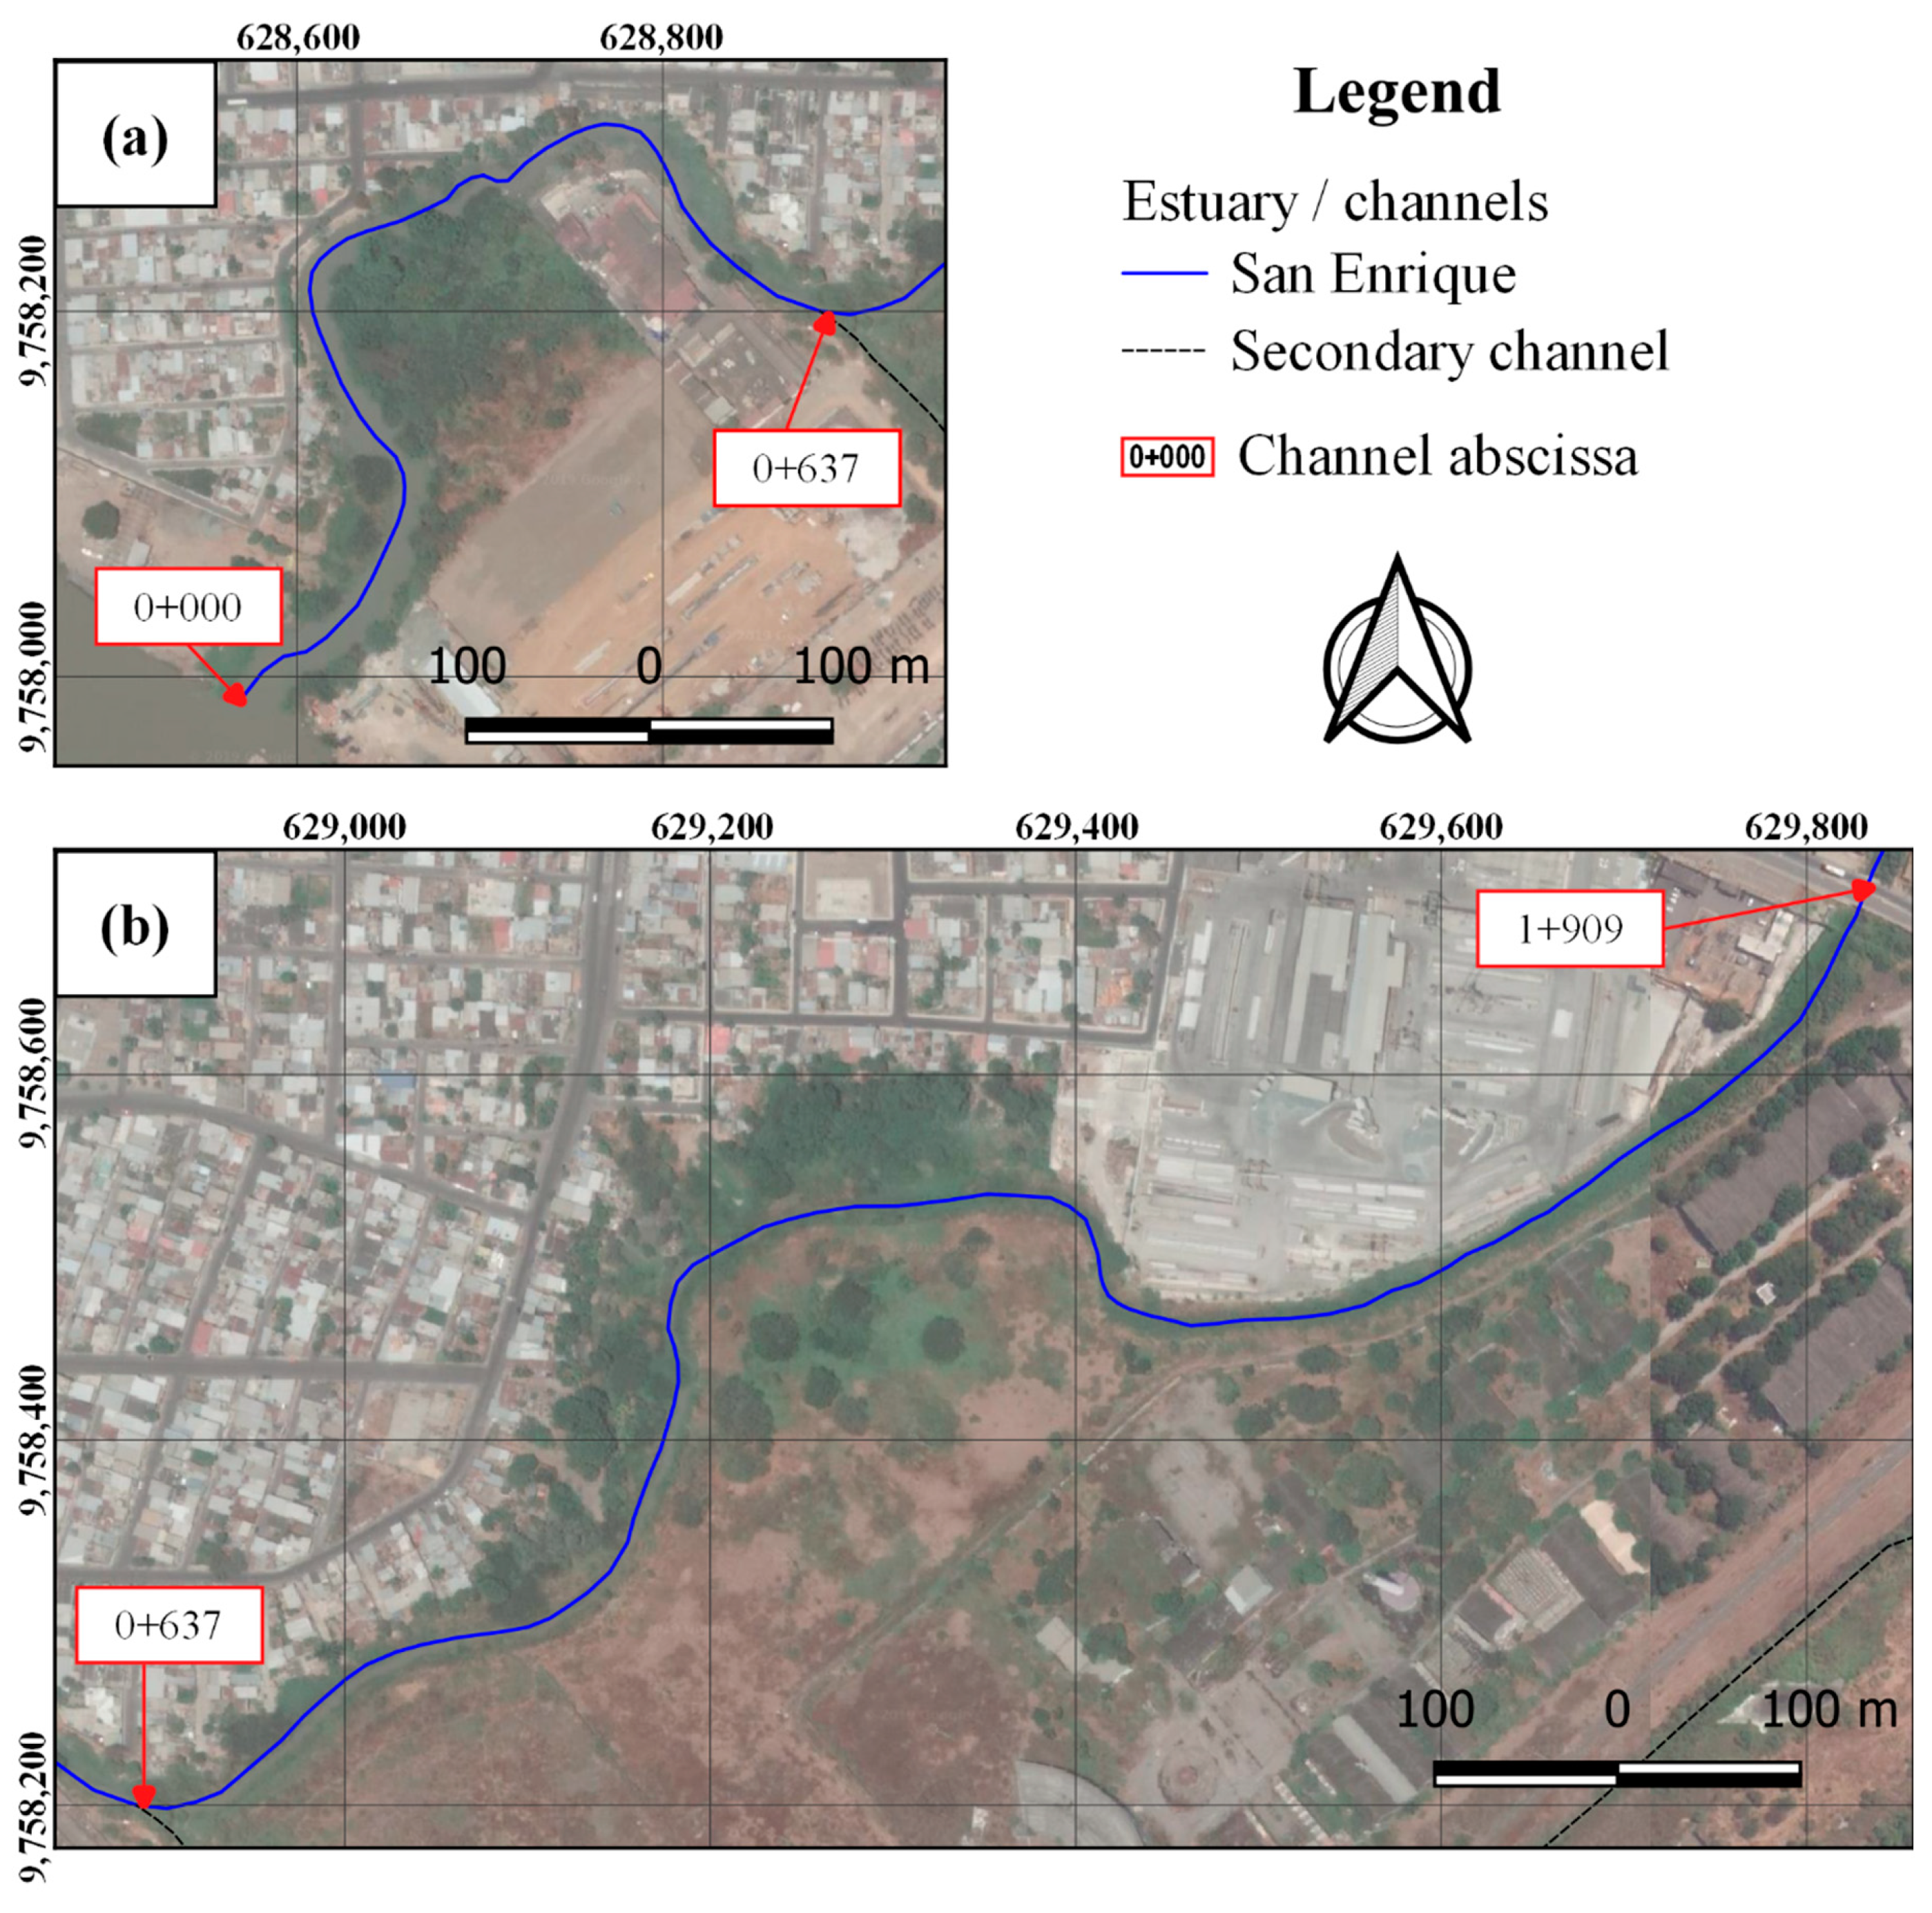
Table 3. The first two segments of the San Enrique channel have different values than the rest of channels due to their larger shape and size cross section, very few obstructions along, and higher sinuosity, as seen in
Appendix A,
Figure A2.
2.5. Flooding Hazard Maps
Several flooding hazard maps were elaborated, based on model results. In that respect, by means of SWMM, it was possible to estimate three flooding variables:
Water Depth, which is measured above ground (or standard) level (manhole cover);
Flow, which is the discharge coming from a manhole; and,
Duration, which is the total time with water on a street (once a manhole is full).
In the context of this article, flood hazard is related to the probability that people and property safety could be in danger if a rainfall occurred and certain flow conditions along the stormwater network take place. In addition, some level of categorization had to be implemented to visualize vulnerability of flood prone areas. Hazard categorization is usually based on water depths above ground, which can influence vehicle safety speed [
25]. In the study area (as in the rest of the country) there was no information regarding vehicle traffic during storm events. Therefore, it was proposed to categorize hazards coupling the three variables simulated by SWMM with the potential traffic disruption, after Pregnolato et al. [
25]. Categorization is divided in: (i) Null/low (traffic is not disrupted); (ii) medium (traffic starts being influenced); and, (iii) high hazard (traffic may be critically affected), as seen in
Table 4.
2.6. Validation
In modelling, validation is the process that ensures consistent model results produced with different data set than the ones used in the calibration step. Flood information in Duran city is almost non-existent. Therefore, model validation is currently unachievable. However, calibrated results in this article will serve to grow awareness in municipal authorities regarding the importance to keep flooding records to be used in models such as SWMM for decision-making process.
3. Results
3.1. First Scenario (Normal Tide Without Rainfall)
Amongst 15.5 km of earthen channels in the evaluated sub-system, the
San Enrique–
El Recreo channel (6.59 km) is the only one receiving stormwater pipe collectors (
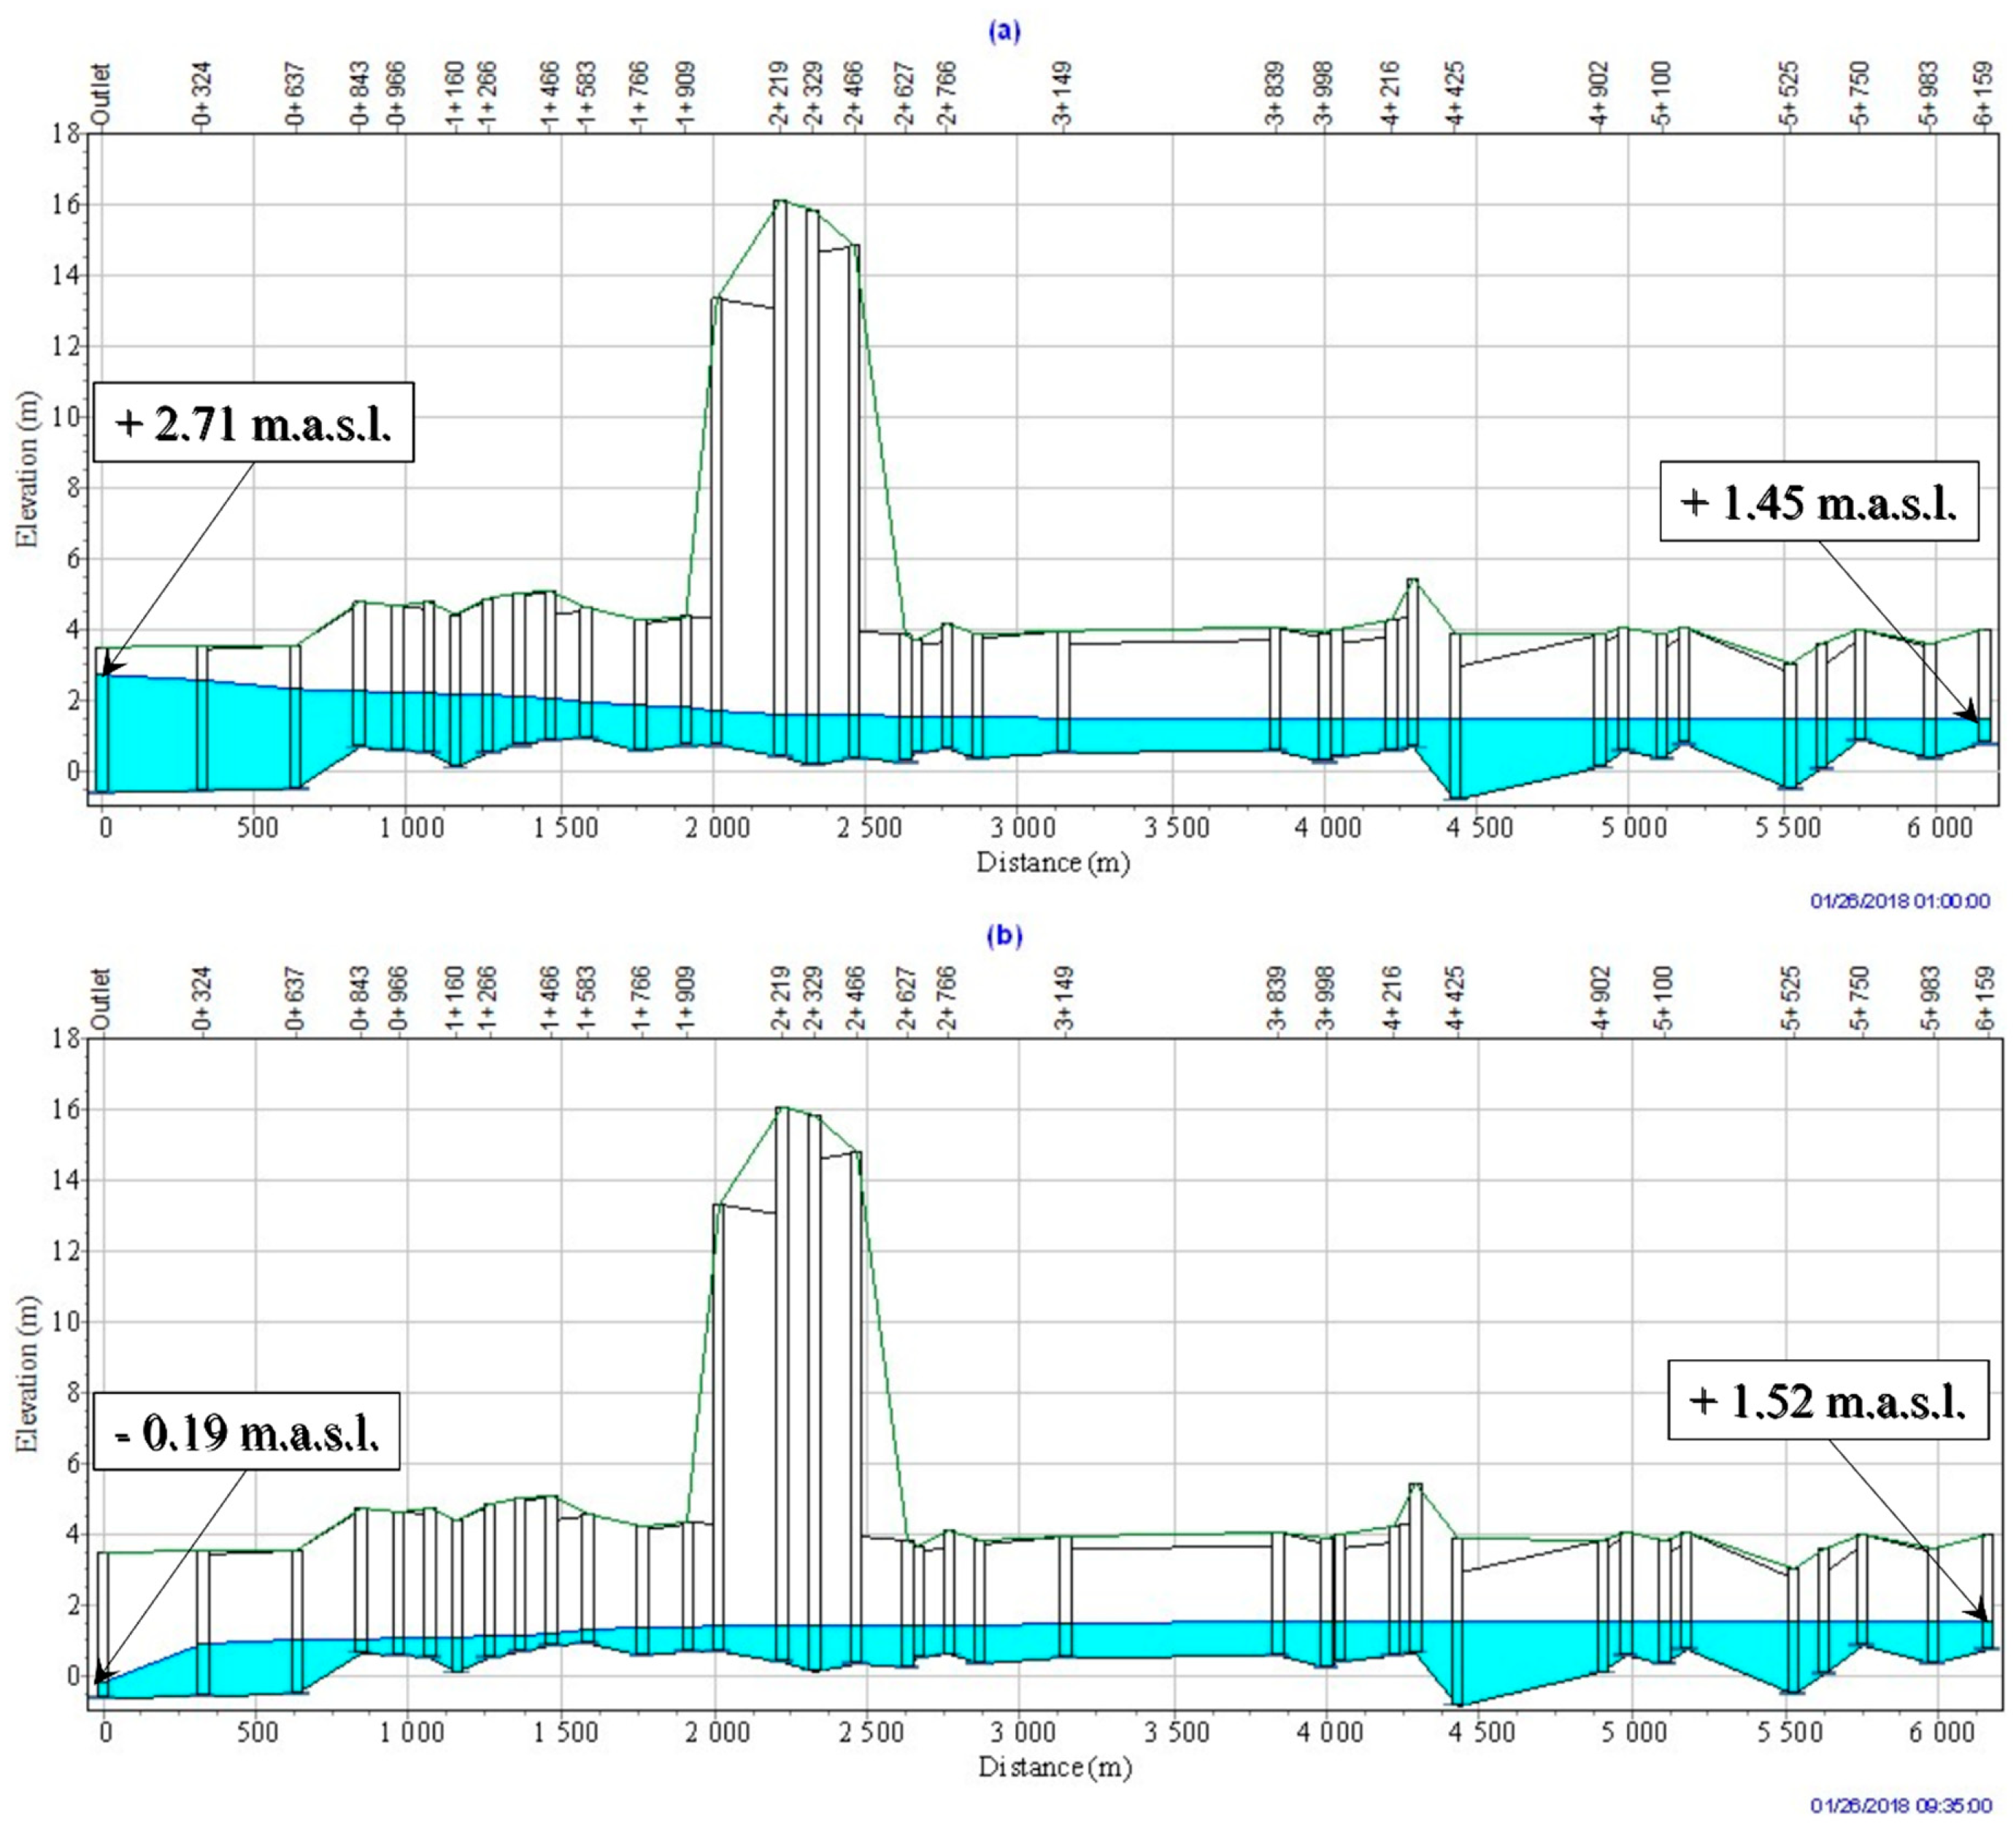
Figure 2). There was a lag time of 4.53 h between the maximum water surface (1.52 m.a.s.l.) at the headwater, and the one at the channel outlet (2.71 m.a.s.l) (
Figure 6). After that time, water level reached –0.19 m.a.s.l. (ebb) at the outlet. Simulated flow velocities along the channel varied between nearly null (headwaters) and 0.43 m/s (outlet). It is very likely to find stagnant water (<0.1 m/s) along the upstream channel length (2 km), implying potential flooding in stormwater pipes storm pipes connected to those channel sections during rainy events (notwithstanding their intensity or duration). The maximum receding flow (simulated) was 1.2 m
3/s at the outlet.
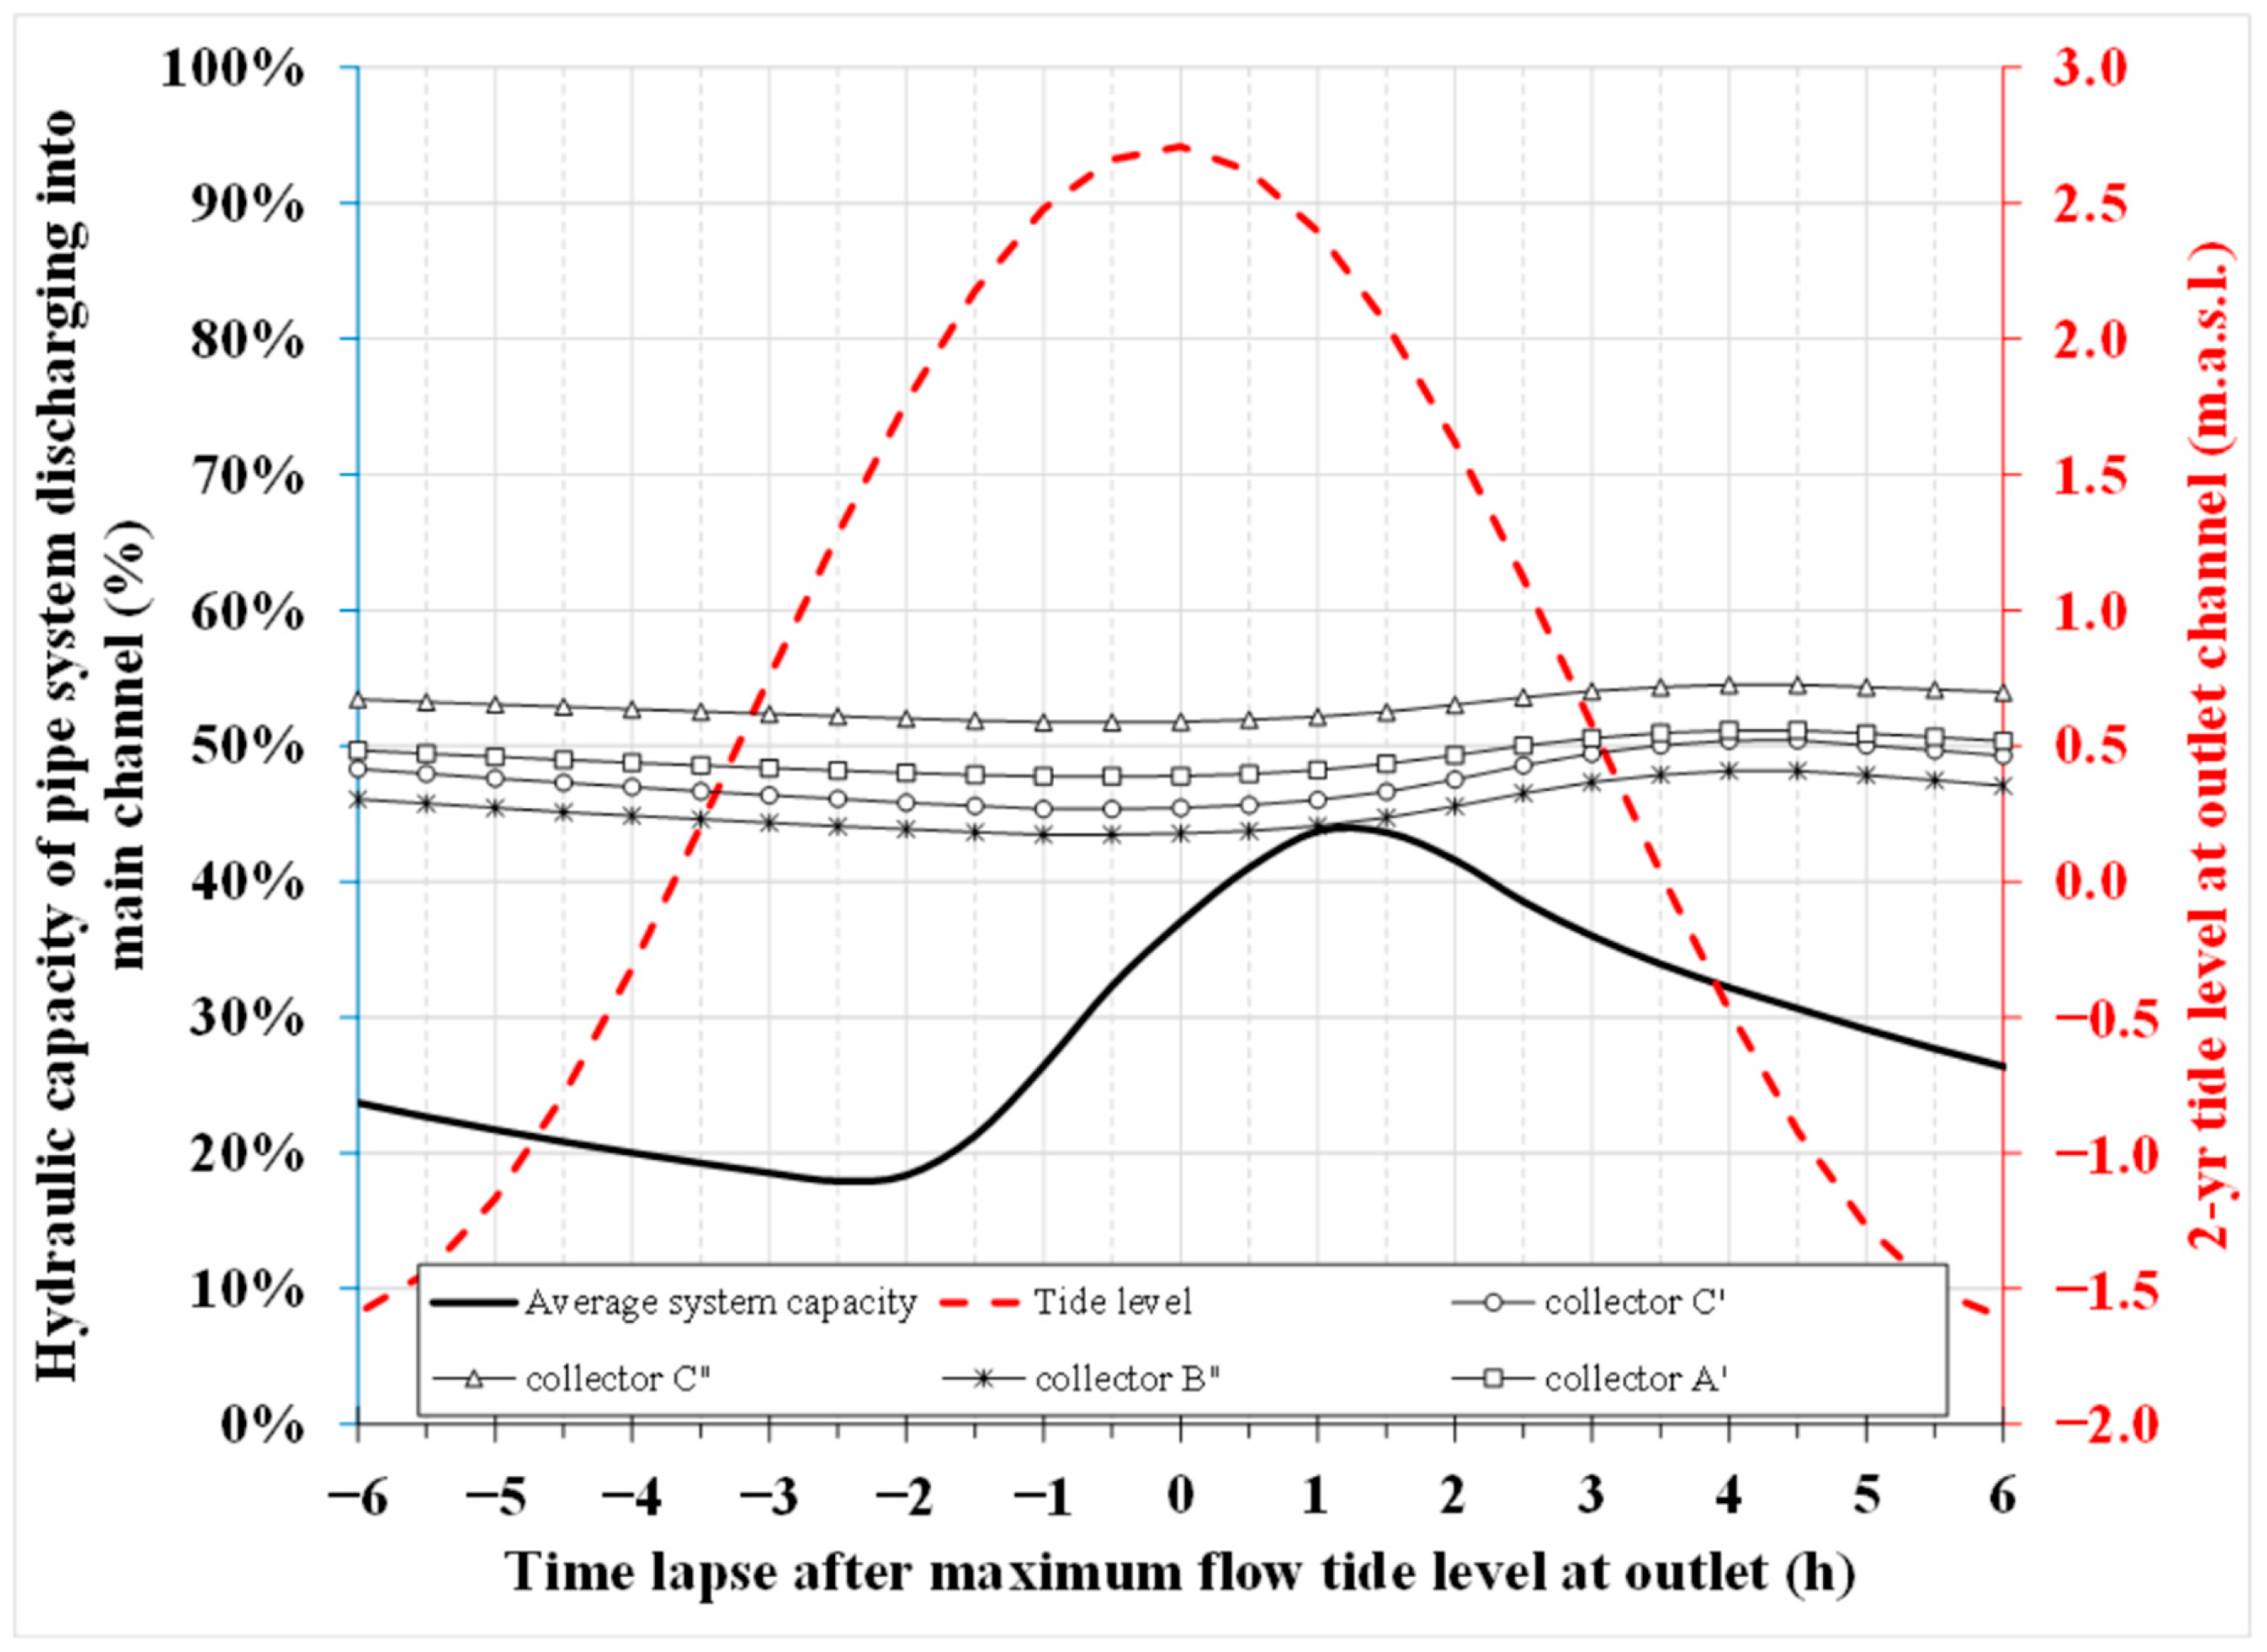
It was observed that the whole stormwater collector system is located below the minimum tide level. This implies all pipes are always inundated (18 to 43% of average hydraulic capacity). The maximum stress occurs 71 min after the tide peak at the channel outlet. Should a heavy rainfall event take place at that moment, pipe collectors connected to the channel sections may cause maximum flooding areas due to lack of carrying capacity. In that sense, at least four pipe collectors located at the San Enrique sector are almost half-filled during all day long (
Figure 7).
3.2. Second Scenario (Normal Tide + Rain Event)
The second scenario simulated a rain event plus the influence of a typical tide. A first step considered a 2 year precipitation (94.1 mm/day) estimated from Guayaquil Airport station (1962–2012). By observing records of Divino Niño station (2014–2015) in Duran, a similar type of event occurred during 452 min (7 h 32 min) between April 3 and 4 (2015) reaching 106 mm of precipitation. However, this rainfall began 3 h before the occurrence of the maximum tide (between the ebb and the flow tide). In order to obtain the maximum flooded area, a simulation was carried out with the 2-year rain estimated from Guayaquil Airport station, beginning 71 min after the occurrence of maximum tide (between the flow and the ebb tide).
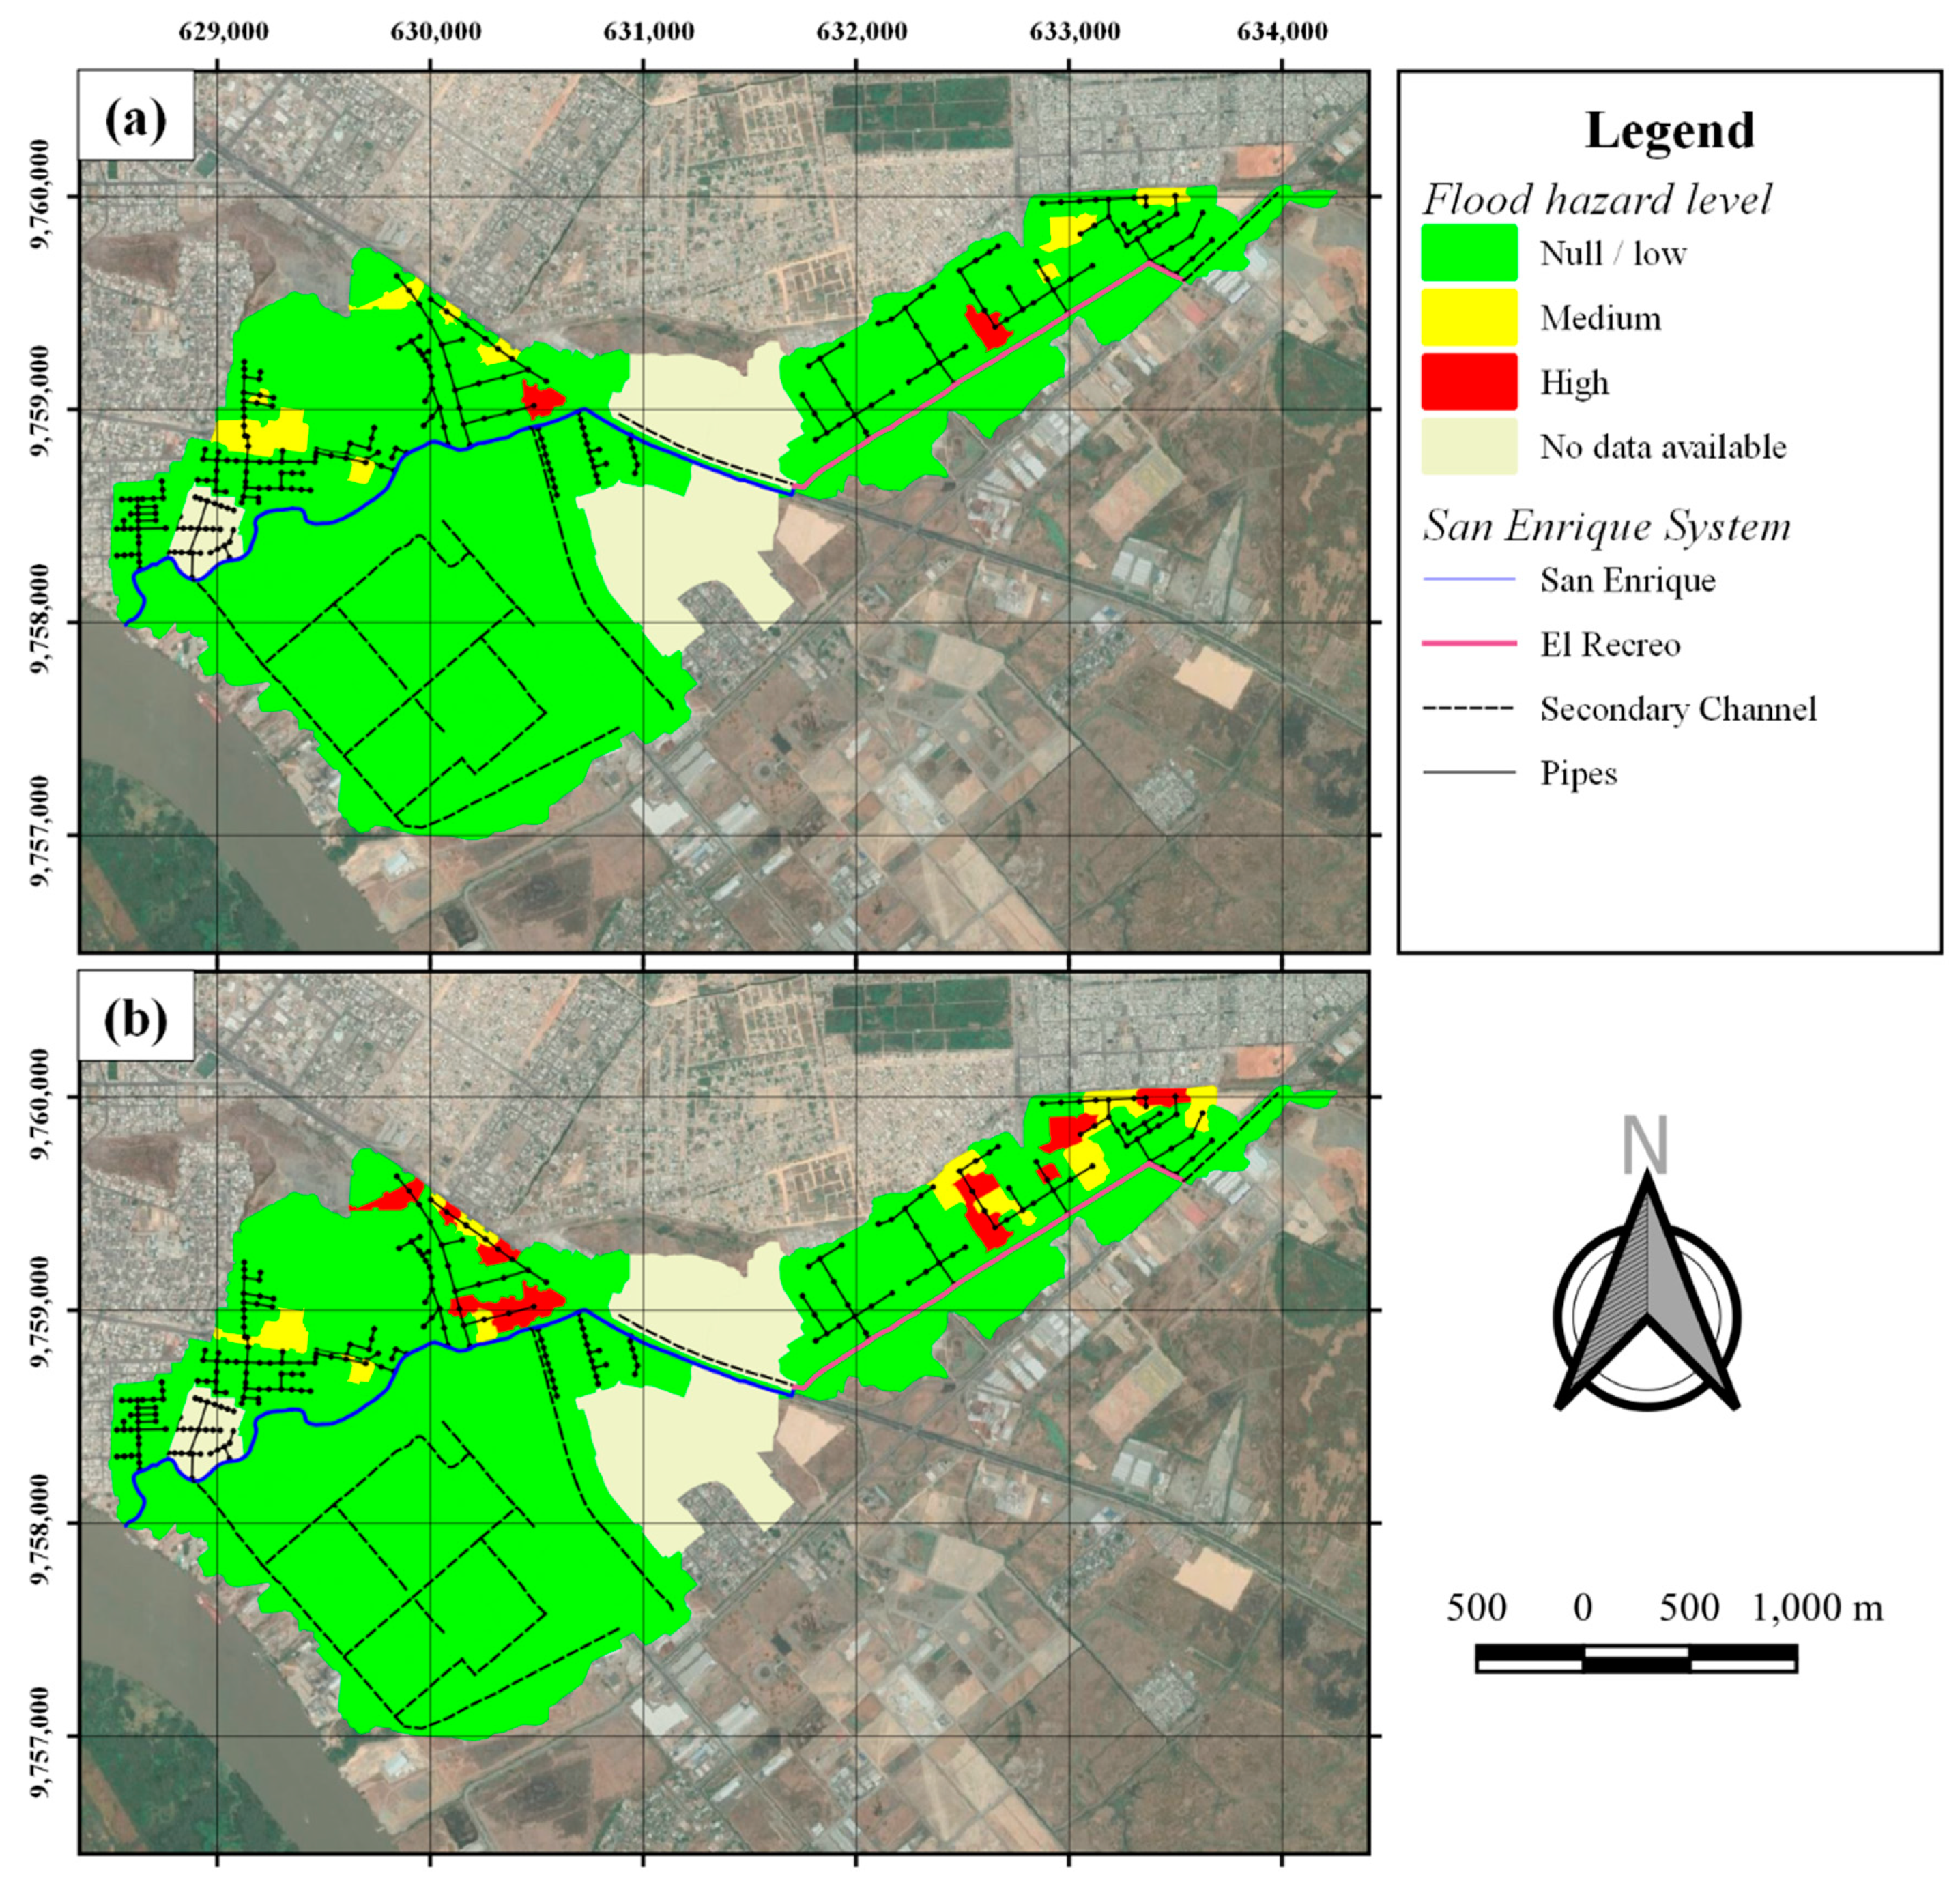
Simulation results showed that 2 sites present high flooding hazard (less than 1% of total drainage area) and 9 sites have medium level hazard involving 2.7% of study area (
Figure 8a). For a 5-year event (usual engineering design requirement), areas with high hazard increased mainly in
El Recreo area and at the north western part of
San Enrique catchment, which represents 3.1% of total area. The medium hazard zone represents a similar percentage of the total drainage area (
Figure 8b). Noteworthy is that El Recreo is a low, flood-prone area in itself, due to its topographic level (below the Guayas River).
4. Discussion
4.1. Modelling Results
The model required geographic and geometric information about pipes (invert levels, slopes, materials), channels, manholes and storage areas. Data requirements for model application are intensive and, spatially extensive. Unfortunately, in general, municipalities do not collect systematically and reliably this kind of information (including other aspects, such as DEMs). Therefore, to develop an urban data platform linked to a geographic information system, with topographic and hydrological information should be an initial process to perform flood management.
Previous research applying SWMM has pointed out that the most relevant variables for model performance are land use, roughness coefficient estimation, model mesh resolution, energy losses along pipes, overland flow exchange, and DEM resolution [
26,
27,
28]. In current study, modelled flood depths showed to be very sensitive to changes in maximum ponded area above ground on each evaluated manhole of the stormwater network. Modelled results showed a strong relationship between ponded area and ponded depth above the manhole (r
2 > 0.9). Therefore, for calibration purposes, an approximate value for ponded area could be estimated on frequent flooded zones by estimating water depths from observable reference points on photographical records. Maximum ponded areas, in sectors with no reported flooding conditions, were estimated from street geometry (street elevations, road-curb size and curb height) on city maps.
4.2. Policy Implications for Disaster Risk Reduction and Climate Resilience Plans
Duran is a typical coastal intermediate city in which urban and informal development occupied wetlands and lowland areas. Such scenario have, undoubtedly, increase the vulnerability and hazard, as well as the frequency of flooding, where nowadays, a simple 2 years precipitation event may cause noticeable damages along the stormwater system and channel areas [
5]. Therefore, urban land use planning and flooding risk reduction would need to consider a multifactorial approach to increase the city resilience towards climate change [
29]. Integrated flood and drainage management, and natural systems protection or restoration are measures that can be implemented on the urban land planning and climate adaptation plans [
29,
30].
Decision making on flood control and drainage on the coastal cities of Ecuador rely mostly on traditional grey infrastructure considering the design rain storm for 5-year return period. The modelling results obtained for Duran shows that pipe design based on 5-year return period may not be enough to avoid flooding in certain areas. Increasing the design period could result in significant increase in budget for new stormwater infrastructure. Therefore, implementation of green-blue infrastructure (Nature-based solutions) should be enforced to complement flood management, thus saving costs and being environmentally friendly.
5. Conclusions
The present model results were mainly the estimation of frequent flooded areas in the Duran city (lower part of the Guayas River Basin), considering pluvial and tide forcing. Despite data limitations, and considering effects due to climate crisis in a near future, medium and high flooding hazard zones estimated for 5-year scenario are in real threat because current design is not enough to convey higher volumes. This situation can be worsened for extreme precipitation events (e.g., ENSO), or whether sea level rises far beyond current levels (higher tides may cause some areas in the system).
Anthropogenic factors such as increasing impervious surface and waste accumulation are expected to increase flood conditions (height and duration), as some buffer areas (e.g., grassland and natural wetlands) are increasingly and informally being populated. To increase the city resilience, authorities and stakeholders should work together towards: (i) A better understanding on the social-ecological drivers of urban flood hazard and risk, (ii) more operational urban measures and sensors networks for continuous monitoring and spatial data collection of water stages and velocities (crowdsourcing), and (iii) to improve hydro-meteorological modelling for developing flood early warning system at city level. Data collection should also be complemented with state-of-the-art but not costly devices. In that context, currently operational security cameras could be used as real-time monitoring system for flooding events, with little control adjustments by either the Municipality or the National Security Integrated system (911), especially in those flood-prone districts.
A suggestion for further model development lies on working with clogging scenarios in specific zones. Yet another mitigation measure can be to allocate water volumes in specific and designated areas (during extreme events), where public-private alliance may become of utmost utility. In lieu of climate change, other long-time measures such as increase in mangrove coverage in the estuarine area, could be useful to reduce spring tides flooding.
Author Contributions
Conceptualization, D.M., M.A.-H. and M.J.B.-C.; methodology, M.A.-H. and D.M.; validation, M.A.-H. and D.M.; formal analysis, D.M.; investigation, M.A.-H. and D.M.; resources, M.J.B.-C. and M.d.P.C.-R.; data curation, D.M.; writing—original draft preparation, D.M., M.A.-H. and M.J.B.-C.; writing—review and editing, all authors; visualization, D.M.; funding acquisition, M.J.B.-C. and M.d.P.C.-R. All authors have read and agreed to the published version of the manuscript.
Funding
This research was funded by the Government of the Municipality of Duran, Ecuador and the Escuela Superior Politecnica del Litoral (ESPOL), as part of the project Climate Resilience for Duran: Strategies to reduce vulnerability to hydroclimatic risks (RESCLIMA) implemented by the Pacific International Centre for Disaster Risk Reduction (CIP4DRR) at ESPOL.
Acknowledgments
The authors acknowledge the participation of Melanie Jara-Cervigón as research assistant.
Conflicts of Interest
The authors declare no conflict of interest.
Appendix A
Photograph Records along San Enrique Stormwater System
Figure A1.
Examples of photographs records used to calibrate the model located at different neighbourhoods within San Enrique catchment. It is shown the neighbourhood boundaries, not the catchment. On-site photos were provided courtesy of Municipality of Duran.
Figure A1.
Examples of photographs records used to calibrate the model located at different neighbourhoods within San Enrique catchment. It is shown the neighbourhood boundaries, not the catchment. On-site photos were provided courtesy of Municipality of Duran.
Figure A2.
Maps showing the first two segments of San Enrique channel where adjusted Manning coefficient is (a) 0.092 and (b) 0.080. These segments present higher sinuosity and larger cross section than the rest of channels in the system.
Figure A2.
Maps showing the first two segments of San Enrique channel where adjusted Manning coefficient is (a) 0.092 and (b) 0.080. These segments present higher sinuosity and larger cross section than the rest of channels in the system.
References
- Liu, J.; Niyogi, D. Meta-analysis of urbanization impact on rainfall modification. Sci. Rep. 2019, 9, 1–14. [Google Scholar] [CrossRef] [PubMed]
- Lorenz, J.M.; Kronenberg, R.; Bernhofer, C.; Niyogi, D. Urban rainfall modification: Observational climatology over Berlin, Germany. J. Geophys. Res. Atmos. 2019, 124, 731–746. [Google Scholar] [CrossRef]
- Song, J.; Li, W. Linkage between the environment and individual resilience to urban flooding: A case study of Shenzhen, China. Int. J. Environ. Res. Public Health 2019, 16, 2559. [Google Scholar] [CrossRef] [PubMed]
- Park, K.; Lee, M.-H. The development and application of the urban flood risk assessment model for reflecting upon urban planning elements. Water 2019, 11, 920. [Google Scholar] [CrossRef]
- e Sousa, R.D.; Miranda, O.L. Incorporating wetlands in hydrologic and hydraulic models for flood zone delineation: An application to Durán, Ecuador. Int. J. Disaster Risk Reduct. 2018, 28, 375–383. [Google Scholar] [CrossRef]
- Dodman, D.; Bicknell, J.; Satterthwaite, D. Adapting Cities to Climate Change: Understanding and Addressing the Development Challenges; Routledge: Abingdon, UK, 2012; ISBN 1136572538. [Google Scholar]
- Romero-Lankao, P.; Qin, H.; Borbor-Cordova, M. Exploration of health risks related to air pollution and temperature in three Latin American cities. Soc. Sci. Med. 2013, 83, 110–118. [Google Scholar] [CrossRef] [PubMed]
- Solecki, W.D.; Setayesh, P.M.; Friedman, E. Policy legacies of extreme events: Hazards experience, institutional memory and governance structure and the response to Tropical Storms Irene and Lee and Hurricane Sandy. AGUFM 2019, 2019, PA53C-20. [Google Scholar]
- Roccati, A.; Faccini, F.; Luino, F.; De Graff, J.V.; Turconi, L. Morphological changes and human impact in the Entella River floodplain (Northern Italy) from the 17th century. Catena 2019, 182, 104122. [Google Scholar] [CrossRef]
- Noh, S.J.; Lee, J.-H.; Lee, S.; Seo, D.-J. Retrospective dynamic inundation mapping of hurricane harvey flooding in the houston metropolitan area using high-resolution modeling and high-performance computing. Water 2019, 11, 597. [Google Scholar] [CrossRef]
- Wang, Y.; Chen, A.S.; Fu, G.; Djordjević, S.; Zhang, C.; Savić, D.A. An integrated framework for high-resolution urban flood modelling considering multiple information sources and urban features. Environ. Model. Softw. 2018, 107, 85–95. [Google Scholar] [CrossRef]
- INEC. National Report on Census of Population and Housing in Ecuador; Vera Vera, C.E., Ferreira Salazar, C.A., Santos Rizzo, M.P., Merino Melendres, M.M., Padilla Silva, D.M., Llamuca Benalcazar, J.M., Rivas Sanmartín, R.I., Zambrano Faican, J.C., de Carlos Guerrero Oleas, L., Eds.; Instituto Nacional de Estadísticas y Censos del Ecuador: Quito, Ecuador, 2010; ISBN 9789942073266. [Google Scholar]
- Arias-Hidalgo, M.; Villa-Cox, G.; Griensven, A.V.; Solórzano, G.; Villa-Cox, R.; Mynett, A.E.; Debels, P. A decision framework for wetland management in a river basin context: The “Abras de Mantequilla” case study in the Guayas River Basin, Ecuador. Environ. Sci. Policy 2013, 34, 103–114. [Google Scholar] [CrossRef]
- Delgado, A. Guayaquil. Cities 2013, 31, 515–532. [Google Scholar] [CrossRef]
- GAD_Duran Master Plan of City Development 2015; Municipality of Duran: Duran, Ecuador, 2015.
- INAMHI. National Meteorological Records; National Meteorology and Hydrology Institute: Quito, Ecuador, 2018. [Google Scholar]
- Rossman, L.A.; Huber, W. Storm Water Management Model, User’s Manual Version 5.1; National Risk Management Research Laboratory, Office of Research and Development, US Environmental Protection Agency: Cincinnati, OH, USA, 2015; EPA600/R-14/413B.
- Rossman, L.A.; Huber, W. Storm Water Management Model, Reference Manual Volume I—Hydrology; National Risk Management Research Laboratory, Office of Research and Development, US Environmental Protection Agency: Cincinnati, OH, USA, 2016; EPA600/R-15/162A.
- Rossman, L.A. Storm Water Management Model, Reference Manual Volume II—Hydraulics; National Risk Management Research Laboratory, Office of Research and Development, US Environmental Protection Agency: Cincinnati, OH, USA, 2017; EPA600/R-17/111.
- Revised Master Plan for Potable Water, Wastewater and Stormwater Systems in Guayaquil City; Interagua—Municipality of Guayaquil: Guayaquil, Ecuador, 2016. (In Spanish)
- Cowan, W.L. Estimating hydraulic roughness coefficients. Agric. Eng. 1956, 37, 473–475. [Google Scholar]
- Te Chow, V.; Maidment, D.R.; Larry, W. Mays. Applied Hydrology; McGraw Hill India: New Delhi, India, 2010; ISBN 9780070702424. [Google Scholar]
- Schwab, G.O.; Fangmeir, D.D.; Elliot, W.J.; Frevert, R.K. Soil ang Water Conservation Engineering, 4th ed.; John Wiley & Sons. Inc: New York, NY, USA; Toronto, ON, Canada, 1992; ISBN 9780471574903. [Google Scholar]
- Arcement, G.J.; Schneider, V.R. Guide for Selecting Manning’s Roughness Coefficients for Natural Channels and Flood Plains; US Geological Survey: Denver, CO, USA, 1989. [CrossRef]
- Pregnolato, M.; Ford, A.; Glenis, V.; Wikinson, S.; Dawson, R. Impact on climate change on disruption to urban transport networks from pluvial flooding. J. Infrastruct. Syst. 2017, 23. [Google Scholar] [CrossRef]
- Barco, J.; Wong, K.M.; Stenstrom, M.K. Automatic calibration of the US EPA SWMM model for a large urban catchment. J. Hydraul. Eng. 2008, 134, 466–474. [Google Scholar] [CrossRef]
- Krebs, G.; Kokkonen, T.; Valtanen, M.; Koivusalo, H.; Setälä, H. A high resolution application of a stormwater management model (SWMM) using genetic parameter optimization. Urban Water J. 2013, 10, 394–410. [Google Scholar] [CrossRef]
- Xu, Z.; Xiong, L.; Li, H.; Xu, J.; Cai, X.; Chen, K.; Wu, J. Runoff simulation of two typical urban green land types with the Stormwater Management Model (SWMM): Sensitivity analysis and calibration of runoff parameters. Environ. Monit. Assess. 2019, 191, 343. [Google Scholar] [CrossRef] [PubMed]
- Kirshen, P.; Aytur, S.; Hecht, J.; Walker, A.; Burdick, D.; Jones, S.; Fennessey, N.; Bourdeau, R.; Mather, L. Integrated urban water management applied to adaptation to climate change. Urban Clim. 2018, 24, 247–263. [Google Scholar] [CrossRef]
- Shen, Y.; Morsy, M.M.; Huxley, C.; Tahvildari, N.; Goodall, J.L. Flood risk assessment and increased resilience for coastal urban watersheds under the combined impact of storm tide and heavy rainfall. J. Hydrol. 2019, 579, 124159. [Google Scholar] [CrossRef]
| Publisher’s Note: MDPI stays neutral with regard to jurisdictional claims in published maps and institutional affiliations. |
© 2020 by the authors. Licensee MDPI, Basel, Switzerland. This article is an open access article distributed under the terms and conditions of the Creative Commons Attribution (CC BY) license (http://creativecommons.org/licenses/by/4.0/).
