Article

Investigation of the Wastewater Treatment Plant Processes Efficiency Using Statistical Tools

1
Department of Sanitary Engineering and Water Management, Faculty of Environmental Engineering and Land Surveying, University of Agriculture in Cracow, 30-059 Cracow, Poland
2
Department of Water Supply, Sewerage and Environmental Monitoring, Faculty of Environmental and Power Engineering, Cracow University of Technology, 31-155 Cracow, Poland
*
Author to whom correspondence should be addressed.
Sustainability 2020, 12(24), 10522; https://doi.org/10.3390/su122410522
Submission received: 10 November 2020 / Revised: 10 December 2020 / Accepted: 14 December 2020 / Published: 16 December 2020
(This article belongs to the Special Issue Feature Paper on Sustainability Wastewater Management)

Abstract

:
The paper presents modelling of wastewater treatment plant (WWTP) operation work efficiency using a two-stage method based on selected probability distributions and the Monte Carlo method. Calculations were carried out in terms of sewage susceptibility to biodegradability. Pollutant indicators in raw sewage and in sewage after mechanical treatment and biological treatment were analysed: BOD5, COD, total suspended solids (TSS), total nitrogen (TN) and total phosphorus (TP). The compatibility of theoretical and empirical distributions was assessed using the Anderson–Darling test. The best-fitted statistical distributions were selected using Akaike criterion. Performed calculations made it possible to state that out of all proposed methods, the Gaussian mixture model (GMM) for distribution proved to be the best-fitted. Obtained simulation results proved that the statistical tools used in this paper describe the changes of pollutant indicators correctly. The calculations allowed us to state that the proposed calculation method can be an effective tool for predicting the course of subsequent sewage treatment stages. Modelling results can be used to make a reliable assessment of sewage susceptibility to biodegradability expressed by the BOD5/COD, BOD5/TN and BOD5/TP ratios. New data generated this way can be helpful for the assessment of WWTP operation work and for preparing different possible scenarios for their operation.

1. Introduction

Systematic control of the sewage quality at the outflow from a wastewater treatment plant (WWTP) is one of the elements of its proper operation. Control of the pollutant indicators in the sewage discharged into the natural environment makes it possible to assess the efficiency and the reliability of WWTP operation work. In addition, investigation of sewage quality after mechanical and biological treatment processes allow us to assess whether WWTP facilities or technological lines function properly. The subsequent stages of sewage treatment at mechanical and biological WWTPs have a clearly defined purpose: the elimination of a specific group of pollutants to the required level. For example, according to Dadrasnia et al. [1], at the mechanical treatment stage, in addition to 50–60% reduction of total suspended solids, a 20–30% reduction of organic impurities expressed by BOD5 may be achieved. After the removal of mainly solid impurities in mechanical line facilities of a WWTP, sewage undergoes biological processes. However, these give the required effect only if the right conditions for nitrification, denitrification and dephosphatation processes are ensured. The efficiency of these processes depends on technical solutions of the WWTP facilities and treatment technologies used. Therefore, advanced research on WWTP operation facilities (e.g., hydrodynamic behaviour of biological reactors and residence time distribution (RTD) analysis [2]), is still being performed.
Knowledge about the values of pollutant indicators in sewage, e.g., BOD5, COD, total nitrogen and total phosphorus, in addition to the control purposes, makes it possible to determine the mutual proportions between them. This in turn is useful for the assessment of sewage susceptibility to biodegradability. Many research papers indicate that the typical value of one sewage biodegradability indicator (BOD5/COD) for municipal raw sewage is 0.3–0.8; for sewage after mechanical treatment in the primary settling tanks it is usually 0.4–0.6 and the quotient of BOD5 and COD in treated sewage is 0.1–0.3. A low BOD5/COD quotient indicates non-decomposable matter, while raw sewage with a BOD5/COD ratio higher than or equal to 0.5 is considered as easily biodegradable. While the aim of treatment processes is to decrease the BOD5/COD ratio, values of this indicator below 0.3 in untreated sewage may indicate the presence of toxic substances. These inhibit the biological activity of microorganisms; the source of them are industrial sewage [3,4,5]. For an assessment of sewage susceptibility to biodegradability, for example, the measures of sewage biodegradability provided by Tomašić and Zelić [5] or by Srinivas [6] can be used. Tomašić and Zelić [5] state that for BOD5/COD > 0.5, sewage is easily biodegradable, for the range of 0.4–0.5, sewage is characterized by medium susceptibility to biodegradability, a value of 0.2–0.4 indicates a weak and slow biodegradation process while a BOD5/COD < 0.2 indicates non-decomposable matter. In turn, Srinivas [6] determines sewage susceptibility to biodegradability as follows: sewage with BOD5/COD > 0.6 is considered biodegradable and can be effectively treated as a result of naturally occurring biological processes. For BOD5/COD in the range of 0.3–0.6, due to the slow biodegradation process, it is necessary to consider supporting biological treatment by adding appropriate bacterial strains. In turn, for a BOD5/COD less than 0.3, sewage is not susceptible to biological treatment.
Because the content of easily assimilable carbon influences the course of biogenic compounds’ removal, determination of the BOD5/TN and BOD5/TP ratios is also important. Using these ratios, it is possible to assess sewage susceptibility to the biological nitrogen reduction by denitrification process and phosphorus reduction by dephosphatation process. According to Jansen et al. [7], an optimum value of the BOD5/TN ratio for biological processes should be at least 4. However, for the BOD5/TP ratio, it is at least 20 [7,8]. If these values are not achieved, in order to optimize the denitrification and dephosphatation processes, it may be necessary to dose an organic carbon or use chemical phosphorus precipitation methods.
Many research studies regarding WWTP operation efficiency have been conducted so far. Among them, analysis of sewage treatment effectiveness at two-stage-operated WWTPs was presented by some authors [9,10,11,12,13]. Similarly, the papers related to the assessment of sewage susceptibility to biological decomposition can be found in the literature [3,10,11,12,13,14,15]. The results presented in such papers may be very useful for WWTP operators. However, it should be emphasized that all studies relate to the current state of a given WWTP facilities operation. Hence, from the point of view of the further WWTP’s operation, undoubtedly useful tools would be based on the simulations of WWTP operation in the next sewage treatment stages. Previous studies on the use of mathematical methods mainly concern the simulation of pollutants concentration in effluent at the WWTP outflow. In the case of methods using probability distributions, a specific form of probability distribution was additionally assumed, e.g., Normal or Weibull distribution [16,17,18,19]. It should be emphasized that this is a major generalization, because pollutant indicators are not specifically defined. Thus, they can usually be described with more than one probability distribution. Therefore, using this approach, the best-fitted functions should be selected from the group of the candidate distributions.
Considering the above, the authors of this paper undertook to develop a model simulating the effectiveness of WWTP operation work in terms of pollutants reduction in the subsequent stages of mechanical and biological treatment. The proposed model is based on the empirical data and includes two stages: selection of the best-fitted probability distribution and simulation of the pollutant indicator values. The implementation of such a model based on a multi-distribution analysis for investigation of pollutant reduction after mechanical and biological treatment is indicated as a novelty aspect of this study.

2. Case Study

The research was carried out based on one of the WWTPs located in Cracow (Poland). The analysed WWTP receives sewage both from industrial plants and individual users; it has adapted the two-stage processes of sewage treatment along with the full thermal utilization of sewage sludge. Hydraulic capacity of the biological line facilities is 328,000 m3/d and the average daily flow is set at 165,000,000 m3/d; these operate for a population of 780,000. Figure 1 shows the localization of the WWTP along with a simplified scheme of the mechanical and biological technological lines.
Mechanical sewage treatment takes place firstly on wide and dense screens, then in three horizontal grit chambers and in four preliminary settling tanks. In the next stage, sewage is subjected to biological treatment in five bioreactors operating in activated sludge technology. Before effluent is discharged into the environment from each of the five biological reactors, sewage flows through the secondary settling tanks; activated sludge is separated there and effluent is clarified. The treated sewage receiver is the Drwina River (inflow of the Vistula River) (Figure 1).

3. Methodology

The basis of the study was the observational data series of the pollutant indicators, which consisted of 44 elements, both for raw sewage and for sewage after mechanical treatment and biological treatment. These included biochemical five-day oxygen demand (BOD5), chemical oxygen demand (COD), total suspended solids (TSS), total nitrogen (TN) and total phosphorus (TP). The study was carried out in several stages: preliminary statistical data analysis, selection of the best-fitted theoretical distributions to the empirical distributions, modelling of the pollutant indicator values in raw sewage and in sewage after mechanical treatment and biological treatment along with the analysis of the accuracy of the two-stage treatment process and the assessment of sewage susceptibility to biodegradability.

3.1. Preliminary Statistical Data Analysis

As a part of the preliminary data analysis of the pollutant indicators observational data series in raw sewage and in sewage after mechanical treatment and biological treatment, the following descriptive statistics were determined: location measures (minimum, maximum, mean) and dispersion measures (standard deviation S, coefficient of variation Cs).

3.2. Analysis of the Best-Fitted Theoretical Distributions

Based on the observational data series of pollutant indicators, an attempt was made to determine the best-fitted theoretical distributions for the empirical distributions. The following theoretical distributions were considered in the group of candidate probability distributions: general extreme values (GEV), Gaussian mixture model (GMM), log-normal, normal, triangular and Weibull. The group of the candidate probability distributions, first of all, was created based on their common use of the description of the continuous random variables. Because of the properties of these probability distributions, they can be applied for analysis of the water and sewage facilities operation [19]. Moreover, as it can be seen in the literature studies, besides normal and Weibull distribution [16,17,18,19], in water and wastewater sciences, studies of application and the possibility of using the other distributions can be found in the papers of Coronado-Hernández et al. [20] (GEV), Fan et al. [21] and Sun et al. [22] (GMM), Oliveira et al. [23] and Van Buren et al. [24] (log-normal) and Wang and Ran [25] (triangular).
Probability distributions considered in this paper are described by Equations (1)–(8) as follows [26,27,28,29,30,31]:
GEV distribution:
f ( x ) = α 1 e [ ( 1 κ ) y e y ]
y = κ 1 log { 1 κ ( x ξ ) α } ,   κ 0
y = ( x ξ ) α ,   κ = 0
where κ is the shape parameter, α is the scale parameter, ξ is the location parameter.
GMM distribution:
f ( x ) = k = 1 K ω k N P ( x , 0 P , Σ k )
where K is the number of components, ω k is weights such that Σ k ω k = 1 , N P ( 0 P , Σ k ) is a multi-variate Gaussian distribution.
Log-normal distribution:
f ( x ) = 1 x σ Y 2 π e [ 1 2 σ Y 2 ( ln ( x ) μ Y ) 2 ]
Normal distribution:
f ( x ) = 1 σ 2 π e [ 1 2 σ 2 ( x μ ) 2 ]
where σ2 is the variance, μ is the mean.
Triangular distribution:
f ( x ) = { 2 ( x a ) ( b a ) ( m a )   for   a x m 2 ( b x ) ( b a ) ( m a )   for   m x b
where a is the lower limit, m is the mode, b is the upper limit.
Weibull distribution:
f ( x ) = ( κ α ) ( x ) κ 1 e ( x α ) κ
where κ is the shape parameter, α is the scale parameter.
The compatibility of theoretical distributions with the empirical distributions of pollutant indicators was assessed using the Anderson–Darling test (A–D). The proposed statistic is sensitive in the whole distribution range. Moreover, by using it, it is more likely that some differences between distributions will be detected, if any appear. Therefore, it gives better compatibility assessment compared to the other tests. The hypothesis H0 of this test states the compatibility of theoretical distribution with empirical distribution, while the alternative hypothesis H1 indicates a lack of the distribution’s compatibility. The calculations were carried out for a significance level of α = 0.05. The Anderson–Darling statistic is described by the following dependence [32,33,34]
A D = n i = 1 n ( 2 i 1 ) ln ( F ( X i ) ) + ln ( 1 F ( X n + 1 i ) ) n
where n is the number of the observations, F is the theoretical cumulative distribution, Fn is the empirical cumulative distribution.
Because the critical values of the A–D statistic depend on the type of probability distribution being tested, the hypotheses were verified based on the p-values. If the obtained p-value was less than the significance level α = 0.05, then the hypothesis H0 was rejected in favour of the alternative hypothesis H1.

3.3. Selection of the Best-Fitted Theoretical Distributions

If the random variables supported many hypotheses of the empirical distributions (i.e., it was possible to describe them using more than one theoretical distribution), then the best-fitted theoretical distributions to the empirical distributions were determined using Akaike criterion (AIC) (Equation (10) [35]). The best-fitted theoretical distribution to the empirical distribution of the random variables is this one, for which minimum values of AIC criterion are obtained.
A I C = 2 k + n log ( R M S E 2 )
where k is the numbers of distribution parameters, n is the sample size, RMSE is the root mean square error.

3.4. Modelling of the Pollutant Indicator Values

Modelling of the pollutant indicator values was performed using the Monte Carlo method. The essence of this method is to use a series of random numbers to build a sample from the hypothetical population. Based on this, it is possible to determine statistical estimators of the distribution parameters. In practice, this is a creation of the stochastic model describing a specific phenomenon. Then, this model is implemented again using randomly generated variables (in compliance with the considered probability distribution), and next, statistical analysis of the obtained results is conducted.
The Monte Carlo model can be described as follows: In order to determine value m, random variable ξ is assumed such that = m and dispersion is finite. For N independent values of random variables ξ1, ξ2, …, ξ3, it can be determined, as Equation (11) shows:
m 1 N j = 1 N ξ j
The above estimation is known as the Monte Carlo method of determined variable m. The accuracy of this method depends on dispersion . Generally the Monte Carlo method cannot define the calculation algorithm, because the random variables can be modelling in different ways, for example
ξ = g ( γ 1 , γ 2 . )
where g relates to the method used, γ1, γ2—simulated values.
In this paper, simulations were made for the best-fitted statistical distributions. In one simulation cycle, 365 random values of the pollutant indicators were generated. Then, each simulation cycle was repeated 100 times, and then, 24 pollutant indicators values were randomly selected from each of the 100 repetitions. Presented methodology was used for all of the five pollutant indicators considered in this study and in three sewage treatment stages (raw sewage, mechanically treated sewage, biologically treated sewage).

3.5. Simulation of the Sewage Quality Changes in Subsequent Treatment Stages

The results obtained by modelling were used for determination of the predicted minimum, maximum and mean values of BOD5, COD, total suspended solids (TSS), total nitrogen (TN) and total phosphorus (TP) in raw sewage and in sewage after mechanical treatment and biological treatment. Percentage reduction of each of the pollutant indicators in the subsequent treatment stages was also determined. Additionally, based on the Polish regulations [36], the quality of effluent was compared with the required sewage quality discharged to the natural environment.

3.6. Simulation of Sewage Susceptibility to Biodegradability

Simulated values of the pollutant indicators in raw sewage, in mechanically treated sewage and in biologically treated sewage enabled us to assess sewage susceptibility to biodegradability in each treatment stage. For this purpose, BOD5/COD (organic matter decomposition), BOD5/TN (nitrogen decomposition) and BOD5/TP (phosphorus decomposition) indexes were used. Biodegradability measures presented in the literature by Tomašić and Zelić [5] were used to assess the sewage susceptibility to organic compounds decomposition. The assessment of the nitrogen compounds’ decomposition efficiency was made in relation to the optimum values of the BOD5/TN ratio, as is provided by Jansen et al. [7]. In turn, as the measure of sewage susceptibility to effective dephosphotation, a minimum required ratio of BOD5/TP was used, as is presented by Janssen et al. [7] and Cooper et al. [8].

4. Results and Discussion

4.1. Preliminary Statistical Data Analysis

As a part of the preliminary data analysis, descriptive statistics including location measures and dispersion measures for the observational data series of pollutant indicators in raw sewage and in sewage after mechanical treatment and biological treatment were determined. The results of the analysis are presented in Table 1.
Based on the results summarized in Table 1, it was found that for BOD5, differences between the extreme values (minimum and maximum) were 84%, 72% and 94% for raw sewage, for sewage after mechanical treatment and for sewage after biological treatment, respectively. In the case of COD, these differences were similar. In turn, for total suspended solids (TSS), differences between the minimum and maximum values were definitely greater. They amounted to 91%, 90% and 98% for raw sewage and for sewage after mechanical treatment and biological treatment, respectively. In the case of biogenic compounds, differences between their extreme concentrations in sewage before treatment and in sewage after mechanical treatment and biological treatment were stated as follows: 71%, 70% and 80% (total nitrogen) and 83%, 77% and 96% (total phosphorous). It should be emphasized that the raw sewage quality inflowing to the analysed WWTP did not differ from the typical composition of municipal sewage in Southern Poland, as is indicated by Kaczor [37]. It was found that both in the case of TN and TP, their mean concentrations in mechanical-treated sewage were greater than in raw sewage. This can be explained by the fact that the raw sewage may contain previously not crushed suspended solids with nitrogen and phosphorus compounds. For a longer period of time, these compounds could have been released into the effluent; this could have resulted in increasing biogenic compounds concentration in the sewage [38]. The calculated values of the coefficients of variation Cs indicate the average variability of the raw sewage composition and sewage after mechanical treatment. In turn, in the case of the sewage after biological treatment, the pollutant indicators’ variability was much greater. This is characteristic of municipal sewage, as is demonstrated by the research carried out by Chmielowski et al. [10], Bugajski et al. [16], Kaczor et al. [39] and Wąsik and Chmielowski [40].

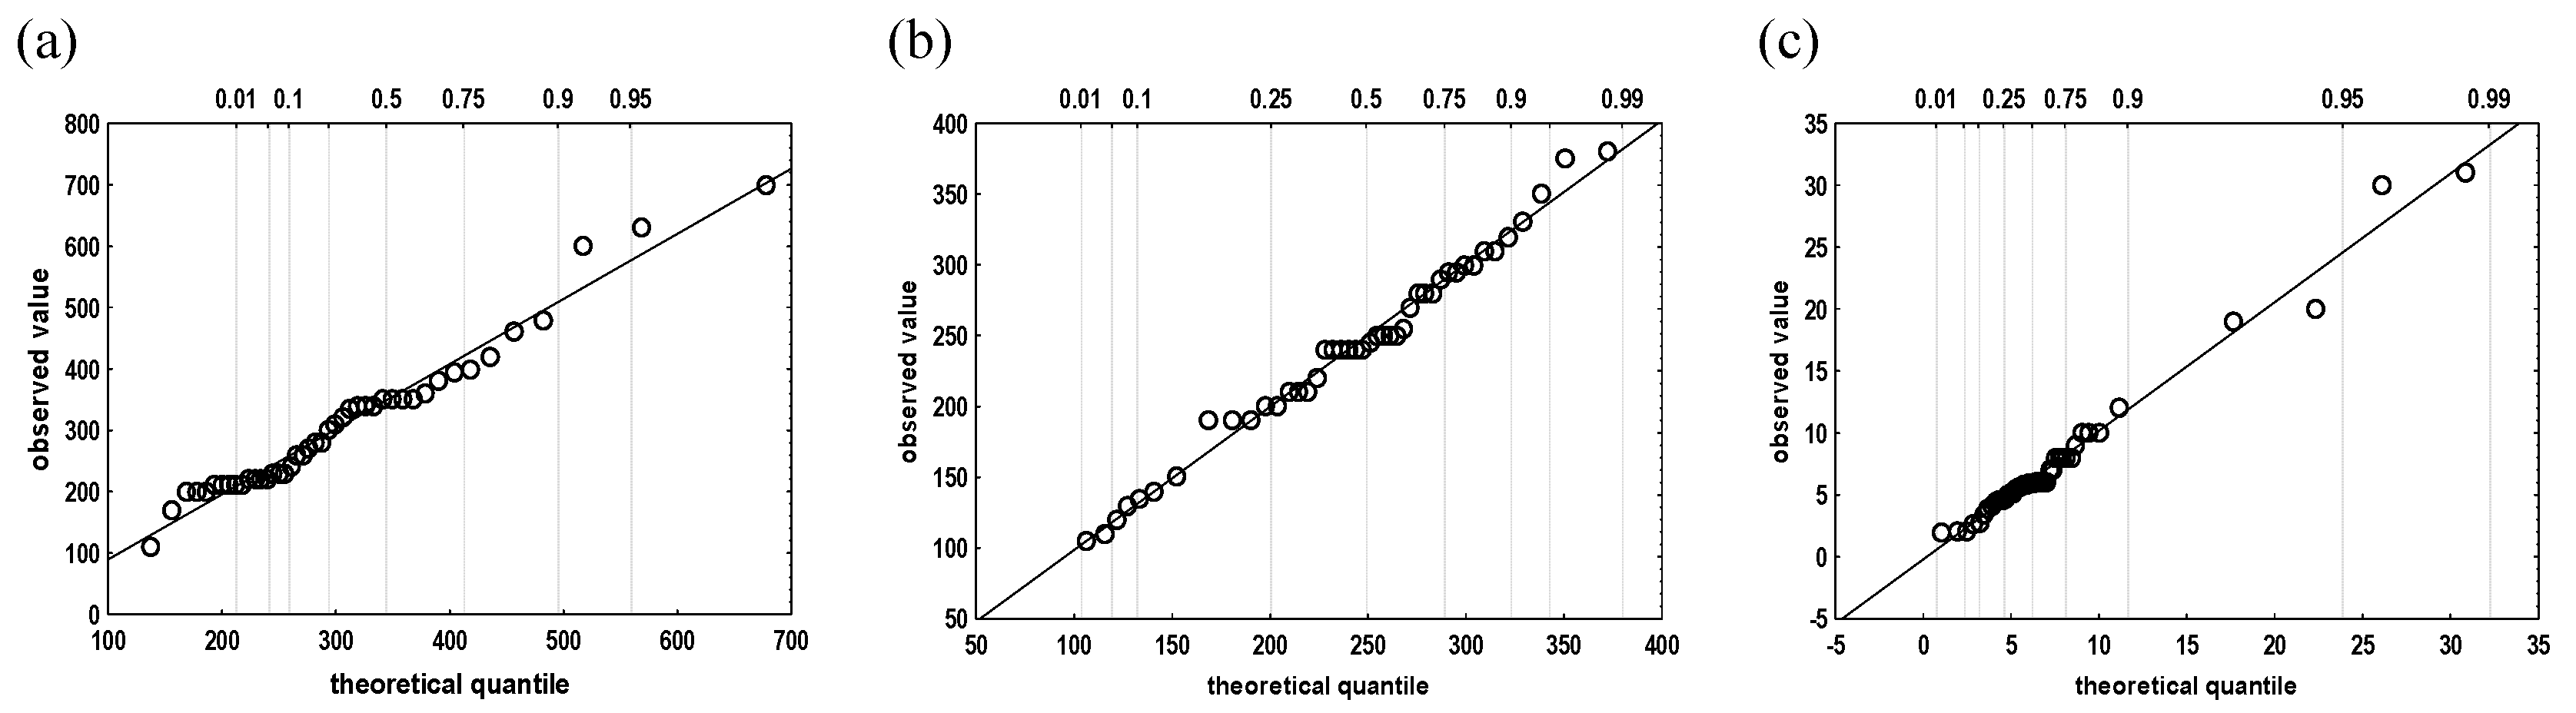
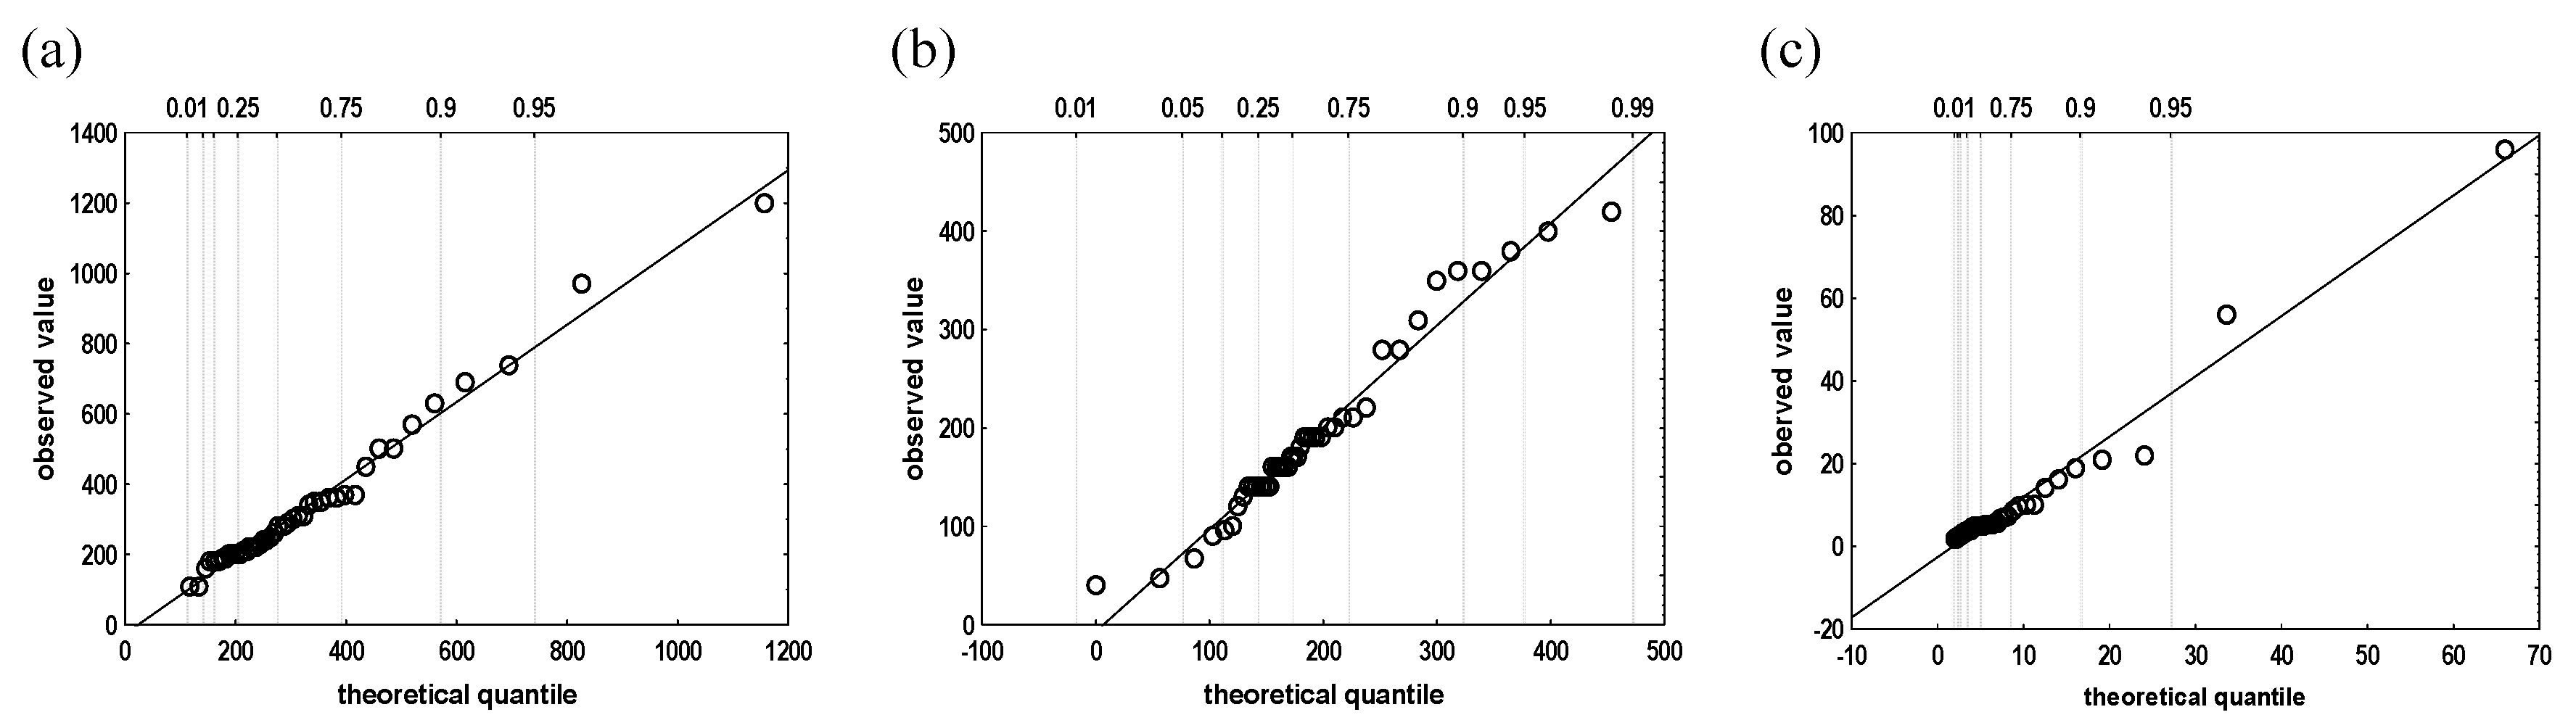
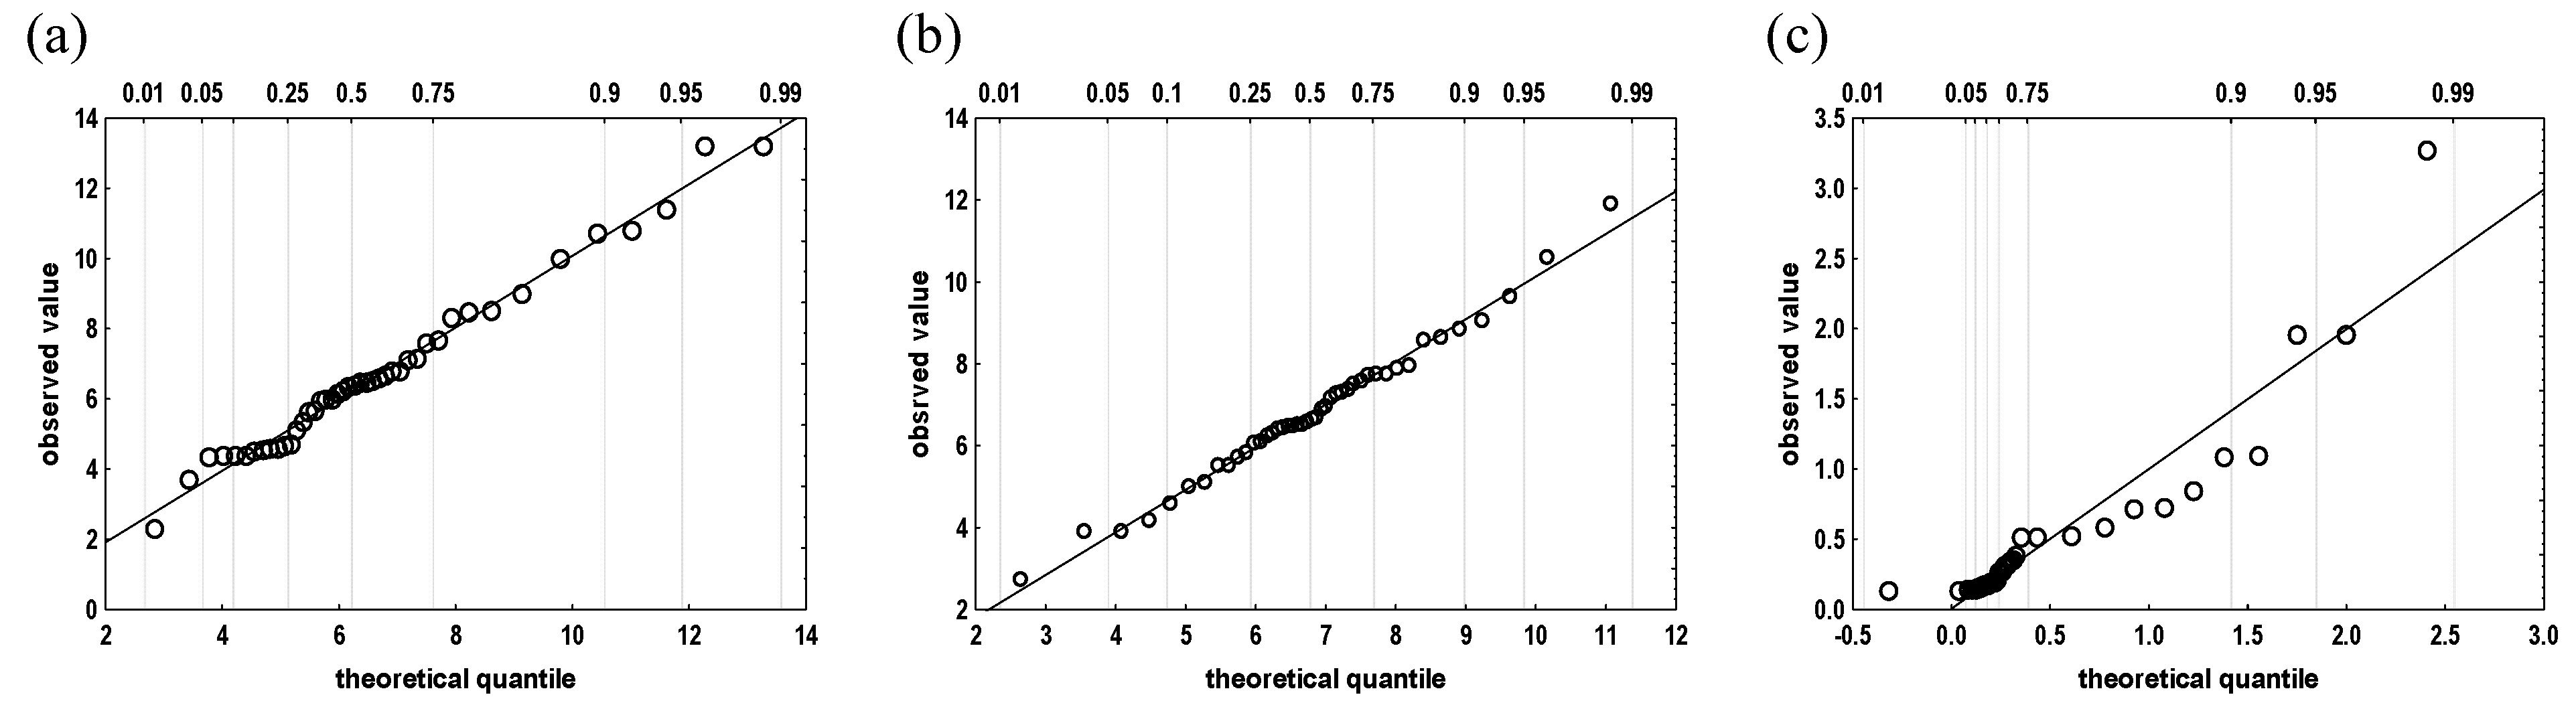
4.2. Verification of the Theoretical Probability Distributions

A compatibility verification of the theoretical and empirical pollutant indicator distributions was performed using the following candidate distributions: general extreme values (GEV), Gaussian mixture model (GMM), log-normal, normal, triangular and Weibull; for this purpose, the Anderson-Darling test (A-D) for the significance level of α = 0.05 was used. If the p-value was less than the assumed significance level, theoretical distribution was considered as not compatible with the empirical distribution. The results of the analysis are presented in Table 2.
As was shown in Table 2, the observational data series of the oxygen pollutant indicators (BOD5 and COD) in raw sewage and in sewage after mechanical treatment can be described using almost all of the analysed theoretical distributions (excluding the triangular distribution). In the case of sewage after biological treatment, the BOD5 and COD series cannot be described by normal and Weibull distributions additionally. In the case of total suspended solids (TSS), theoretical and empirical distributions for raw sewage and for sewage after mechanical treatment were not compatible with normal and triangular distributions. In the sewage after biological treatment, the possibility of using Weibull distribution has been additionally excluded. Independent of the treatment stages, TSS can be described using all the considered probability distributions. It was found that the empirical distributions of TP in raw sewage cannot be described using the triangular distribution and additionally using normal and Weibull distributions (sewage after biological treatment). In mechanically and biologically treated sewage, the total nitrogen observational data series can be described by all of the analysed functions. Conducted analysis showed that almost in every case, triangular distribution cannot be used for the description of the pollutant indicators observational data series. It should be emphasized that when triangular distribution compatibility with the empirical distributions has been found, for these, obtained p-values usually were on the limit level of the hypothesis H0 acceptability. The inability to use triangular distribution results from the properties of this function. As Pereira et al. [41] and Stein and Keblis [42] indicate, triangular distribution is a homogeneous function, characterized by a minimum value and the most likely maximum value. Sewage treatment is a dynamic process that is affected by many factors changing over time. Therefore, a high variability of the pollutant indicators in treated sewage can be noted. Hence, for triangular distribution, prediction of the most often repeated minimum and maximum values is difficult. In addition, it should be emphasized that in reality, very few types of random variables can be described using triangular distribution.

4.3. Selection of the Best-Fitted Probability Distribution

Because the previous results have shown that the observational data series of the pollutant indicators can be described using more than one theoretical distribution, the best-fitted distributions were selected using Akaike criterion (AIC). Calculations were carried out only for those functions for which criterion A-D confirmed theoretical and empirical distribution compatibility. As the best-fitted function, this one with the lowest AIC value was accepted. The results of the analysis are summarized in Table 3. Figure 2, Figure 3, Figure 4, Figure 5 and Figure 6 show quantile–quantile (Q-Q) charts for the best-fitted statistical distributions.
Table 3 shows that for BOD5, the best-fitted theoretical distribution in raw sewage was GEV distribution, while for the sewage after mechanical treatment and biological treatment, it was GMM distribution. Similarly, GMM distribution was the best for COD description in the case of raw sewage, mechanically treated sewage and biologically treated sewage. For the total suspended solids, it was noted that GEV distribution best describes TSS concentration in raw sewage and in sewage after biological treatment. GMM distribution turned out to be the best for mechanically treated sewage. By analysing the biogenic compounds concentrations, it was found that both for total nitrogen (TN) and for total phosphorous (TP), GMM distribution was the best-fitted function for sewage after each treatment stage. Obtained results made it possible to state that independently for the sewage treatment stages, GMM distribution described most of the pollutant indicators values in the best way (12 out of 15 cases) (Table 3). Similar results were presented by Młyński et al. [19]. The authors of the cited paper [19] also showed that GMM distribution is the best for pollutant indicator value descriptions. The possibility of using GMM distribution for the control of WWTP operation work has been presented by Bouzenad and Ramdani [43] and Yu [44] too.

4.4. Analysis of Expected Sewage Quality Changes after Mechanical and Biological Treatment

Simulated values of the BOD5 (Figure 7a) and COD (Figure 7b) indicate the right efficiency of the processes of organic pollutants removal. This proves that the operation work efficiency of the analysed WWTP is typical for two-stage operated facilities. It is expected that mechanical treatment may provide an average BOD5 and COD reduction of about 22%. In turn, as a result of mechanical and biological treatment, it is possible to achieve approximately 98% BOD5 reduction and almost 95% COD reduction (Table 4); these meet the Polish requirements [36] on minimum pollutant reduction. In addition, it is not supposed that even maximum values of COD after biological treatment (Figure 7b) could exceed the permissible level of 125.0 mg O2/L.
As the simulation results show, it is expected that mechanical treatment can provide a 40% reduction of total suspended solids (TSS), while as the final effect of the two-stage treatment, nearly 97% of TSS reduction can be achieved (Table 4). The average concentration of total suspended solids changed from approximately 329.0 mg/L (raw sewage), throughout about 197.0 mg/L (mechanically treated sewage), to 11.3 mg/L in biologically treated sewage (Figure 7c). This proves that the facilities of the WWTP technological line are properly adapted to the removal of total suspended solids.
Simulated values of total nitrogen (TN) and total phosphorus (TP) concentration in the subsequent sewage treatment stages (Figure 7d,e), like the other pollutant indicators, confirm the compliance of the statistical tools used with the efficiency of this type of facility. While as a result of the mechanical treatment, it is possible to achieve at most a few or several percent reduction in biogenic compounds, biological processes are largely responsible for the removal of nitrogen and phosphorus compounds. As can be seen (Figure 7d), in the sewage discharged from the considered WWTP, the amount of TN that exceeds the permissible concentration (10.0 mg/L), as defined by the regulations [36], may be periodically recorded. However, the percentage reduction of TN at the WWTP outflow (76.6%) (Table 4) meets the required TN reduction. The amount TP that exceeds the permissible TP concentration at the WWTP outflow also can be observed. Nevertheless, simulated average phosphorus concentration in treated sewage (Figure 7e) is 50% less than the limit value set at 1.0 mg/L [36].
The results presented in this paper correspond with the results presented in other authors’ papers, i.e., [10,11]. At the same time, it can be concluded that the model used correctly describes the changes in the sewage quality in the two-stage operated WWTP. Simulated values of the pollutant indicators in raw sewage and in sewage treated mechanically and biologically, as well as the percentage reduction, are typical for properly operated mechanical and biological WWTPs.

4.5. Assessment of Expected Sewage Susceptibility to Biodegradability

As the next stage of the study, based on the simulation results, the assessment of sewage susceptibility to the organic matter decomposition expressed by the BOD5/COD ratio was conducted. Obtained results indicate that both the composition of raw sewage and mechanically treated sewage will ensure a proper course of the biological processes of the organic matter removal; this is due to a high value of the biodegradability index (BOD5/COD = 0.5) (Figure 8). With reference to the literature data presented by Henze et al. [45], it can be stated that for municipal sewage, a BOD5/COD equal to 0.5 is the average value of this parameter. However, a BOD5/COD ratio after biological treatment of 0.2 proves that the facilities of the WWTP biological treatment line should ensure a high efficiency of.
Based on the obtained results it can be stated that the mutual proportions between the content of organic carbon and nitrogen compounds will provide the right conditions for the proper course of the denitrification process (Figure 8). This is demonstrated by the BOD5/TN ratio, whose value is greater than the minimum recommended by Jansen et al. [7]. Similarly, in order to achieve effective phosphorus compounds removal, during the dephosphatation process, it is necessary to ensure a BOD5/TP ratio of at least 20; in this case, it has been achieved. As the treatment stages proceed successively, it is expected that the BOD5/TN and BOD5/TP ratios will gradually decrease. After biological treatment processes, these values will be significantly lower compared with those of the raw sewage. Obtained results for the sewage after biological treatment, i.e., BOD5/TN = 0.5 and BOD5/TP = 14.3, indicate the depletion of the biodegradable substances and the cessation of further biogenic compounds degradation. In addition, based on Henze et al. [45], it can be stated that in municipal sewage, a BOD5/TN of 5 (Figure 8) belongs to the average range of typical values. In turn, a calculated value of the BOD5/TP of about 45 (Figure 8) for raw sewage, can definitely be considered as high.
Because the obtained results are compatible with the results presented e.g., by Chmielowski et al. [10] and Młyńska et al. [11], the accuracy of the statistical tools used in this paper for pollutant indicator simulation can be stated. The mutual proportions between pollutant indicators in subsequent treatment stages were similar to those presented by the authors of [10,11].

5. Summary and Conclusions

As the novelty aspect of this paper, a methodology for the simulation of WWTP effectiveness in terms of the pollutants reduction in the subsequent stages of mechanical and biological treatment can be indicated. Compared with other research, the proposed methodology is based on a multi-distribution analysis. Based on the empirical data, a two-stage statistical analysis was conducted: firstly, selection of the best-fitted probability distributions from the group of candidate distributions (GEV, GMM, log-normal, normal, Weibull and triangular), and then, a simulation of pollutant indicator values including BOD5, COD, total suspended solids (TSS), total nitrogen (TN) and total phosphorus (TP). Based on the selected theoretical distributions, a simulation using the Monte Carlo method was performed. The Anderson–Darling test showed that triangular distribution should not be used for a description of the pollutant indicators observational data series. Based on the Akaike criterion it was found that GMM distribution turned out to be the best-fitted statistical distribution.
Obtained simulation results prove that the statistical tools used in this paper accurately describe the changes of BOD5, COD, TSS, TN and TP values during sewage treatment. As it turned out, and as has been presented by the authors, the results of modelling can be used to make a reliable assessment of sewage susceptibility to the biological decomposition of organic matter and biogenic compounds. This is evidenced by the calculated values of the BOD5/COD, BOD5/TN and BOD5/TP ratios; these correspond with the typical values of properly operated mechanical and biological WWTPs.
To summarize, it can be stated that the two-step calculation method proposed as part of this paper can be an effective tool for predicting the course of WWTP processes, provided that an appropriate theoretical distribution of random variables is determined. As a result of this, it is possible to generate new data, maintaining existing correlation structures between variables. In terms of the proposed model application, the values generated this way can be helpful for the assessment of a WWTP’s operation and for preparing different possible scenarios for its operation. The ability to predict sewage quality in subsequent treatment stages makes the operating activities of the WWTP facilities easier and more effective.

Author Contributions

Conceptualization, D.M.; Methodology, D.M.; Software, D.M.; Validation, D.M., A.M.; Formal Analysis, D.M., A.M.; Investigation, D.M., A.M.; Resources, D.M.; Data Curation, D.M.; Writing—Original Draft Preparation, D.M., A.M.; Writing—Review and Editing, D.M., K.C., J.P.; Visualization, A.M.; Supervision, K.C., J.P.; Project Administration, D.M.; Funding Acquisition, K.C. All authors have read and agreed to the published version of the manuscript.

Funding

This research received no external funding.

Conflicts of Interest

The authors declare no conflict of interest.

References

  1. Dadrasnia, A.; Shahsavari, N.; Emenike, C.U. Wastewater treatment by biological methods. In Wastewater Engineering: Advanced Wastewater Treatment Systems; Aziz, H.A., Mojiri, A., Eds.; IJSR Publications: Penang, Malaysia, 2014; pp. 63–70. [Google Scholar]
  2. Collivignarelli, M.C.; Miino, M.C.; Manenti, S.; Todeschini, S.; Sperone, E.; Cavallo, G.; Abbà, A. Identification and localization of hydrodynamic anomalies in a real wastewater treatment plant by an integrated approach: RTD-CFD Analysis. Environ. Process. 2020, 7, 563–578. [Google Scholar] [CrossRef]
  3. Alsaqqar, A.S.; Khudair, B.H.; Al-Sulaimen, A.M. Performance evaluation of the organic matter removal efficiency in wastewater treatment plants; Case study Al- Diwaniyah WWTP in Iraq. Int. J. Sci. Res. 2017, 6, 334–338. [Google Scholar] [CrossRef]
  4. Al-Sulaiman, A.M.; Khudair, B.H. Correlation between BOD5 and COD for Al-Diwaniyah wastewater treatment plants to obtain the biodigrability indices. Pak. J. Biotechnol. 2018, 15, 423–427. [Google Scholar]
  5. Tomašić, V.; Zelić, B. Environmental Engineering: Basic Principles; Walter de Gruyter GmBH: Berlin, Germany; Boston, MA, USA, 2018. [Google Scholar]
  6. Srinivas, T. Environmental Biotechnology, 1st ed.; New Age International Publishers: New Delhi, India, 2008. [Google Scholar]
  7. Janssen, P.M.J.; Meinema, K.; van der Roest, H.F. Biological Phosphorus Removal: Manual for Design and Operation; IWA Publishing: London, UK, 2002. [Google Scholar]
  8. Cooper, P.; Upton, J.; Smith, M.; Churchley, J. Biological nutrient removal – retrofit solutions in the UK. Design snags, operational problems and costs. In Wastewater Treatment: Evaluation and implementation, Proceedings of Water Environment ’94, a Joint Institution of Civil Engineers and Institution of Water and Environment Management conference, London, UK, 9–10 March 1994; Thomas Thelford Services Ltd.: London, UK, 1994; pp. 170–187. [Google Scholar]
  9. Bugajski, P.; Pawełek, J.; Kurek, K. Concentrations of organic and biogenic pollutants in domestic wastewater after mechanical treatment in the aspect of biological reactor design. Infrastruct. Ecol. Rural Areas 2017, IV/3, 1811–1822. [Google Scholar] [CrossRef]
  10. Chmielowski, K.; Wąsik, E.; Operacz, A.; Bugajski, P.; Kaczor, G.; Jurík, L. Analysis of sewage susceptibility to biodegradation on an example of sewage treatment plant in Wodzisław Śląski. Infrastruct. Ecol. Rural Areas 2017, IV/1, 1427–1443. [Google Scholar] [CrossRef]
  11. Młyńska, A.; Chmielowski, K.; Młyński, D. The analysis of the changes in the sewage quality during treatment processes on the wastewater treatment plant in Przemyśl. Ecol. Eng. 2017, 18, 18–26. [Google Scholar] [CrossRef] [Green Version]
  12. Nowobilska-Majewska, E.; Bugajski, P. The analysis of the amount of pollutants in wastewater after mechanical treatment in the aspect of their susceptibility to biodegradation in the treatment plant in Nowy Targ. J. Ecol. Eng. 2019, 20, 135–143. [Google Scholar] [CrossRef]
  13. Płuciennik-Koropczuk, E.; Jakubaszek, A. Susceptibility of wastewater for biochemical decomposition in mechanical—Biological wastewater treatment processes. Sci. Pap. Environ. Eng. 2012, 148, 73–83. (In Polish) [Google Scholar]
  14. Abdalla, K.Z.; Hammam, G. Correlation between biochemical oxygen demand and chemical oxygen demand for various wastewater treatment plants in Egypt to obtain the biodegradability indices. Int. J. Sci. Basic Appl. Res. 2014, 13, 42–48. [Google Scholar]
  15. Lakhlifi, M.; Elatmani, A.; Elhammoumi, T.; Elrhaouat, O.; Sibari, M.; Elguamri, Y.; Belghyti, D.; El Kharrim, K. Prediction of biodegradability ratios in wastewater treatment plant of Skhirat Morocco. Int. J. Environ. Agric. Res. 2017, 3, 1–6. [Google Scholar]
  16. Bugajski, P.; Almeida, M.A.A.; Kurek, K. Reliability of sewage treatment plants processing sewage from school buildings located in non-urban areas. Infrastruct. Ecol. Rural Areas 2016, IV/3, 1547–1557. [Google Scholar] [CrossRef]
  17. Jóźwiakowski, K.; Bugajski, P.; Mucha, Z.; Wójcik, W.; Jucherski, A.; Nastwany, M.; Siwiec, T.; Mazur, A.; Obroślak, R.; Gajewska, M. Reliability and efficiency of pollution removal during long-term operation of a one-stage constructed wetland system with horizontal flow. Sep. Purif. Technol. 2017, 187, 60–66. [Google Scholar] [CrossRef]
  18. Marzec, M. Reliability of removal of selected pollutants in different technological solutions of household wastewater treatment plants. J. Water Land Develop. 2017, 35, 141–148. [Google Scholar] [CrossRef] [Green Version]
  19. Młyński, D.; Bugajski, P.; Młyńska, A. Application of the mathematical simulation methods for the assessment of the wastewater treatment plant operation work reliability. Water 2019, 11, 873. [Google Scholar] [CrossRef] [Green Version]
  20. Coronado-Hernández, Ó.E.; Merlano-Sabalza, E.; Díaz-Vergara, Z.; Coronado-Hernández, J.R. Selection of hydrological probability distributions for extreme rainfall events in the regions of Colombia. Water 2020, 12, 1397. [Google Scholar] [CrossRef]
  21. Fan, Y.R.; Huang, W.W.; Huang, G.H.; Li, Y.P.; Huang, K.; Li, Z. Hydrologic risk analysis in the Yangtze River basin through coupling Gaussian mixtures into copulas. Adv. Water Resour. 2016, 88, 170–185. [Google Scholar] [CrossRef] [Green Version]
  22. Sun, C.X.; Huang, G.H.; Fan, Y.; Zhou, X.; Lu, C.; Wang, X.Q. Drought occurring with hot extremes: Changes under future climate change on Loess Plateau, China. Earths Future 2019, 7, 587–604. [Google Scholar] [CrossRef] [Green Version]
  23. Oliveira, S.C.; Souki, I.; von Sperling, M. Lognormal behaviour of untreated and treated wastewater constituents. Water Sci. Technol. 2012, 65, 596–603. [Google Scholar] [CrossRef]
  24. Van Buren, M.A.; Watt, W.E.; Marsalek, J. Application of the log-normal and normal distributions to stormwater quality parameters. Water Res. 1997, 31, 95–104. [Google Scholar] [CrossRef]
  25. Wang, Y.; Ran, W. Comprehensive eutrophication assessment based on fuzzy matter element model and Monte Carlo-triangular fuzzy numbers approach. Int. J. Environ. Res. Public Health 2019, 16, 1769. [Google Scholar] [CrossRef] [Green Version]
  26. Alam, M.A.; Emura, K.; Farnham, C.; Yuan, J. Best-fit probability distributions and return periods for maximum monthly rainfall in Bangladesh. Climate 2018, 6, 9. [Google Scholar] [CrossRef] [Green Version]
  27. Glickman, T.S.; Xu, F. The distribution of the product of two random variables. Stat. Probab. Lett. 2008, 78, 2821–2826. [Google Scholar] [CrossRef]
  28. Wałęga, A.; Rutkowska, A.; Policht-Latawiec, A. Sensitivity of beta and Weibull synthetic unit hydrographs to input parameter changes. Pol. J. Environ. Stud. 2014, 23, 221–229. [Google Scholar]
  29. Wang, X. Vehicle Noise and Vibration Refinement, 1st ed.; Woodhead Publishing: Cambridge, UK, 2010. [Google Scholar]
  30. Yu, G.; Sapiro, G.; Mallat, S. Solving inverse problems with piecewise linear estimators: From gaussian mixture models to structured sparsity. IEEE Trans. Image Process. 2012, 21, 2481–2499. [Google Scholar] [CrossRef] [PubMed] [Green Version]
  31. Zoran, D.; Weiss, Y. From learning models of natural image patches to whole image restoration. In Proceedings of the IEEE International Conference on Computer Vision (ICCV), Barcelona, Spain, 6–13 November 2011; pp. 479–486. [Google Scholar] [CrossRef] [Green Version]
  32. Evans, D.L.; Drew, J.H.; Leemis, L.M. The distribution of the Kolmogorov–Smirnov, Cramer–von Mises, and Anderson–Darling test statistics for exponential populations with estimated parameters. In Computational Probability Applications. International Series in Operations Research & Management Science; Glen, A., Leemis, L., Eds.; Springer: Cham, Switzerland, 2017; Volume 247, pp. 165–190. [Google Scholar]
  33. Jäntschi, L.; Bolboacă, S.D. Computation of probability associated with Anderson–Darling statistic. Mathematics 2018, 6, 88. [Google Scholar] [CrossRef] [Green Version]
  34. Zeng, X.; Wang, D.; Wu, J. Evaluating the three methods of goodness of fit test for frequency analysis. J. Risk Anal. Crisis Response 2015, 5, 178–187. [Google Scholar] [CrossRef] [Green Version]
  35. Bezak, N.; Brilly, M.; Šraj, M. Flood frequency analyses, statistical trends and seasonality analyses of discharge data: A case study of the Litija station on the Sava River. J. Flood Risk Manag. 2016, 9, 154–168. [Google Scholar] [CrossRef]
  36. Regulation of the Minister of Maritime Economy and Inland Navigation of 12 July 2019 on Substances Particularly Harmful to the Aquatic Environment and Conditions to Be Met during Sewage Discharge into the Water or into the Ground and during Rainwater or Snowmelt Discharge into the Water or into the Water Devices. (In Polish). Available online: https://isap.sejm.gov.pl/isap.nsf/DocDetails.xsp?id=WDU20190001311 (accessed on 9 November 2020).
  37. Kaczor, G. Concentrations of the pollutants in the sewage drained from the rural sewerage systems in lesser Poland voivodship. Infrastruct. Ecol. Rural Areas 2009, 9, 97–104. (In Polish) [Google Scholar]
  38. Chmielowski, K.; Ślizowski, R. Evaluation of the effectiveness of pollutants’ removal in the sewage treatment plant in Tarnow. Infrastruct. Ecol. Rural Areas 2009, 5, 137–146. (In Polish) [Google Scholar]
  39. Kaczor, G.; Bergel, T.; Bugajski, P.; Pijanowski, J. Aspects of sewage disposal from tourist facilities in national parks and other protected areas. Pol. J. Environ. Stud. 2015, 24, 107–114. [Google Scholar] [CrossRef]
  40. Wąsik, E.; Chmielowski, K. Evaluation of the operation of the sewage treatment plant “Kujawy” in Cracow. Teka Kom. Ochr. Kszt. Środ. Przyr. 2013, 10, 481–488. [Google Scholar]
  41. Pereira, E.J.S.; Pinho, J.T.; Galhardo, M.A.B.; Macêdo, W.M. Methodology of risk analysis by Monte Carlo Method applied to power generation with renewable energy. Renew. Energy. 2014, 69, 347–355. [Google Scholar] [CrossRef]
  42. Stein, W.; Keblis, M. A new method to simulate the triangular distribution. Math. Comput. Model. 2009, 49, 1143–1147. [Google Scholar] [CrossRef]
  43. Bouzenad, K.; Ramdani, R. Multivariate statistical process control using enhanced bottleneck neural network. Algorithms 2017, 10, 49. [Google Scholar] [CrossRef] [Green Version]
  44. Yu, J. A nonlinear kernel Gaussian mixture model based inferential monitoring approach for fault detection and diagnosis of chemical processes. Chem. Eng. Sci. 2012, 68, 506–519. [Google Scholar] [CrossRef]
  45. Henze, M.; van Loosdrecht, M.C.M.; Ekama, G.A.; Brdjanovic, D. Biological Wastewater Treatment: Principles, Modelling and Design; IWA Publishing: London, UK, 2008. [Google Scholar]
Figure 1. A simplified scheme of the mechanical and biological technological lines of the analysed WWTP along with the localization.
Sustainability 12 10522 g001
Figure 2. Quantile–quantile (Q-Q) chart for the best-fitted statistical distributions of biochemical five-day oxygen demand (BOD5) in (a) raw sewage, (b) mechanically treated sewage and (c) biologically treated sewage.
Sustainability 12 10522 g002
Figure 3. Q-Q chart for the best-fitted statistical distributions of chemical oxygen demand (COD) in (a) raw sewage, (b) mechanically treated sewage and (c) biologically treated sewage.
Sustainability 12 10522 g003
Figure 4. Q-Q chart for the best-fitted statistical distributions of total suspended solids (TSS) in (a) raw sewage, (b) mechanically treated sewage and (c) biologically treated sewage.
Sustainability 12 10522 g004
Figure 5. Q-Q chart for the best-fitted statistical distributions of total nitrogen (TN) in (a) raw sewage, (b) mechanically treated sewage and (c) biologically treated sewage.
Sustainability 12 10522 g005
Figure 6. Q-Q chart for the best-fitted statistical distributions of total phosphorous (TP) in (a) raw sewage, (b) mechanically treated sewage and (c) biologically treated sewage.
Sustainability 12 10522 g006
Figure 7. The changes in simulated pollutant indicator values in subsequent sewage treatment stages: (a) BOD5, (b) COD, (c) TSS, (d) TN, (e) TP.
Sustainability 12 10522 g007aSustainability 12 10522 g007b
Figure 8. Sewage susceptibility to biodegradability in the subsequent sewage treatment stages expressed by the BOD5/COD, BOD5/TN and BOD5/TP ratio.
Sustainability 12 10522 g008
Table 1. The results of the preliminary data analysis of the pollutant indicators observational data series.
Pollutant IndicatorMin
(mg/L)
Mean
(mg/L)
Max
(mg/L)
S
(mg/L)
Cs
(–)
Raw sewage
BOD5110.0309.1700.0121.10.4
COD225.0627.91,260.0241.50.4
TSS110.0339.11,200.0218.30.6
TN25.758.190.014.30.2
TP2.36.713.22.40.4
Mechanically treated sewage
BOD5105.0241.3380.067.60.3
COD213.0484.6750.0135.90.3
TSS40.0192.1420.091.20.5
TN26.059.785.314.00.2
TP2.76.811.91.70.3
Biologically treated sewage
BOD51.97.731.06.10.8
COD14.834.0171.023.70.7
TSS2.09.696.015.81.6
TN4.613.722.74.30.3
TP0.10.53.30.61.3
where S is standard deviation, Cs is coefficient of variation.
Table 2. The results of the theoretical and empirical distributions fitting.
DistributionBOD5CODTSSTNTP
A-DpA-DpA-DpA-DpA-Dp
Raw sewage
GEV0.620.630.350.900.390.860.520.730.460.79
Log-normal0.680.570.470.780.830.460.860.440.490.76
GMM0.700.560.250.970.430.820.240.980.340.91
Normal1.670.141.600.153.360.020.470.781.350.22
Weibull1.500.181.360.212.070.090.610.631.250.25
Triangular3.710.012.780.0416.190.002.490.054.400.01
Mechanically treated sewage
GEV0.370.880.290.940.870.430.210.990.510.73
Log-normal1.220.261.030.340.990.361.480.180.760.51
GMM0.260.960.210.990.410.840.131.000.161.00
Normal0.400.850.340.911.960.100.420.830.470.78
Weibull0.360.890.310.931.370.210.240.970.700.56
Triangular2.810.033.010.033.290.022.320.062.420.06
Biologically treated sewage
GEV0.860.441.050.330.410.840.190.990.180.99
Log-normal1.130.302.470.051.730.130.550.701.860.11
GMM0.480.771.140.290.720.540.170.980.990.36
Normal4.980.006.730.008.620.000.190.996.520.00
Weibull2.650.045.320.003.740.010.200.993.120.02
Triangular12.900.0035.610.0056.240.002.290.0642.020.00
where A-D is Anderson-Darling statistic, p is probability.
Table 3. The values of the Akaike criterion (AIC) of pollutant indicators.
Pollutant IndicatorGEVLog-NormalGMMNormalWeibullTriangular
Raw sewage
BOD5122.90126.41136.54148.48144.17
COD150.79149.70142.79171.08166.35
TSS139.15162.77141.01170.38
TN40.8451.6033.3537.1641.0246.64
TP−27.91−30.63−44.38−8.58−11.09
Mechanically treated sewage
BOD592.52120.5983.6491.2989.72
COD115.60146.63102.97115.95113.24
TSS122.34125.06113.23125.76
TN26.7068.5616.7939.1331.8643.00
TP−39.25−37.82−57.33−40.26−33.61−22.97
Biologically treated sewage
BOD532.7137.75−1.38
COD105.55108.53104.51
TSS72.4993.0781.63
TN−26.858.08−28.56−28.92−28.04−0.17
TP−11.91−44.33−56.04
Table 4. Simulated percentage reduction of the pollutant indicators in subsequent sewage treatment stages.
Pollutant IndicatorAfter Mechanical TreatmentAfter Mechanical and Biological Treatment
BOD522.1%97.6%
COD22.6%94.9%
TSS40.1%96.6%
TN76.6%
TP1.0%92.4%
Publisher’s Note: MDPI stays neutral with regard to jurisdictional claims in published maps and institutional affiliations.

