Article

Rwenzori Score (RS): A Benthic Macroinvertebrate Index for Biomonitoring Rivers and Streams in the Rwenzori Region, Uganda

by
Peace Liz Sasha Musonge
1,*,
Pieter Boets
1,2,
Koen Lock
1,
Minar Naomi Damanik Ambarita
1,
Marie Anne Eurie Forio
1 and
Peter L. M. Goethals
1
1
Aquatic Ecology Research Group, Ghent University, Coupure Links 659, 9000 Ghent, Belgium
2
Provincial Center of Environmental Research, Godshuizenlaan 95, 9000 Ghent, Belgium
*
Author to whom correspondence should be addressed.
Sustainability 2020, 12(24), 10473; https://doi.org/10.3390/su122410473
Submission received: 27 August 2020 / Revised: 10 December 2020 / Accepted: 11 December 2020 / Published: 15 December 2020

Abstract

:
The Rwenzori region in Uganda, a global biodiversity hotspot, is currently undergoing exponential economic and population growth, which puts continuous stress on its freshwater ecosystems. In Sub-Saharan Africa, biomonitoring campaigns using region-specific biotic indices is limited, particularly in Uganda. In this research, we present the Rwenzori Score (RS), a new macroinvertebrate-based biotic index developed to specifically assess the aquatic health of Rwenzori streams and rivers. We collected and measured both biological and physicochemical variables and identified 34,202 macroinvertebrates, belonging to 64 different taxa. The RS was developed in two steps. First, using canonical ordination, we identified chemical variables that correlated significantly with gradients in macroinvertebrate assemblage distribution and diversity. Second, based on selected variables and weighted averages, we determined specific family indicator values and assigned pollution tolerance values (varying from 1: tolerant; to 10: sensitive) to a family. Finally, we established four water quality classes: poor, fair, good, and excellent. The RS is highly correlated with the Average Score Per Taxon System (p < 0.05), a well-known and widely used biotic index. The RS has 5 unique taxa that are not included in other regional indices. In this regard, the development of the RS is a beneficial tool for tailor-made biomonitoring that can contribute to the sustainable development of the Rwenzori stream and river basins.

1. Introduction

Environmental stressors are increasingly putting global biodiversity under tremendous pressure in many locations in the world [1,2,3]. The impact of anthropogenic stressors on montane aquatic ecosystem biodiversity is a pressing challenge worldwide and tackling it has become one of the key priorities of SDG 15 towards sustainable development by 2030 [4,5,6].
In water bodies in many regions around the world, monitoring a range of water chemistry variables has allowed for water quality appraisal [7,8,9,10]. Although chemical monitoring is a long-established procedure for ascertaining the health status of water bodies, results may decidedly fluctuate, both on a diurnal and periodical basis. Furthermore, sampling limited to a specific site can cause pollution incidences to go unnoticed [11,12]. Thus, in an effort to ascertain veracious shifts in water quality, it is imperative that frequent data collection of water chemistry needs to be performed over extended time frames [13,14]. Though, when multiple water chemistry variables are being collected, it poses major drawbacks as it is lengthy and not cost-effective [15,16,17]. Thus, the need for rapid and cost-effective biomonitoring techniques using bioindicators such as benthic macroinvertebrates and algae were developed [18,19]. Benthic macroinvertebrates response to environmental stressors associated with past, present, and future anthropogenic activities have been widely studied around the world and are subject to continuing research [20,21,22,23]. The majority of benthic macroinvertebrates spend most of their existence in freshwaters. Additionally, they potentially are efficacious assessors of ecological water quality due to their occurrence, diversity, and sensitivity to both organic and inorganic ecological stressors [24,25,26]. Macroinvertebrates have been applied to enumerate dissimilarity, diversity, and (multimetric) biotic indices. However, the diversity and dissimilarity differ from the biotic indices, which are numeric assessments of ecological water quality, gleaned from the benthic macroinvertebrates sensitivity/tolerance to gradients in the environment [27,28]. In the field of aquatic ecology, the utilization of macroinvertebrate-based indices for ecological aquatic health appraisal is firmly established [19,20,29]. The current macroinvertebrate-based indices are determined from localized macroinvertebrates data sampled from a specific eco-region. Thus, it is commonly impossible and incorrect to apply macroinvertebrate-based indices, established from other eco-region, to natively identified benthic macroinvertebrate assemblages in other eco-regions [30,31,32].
One technique for deducing biomonitoring datasets is to combine taxa as per their perceived sensitivity or tolerance to environmental stressors [33]. Once these tolerance scores are determined, the ecological health of newly monitored sites can be evaluated based on whether macroinvertebrate taxa from sensitive or tolerant groups are largely sampled [34,35,36]. Historically, tolerance scores have performed a vital role in biomonitoring campaigns. For example, during the early 20th century in Europe, the saproby system was developed as a result of cataloguing disparities in taxa groups gathered at consecutively longer intervals downstream from sewage outlets [37,38]. However, few macroinvertebrate-based indices formulated on the assignment of tolerance scores to benthic macroinvertebrate families have been developed for aquatic systems in montane regions in sub-Saharan Africa such as Ethiopian highlands [39]. However, in the Eastern African equatorial glacial montane regions [40,41], particularly the Rwenzori montane region in Uganda, no index has been developed. Nevertheless, the Biological Monitoring Working Party (BMWP) score [34,42,43] and the Average Score Per Taxon (ASPT) [34,44] established in a temperate climatic region (United Kingdom) have been widely applied in tropical freshwater system biomonitoring campaigns [30,45]. Additionally, the North American Hilsenhoff Biotic Index [46] and the fifth iteration of the South African Scoring System (SASS5) [47] that was developed for South African rivers has also gained popularity in Sub-Saharan African biomonitoring campaigns [48,49]. Recently, a Tanzania River Scoring System (TARISS) for Tanzanian rivers [50] derived from the SASS5 has been tested on two Ugandan rivers [51,52].
Tolerance scores have been successfully used to assess the health of freshwater systems [53,54,55]. However, major issues have surfaced pertaining to the broad application of these scores. The tolerance values that are currently available are often only optimal to the geographical areas where it is developed, like UK temperate rivers [56] and the South African eco-regions [47].
Firstly, the use of tolerance scores in areas that are different from where they were primarily developed has been queried. For example, most tolerance scores (e.g., SASS5 and TARISS) have been estimated using data collected in the different South African and Tanzanian eco-regions. However, regional macroinvertebrate taxon assemblages differ considerably in different tropical regions, and as a result, some of the macroinvertebrate taxa collected outside and even within Southern Africa and Tanzania have not been given tolerance scores [50,51,53,57,58]. Furthermore, the stressor gradients commonly observed in tropical regions can differ from the pollution gradients for which the SASS5 tolerance values were originally designed [59]. Thus, region-specific tolerance scores are important in the development of an accurate bioassessment metrics, particularly in tropical countries, where the knowledge of both aquatic biota and their responses to human perturbations are limited [58,60]. In spite of the demonstrable benefits of bioassessment using macroinvertebrates, there is no region-specific index developed in Uganda to date. With the ever-growing industries and population across the Rwenzori montane region, the freshwater systems are currently under a continuous threat [61,62]. The region has an abundance of natural resources and has deposits of oil, cobalt, and copper that are currently undergoing exploitation [63,64]. The absence of a region-specific biological index or bioassessment tool adapted for Rwenzori freshwater systems has hampered the accurate analysis and dissemination of findings to water resources stakeholders. Thus, there is a need for a region-specific biological index, to monitor the aquatic health of these freshwater systems efficiently and cost-effectively. The study aim is to develop a pragmatic macroinvertebrate based biological index to evaluate the aquatic ecological health of Rwenzori freshwater systems. The resultant Rwenzori Score (RS), is sensitive to nutrient pollution outcomes in Rwenzori freshwater systems. Additionally, we compare the resultant RS with two established indices (SASS5 and ASPT) and discuss the benefits of RS over regional indices such as SASS5 and ASPT.

2. Materials and Methods
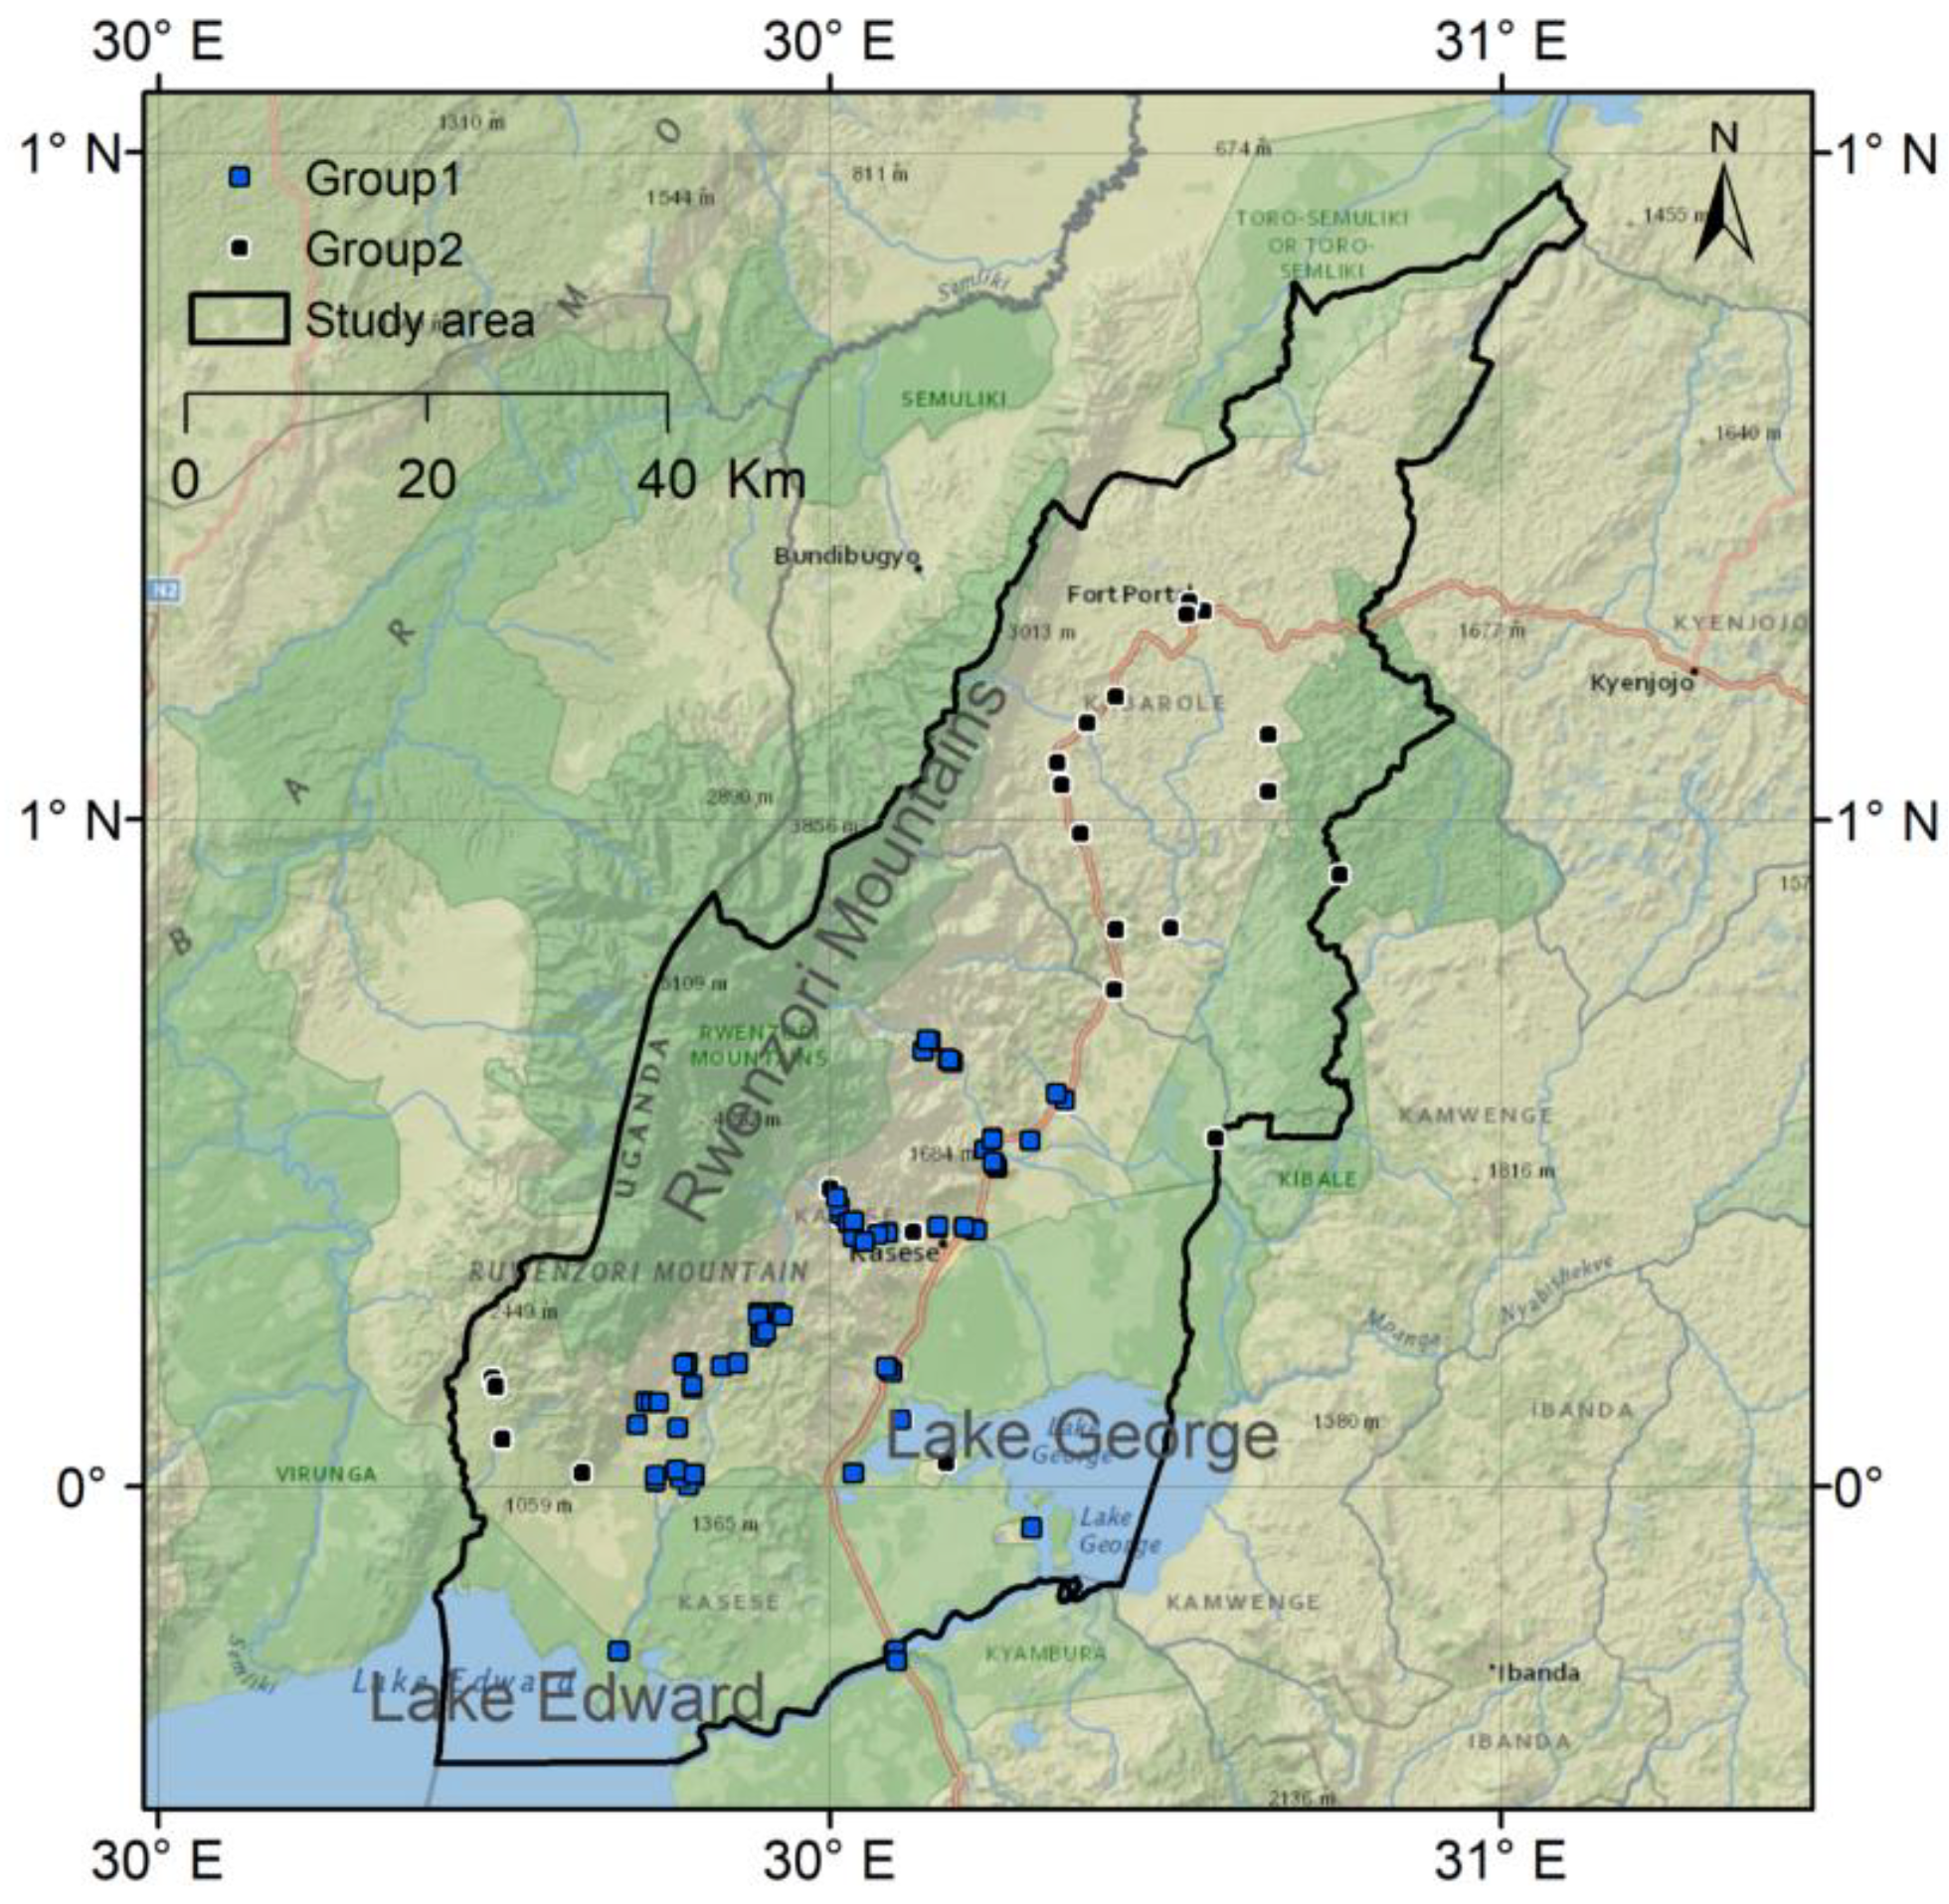
2.1. Study Area

This field study was undertaken between January to February 2014 and 2017 during the course of the dry season when sites were accessible and hydrologically stable. The field sampling was carried out along freshwater rivers flowing across the Rwenzori Montane region in southwestern Uganda at the western border with the Democratic Republic of Congo (DRC). The Equator passes through the study area which is located in the Albertine Rift valley. The study area is bounded by Lake Edward in the south, Lake George in the southeast which is a vital biodiversity hotspot [65,66] and the Rwenzori Mountain ranges in the north (Figure 1). Main land use activities are mining, agriculture, industry, tourism-related developments, and human settlements. Large areas have been designated as protected areas for national parks. The main anthropogenic stresses on the water bodies originate from agriculture, mining, and the effluent from industrial and urban areas [67]. Severe natural disturbances occur during the rainy season, especially from flash flooding. The minimally disturbed sites are mainly located in protected areas and at locations with low population density.
The Rwenzori region has a bimodal rainfall pattern, annually varying from 900 mm to 1600 mm. The two rainy seasons occur from March to June and October to December. The climate is a sub-humid equatorial climate [68,69]. We focused in our study on sections between altitudes of 900–1700 m.a.s.l., as we wanted to investigate mountain conditions along sites that were most accessible.

2.2. Environmental Data Collection

Water samples were collected from 101 sites (Figure 1) that were randomly chosen to give a comprehensive assessment of the Rwenzori study area while making provision for the following: accessibility, presence and absence of pools and riffles, hydrogeology and altitudinal gradients, anthropogenic and natural disturbances that may impact the ecological status at each sampling site, namely mining, water abstraction, agriculture, roads/paths, and residential and urban areas. Through ground truthing, reference conditions [34,70,71] were determined as sites with the absence of significant disturbances [72]. Furthermore, anthropogenic impact total was determined and tallied on a scale ranging from 0 to 10. The sampling sites were then classified into three levels (low, medium, and high) of anthropogenic impact derived from the scores. Scores varied from 0 to 3 for minimal impact sites; 4–6 for moderate impact, and 7–10 for high impact sites.
A total of 40 pristine sites were selected as reference and 61 as non-reference sites. The deductively selected 40 reference sampling sites were further validated through applying the macroinvertebrate assemblages by utilizing the Average Score Per Taxon (ASPT), which is a well-established biotic index for ecological water quality appraisal. The ASPT value of >7 was established as an indicator of high ecological quality, and this technique confirmed that all the selected reference sites were less impacted [66].
At each site, altitude and coordinates of latitude and longitude (based on the Geographical Coordinate system (GCS) EPSG: 4326) were recorded using Garmin-Global Positioning System (GPS) (Garmin Legend; Garmin Ltd., Olathe, KS, USA). The dissolved oxygen (DO), specific conductivity (SpCond), pH, and temperature (Temp), were measured Hydrolab multiprobe meter (Hydrolab-H20; Hydrolab Company, Austin, TX, USA). Current velocity at each site was measured several times at different points using a handheld Höntzsch probe (HFA-model; Höntzsch, Waiblingen, Germany). The final velocity value was determined from the average of the measurements taken.
The water samples were collected in 1-L amber glass bottles, and immediately stored in a Coleman cool box (Therapak; Coleman, OR, USA) and transported to the laboratory. In the laboratory, samples were stored at 4 °C until laboratory analysis that was undertaken within 24 h after sampling in compliance with the World Health Organization approved guidelines [73]. In the laboratory, water chemistry was determined utilizing a DR3500 Hach Lange lab spectrophotometer (HACH Company, Loveland, CO, USA) and Hach Lange kits to measure, nitrite-nitrogen, orthophosphate, chemical oxygen demand, nitrate-nitrogen, five-day biochemical oxygen demand, ammonium-nitrogen, total nitrogen, total phosphate.
Independent analysis and external quality control were carried out by Chemiphar Uganda, an accredited laboratory.

2.3. Aquatic Macroinvertebrate Field Sampling and Laboratory Identification

Standardized multi-habitat kick sampling was applied with a standard dip net with a mesh size of 0.5 mm. At each site within a stretch of approximately 30 m, we sampled macroinvertebrates for 5 min [66,74,75]. Three replicate samples collected from different microhabitats (macrophytes, sand, mud, and stones) were pooled to one composite sample [66]. A total of 101 benthic macroinvertebrate samples were collected, rinsed, and placed in tubes with 96% ethanol to reach a final concentration of 70% ethanol. In the laboratory, macroinvertebrates were counted and identified to family level [76,77] using with LED-light ring at a magnification of 7–45× of a stereo Olympus SZX10 microscope (Olympus, Tokyo, Japan).

2.4. Data Analysis

The R software Version 3.3.1 [78] was utilized to carry out all the statistical data analytics. We evaluated different methods for developing a biotic index such as predictive modelling, multimetric, weighted averaging, and pollution tolerance score development. Based on various studies on index development and the sizeable data integral for approaches such as predictive modelling when compared to the size and variegation of the Rwenzori rivers and sites that were sampled, we concluded that the latter two methods were most suitable for our index development. Detrended Correspondence Analysis (DCA) [79], with detrending by segments and nonlinear re-scaling was run to ascertain whether to apply either linear or unimodal based numerical techniques [80]. The rule of thumb is a gradient length >4. Unimodal methods (CCA) are applied. The Rwenzori Score development was split-up in two phases. Using canonical ordination methodologies, we identified physico-chemical variables that correlated significantly to patterns in macroinvertebrate assemblage composition and diversity. Next, using a set of physico-chemical variables and weighted averages (WA), we specified family/taxa indicator values (pollution tolerance scores), gleaned from the gradient of disturbance.

2.4.1. Determining the Relationship between Environmental Variables and Macroinvertebrate Community Composition

Based upon presence-absence macroinvertebrate datasets, ordination methodologies were used to establish environmental variables, which revealed the variation in macroinvertebrate assemblage composition amongst the sampled sites. Therefore, for the further data exploration of macroinvertebrate assemblage variation, Canonical Correspondence Analysis (CCA) models were best suited for the task [81,82,83,84].
With the spearman’s correlation, as variables were not normally distributed, we checked for collinearity between the spatial and physico-chemical variables, since collinearity renders it hard for model interpretation and additionally effectuates overfitting problems. However, all variables were left in the subsequent analysis as none of them were highly correlated r2 ≥ 0.9 [85]. Additionally, we controlled for spatial autocorrelation/synchrony in the datasets [86,87] by combining and conditioning both spatial (longitude, latitude, elevation) and other non-chemical variables (main substrate type, temperature, and velocity) of each site. Thus, isolating their effects on macroinvertebrate communities in subsequent partial CCA (pCCA) analyses and allowing only nutrient gradients to influence the ordination axes.
Using the significant covariables, a pCCA was performed, based on Hill’s scaling and inter-species differences [82], applying forward selection techniques (analogous with forward stepwise regression), to rank variables in the order of their magnitude in explaining macroinvertebrate assemblage composition and distribution [81]. The Monte Carlo permutation test (999 random permutations) was run to test the significance (p < 0.05) of each specific explanatory variable.
The environmental variables with variance inflation factor (VIF) >10 were taken out, prior to performing CCA. Where necessary, environmental data were transformed to conform to the assumption of normality [83].

2.4.2. Development of the Rwenzori Score (RS)

We applied a similar procedure based on the development of a Nutrient Biotic index (NBI) to establish taxa indicator scores [88], which constituted weighted average (WA) estimates [89] for every single family utilizing the pCCA selected variables and assigned to one of the 8 bins/groups, that comprised of approximately equivalent site numbers. Across the impact gradient, the environmental optimum, (EO) taxon/family value was determined using Equation (1), below:
  EO   = Σ   ( W p r o p )   b i n 1 +   b i n 2 + + b i n 8 Σ   ( U p r o p )   b i n 1 +   b i n 2 + + b i n 8
where the average water parameter value of each specific bin is denoted by Wprop, multiplied by the portion of instances the taxon/family occurred in each respective bin, and is denoted by Uprop. Subsequently, the computed environmental optimum value of each particular taxon/family is approximately equivalent to the average water quality variable of the bin inside of which the taxon/family attained the highest occurrence numbers. The values of the computed optima are summarized in Appendix A Table A1.
Based on environmental optima of water quality variables, family indicator values were then assigned. In ascending order, environmental optimum values were arranged and separated into approximately 10 divided groups. Every single group contained approximately 7 and 6 taxa groups. The group 1 taxa that were linked to sites with minimal impact were assigned a score value of 10, whilst a score value of one was awarded to the final group 10, whose taxa were linked to sites that had a very high anthropogenic impact. Hence, a score value of 10 denotes highly nutrient pollution intolerant taxa/families, whilst highly nutrient pollution tolerant taxa/families have the lowest score value of 1. It was feasible to compute the Rwenzori score (RS) using both the taxa presence/absence data and indicator values of families/taxa at every one of the sites.
The Weighted Average (WA) methodology was applied to determine the pollution tolerance score values for each specific taxon/family established on the nutrient-based variable orthophosphate, as that explained significant variation in macroinvertebrate assemblage composition and distribution across the gradient of disturbance.
For each sampled site, the Rwenzori Score was calculated as a total of the pollution tolerance scores of all families/taxa identified and included and then divided by the total number of included families/taxa. Thereafter, the final Rwenzori Scores vary from 0 to 10, with a higher score indicating a lower pollution impact. The computed scores for each sampled site are shown in Appendix A Table A2.
The Rwenzori Score (RS) developed for the assessment of nutrient enrichment of Rwenzori freshwater systems was determined at each site using Equation (2), below:
RS   =   i = 1 i = s T i s
where s denotes the total number of families at a site, while Ti denotes the ith family pollution tolerance value.

2.4.3. Rwenzori Score (RS) Performance Assessment

The differences of the Rwenzori Scores and orthophosphate levels between the four water quality classes were assessed using the Welch’s Analysis of Variance (ANOVA) test [90], as the data were not normally distributed and the groups presented heterogeneity of variances according to the Shapiro–Wilk test and Levene’s test, respectively. Tukey Honestly Significant Difference (HSD) multiple comparison test was applied to assess the significant differences in the score values and orthophosphate levels between the four water quality classes. Rwenzori Score (RS) values were compared with two widely used macroinvertebrate indices in African lotic systems: The Average Score Per Taxon (ASPT) and South African Scoring System (SASS5) version 5 [91]. The recently developed TARISS score was eliminated as it was derived from SASS5 and had similar taxa tolerance Scores to SASS5. Furthermore, the TARISS had fewer taxa compared to ASPT and SASS5. Primarily, through the computation of spearman’s correlations, we were able to compare pollution tolerance values used in the ASPT, SASS5, and RS indices, though five of the 64 taxa identified in Rwenzori sites are not shown in both the ASPT and SASS5, so five Rwenzori taxa (i.e., Staphylinidae, Psephenidae, Ptilodactylidae, Scirtidae, and Stratyomiidae) were excluded. We then calculated ASPT and SASS5 scores for each of 101 sampled sites and compared them with Rwenzori Scores. We computed correlation coefficients and plotted two separate correlation graphs between the RS and the two indices (ASPT and SASS5) to evaluate the association between the indices.
Rwenzori Scores were correlated alongside six variables of specific conductivity, dissolved oxygen, orthophosphate, nitrite-nitrogen, and total phosphorus and taxa richness for each of the sites that differed amongst reference and non-reference sites. Where necessary, variables were natural log (ln)-transformed prior to analysis.

3. Results

3.1. Environmental Results

Across the 101 sampled sites, the physico-chemical variables varied widely (Table 1). Unimpacted sites generally had low nutrient levels as compared to impacted sites. The pH values varied from 4.91 to 9.99 in highly impacted sites. Similarly, specific conductivity showed a broad range from 0.051 (mS m−1) to 0.88 (mS m−1) in impacted sites. The mean altitude was 1169 m.a.s.l. and ranged between 916 m.a.s.l. and 1538 m.a.s.l.

3.2. Macroinvertebrate Community Structure

A total of 34,202 individuals from 64 taxonomic groups (63 families and 1 higher taxon) were recorded in the study sites. The most dominant taxa were Simuliidae (8839), Baetidae (8052), and Chironomidae (6860), and the least dominant taxa were Athericidae, Culicidae, Dryopidae, Ecnomidae, Erpobdellidae, Hydraenidae, Pleidae, Psephenidae, Psychomyiidae, Ptilodactylidae, Staphylinidae, and Viviparidae (abundances < 2).

3.3. Development of Rwenzori Score

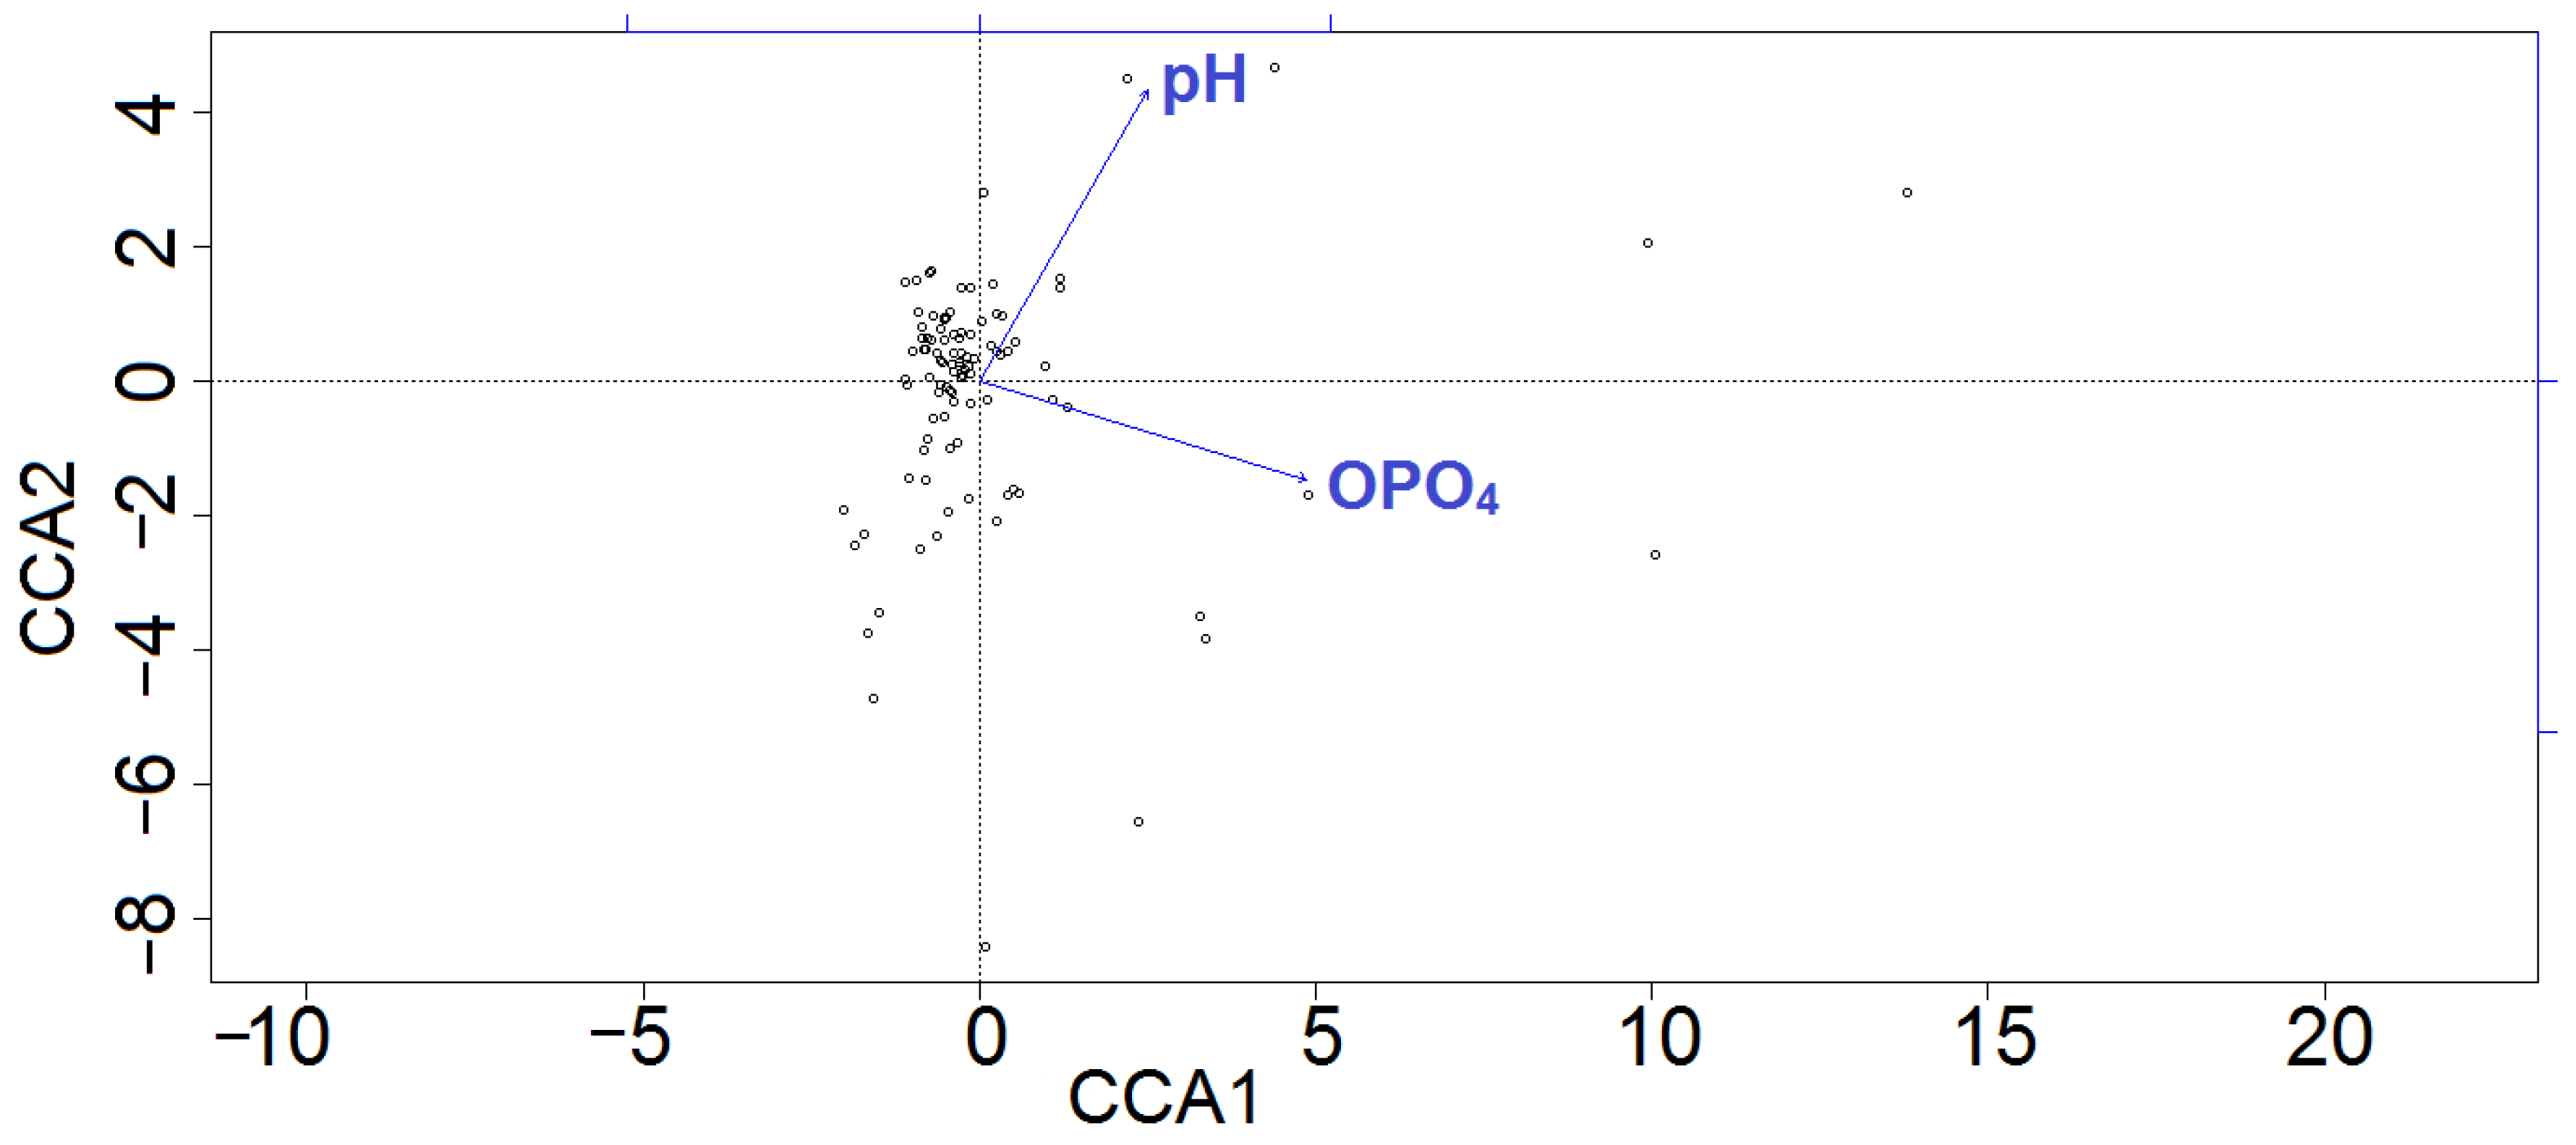
3.3.1. Ordination Analysis

Firstly, Detrended Correspondence Analysis (DCA) of macroinvertebrate assemblages demonstrated that the length of gradient (5.18) was greater than 3 and thus indicated the unimodal nature of macroinvertebrate taxa responses. Strong dissimilarity in macroinvertebrate assemblage composition among sites was displayed by the final pCCA model (Figure 2) and the first two axes were significant (p < 0.05). Biogeographical differences in macroinvertebrate composition were driven by two significant variables: orthophosphate (OPO4) and pH. The orthophosphate concentrations were highest in highly impacted sites and markedly lower (low nutrient levels) in the least impacted reference sites. Consequently, we applied weighted averaging to evaluate the distributions of the 64 macroinvertebrate families across the pH and orthophosphate gradients and to determine environmental optima values and subsequent pollution tolerance scores. We developed the final Rwenzori Scores (RS) for assessment of nutrient enrichment from the orthophosphate tolerance scores.

3.3.2. Developing Tolerance Scores Using Weighted Averaging (WA)

Based on the computed values, we were able to identify four water quality categories as summarized below in Table 2.
The computed values for the four Rwenzori site classes are summarized in the boxplots (Figure 3a). A total of 53 sites were classified as excellent (e), 24 as good (g), 11 as fair (f), and 13 as poor (p) (Table 3).
The RS values and orthophosphate levels significantly differed between the four water quality classes (Figure 3a). The post hoc Tukey HSD test identified significant differences between the RS (Figure 3a) and orthophosphate (Figure 3b) levels across the water quality classes.

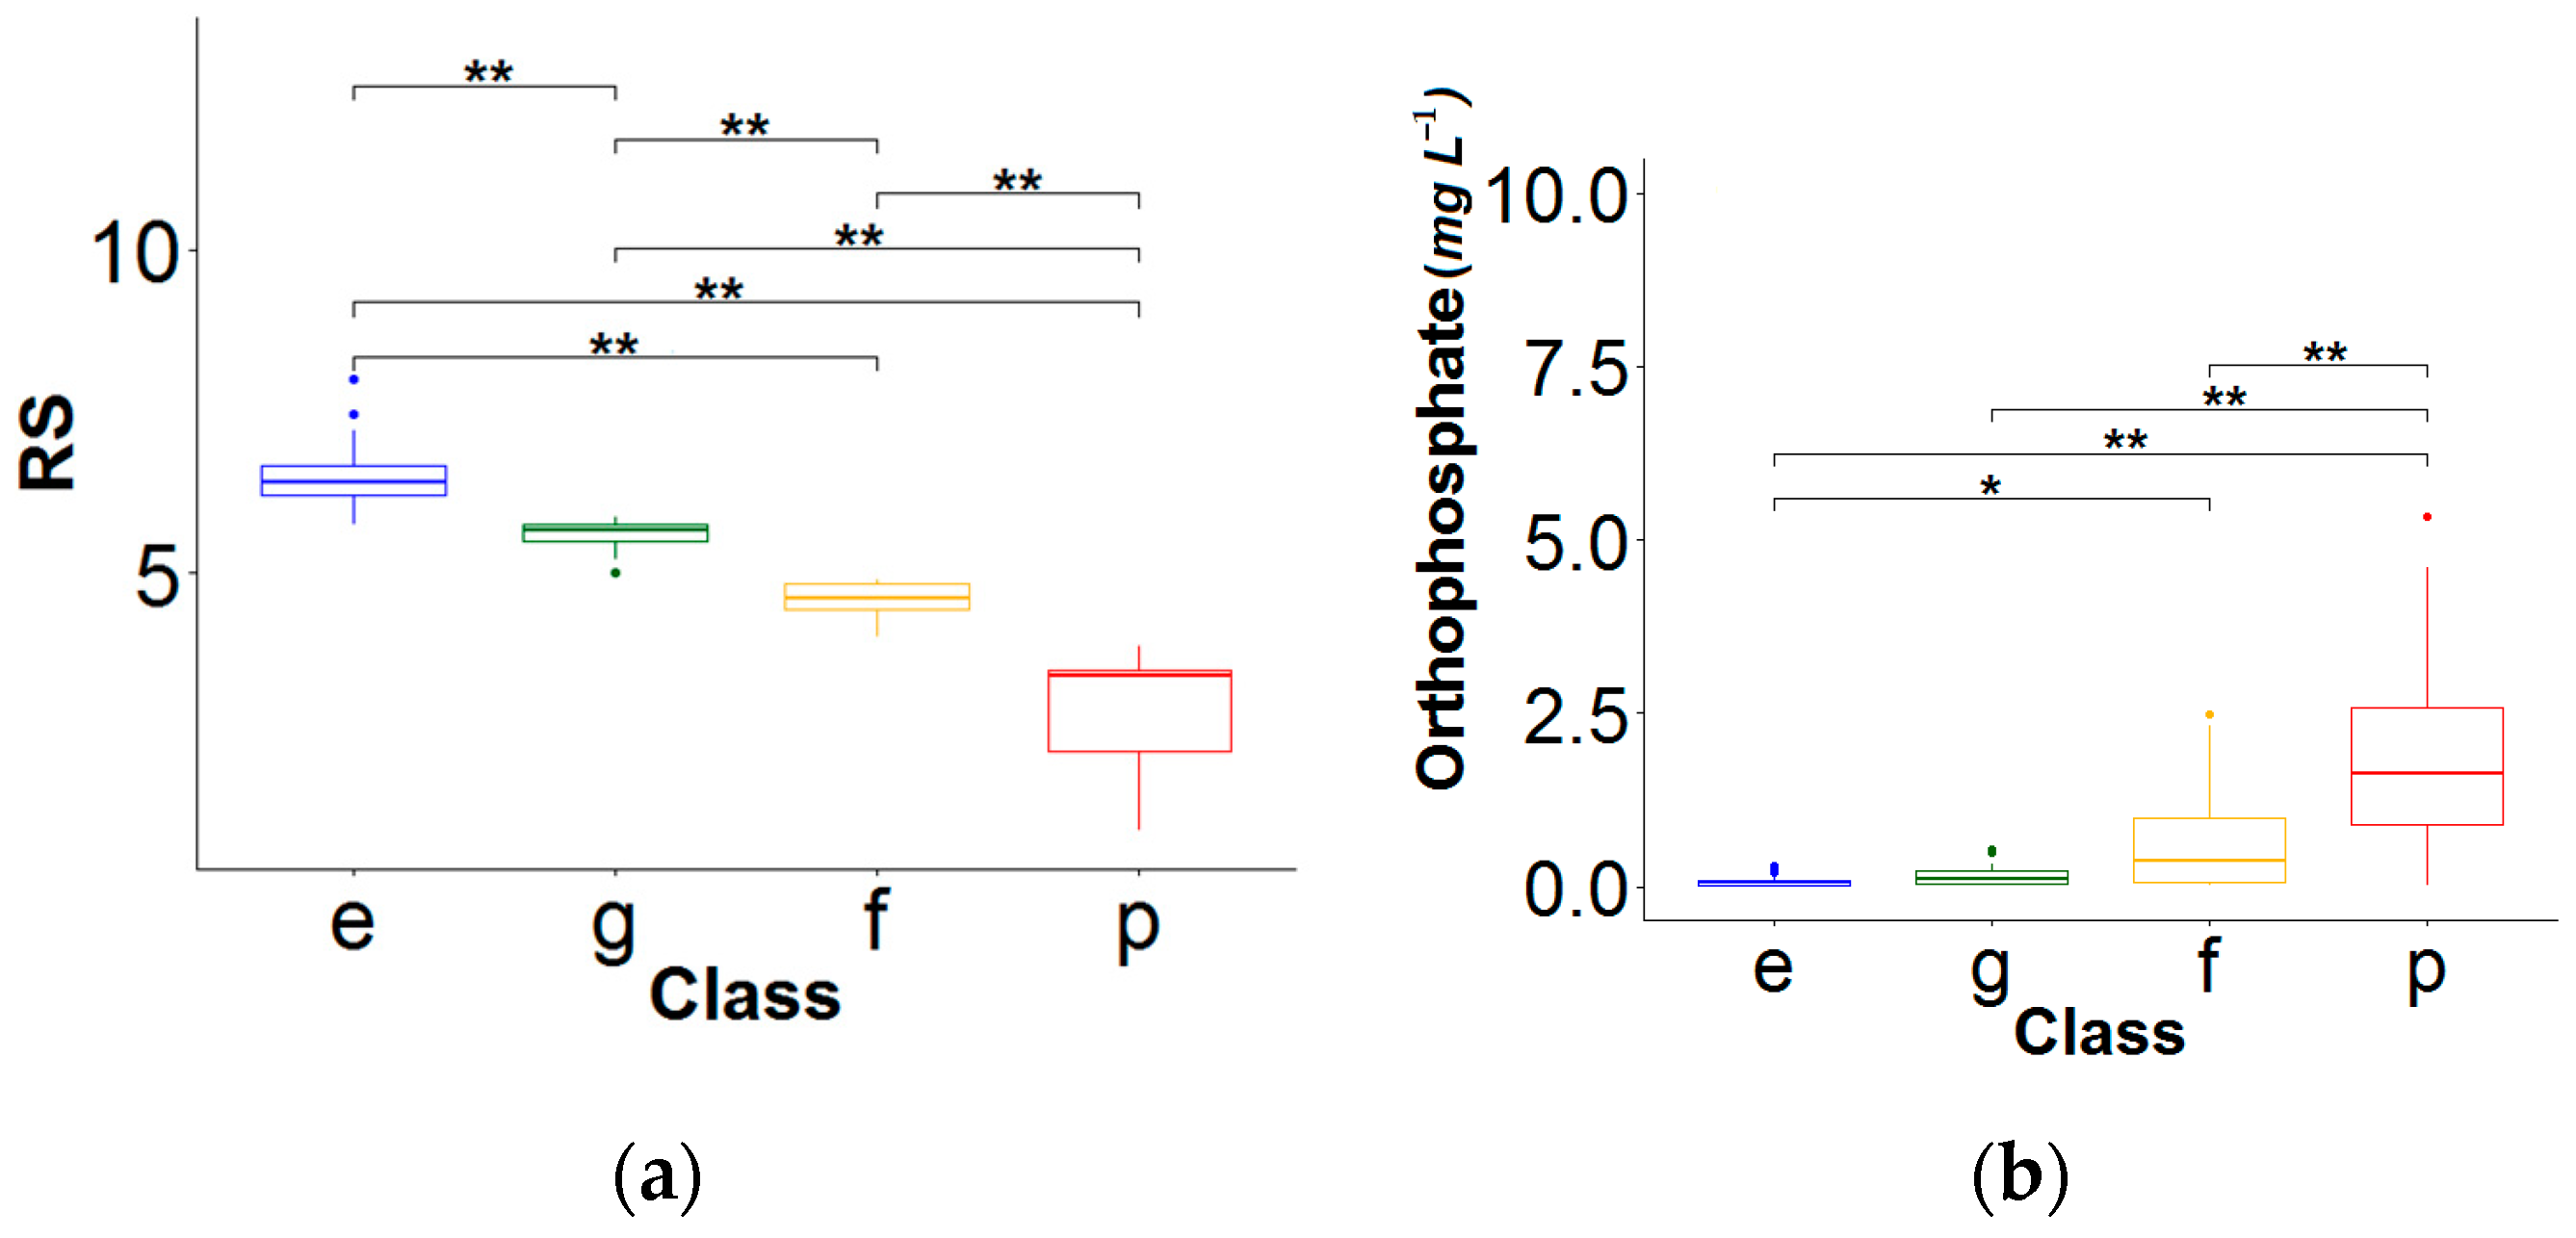
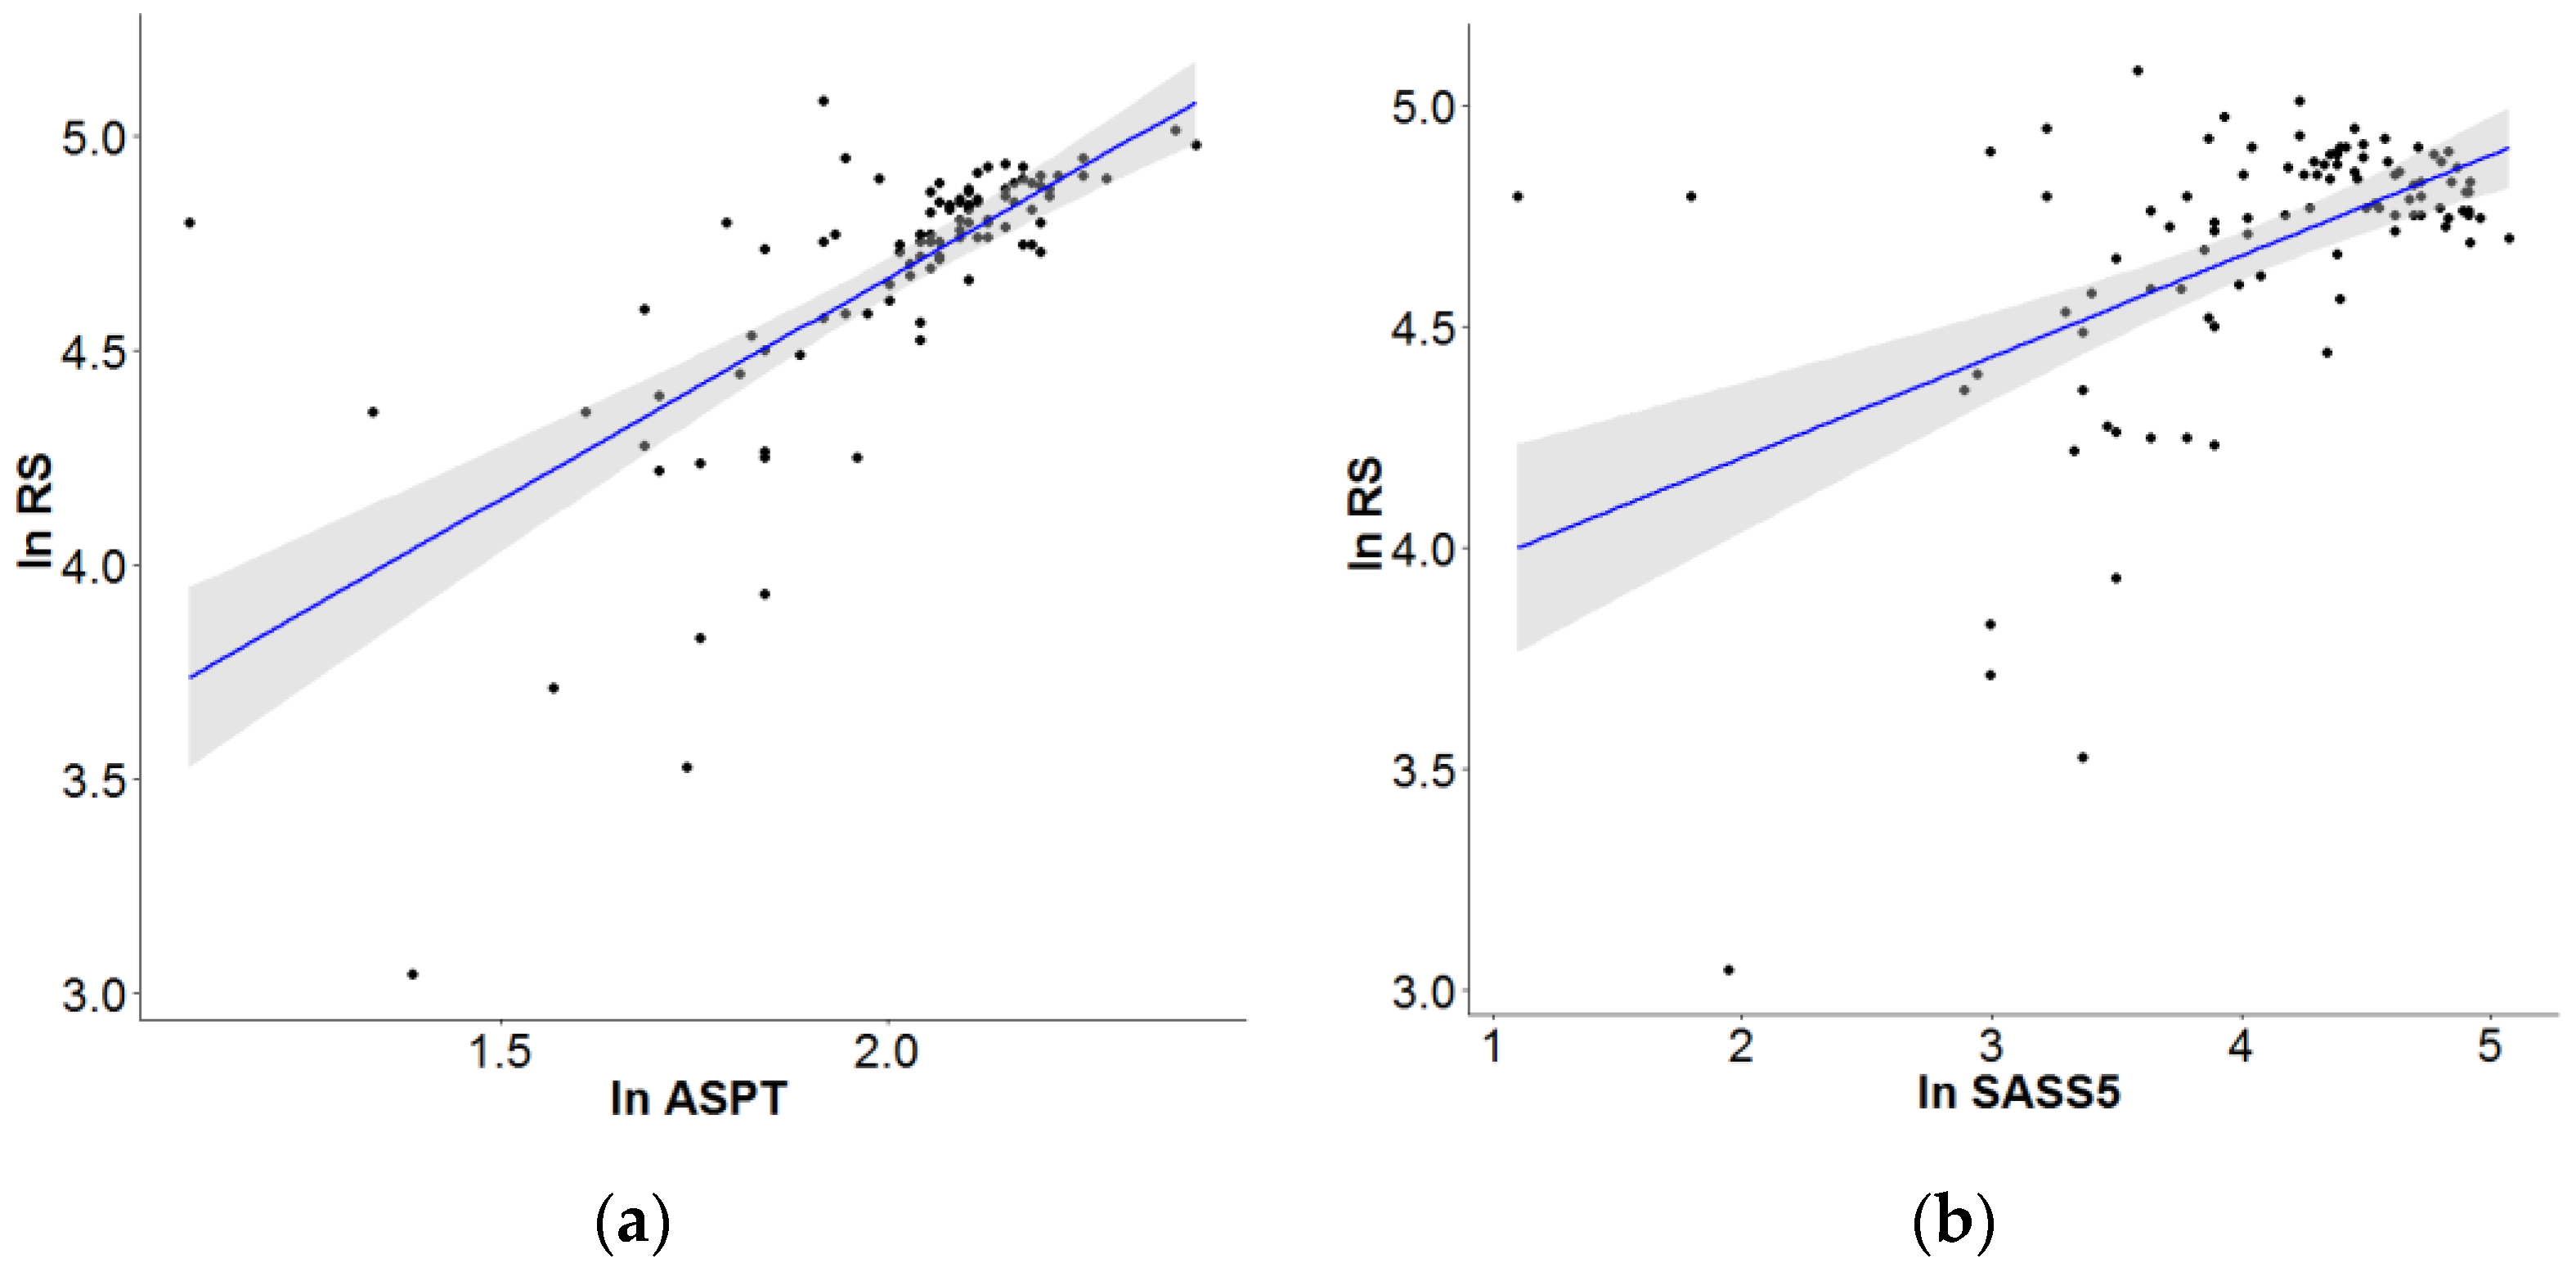
4. Assessing the Performance of the Rwenzori Score (RS)

The three biotic index scores calculated were: ASPT (2–10); SASS5 (2–159), and RS (1–8). Based on these differences in macroinvertebrate assemblage composition, we allotted each group to one of the four Rwenzori Score water quality categories (Table 2; based on the ASPT and SASS5 water quality categories). Furthermore, it is paramount to observe that even when the macroinvertebrate assemblages had compositional differences among the four ecological water quality groups, there were taxa overlaps. When considering the four ecological site classes, we assessed the performance of the two existing indices of ASPT and SASS5. The RS and ASPT (69% of sites) ranked in the same manner versus the RS and SASS5 (34% of the sites). The three biotic indices scored only 23% of the sites similarly. These findings show that the two biotic indices (ASPT and RS) are very close in diagnosis of ecological water and seem to perform better than the SASS5 for our study area. Additionally, for the reference areas, the ASPT and RS accurately classified the sites as excellent and good in comparison to the SASS5, that classified 10% of the reference sites as fair and poor.
Rwenzori Score values correlated significantly with the ASPT and the SASS5, as shown in Figure 4a,b. However, the ASPT had a higher correlation (rs = 0.74, p < 0.001) than SASS5 (rs = 0.37, p < 0.001).
The sampled sites with high specific conductivity had low Rwenzori Scores (rs = −0.41, r2adjusted = 0.085, p < 0.001). Likewise, sampled sites with high levels of OPO4 (rs = −0.53, r2adjusted = 0.64, p < 0.001), NO2N (rs = −0.46, r2adjusted = 0.29, p < 0.001), and TP (rs = 0.43, r2adjusted = 0.12, p < 0.001) had low Rwenzori Scores. The RS correlated negatively with DO (rs = 0.21, r2adjusted = 0.22, p < 0.001), as some disturbed sites had high levels of eutrophication and thus the highest DO concentrations.

5. Discussion

5.1. Biological Indices

Globally, biological indices based on benthic macroinvertebrate assemblages sensitivity to gradients in the environment are predominantly utilized as numeric measures of the health status of aquatic ecosystems [30,44,46,47]. Additionally, biological indices derived from native macroinvertebrate taxa are well understood and have been found to be beneficial when utilized in their specific environments [25,92,93]. However, in Sub-Saharan Africa and other developing sub/tropical regions, a limited number of tailor-made indices have been developed [30]. Our data are based on extensive collections of macroinvertebrate taxa throughout Rwenzori streams and rivers that are vital headwaters of the Albert Nile and are key components of the lake Edward river sub-basin system [94,95]. The canonical ordination revealed that orthophosphate, a reactive form of phosphorus, influenced the compositional differences in macroinvertebrate assemblages among the reference and non-reference sampled sites. The high orthophosphate levels were most likely caused by point and diffuse pollution sources such as household, sewage, and industrial effluents from the densely populated areas. Through the method weighted averages, we successfully assigned pollution tolerance values to the native Rwenzori taxa. Weighted averages have in the past been successfully applied in the development of other tolerance score based indices such as the Macroinvertebrate Community Index-MCI [96], the SingScore [30], and the Acid Mine Drainage Index-AMDI [97]. Furthermore, Weighted Averaging (WA) has historically been applied in ecological studies as a clear-cut and powerful methodology for computing tolerance values [89,98,99,100]. Tolerance values provide a measure of the sensitivity of macroinvertebrates to environmental stressors—in our case as previously stated, orthophosphate (reactive phosphorus). When compared with the scores assigned to the newly developed Rwenzori Score, only seven families had similar scores to the ASPT and SASS5 (Aeshnidae, Dryopidae, Gomphidae, Nepidae, Tricorythidae, Veliidae, and Viviparidae). Thus, results from other studies [51,60] indicate that the regional indices (i.e., ASPT, BMWP, SASS5, and their derivatives) probably do not give holistic diagnostic data for the Rwenzori and other Ugandan rivers, which justifies the need to develop region-specific tolerance scores. As tolerance scores for orthophosphate are nutrient based, the final RS tolerance scores were based on orthophosphate concentrations only.

5.2. Rwenzori Score and Ecological Water Quality

To ascertain the health status at each of the sampled sites, Rwenzori scores are computed based on the tolerance values of the families, as is done for other developed indices such as ASPT, SASS5, TARISS, SingScore, and macroinvertebrate community index. The resultant RS value is classified under one of the four ecological water quality categories (excellent, good, fair, and poor), which is similar to other developed indices, thus reaffirming its applicability. The boxplots results revealed that among the four classes, there are possibly intersections and thus integral to indicate that boundaries between are flexible, as was also encountered in development of the Singaporean SingScore [30] and has also been highlighted in other biomonitoring studies [101,102,103]. Thus, in addition to the RS, we suggest that primary water quality data at sampled sites should be assessed. Through validation, the Rwenzori Score is moderately comparable to commonly used biomonitoring indices in Sub-Saharan tropical freshwater systems, mainly the commonly applied ASPT and a much lesser extent to the SASS5 and its derivatives. The BMWP and the associated ASPT have been demonstrated to be valid across a broad altitudinal gradient. In this study, we found five additional macroinvertebrate taxa (Staphylinidae, Psephenidae, Ptilodactylidae, Scirtidae, and Stratyomiidae) that could not be assigned to ASPT and SASS5 tolerance scores. Our results are supported by an earlier recent study in the Rwenzori region that also found five missing taxa when validating the TARISS and ASPT indices [51]. This may restrict the overall applicability of these indices across different ecoregions rivers as was revealed by earlier studies in Tanzanian [50] and South African rivers [59]. Thus, the Rwenzori Score is a more complete and tailormade biological index tool for assessing the ecological status of Rwenzori rivers. The Rwenzori Scores calculated for our 101 sites indicated that water quality ranged from extremely impacted (poor) to unimpacted (excellent). However, most of the sites were classified as excellent (N = 53), whereas the class fair had the lowest site numbers (N = 11).

5.3. Water Resources Management and Future Research

Conductivity and nutrients were low in the unimpacted sites that were characterized by high taxonomic richness. All reference sites, except for eight sites, were of excellent water quality with the remnant sites of good quality. In contrast, the none-reference sites were assessed as poor and fair sites, and were characterised by high levels of disturbance due to the animal watering points and direct disposal of human and industrial wastes into the river [67]. Therefore, affirming that several of the protected area sites are negatively influenced by anthropic activities such as rapid urbanization and unplanned human settlements, in particular via nutrient enrichment. There have been debates in several publications concerning the performance of predictive models and biotic indices [30,104,105,106,107]. Each of these applications has key advantages and limitations, and before the Rwenzori Score development process, we gauged for the plausibility and applicability of these approaches. Considering the dataset size and the expertise of the different water resources stakeholders, we decided that a multi-metric technique could have been applied. However, the very distinct community differences between the sites along a nutrient/pollution gradient led to sufficient data for tolerance scores and biotic index development as was observed in previous studies [30]. Furthermore, predictive models typically require large datasets over a timeframe of several years and were not yet suitable for the development of our Rwenzori Score due to our dataset size and sampling timeframe. Future research is needed to validate and optimize the Rwenzori score and can possibly lead to the development of a multimetric Rwenzori index based on long-term and larger-spatial coverage datasets and a more detailed taxonomic resolution. Water resource managers can now utilize the Rwenzori index to control the ecological water quality in the Rwenzori rivers and streams.

6. Conclusions

Water quality of aquatic ecosystems of streams and rivers in the Rwenzoris could be assigned to one of the four RS categories. Although the Rwenzoris has varying disturbance levels, the majority of unimpacted sites are of excellent quality and supported at least 64 different families. Furthermore, a substantial part of the macroinvertebrate families have varying nutrient pollution tolerances and are useful bioindicators to measure the health status of Rwenzori rivers and streams. In this manner, the RS is suitable for measuring nutrient enrichment in the rivers and streams in the Rwenzori region. The Rwenzori Score is thus a useful tool for biomonitoring and could promote sustainable conservation of Rwenzori aquatic ecosystems. The results will be a basis for cost-effective and tailor-made solutions to support decision-making processes in the Rwenzori montane region in the long-term.

Author Contributions

Conceptualization, P.L.S.M.; methodology, P.L.S.M.; validation, P.L.S.M., K.L., and P.B.; formal analysis, P.L.S.M.; investigation, P.L.S.M.; resources, P.L.M.G. and P.L.S.M.; data curation, P.L.S.M., K.L., M.N.D.A., and M.A.E.F.; writing—original draft preparation, P.L.S.M.; writing—review and editing, P.L.S.M., P.B., P.L.M.G., and M.A.E.F.; visualization, P.L.S.M.; supervision, P.L.M.G. and P.B.; project administration, P.L.S.M. and P.L.M.G.; funding acquisition, P.L.S.M. and P.L.M.G. All authors have read and agreed to the published version of the manuscript.

Funding

The study was funded by Schlumberger Faculty of Future Fellowship 2016–2017 grant.

Acknowledgments

This study was carried out with the authorization of the Ugandan Wildlife Authority (license UWA/FOD/33/02) and Ugandan National Council of Science and Technology (license NS433). Special appreciation is accorded to the Uganda National Fisheries Research Institute (Jinja), School of Food Technology and Bioengineering (Makerere) and Local staff who availed field some equipment and laboratory space.

Conflicts of Interest

The authors declare no conflict of interest.

Appendix A

Table A1. The Orthophosphate optima values of 64 taxa groups and the abundance (counts) found in the 101 Rwenzori study sites.
TaxaCountsOptimaTaxaCountsOptima
Aeshnidae60.102Libellulidae2870.107
Athericidae10.086Limoniidae591.306
Atyidae100.16Lumbricidae231.510
Baetidae80520.096Lumbriculidae90.035
Belostomatidae472.74Lymnaeidae151.584
Caenidae20580.623Mesoveliidae30.116
Ceratopogonidae210.168Muscidae260.132
Chironomidae68600.194Naucoridae1630.863
Coenagrionidae5400.813Nepidae340.828
Corduliidae101.95Notonectidae250.035
Corixidae10580.81Palaemonidae70.18
Culicidae10.527Perlidae240.025
Dixidae70.168Physidae283.096
Dryopidae20.091Planorbidae350.755
Dugesiidae160.092Pleidae10.98
Dytiscidae131.575Psephenidae10.018
Ecnomidae10.19Psychodidae30.050
Elmidae4050.452Psychomyiidae10.044
Empididae80.04Ptilodactylidae20.021
Erpobdellidae10.61Pyralidae50.111
Gerridae52.147Scirtidae810.064
Glossiphoniidae90.072Simuliidae88390.103
Gomphidae1280.355Sphaeriidae70.61
Gyrinidae420.311Staphylinidae12.48
Heptageniidae11390.087Stratyomiidae40.072
Hydracarina312.678Teloganodidae3470.101
Hydraenidae21.411Thiaridae304.460
Hydrophilidae201.975Tipulidae591.150
Hydropsychidae28460.108Tricorythidae1590.082
Lepidostomatidae2380.646Tubificidae190.556
Leptoceridae1590.587Velidae1000.412
Leptophlebiidae680.094Viviparidae10.403
Table A2. Computed tolerance scores of 64 taxonomic groups.
OrderTaxaScoreOrderTaxaScore
ArchitaenioglossaViviparidae5HaplotaxidaLumbricidae2
ArinchobdellidaErpobdellidae4HemipteraBelostomatidae1
BasommatophoraLymnaeidae2 Corixidae3
Physidae1 Gerridae1
Planorbidae4 Mesoveliidae7
ColeopteraDryopidae8 Naucoridae3
Dytiscidae2 Nepidae3
Elmidae5 Notonectidae10
Gyrinidae6 Pleidae3
Hydraenidae2 Velidae5
Hydrophilidae1LepidopteraPyralidae7
Psephenidae10LumbriculidaLumbriculidae10
Ptilodactylidae10OdonataAeshnidae8
Scirtidae9 Coenagrionidae3
Staphylinidae1 Corduliidae2
DecapodaAtyidae7 Gomphidae6
Palaemonidae6 Libellulidae7
DipteraAthericidae9PectinibranchiaThiaridae1
Ceratopogonidae6PlecopteraPerlidae10
Chironomidae6ProstigmataHydracarina1
Culicidae5RhynchobdellidaGlossiphoniidae9
Dixidae7SeriataDugesiidae8
Limoniidae2TrichopteraEcnomidae6
Muscidae7 Hydropsychidae7
Psychodidae9 Lepidostomatidae4
Simuliidae8 Leptoceridae4
Stratyomiidae9 Psychomyiidae10
Tipulidae3TubificidaTubificidae5
EmpididaeEmpididae10VeneroideaSphaeriidae4
EphemeropteraBaetidae8
Caenidae4
Heptageniidae9
Leptophlebiidae8
Teloganodidae8
Tricorythidae9

References

  1. Wittebolle, L.; Marzorati, M.; Clement, L.; Balloi, A.; Daffonchio, D.; Heylen, K.; de Vos, P.; Verstraete, W.; Boon, N. Initial community evenness favours functionality under selective stress. Nature 2009, 458, 623. [Google Scholar] [CrossRef] [PubMed]
  2. Vörösmarty, C.J.; McIntyre, P.B.; Gessner, M.O.; Dudgeon, D.; Prusevich, A.; Green, P.; Glidden, S.; Bunn, S.E.; Sullivan, C.A.; Liermann, C.R. Global threats to human water security and river biodiversity. Nature 2010, 467, 555. [Google Scholar] [CrossRef] [PubMed]
  3. Collen, B.; Whitton, F.; Dyer, E.E.; Baillie, J.E.; Cumberlidge, N.; Darwall, W.R.; Pollock, C.; Richman, N.I.; Soulsby, A.M.; Böhm, M. Global patterns of freshwater species diversity, threat and endemism. Global Ecol. Biogeogr. 2014, 23, 40–51. [Google Scholar] [CrossRef] [PubMed] [Green Version]
  4. Schultz, M.; Tyrrell, T.; Ebenhard, T. The 2030 Agenda And Ecosystems. A Discussion Paper on the Links Between the Aichi Biodiversity Targets and the Sustainable Development Goals; SwedBio at Stockholm Resilience Centre: Stockholm, Sweden, 2016. [Google Scholar]
  5. Brundtland, G.H.; Ehrlich, P.; Goldemberg, J.; Hansen, J.; Lovins, A.; Likens, G.; Lovelock, J.; Manabe, S.; May, B.; Mooney, H. Environment and Development Challenges: The Imperative to Act; The Asahi Glass Foundation: Tokyo, Japan, 2012. [Google Scholar]
  6. Gill, J.C.; Mankelow, J.; Mills, K. The role of Earth and environmental science in addressing sustainable development priorities in Eastern Africa. Environ. Dev. 2019, 30, 3–20. [Google Scholar] [CrossRef]
  7. Ogwueleka, T.C. Use of multivariate statistical techniques for the evaluation of temporal and spatial variations in water quality of the Kaduna river, Nigeria. Environ. Monit. Assess. 2015, 187, 137. [Google Scholar] [CrossRef]
  8. Sun, W.; Xia, C.; Xu, M.; Guo, J.; Sun, G. Application of modified water quality indices as indicators to assess the spatial and temporal trends of water quality in the Dongjiang River. Ecol. Indic. 2016, 66, 306–312. [Google Scholar] [CrossRef]
  9. Misaghi, F.; Delgosha, F.; Razzaghmanesh, M.; Myers, B. Introducing a water quality index for assessing water for irrigation purposes: A case study of the Ghezel Ozan River. Sci. Total Environ. 2017, 589, 107–116. [Google Scholar] [CrossRef]
  10. Tuna, G.; Arkoc, O.; Gulez, K. Continuous monitoring of water quality using portable and low-cost approaches. Int. J. Distrib. Sens. Netw. 2013, 9, 249–598. [Google Scholar] [CrossRef]
  11. Vrana, B.; Allan, I.J.; Greenwood, R.; Mills, G.A.; Dominiak, E.; Svensson, K.; Knutsson, J.; Morrison, G. Passive sampling techniques for monitoring pollutants in water. TrAC Trends Anal. Chem. 2005, 24, 845–868. [Google Scholar] [CrossRef]
  12. Bartram, J.; Ballance, R.; WHO. Water Quality Monitoring: A Practical Guide to the Design and Implementation of Freshwater Quality Studies and Monitoring Programs, 1st ed.; TJ Press Ltd: Padstow, Cornwall, UK, 1996; pp. 1–92. ISBN 0419223207. [Google Scholar]
  13. Zaldívar, J.-M.; Viaroli, P.; Newton, A.; de Wit, R.; Ibañez, C.; Reizopoulou, S.; Somma, F.; Razinkovas, A.; Basset, A.; Holmer, M. Eutrophication in transitional waters: An overview. Transit. Waters Monogr. 2008, 2, 1–78. [Google Scholar]
  14. Meybeck, M.; Peters, N.E.; Chapman, D.V. Water quality. Encyclopedia of Hydrological Sciences; John Wiley &Sons Ltd: Hoboken, NJ, USA, 2006; ISBN 9780471491033. [Google Scholar]
  15. Allan, I.J.; Vrana, B.; Greenwood, R.; Mills, G.A.; Roig, B.; Gonzalez, C. A “toolbox” for biological and chemical monitoring requirements for the European Union’s water framework directive. Talanta 2006, 69, 302–322. [Google Scholar] [CrossRef] [PubMed]
  16. Gholizadeh, M.; Melesse, A.; Reddi, L. A comprehensive review on water quality parameters estimation using remote sensing techniques. Sensors 2016, 16, 1298. [Google Scholar] [CrossRef] [PubMed] [Green Version]
  17. Kirchner, J.W.; Feng, X.; Neal, C.; Robson, A.J. The fine structure of water-quality dynamics: The (high-frequency) wave of the future. Hydrol. Process. 2004, 18, 1353–1359. [Google Scholar] [CrossRef]
  18. Hodkinson, I.D.; Jackson, J.K. Terrestrial and aquatic invertebrates as bioindicators for environmental monitoring, with particular reference to mountain ecosystems. Environ. Manag. 2005, 35, 649–666. [Google Scholar] [CrossRef] [PubMed]
  19. Cairns, J.; Pratt, J.R. A history of biological monitoring using benthic macroinvertebrates. In Freshwater Biomonitoring and Benthic Macroinvertebrates; Rosenburg, D., Resh, V.H., Eds.; Chapman & Hall: New York, NY, USA, 1993; pp. 10–27. [Google Scholar]
  20. Jackson, M.C.; Weyl, O.; Altermatt, F.; Durance, I.; Friberg, N.; Dumbrell, A.; Piggott, J.; Tiegs, S.; Tockner, K.; Krug, C. Recommendations for the next generation of global freshwater biological monitoring tools. In Advances in Ecological Research; Elsevier: Amsterdam, The Netherlands, 2016; Volume 55, pp. 615–636. [Google Scholar]
  21. Fierro, P.; Valdovinos, C.; Vargas-Chacoff, L.; Bertrán, C.; Arismendi, I. Macroinvertebrates and fishes as bioindicators of stream water pollution. In Water Quality; Intechopen: Rijeka, Croatia, 2017; pp. 23–38. [Google Scholar]
  22. Bohan, D.; Dumbrell, A.; Woodward, G.; Jackson, M. Next generation biomonitoring: Part 1. In Advances in Ecological Research, 1st ed.; Academic Press: Oxford, UK, 2018; ISBN 978-0-12-813949-3. [Google Scholar]
  23. Mangadze, T.; Dalu, T.; Froneman, P.W. Biological monitoring in southern Africa: A review of the current status, challenges and future prospects. Sci. Total Environ. 2019, 648, 1492–1499. [Google Scholar] [CrossRef] [PubMed]
  24. Resh, V.H.; Rosenberg, D.M. Freshwater Biomonitoring and Benthic Macroinvertebrates, 1st ed.; Chapman & Hall: New York, NY, USA, 1993; pp. 195–223. ISBN 978-0-412-02251-7. [Google Scholar]
  25. Carter, J.L.; Resh, V.H.; Hannaford, M.J. Macroinvertebrates as biotic indicators of environmental quality. In Methods in Stream Ecology, 3rd ed.; Lamberti, A., Hauer, F.R., Eds.; Elsevier: Cambridge, MA, USA, 2017; pp. 293–318. ISBN 978-0-412-02251-7. [Google Scholar]
  26. Liao, H.; Sarver, E.; Krometis, L.A.H. Interactive effects of water quality, physical habitat, and watershed anthropogenic activities on stream ecosystem health. Water Res. 2018, 130, 69–78. [Google Scholar] [CrossRef] [PubMed]
  27. King, R.S.; Richardson, C.J. Integrating bioassessment and ecological risk assessment: An approach to developing numerical water quality criteria. Environ. Manag. 2003, 31, 795–809. [Google Scholar] [CrossRef]
  28. Hawkins, C.P.; Cao, Y.; Roper, B. Method of predicting reference condition biota affects the performance and interpretation of ecological indices. Freshw. Biol. 2010, 55, 1066–1085. [Google Scholar] [CrossRef]
  29. Kolkwitz, R.; Marsson, M. Grundsätze Für Die Biologische Beurtheilung des Wassers, Nach Seiner Flora und Fauna; von Drake, L., Ed.; Schumacher: Dahlem, Berlin, Germany, 1902; Volume 1, pp. 1–33. [Google Scholar]
  30. Blakely, T.J.; Eikaas, H.S.; Harding, J. The Singscore: A macroinvertebrate biotic index for assessing the health of Singapore’s streams and canals. Raffles Bull. Zool. 2014, 62, 540–548. [Google Scholar]
  31. Hoang, H. Monitoring and Assessment of Macroinvertebrate Communities in Support of River Management in Northern Vietnam; Faculty of Bioscience Engineering, Ghent University: Ghent, Belgium, 2009; ISBN 978-90-5989-321-4. [Google Scholar]
  32. Gonçalves, F.B.; Menezes, M.S.D. A comparative analysis of biotic indices that use macroinvertebrates to assess water quality in a coastal river of Paraná state, southern Brazil. Biota Neotrop. 2011, 11, 27–36. [Google Scholar] [CrossRef] [Green Version]
  33. Wilding, N.A.; White, J.C.; Chadd, R.P.; House, A.; Wood, P.J. The influence of flow permanence and drying pattern on macroinvertebrate biomonitoring tools used in the assessment of riverine ecosystems. Ecol. Indic. 2018, 85, 548–555. [Google Scholar] [CrossRef] [Green Version]
  34. Barbour, M.T.; Gerritsen, J.; Snyder, B.D.; Stribling, J.B. Rapid Bioassessment Protocols for Use in Streams and Wadeable Rivers: Periphyton, Benthic Macroinvertebrates and Fish, 2nd ed.; US Environmental Protection Agency: Washington, DC, USA, 1999; Volume 339, ISBN EPA841-B-99-002. [Google Scholar]
  35. Hering, D.; Buffagni, A.; Moog, O.; Sandin, L.; Sommerhäuser, M.; Stubauer, I.; Feld, C.; Johnson, R.; Pinto, P.; Skoulikidis, N. The development of a system to assess the ecological quality of streams based on macroinvertebrates design of the sampling programme within the AQEM project. Int. Rev. Hydrobiol. A J. Cover. All Asp. Limnol. Mar. Biol. 2003, 88, 345–361. [Google Scholar] [CrossRef]
  36. Barbour, M.T.; Stribling, J.B.; Verdonschot, P.F. The multihabitat approach of USEPA’s rapid bioassessment protocols: Benthic macroinvertebrates. Limnetica 2006, 25, 839–850. [Google Scholar]
  37. Lay, J.P.; Schauerte, W.; Klein, W.; Korte, F. Influence of tetrachloroethylene on the biota of aquatic systems: Toxicity to phyto-and zooplankton species in compartments of a natural pond. Arch. Environ. Contam. Toxicol. 1984, 13, 135–142. [Google Scholar] [CrossRef]
  38. Poschlod, P.; Kos, M.; Roauer, S.; Seemann, A.; Wiesmann, O.; Zeltner, G.H.; Kohler, A. Long-term monitoring in rivers of South Germany since the 1970s–macrophytes as indicators for the assessment of water quality and its implications for the conservation of rivers. In Long-Term Ecological Research; Springer: Dordrecht, The Netherlands, 2010; pp. 189–199. ISBN 978-90-481-8781-2. [Google Scholar]
  39. Lakew, A.; Moog, O. A multimetric index based on benthic macroinvertebrates for assessing the ecological status of streams and rivers in central and southeast highlands of Ethiopia. Hydrobiologia 2015, 751, 229–242. [Google Scholar] [CrossRef]
  40. Spink, P. The equatorial glaciers of East Africa. J. Glaciol. 1949, 1, 277–282. [Google Scholar] [CrossRef] [Green Version]
  41. Osmaston, H.A.; Harrison, S.P. The late quaternary glaciation of Africa: A regional synthesis. Quat. Int. 2005, 138, 32–54. [Google Scholar] [CrossRef]
  42. Council, N.W. River Quality: The 1980 Survey and Future Outlook; National Water Council London: London, UK, 1981; pp. 1–41. ISBN 0-901090-36-0. [Google Scholar]
  43. Hellawell, J.M. Biological Surveillance of Rivers; Water Research Center: Stevenage, London, UK, 1978. [Google Scholar]
  44. Armitage, P.; Moss, D.; Wright, J.; Furse, M. The performance of a new biological water quality score system based on macroinvertebrates over a wide range of unpolluted running-water sites. Water Res. 1983, 17, 333–347. [Google Scholar] [CrossRef]
  45. Trivedi, R.; de Kruijf, H.; de Zwart, D. The development and application of a yardstick for water quality evaluation. Sci. Total Environ. 1993, 134, 1191–1202. [Google Scholar] [CrossRef]
  46. Hilsenhoff, W.L. Rapid field assessment of organic pollution with a family-level biotic index. J. North Am. Benthol. Soc. 1988, 7, 65–68. [Google Scholar] [CrossRef]
  47. Dallas, H.F. The influence of biotope availability on macroinvertebrate assemblages in South African rivers: Implications for aquatic bioassessment. Freshw. Biol. 2007, 52, 370–380. [Google Scholar] [CrossRef]
  48. Bere, T.; Nyamupingidza, B.B. Use of biological monitoring tools beyond their country of origin: A case study of the South African Scoring System Version 5 (SASS5). Hydrobiologia 2014, 722, 223–232. [Google Scholar] [CrossRef] [Green Version]
  49. Munyika, S.; Kongo, V.; Kimwaga, R. River health assessment using macroinvertebrates and water quality parameters: A case of the Orange river in Namibia. Phys. Chem. Earth Parts A B C 2014, 76, 140–148. [Google Scholar] [CrossRef]
  50. Kaaya, L.; Day, J.; Dallas, H. Tanzania river scoring system (TARISS): A macroinvertebrate-based biotic index for rapid bioassessment of rivers. Afr. J. Aquat. Sci. 2015, 40, 109–117. [Google Scholar] [CrossRef]
  51. Tumusiime, J.; Tolo, C.U.; Dusabe, M.C.; Albrecht, C. Reliability of the Tanzania river scoring system (TARISS) macroinvertebrate index of water quality: A case study of the river Mpanga system, Uganda. J. Freshw. Ecol. 2019, 34, 541–557. [Google Scholar] [CrossRef]
  52. Turibamwe, E.; Wangalwa, R. A comparative study of two biological monitoring systems in assessing water quality: A case of river Birira, Sheema district, Uganda. Water Conserv. Manag. 2020, 4, 7–14. [Google Scholar] [CrossRef]
  53. Chang, F.H.; Lawrence, J.E.; Rios-Touma, B.; Resh, V.H. Tolerance values of benthic macroinvertebrates for stream biomonitoring: Assessment of assumptions underlying scoring systems worldwide. Environ. Monit. Assess. 2014, 186, 2135–2149. [Google Scholar] [CrossRef]
  54. Chow-Fraser, P.; Fraser, G.E. Ecosystem Health Assessment of Streams in the Rare Charitable Research Reserve; Department of Biology, McMaster University: Hamilton, ON, Canada, 2016; pp. 1–23. [Google Scholar]
  55. Dos Santos, D.A.; Molineri, C.; Reynaga, M.C.; Basualdo, C. Which index is the best to assess stream health? Ecol. Indic. 2011, 11, 582–589. [Google Scholar] [CrossRef]
  56. Harper, D.M.; Kemp, J.L.; Vogel, B.; Newson, M.D. Towards the assessment of “ecological integrity” in running waters of the United Kingdom. Hydrobiologica 2000, 422, 133–142. [Google Scholar] [CrossRef]
  57. Elias, J.D.; Ijumba, J.N.; Mgaya, Y.D.; Mamboya, F.A. Study on freshwater macroinvertebrates of some Tanzanian rivers as a basis for developing biomonitoring index for assessing pollution in tropical African regions. J. Ecosyst. 2014, 2014, 985389. [Google Scholar] [CrossRef] [Green Version]
  58. Qin, C.Y.; Zhou, J.; Cao, Y.; Zhang, Y.; Hughes, R.M.; Wang, B.X. Quantitative tolerance values for common stream benthic macroinvertebrates in the Yangtze River Delta, Eastern China. Environ. Monit. Assess. 2014, 186, 5883–5895. [Google Scholar] [CrossRef] [PubMed]
  59. Day, J. Geographical patterns, and their origins, in the dominance of major ions in South African rivers. South Afr. J. Sci. 1995, 91, 299–306. [Google Scholar]
  60. Ochieng, H.; Odong, R.; Okot-Okumu, J. Comparison of temperate and tropical versions of Biological Monitoring Working Party (BMWP) index for assessing water quality of river Aturukuku in Eastern Uganda. Glob. Ecol. Conserv. 2020, 23, e01183. [Google Scholar] [CrossRef]
  61. Taylor, P.J.; Lavrenchenko, L.A.; Carleton, M.D.; Verheyen, E.; Bennett, N.C.; Oosthuizen, C.J.; Maree, S. Specific limits and emerging diversity patterns in East African populations of laminate-toothed rats, genus Otomys (Muridae: Murinae: Otomyini): Revision of the Otomys typus complex. Zootaxa 2011, 3024, 1–66. [Google Scholar] [CrossRef] [Green Version]
  62. Reinhardt, J.; Liersch, S.; Abdeladhim, M.A.; Diallo, M.; Dickens, C.; Fournet, S.; Hattermann, F.F.; Kabaseke, C.; Muhumuza, M.; Mul, M.L. Systematic evaluation of scenario assessments supporting sustainable integrated natural resources management. Ecol. Soc. 2018, 23. [Google Scholar] [CrossRef] [Green Version]
  63. Owor, M.; Hartwig, T.; Muwanga, A.; Zachmann, D.; Pohl, W. Impact of tailings from the Kilembe copper mining district on Lake George, Uganda. Environ. Geol. 2007, 51, 1065–1075. [Google Scholar] [CrossRef]
  64. Dowhaniuk, N. Assessing the Impact of Industrial Oil Development, Human Population Growth, and Post-Conflict Regrowth in an African Biodiversity Hotspot. Master’s Thesis, University of New Hampshire, Durham, NH, USA, 2016. [Google Scholar]
  65. Myers, N.; Mittermeier, R.A.; Mittermeier, C.G.; Da Fonseca, G.A.; Kent, J. Biodiversity hotspots for conservation priorities. Nature 2000, 403, 853. [Google Scholar] [CrossRef]
  66. Musonge, P.S.; Boets, P.; Lock, K.; Ambarita, N.M.D.; Forio, M.A.E.; Verschuren, D.; Goethals, P.L. Baseline assessment of benthic macroinvertebrate community structure and ecological water quality in Rwenzori rivers (Albertine rift valley, Uganda) using biotic-index tools. Limnologica 2019, 75, 1–10. [Google Scholar] [CrossRef]
  67. Musonge, P.S.; Boets, P.; Lock, K.; Goethals, P.L. Drivers of benthic macroinvertebrate assemblages in Equatorial Alpine rivers of the Rwenzoris (Uganda). Water 2020, 12, 1668. [Google Scholar] [CrossRef]
  68. Eggermont, H.; Russell, J.M.; Schettler, G.; Van Damme, K.; Bessems, I.; Verschuren, D. Physical and chemical limnology of Alpine lakes and pools in the Rwenzori mountains (Uganda–DR Congo). Hydrobiologia 2007, 592, 151–173. [Google Scholar] [CrossRef]
  69. Taylor, R.; Rose, N.; Mackay, A.; Panizzo, V.; Mileham, L.; Ssemmanda, I.; Tindimugaya, C.; Nakileza, B.; Muwanga, A.; Hau, J. Climate Change and the Aquatic Ecosystems of the Rwenzori Mountains. Uganda Final Report to the Royal Geographical Society; Environmental Change Research Centre: London, UK, 2007; p. 113. [Google Scholar]
  70. Reynoldson, T.B.; Norris, R.; Resh, V.H.; Day, K.; Rosenberg, D. The reference condition: A comparison of multimetric and multivariate approaches to assess water-quality impairment using benthic macroinvertebrates. J. North Am. Benthol. Soc. 1997, 16, 833–852. [Google Scholar] [CrossRef]
  71. Hawkins, C.P.; Olson, J.R.; Hill, R.A. The reference condition: Predicting benchmarks for ecological and water-quality assessments. J. North Am. Benthol. Soc. 2010, 29, 312–343. [Google Scholar] [CrossRef] [Green Version]
  72. Stoddard, J.L.; Larsen, D.P.; Hawkins, C.P.; Johnson, R.K.; Norris, R.H. Setting expectations for the ecological condition of streams: The concept of reference condition. Ecol. Appl. 2006, 16, 1267–1276. [Google Scholar] [CrossRef]
  73. Chapman, D.V.; WHO. Water Quality Assessments: A guide to the Use of Biota, Sediments and Water in Environmental Monitoring, 2nd ed.; Taylor & Francis: New York, NY, USA, 1996; p. 656. ISBN 0-419-21590-5. [Google Scholar]
  74. Lock, K.; Adriaens, T.; Goethals, P. Effect of water quality on blackflies (diptera: Simuliidae) in Flanders (Belgium). Limnologica 2014, 44, 58–65. [Google Scholar] [CrossRef]
  75. Damanik-Ambarita, M.N.; Everaert, G.; Forio, M.A.E.; Nguyen, T.H.T.; Lock, K.; Musonge, P.L.S.; Suhareva, N.; Dominguez-Granda, L.; Bennetsen, E.; Boets, P. Generalized linear models to identify key hydromorphological and chemical variables determining the occurrence of macroinvertebrates in the Guayas river basin (Ecuador). Water 2016, 8, 297. [Google Scholar] [CrossRef] [Green Version]
  76. Borror, D.; DeLong, D.; Triplehorn, C. An Introduction to the Study of Insects, 5th ed.; Holt, Reinehart and Winston: New York, NY, USA, 1976; pp. 3–9. [Google Scholar]
  77. Gerber, A.; Gabriel, M. Aquatic Invertebrates of South African Rivers Field Guide; Institute for Water Quality Studies, Department of Water Affairs and Forestry: Pretoria, South Africa, 2002. [Google Scholar]
  78. R Development Core Team. R: A Language and Environment for Statistical Computing. A Reference Index; R. Foundation for Statistical Computing: Vienna, Austria, 2017; pp. 275–286. [Google Scholar]
  79. Hill, M.O.; Gauch, H.G. Detrended correspondence analysis: An improved ordination technique. In Classification and Ordination; Springer: Dordrecht, The Netherlands, 1980; pp. 47–58. [Google Scholar]
  80. Ter Braak, C.J. The analysis of vegetation-environment relationships by canonical correspondence analysis. Vegetatio 1987, 69, 69–77. [Google Scholar] [CrossRef]
  81. Ter Braak, C.J.; Verdonschot, P.F. Canonical correspondence analysis and related multivariate methods in aquatic ecology. Aquat. Sci. 1995, 57, 255–289. [Google Scholar] [CrossRef]
  82. Lepš, J.; Šmilauer, P. Multivariate Analysis of Ecological Data Using Canoco; Cambridge University Press: Cambridge, UK, 2003; ISBN 0521891086. [Google Scholar]
  83. Legendre, P.; Legendre, L.F. Numerical Ecology, 3rd ed.; Elsevier: Amsterdam, The Netherlands, 2012; Volume 24, ISBN 9780444538680. [Google Scholar]
  84. Palmer, M.W. Putting things in even better order: The advantages of canonical correspondence analysis. Ecology 1993, 74, 2215–2230. [Google Scholar] [CrossRef]
  85. Quinn, G.P.; Keough, M.J. Experimental Design and Data Analysis for Biologists; Cambridge University Press: Cambridge, UK, 2002; ISBN 978-0-521-00976-8. [Google Scholar]
  86. Lichstein, J.W.; Simons, T.R.; Shriner, S.A.; Franzreb, K.E. Spatial autocorrelation and autoregressive models in ecology. Ecol. Monogr. 2002, 72, 445–463. [Google Scholar] [CrossRef]
  87. Peres-Neto, P.R.; Legendre, P. Estimating and controlling for spatial structure in the study of ecological communities. Glob. Ecol. Biogeogr. 2010, 19, 174–184. [Google Scholar] [CrossRef]
  88. Smith, A.J.; Bode, R.W.; Kleppel, G.S. A nutrient biotic index (NBI) for use with benthic macroinvertebrate communities. Ecol. Indic. 2007, 7, 371–386. [Google Scholar] [CrossRef]
  89. Ter Braak, C.J. A theory of gradient analysis. Adv. Ecol. Res. 1988, 18, 271–317. [Google Scholar]
  90. Zar, J.H. Biostatistical Analysis, 5th ed.; Pearson Education: Upper Saddle River, NJ, USA, 2010; pp. 205–206. ISBN 139780131008465. [Google Scholar]
  91. Dallas, H.F. River Health Programme: South African Scoring System (SASS) Data Interpretation Guidelines; University of Cape Town: Cape Town, South Africa, 2007. [Google Scholar]
  92. Menezes, S.; Baird, D.J.; Soares, A.M. Beyond taxonomy: A review of macroinvertebrate trait-based community descriptors as tools for freshwater biomonitoring. J. Appl. Ecol. 2010, 47, 711–719. [Google Scholar] [CrossRef]
  93. Herman, M.R.; Nejadhashemi, A.P. A review of macroinvertebrate-and fish-based stream health indices. Ecohydrol. Hydrobiol. 2015, 15, 53–67. [Google Scholar] [CrossRef] [Green Version]
  94. Nsubuga, F.N.; Namutebi, E.N.; Nsubuga-Ssenfuma, M. Water resources of Uganda: An assessment and review. J. Water Resour. Prot. 2014, 6, 1297. [Google Scholar] [CrossRef] [Green Version]
  95. Nicol, A.; Odinga, W. IWRM in Uganda-progress after decades of implementation. Water Altern. 2016, 9, 627–643. [Google Scholar]
  96. Stark, J.D.; Maxted, J.R. A biotic index for New Zealand’s soft-bottomed streams. N. Z. J. Mar. Freshw. Res. 2007, 41, 43–61. [Google Scholar] [CrossRef]
  97. Gray, D.; Harding, J. Acid mine drainage index (AMDI): A benthic invertebrate biotic index for assessing coal mining impacts in New Zealand streams. N. Z. J. Mar. Freshw. Res. 2012, 46, 335–352. [Google Scholar] [CrossRef] [Green Version]
  98. Ter Braak, C.J. Canonical correspondence analysis: A new eigenvector technique for multivariate direct gradient analysis. Ecology 1986, 67, 1167–1179. [Google Scholar] [CrossRef] [Green Version]
  99. Ter Braak, C.J.; Juggins, S. Weighted averaging partial least squares regression (WA-PLS): An improved method for reconstructing environmental variables from species assemblages. In Proceedings of the Twelfth International Diatom Symposium, Renesse, The Netherlands, 30 August–5 September 1992; pp. 485–502. [Google Scholar]
  100. Šmilauer, P.; Lepš, J. Multivariate Analysis of Ecological Data Using Canoco 5; Cambridge University Press: Cambridge, UK, 2014; ISBN 9781107694408. [Google Scholar]
  101. Brody, S.D.; Highfield, W.; Peck, B.M. Exploring the mosaic of perceptions for water quality across watersheds in San Antonio, Texas. Landsc. Urban Plan. 2005, 73, 200–214. [Google Scholar] [CrossRef]
  102. Zettler, M.L.; Schiedek, D.; Bobertz, B. Benthic biodiversity indices versus salinity gradient in the southern Baltic Sea. Mar. Pollut. Bull. 2007, 55, 258–270. [Google Scholar] [CrossRef] [PubMed]
  103. Wu, N.; Cai, Q.; Fohrer, N. Development and evaluation of a diatom-based index of biotic integrity (D-IBI) for rivers impacted by run-of-river dams. Ecol. Indic. 2012, 18, 108–117. [Google Scholar] [CrossRef]
  104. Brown, E.D.; Williams, B.K. Ecological integrity assessment as a metric of biodiversity: Are we measuring what we say we are? Biodivers. Conserv. 2016, 25, 1011–1035. [Google Scholar] [CrossRef] [Green Version]
  105. Spyra, A.; Kubicka, J.; Strzelec, M. The use of biological indices for the assessment of the river quality (Ruda River, Poland). Ecol. Chem. Eng. S 2017, 24, 285–298. [Google Scholar] [CrossRef] [Green Version]
  106. Gabriels, W.; Lock, K.; De Pauw, N.; Goethals, P.L.M. Multimetric macroinvertebrate index flanders (MMIF) for biological assessment of rivers and lakes in Flanders (Belgium). Limnologica 2010, 40, 199–207. [Google Scholar] [CrossRef] [Green Version]
  107. Nguyen, H.H.; Everaert, G.; Gabriels, W.; Hoang, T.H.; Goethals, P.L.M. A multimetric macroinvertebrate index for assessing the water quality of the Cau river basin in Vietnam. Limnologica 2014, 45, 16–23. [Google Scholar] [CrossRef]
Figure 1. Map showing the 101 selected study sites. Inset legend: Group 1 (blue squares)—2014 sites and Group 2 (black squares)—2017 sites.
Sustainability 12 10473 g001
Figure 2. The partial Canonical Correspondence Analysis (pCCA) biplot of macroinvertebrate presence-absence data in 101 sites illustrating the relationship between assemblage composition and the significant chemical variables following conditioning of both spatial/geographical (longitude, latitude, elevation) and other non-chemical parameters (main substrate type, temperature, and velocity) effects. The solid blue arrows illustrate the two key variables influencing macroinvertebrate assemblage dissimilarity (i.e., OPO4: Orthophosphate and pH).
Sustainability 12 10473 g002
Figure 3. Box plots showing Rwenzori Scores (RS) for the 101 sites divided into their four water quality categories (excellent class (e); good class (g); fair class (f); and poor class (p)) (a). Orthophosphate levels of the four water quality categories (b). (Significance levels: p < 0.05 *; p < 0.01 ** based on Welch Analysis of Variance (ANOVA) test with Tukey Honest Significant Difference (HSD) post hoc multiple comparison test).
Sustainability 12 10473 g003
Figure 4. Spearman correlation (rs) plots between ln-transformed Rwenzori score (RS) and Average Score Per Taxon (ASPT) (a) (rs = 0.74), r2adjusted = 0.46, p < 0.001) and South African Score (SASS5) (b) (rs = 0.37), r2adjusted = 0.26, p < 0.001). The blue lines depict a linear model of the best fit while the 95% confidence intervals are represented by the grey lines.
Sustainability 12 10473 g004
Table 1. Summary of the physicochemical variables measured in 101 Rwenzori sampling sites.
Variable (Unit)Mean ± Std.DevRange
Temp (°C)21.9 ± 3.215.6–30.8
SpCond (mS m−1)0.18 ± 0.180.05–0.88
pH (−)7.6 ± 0.74.9–10
DO (mg L−1)9 ± 30.9–21.2
Velocity (m·s−1)0.71 ± 0.490–1.51
Altitude (m.a.s.l.)1169 ± 174916–1538
TN (mg L−1)1.67 ± 0.960.23–5.35
NH4N (mg L−1)0.062 ± 0.0470.017–0.229
NO3N (mg L−1)0.622 ± 0.6140.14–6.25
NO2N (mg L−1)0.02 ± 0.0290.001–0.15
TP (mg L−1)0.149 ± 0.1270.009–0.61
OPO4 (mg L−1)0.138 ± 0.90.006–5.33
BOD5 (mg L−1)5.67 ± 1.791.19–8.43
COD (mg L−1)24.95 ± 15.982.67–75
Note: TN: Total nitrogen, NH4N: Ammonium nitrogen, NO3N: Nitrate nitrogen, NO2N: Nitrite nitrogen, TP: Total phosphorus, OPO4: Orthophosphate, BOD5: Five-day biochemical oxygen demand, COD: Chemical oxygen demand, Temp: Temperature, SpCond: Specific Conductivity, DO: Dissolved oxygen.
Table 2. Categories of water quality based on Rwenzori Score pollution tolerance values of macroinvertebrate taxa of Rwenzori freshwater systems.
ClassRwenzori Score
Excellent quality6+
Good quality5 to 5.9
Fair quality4 to 4.9
Poor quality<3.9
Table 3. Number of sites assigned to four ecological water quality classes by the three biotic indices. Inset abbreviations: ASPT—Average Score Per Taxon; SASS5—South African Scoring System version 5; RS—Rwenzori Score.
IndexExcellentGoodFairPoor
ASPT48281312
SASS525291136
RS53241113
Publisher’s Note: MDPI stays neutral with regard to jurisdictional claims in published maps and institutional affiliations.

