Cross-Regional Highway Built through a City Centre as an Example of the Sustainable Development of Urban Transport


Abstract
1. Introduction
- Car use reduction,
- Transport taxes and
- Popularisation of public transport.
2. Materials and Methods
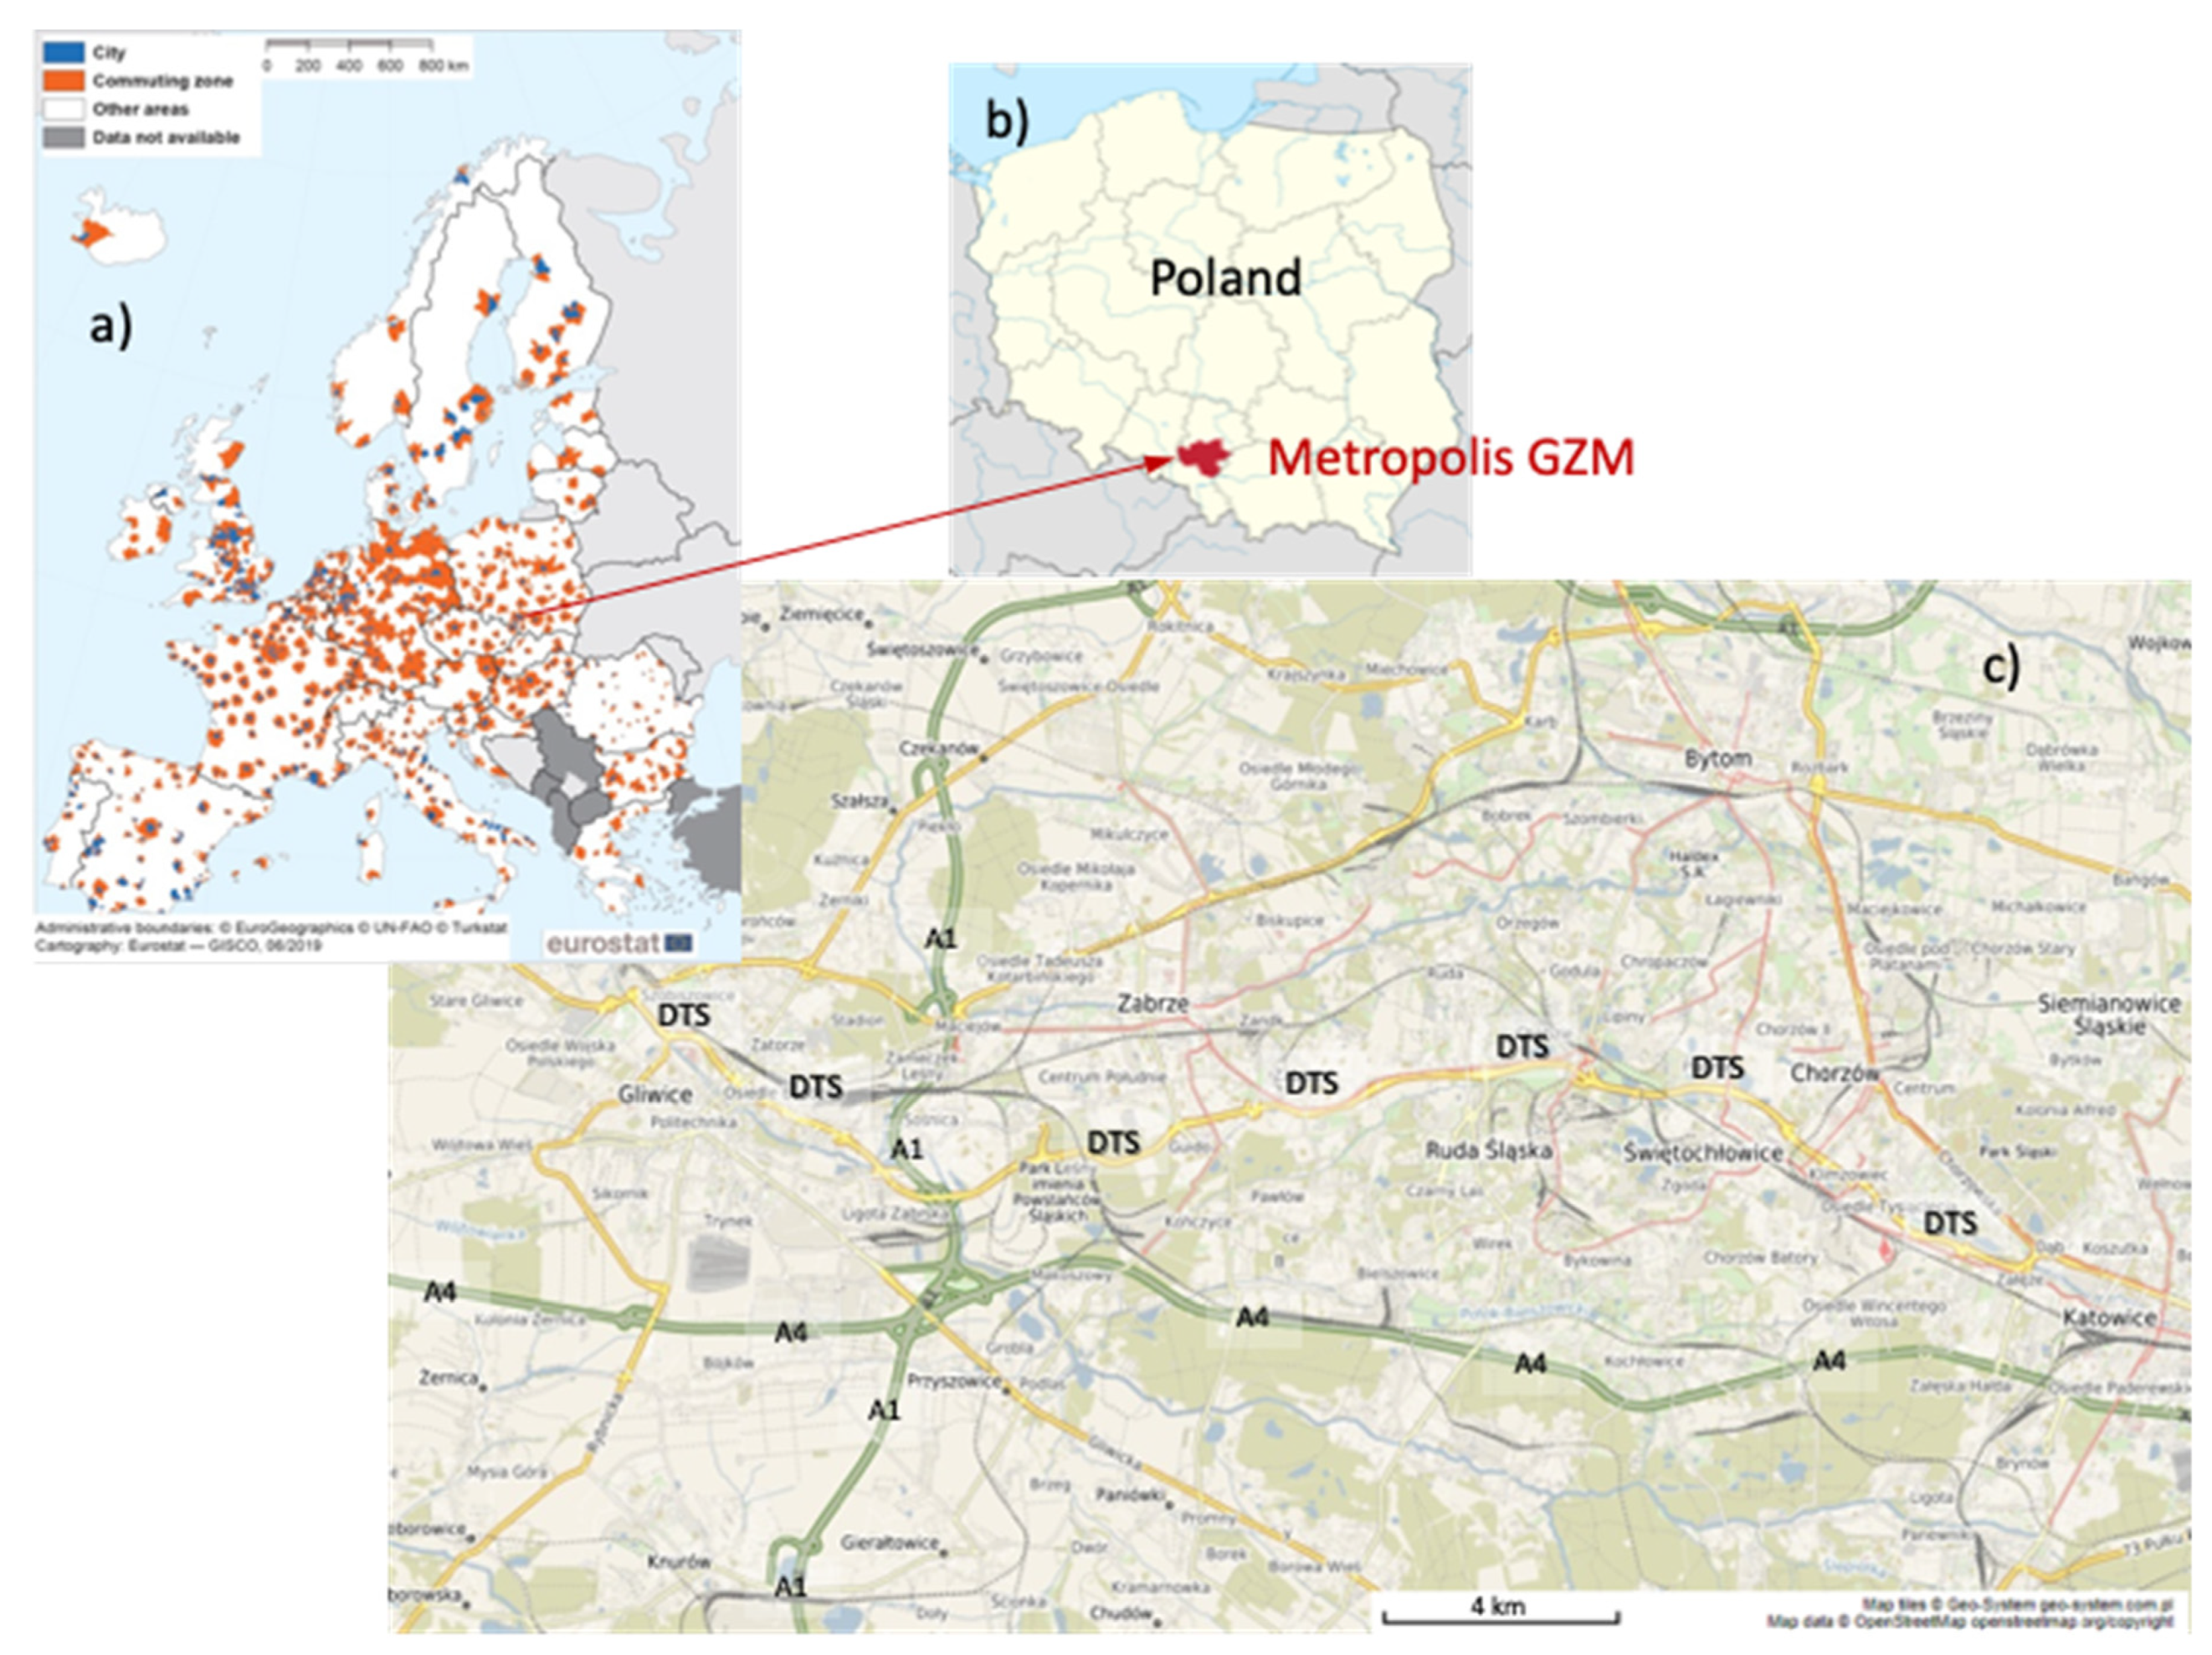
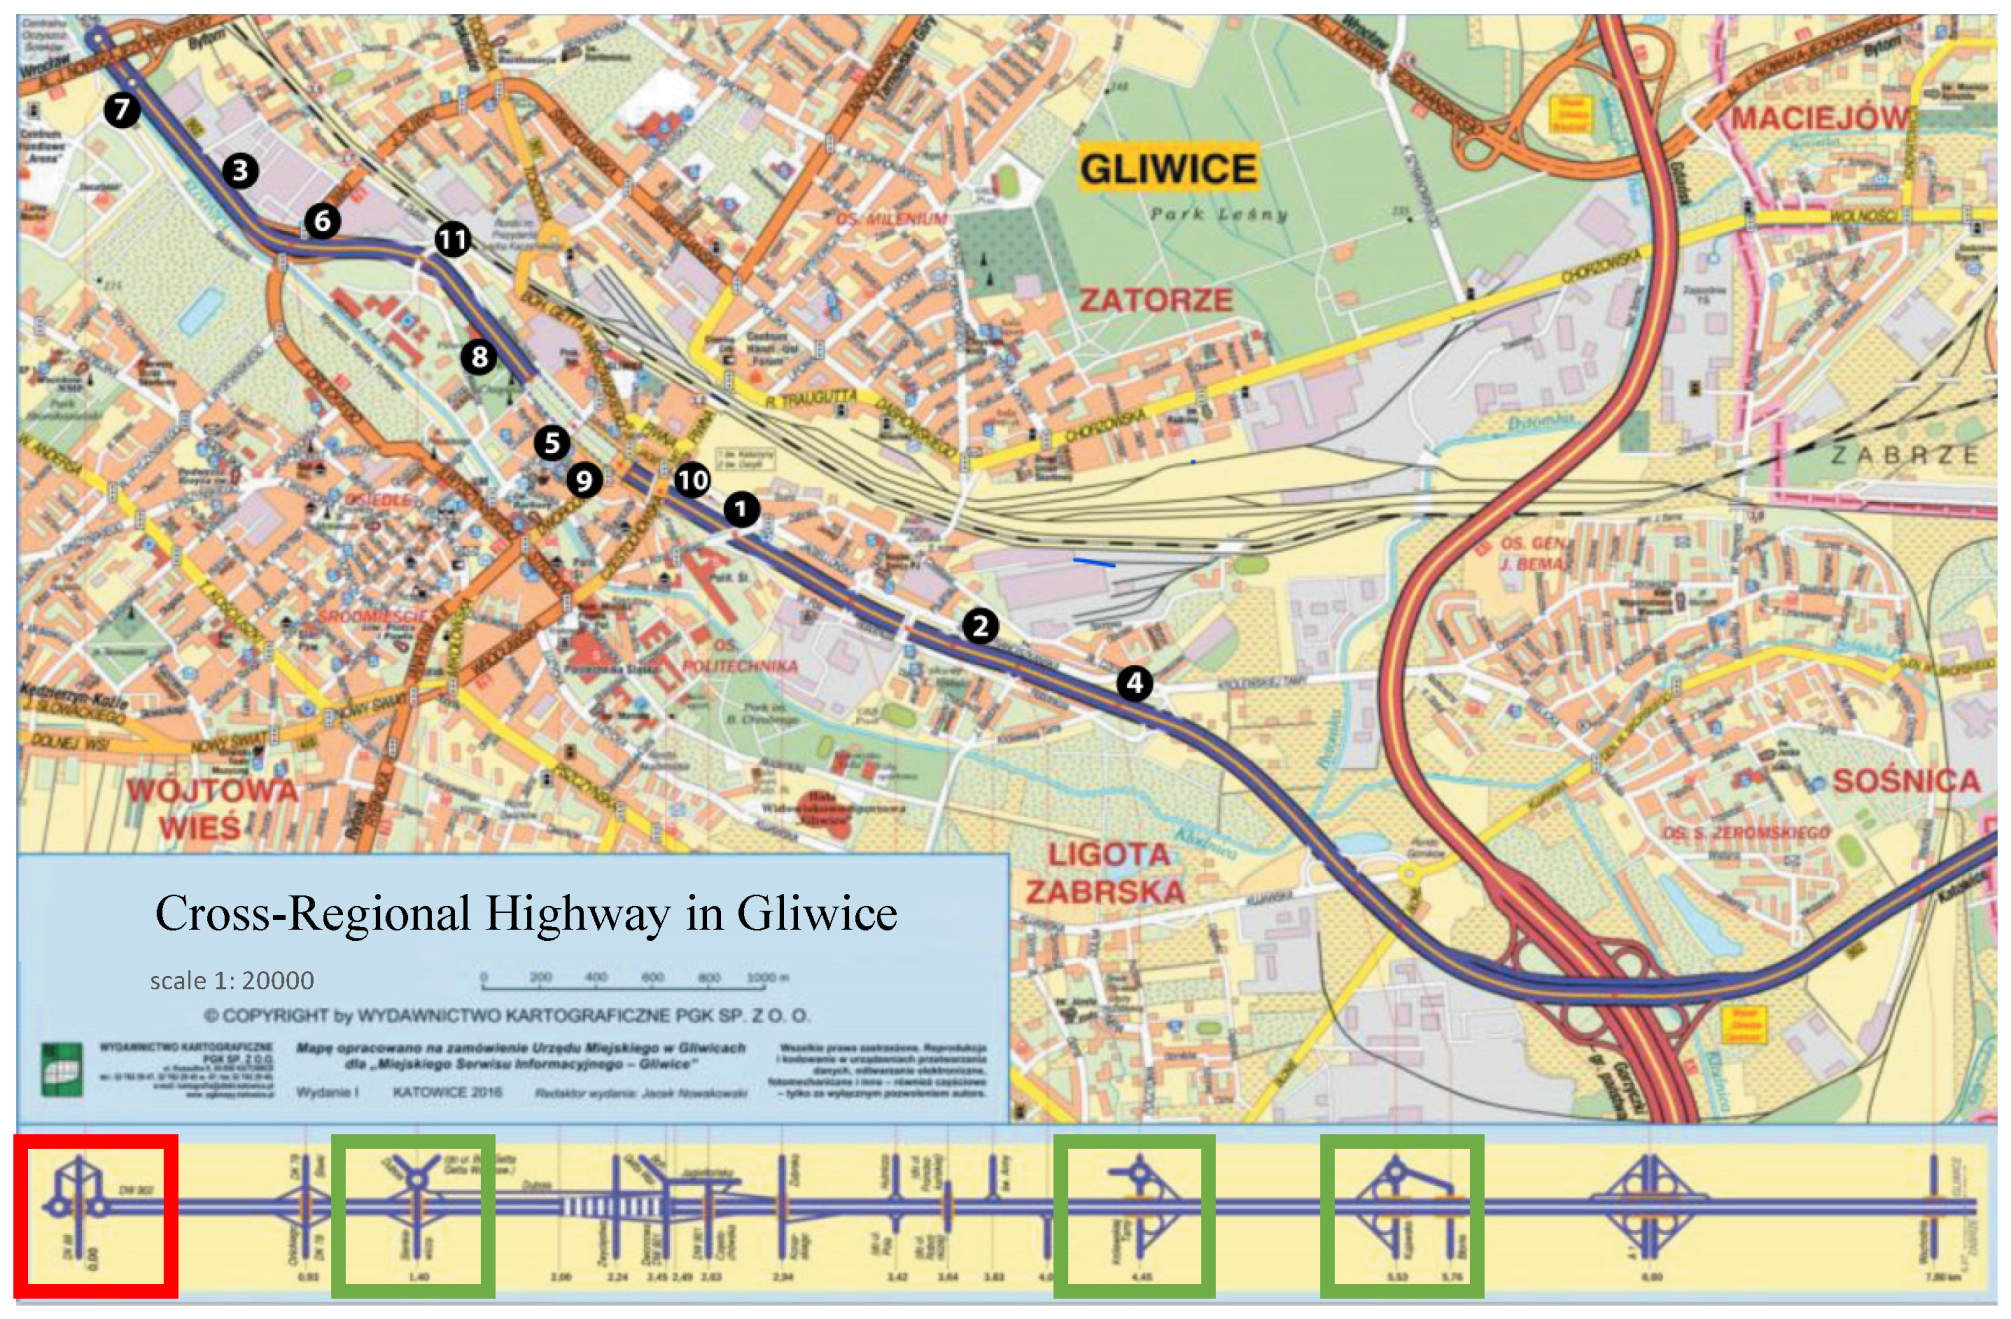
2.1. Study Area
2.2. Characteristics of Sampling Points
2.3. Sample Collection and Preparation
2.4. Spectrophotometric Sample Analysis
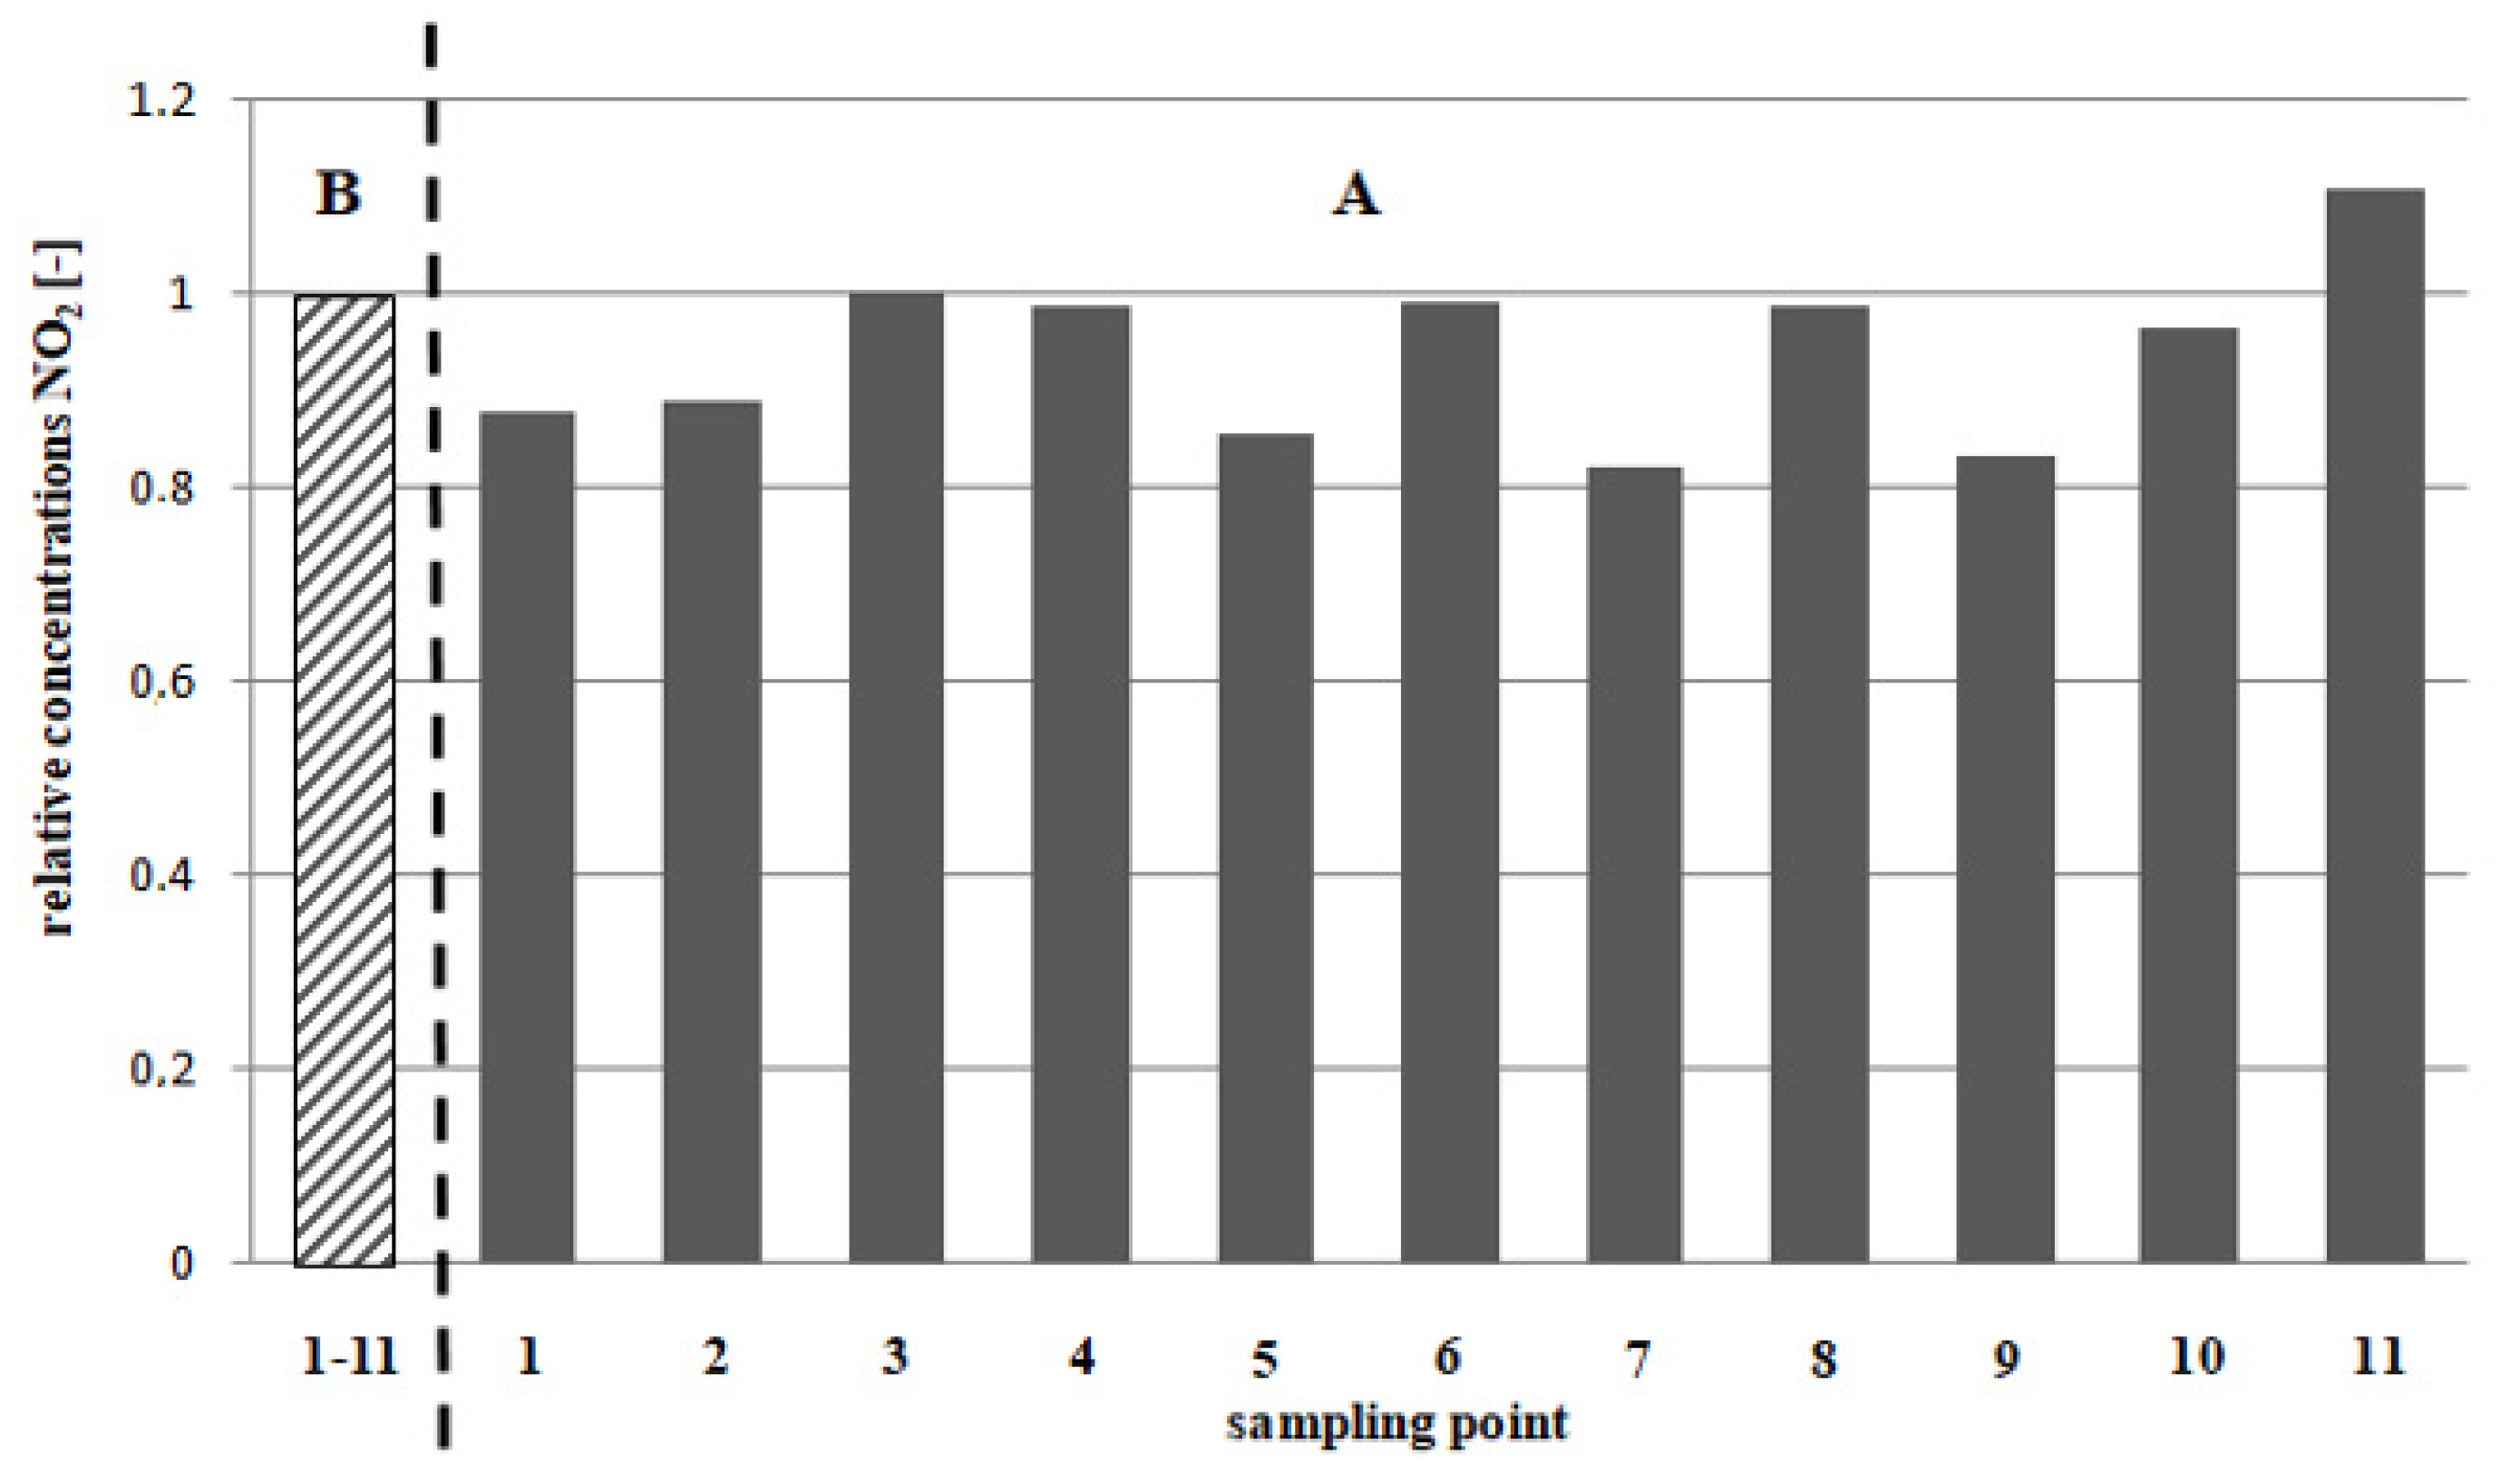
3. Results
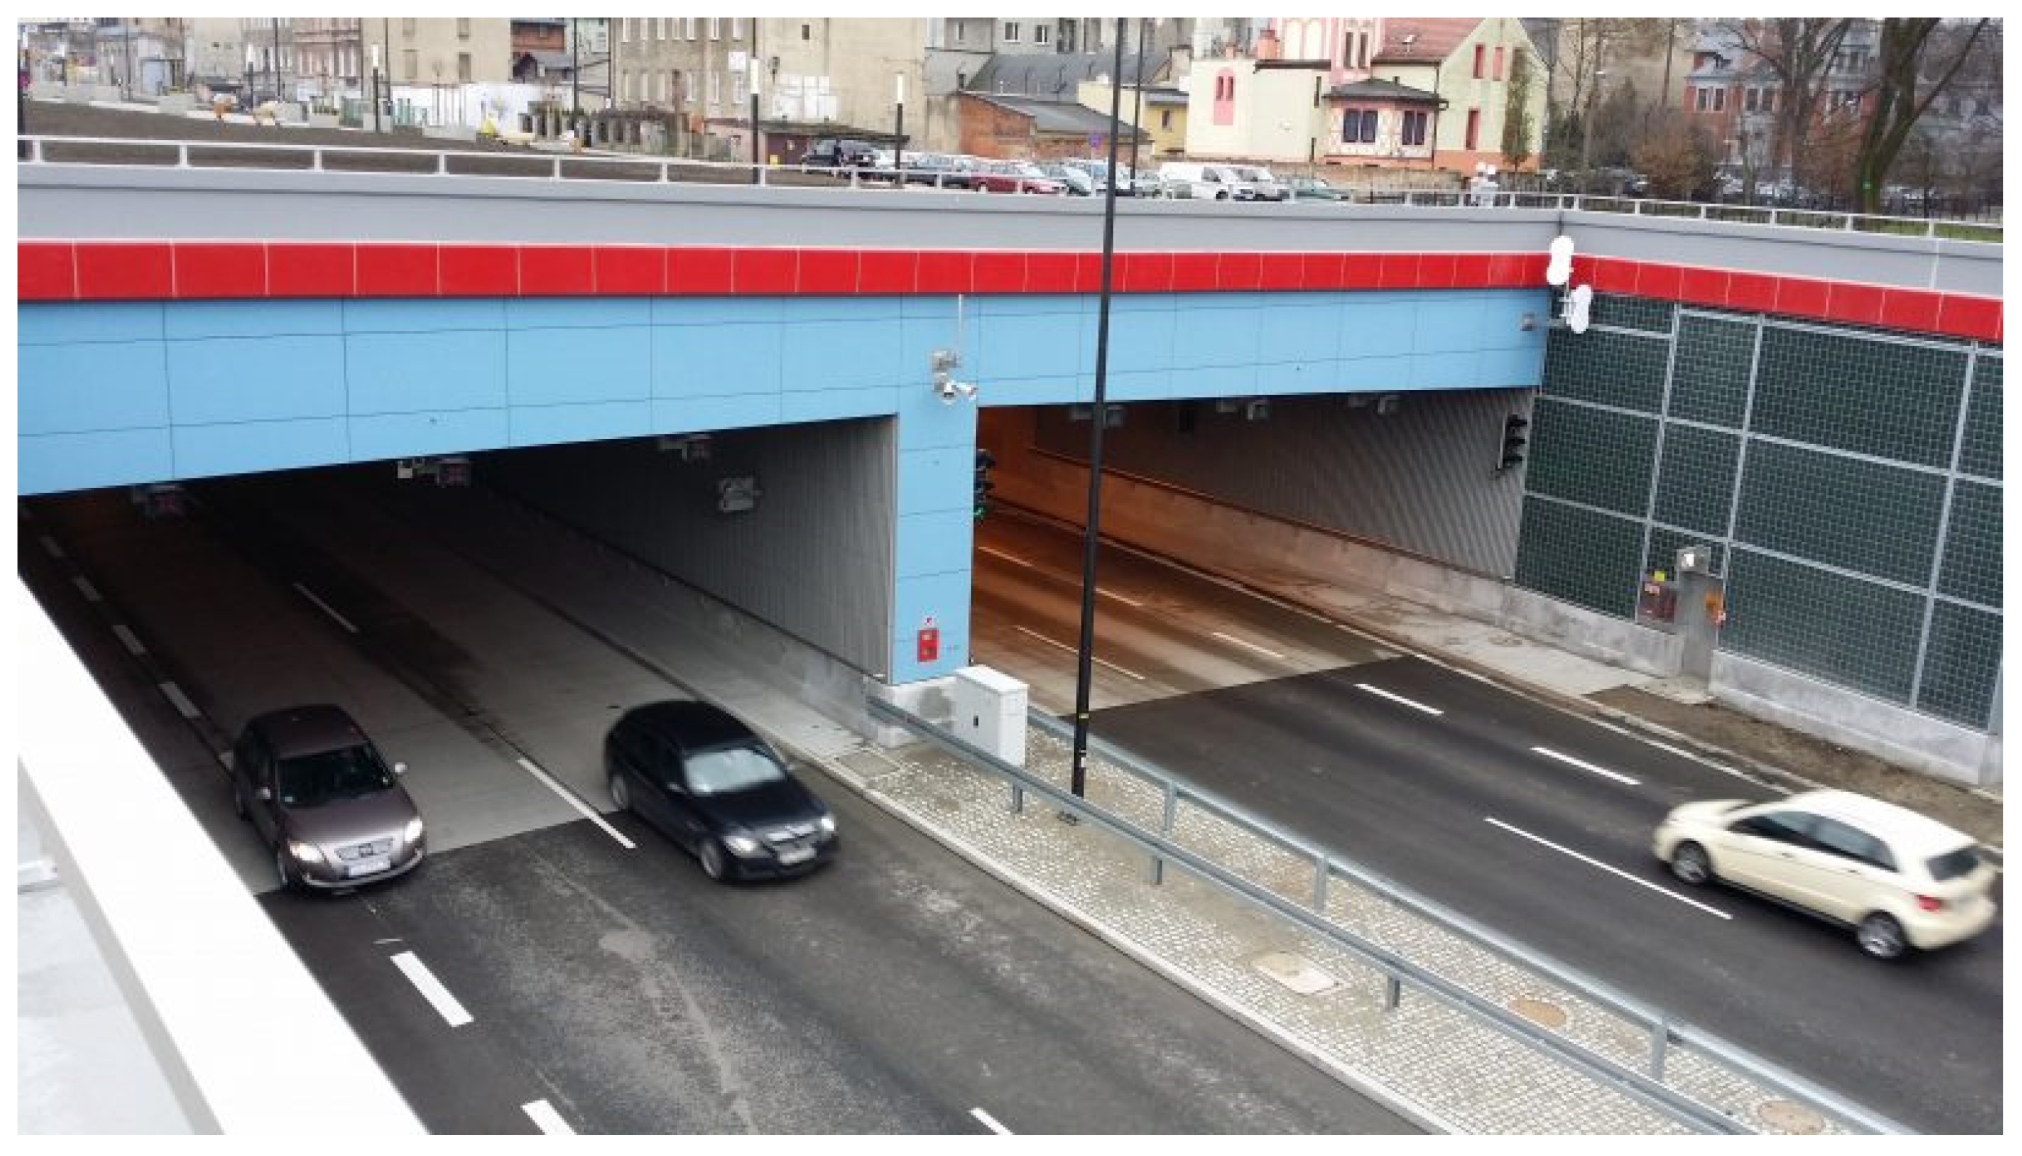
4. Discussion
- A clear decrease in concentrations (change >10%),
- A slight decrease in concentrations (change <5%) and
- An increase in concentrations.
- The imposition of a speed limit of 70 km/h,
- The dense network of DTS entrances and exits,
- The tunnel,
- The roundabout and
- The noise barriers.
5. Strengths and Limitations
6. Conclusions
Supplementary Materials
Author Contributions
Funding
Acknowledgments
Conflicts of Interest
References
- Żak, M.; Melaniuk-Wolny, E.; Widziewicz, K. The exposure of pedestrians, drivers and road transport passengers to nitrogen dioxide. Atmos. Pollut. Res. 2017, 8, 781–790. [Google Scholar] [CrossRef]
- Żak, M.; Loster, A.; Melaniuk-Wolny, E.; Kozielska, B. Air contamination with nitrogen dioxide in the vicinity of Gliwice transport routes before opening the A4 motorway fragment Kleszczow-Gliwice. Arch. Environ. Prot. 2007, 33, 3–15. [Google Scholar]
- ACEA (European Automobile Manufacturers Association) Report: Vehicles in Use–Europe 2019. Available online: https://www.acea.be/statistics/tag/category/report-vehicles-in-use (accessed on 30 September 2020).
- GUS (Statistical Office) Production. Construction. Investments. Fixed Assets. Transport. Available online: https://katowice.stat.gov.pl/en/information-about-voivodship/voivodship-385/production-construction-investments-fixed-assets-transport/ (accessed on 30 September 2020).
- Times Poland Ile Jest Samochodów na Świecie? Available online: https://polskatimes.pl/ile-jest-samochodow-na-swiecie/ar/10496459 (accessed on 30 September 2020).
- Kiba-Janiak, M.; Witkowski, J. Sustainable urban mobility plans: How do they work? Sustainability 2019, 11, 4605. [Google Scholar] [CrossRef]
- Hagenbjörk, A.; Malmqvist, E.; Mattisson, K.; Sommar, N.J.; Modig, L. The spatial variation of O3, NO, NO2 and NOx and the relation between them in two Swedish cities. Environ. Monit. Assess. 2017, 189, 161. [Google Scholar] [CrossRef] [PubMed]
- Manahan, S.E. Toksykologia Środowiska-Aspekty Chemiczne i Biochemiczne Environmental Toxicology. Chemical and Biochemical Aspects; PWN: Warszawa, Poland, 2006. (In Polish) [Google Scholar]
- Hood, D.B.; Gettins, P.; Johnson, D.A. Nitrogen dioxide reactivity with proteins: Effects on activity and immunoreactivity with α-1-proteinase inhibitor and implications for NO2-mediated peptide degradation. Arch. Biochem. Biophys. 1993, 304, 17–26. [Google Scholar] [CrossRef] [PubMed]
- Santana, J.C.C.; Miranda, A.C.; Yamamura, C.L.K.; Filho, S.C.D.; Tambourgi, E.B.; Ho, L.L.; Berssaneti, F.T. Effects of air pollution on human health and costs: Current situation in São Paulo, Brazil. Sustainability 2020, 12, 4875. [Google Scholar] [CrossRef]
- Hesterberg, T.W.; Bunn, W.B.; McClellan, R.O.; Hamade, A.K.; Long, C.M.; Valberg, P.A. Critical review of the human data on short-term nitrogen dioxide (NO2) exposures: Evidence for NO2 no-effect levels. Crit. Rev. Toxicol. 2009, 39, 743–781. [Google Scholar] [CrossRef]
- Morrow, P.E. Toxicological data on NOx: An overview. J. Toxicol. Environ. Health 1984, 13, 205–227. [Google Scholar] [CrossRef]
- Guarnieri, M.; Balmes, J.R. Outdoor air pollution and asthma. Lancet 2014, 383, 1581–1592. [Google Scholar] [CrossRef]
- Ghermandi, G.; Fabbi, S.; Veratti, G.; Bigi, A.; Teggi, S. Estimate of Secondary NO2 Levels at Two Urban Traffic Sites Using Observations and Modelling. Sustainability 2020, 12, 7897. [Google Scholar] [CrossRef]
- Sheehan, M.C.; Lam, J.; Navas-Acien, A.; Chang, H.H. Ambient air pollution epidemiology systematic review and meta-analysis: A review of reporting and methods practice. Environ. Int. 2016, 92, 647–656. [Google Scholar] [CrossRef] [PubMed]
- Public Health England. The Effects of Long-Term Exposure to Ambient Air Pollution on Cardiovascular Morbidity: Mechanistic Evidence. A Report by the Committee on the Medical Effects of Air Pollutants; COMEAP, Public Health England: London, UK, 2018. [Google Scholar]
- Pénard-Morand, C.; Raherison, C.; Charpin, D.; Kopferschmitt, C.; Lavaud, F.; Caillaud, D.; Annesi-Maesano, I. Long-term exposure to close-proximity air pollution and asthma and allergies in urban children. Eur. Respir. J. 2010, 36, 33–40. [Google Scholar] [CrossRef] [PubMed]
- Laumbach, R.J.; Kipen, H.M. Respiratory health effects of air pollution: Update on biomass smoke and traffic pollution. J. Allergy Clin. Immunol. 2012, 129, 3–11. [Google Scholar] [CrossRef] [PubMed]
- Carvalho, P.C.; Nakazato, L.F.; Nascimento, L.F.C. Exposure to NO2 and children hospitalization due to respiratory diseases in Ribeirão Preto, SP, Brazil. Cienc. Saude Coletiva 2018, 23, 2515–2522. [Google Scholar] [CrossRef] [PubMed]
- Pintarić, S.; Zeljković, I.; Bodrožić-Džakić, T.; Vrsalović, M.; Zekanović, D.; Pintarić, H. Correlation between atmospheric air pollution by nitrogen dioxide meteorological parameters and the number of patients admitted to the Emergency Department. Acta Clin. Croat. 2012, 51, 9–15. [Google Scholar] [PubMed]
- Mills, I.C.; Atkinson, R.W.; Kang, S.; Walton, H.; Anderson, H.R. Quantitative systematic review of the associations between short-term exposure to nitrogen dioxide and mortality and hospital admissions. BMJ Open 2015, 5, e006946. [Google Scholar] [CrossRef]
- Komornicki, T. Geographical Studies No. 227 Transformations in the Daily Mobility of Poles against the Background of Development of Car Ownership; Instytut Geografii i Przestrzennego Zagospodarowania PAN im. Stanisława Leszczyckiego: Warszawa, Poland, 2011. [Google Scholar]
- Degraeuwe, B.; Pisoni, E.; Christidis, P.; Christodoulou, A.; Thunis, P. SHERPA-city: A web application to assess the impact of traffic measures on NO2 pollution in cities. Environ. Model. Softw. 2021, 135, 104904. [Google Scholar] [CrossRef]
- Dhondt, S.; Kochan, B.; Beckx, C.; Lefebvre, W.; Pirdavani, A.; Degraeuwe, B.; Bellemans, T.; Int Panis, L.; Macharis, C.; Putman, K. Integrated health impact assessment of travel behaviour: Model exploration and application to a fuel price increase. Environ. Int. 2013, 51, 45–58. [Google Scholar] [CrossRef]
- Degrauewe, B.; Pisoni, E.; Peduzzi, E.; de Meij, A.; Monforti-Ferrario, F.; Bodis, K.; Mascherpa, A.; Astorga-Llorens, M.; Thunis, P.; Vignati, E. Urban NO2 Atlas; Publications Office of the European Union: Luxembourg, 2019. [Google Scholar]
- Lefebvre, W.; Degrawe, B.; Beckx, C.; Vanhulsel, M.; Kochan, B.; Bellemans, T.; Janssens, D.; Wets, G.; Janssen, S.; de Vlieger, I.; et al. Presentation and evaluation of an integrated model chain to respond to traffic- and health-related policy questions. Environ. Model. Softw. 2013, 40, 160–170. [Google Scholar] [CrossRef]
- Burr, M.L.; Karani, G.; Davies, B.; Holmes, B.A.; Williams, K.L. Effects on respiratory health of a reduction in air pollution from vehicle exhaust emissions. Occup. Environ. Med. 2004, 61, 212–218. [Google Scholar] [CrossRef]
- Eurostat European Cities 2. Available online: https://ec.europa.eu/eurostat/documents/3217494/10095393/KS-HA-19-001-EN-N.pdf/d434affa-99cd-4ebf-a3e3-6d4a5f10bb07 (accessed on 10 September 2020).
- Eurostat. Eurostat Regional Yearbook, 2019 ed.; Publications Office of the European Union: Luxembourg, 2019. [Google Scholar]
- PwC Advisory. The Socio-Economic Potential of Metropolis GZM. Available online: http://metropoliagzm.pl/wp-content/uploads/2019/02/GZM_raport.pdf (accessed on 6 October 2020).
- DTŚ, S.A. Information about the Katowice-Gliwice Cross-Regional Highway (DTS). Available online: http://www.portalsamorzadowy.pl/plikiu/79266.html (accessed on 6 October 2020).
- PKN. PN-Z-04009-08: Air Purity Protection, Tests for Nitric Acid and Nitrogen Oxides. Determination of Nitrogen Dioxide in Ambient Air (Imision) by Spectrophotometric Method with Passive Sampling; Polish Committee for Standarization: Warsaw, Poland, 1989. [Google Scholar]
- Glasius, M.; Carlsen, M.F.; Hansen, T.S.; Lohse, C. Measurements of nitrogen dioxide on Funen using diffusion tubes. Atnospheric Environ. 1999, 33, 1177–1185. [Google Scholar] [CrossRef]
- Varshney, C.K.; Singh, A.P. Passive samplers for NOx monitoring: A critical review. Environmentalist 2003, 23, 127–136. [Google Scholar] [CrossRef]
- Hafkenscheid, T.; Fromage-Mariette, A.; Goelen, E.; Hangartner, M.; Pfeffer, U.; Plaisance, H.; de Santis, F.; Saunders, K.; Swaans, W.; Tang, Y.S.; et al. Review of the Application of Diffusive Samplers for the Measurement of Nitrogen Dioxide in Ambient Air in the European Union|EU Science Hub. Available online: https://ec.europa.eu/jrc/en/publication/eur-scientific-and-technical-research-reports/review-application-diffusive-samplers-measurement-nitrogen-dioxide-ambient-air-european (accessed on 6 October 2020).
- Kozielska, B.; Mainka, A.; Żak, M.; Kaleta, D.; Mucha, W. Indoor air quality in residential buildings in Upper Silesia, Poland. Build. Environ. 2020, 177, 106914. [Google Scholar] [CrossRef]
- Voiculescu, M.; Constantin, D.-E.; Condurache-Bota, S.; Călmuc, V.; Roșu, A.; Dragomir Bălănică, C.M. Role of Meteorological Parameters in the Diurnal and Seasonal Variation of NO2 in a Romanian Urban Environment. Int. J. Environ. Res. Public Health 2020, 17, 6228. [Google Scholar] [CrossRef]
- Çelik, M.B.; Kadi, İ. The Relation between Meteorological Factors and Pollutants Concentrations in Karabük City; G. U. Journal of Science 2007, 20, 87–95. [Google Scholar]
- Dominick, D.; Latif, T.; Juahir, H.; Aris, A.Z.; Zain, S.M. An assessment of influence of meteorological factors on PM and 10 NO at selected stations in Malaysia. Sustain. Environ. Res 2012, 22, 305–315. [Google Scholar]
- Elminir, H.K. Dependence of urban air pollutants on meteorology. Sci. Total Environ. 2005, 350, 225–237. [Google Scholar] [CrossRef]
- Gasmi, K.; Aljalal, A.; Al-Basheer, W.; Abdulahi, M. Analysis of NOx, NO and NO2 ambient levels as a function of meteorological parameters in Dhahran, Saudi Arabia. WIT Trans. Ecol. Environ. 2017, 211, 77–86. [Google Scholar]
- Zhou, R.; Wang, S.; Shi, C.; Wang, W.; Zhao, H.; Liu, R.; Chen, L.; Zhou, B. Study on the Traffic Air Pollution inside and outside a Road Tunnel in Shanghai, China. PLoS ONE 2014, 9, e112195. [Google Scholar] [CrossRef]
- Habeebullah, T.M.; Munir, S.; Awad, A.A.A.H.; Morsy, E.A.; Abdulaziz, R.S.; Mohammed, A.M.F. The Interaction between Air Quality and Meteorological Factors in an Arid Environment of Makkah, Saudi Arabia. Int. J. Environ. Sci. Dev. 2015, 6, 576–580. [Google Scholar] [CrossRef]
- Hosseinibalam, F.; Hejazi, A. Influence of Meteorological Parameters on Air Pollution in Isfahan. In Proceedings of the 3rd International Conference on Biology, Environment and Chemistry, Bangkok, Thailand, 24–25 November 2012; pp. 7–12. [Google Scholar]
- Day, D.A.; Wooldridge, P.J.; Cohen, R.C. Observations of the effects of temperature on atmospheric HNO3, ANs, PNs, and NOx: Evidence for a temperature-dependent HOx source. Atmos. Chem. Phys. 2008, 8, 1867–1879. [Google Scholar] [CrossRef]
- Kendrick, C.M.; Koonce, P.; George, L.A. Diurnal and seasonal variations of NO, NO2 and PM2.5 mass as a function of traffic volumes alongside an urban arterial. Atmos. Environ. 2015, 122, 133–141. [Google Scholar] [CrossRef]
- Liu, F.; Beirle, S.; Zhang, Q.; Dörner, S.; He, K.; Wagner, T. NOx lifetimes and emissions of cities and power plants in polluted background estimated by satellite observations. Atmos. Chem. Phys. 2016, 16, 5283–5298. [Google Scholar] [CrossRef]
- Ministry of Environment. Polish Journal of Laws Regulation of the Minister of Environment of 13 September 2012, No. 1031—The Levels of Certain Substances in the Ambient Air; Ministry of Environment: Warsaw, Poland, 2012. [Google Scholar]
- Oncology Centre. Anual Report. Available online: https://www.coi.pl/wp-content/uploads/2019/09/Sprawozdanie-Dyrektora-za-rok-2018-Wydruk.pdf. (accessed on 24 September 2020).
- Baldasano, J.M.; Gonçalves, M.; Soret, A.; Jiménez-Guerrero, P. Air pollution impacts of speed limitation measures in large cities: The need for improving traffic data in a metropolitan area. Atmos. Environ. 2010, 44, 2997–3006. [Google Scholar] [CrossRef]
- Keuken, M.P.; Jonkers, S.; Wilmink, I.R.; Wesseling, J. Reduced NOx and PM10 emissions on urban motorways in The Netherlands by 80 km/h speed management. Sci. Total Environ. 2010, 408, 2517–2526. [Google Scholar] [CrossRef] [PubMed]
- Punzo, V.; Cascetta, E.; Bonnel, P. Impact on Vehicle Speeds and Pollutant Emissions of a Fully Automated Section Speed Control Scheme on the Naples Urban Motorway. Available online: https://trid.trb.org/view/909670 (accessed on 6 October 2020).
- Cameron, M. Optimum speeds on rural roads based on “willingness to pay” values of road trauma. J. Australas. Coll. Road Saf. 2012, 23, 67–74. [Google Scholar]
- Badyda, A. Analysis and Evaluation of the Effects of Selected road Traffic Nuisance on the Urban Environment in Warsaw; Warsaw University of Technology: Warsaw, Poland, 2006. [Google Scholar]
- Andrzejewski, M.; Merkisz, J. The effect of CI engine speed on the emission of toxic compounds in the exhaust gases. Combust. Engines 2015, 162, 456–460. [Google Scholar]
- Andrzejewski, M. Influence of Driver’s Driving Style on Fuel Consumption and Emission of Harmful Substances in Exhaust Gases; Poznan University of Technology: Poznan, Poland, 2013. [Google Scholar]
- Cowie, C.T.; Rose, N.; Gillett, R.; Walter, S.; Marks, G.B. Redistribution of traffic related air pollution associated with a new road tunnel. Environ. Sci. Technol. 2012, 46, 2918–2927. [Google Scholar] [CrossRef]
- CEDR Conference of European Directors of Roads. Call 2012: Noise ON-AIR Guidance Book on the Integration of Noise in Road Planning. Available online: https://www.cedr.eu/download/Publications/2017/CEDR-Contractor-Report-2017-03_Call-2012-Noise_ON-AIR-Guidance-Manual.pdf (accessed on 29 September 2020).
- Meneguzzer, C.; Gastaldi, M.; Rossi, R.; Gecchele, G.; Prati, M.V. Comparison of exhaust emissions at intersections under traffic signal versus roundabout control using an instrumented vehicle. Transp. Res. Procedia 2017, 25, 1597–1609. [Google Scholar] [CrossRef]
- APCD (Air Pollution Control District) Modern Roundabouts. Available online: https://www.sdapcd.org/content/dam/sdc/apcd/PDF/AirQualityPlanning/Modern-Roundabouts-Traffic-Circles.pdf (accessed on 6 October 2020).
- Macioszek, E. The application of HCM 2010 in the determination of capacity of traffic lanes at turbo roundabout. Transp. Probl. 2016, 11, 77–89. [Google Scholar] [CrossRef]
- Grabowski, R.J. Turbo-roundabouts as an alternative to standard roundabouts with the circular centre island. Roads Bridg. 2012, 11, 215–231. [Google Scholar]
- Jaworski, A.; Lejda, K. Emission of pollution from motor vehicles with respect to selected solutions of roundabout intersections. Combust. Engines 2017, 168, 140–144. [Google Scholar]
- Silva, A.B.; Mariano, P.; Silva, J.P. Performance assessment of turbo-roundabouts in corridors. Transp. Res. Procedia 2015, 10, 124–133. [Google Scholar] [CrossRef]
- Fernandes, P.; Bandeira, J.M. Driving around turbo-roundabouts vs. conventional roundabouts: Are there advantages regarding pollutant emissions? Int. J. Sustain. Transp. 2016, 10, 847–860. [Google Scholar] [CrossRef]
- Meneguzzer, C.; Gastaldi, M.; Giancristofaro, R.A. Before-and-After Field Investigation of the Effects on Pollutant Emissions of Replacing a Signal-Controlled Road Intersection with a Roundabout. J. Adv. Transp. 2018. [Google Scholar] [CrossRef]
- Brechler, J.; Fuka, V. Impact of Noise Barriers on Air-Pollution Dispersion. Nat. Sci. 2014, 06, 377–386. [Google Scholar] [CrossRef][Green Version]
- CEDR Conference of European Directors of Roads. CEDR Transnational Road Research Programme, Call 2012: Noise: Integrating Strategic Noise Management into the Operation and Maintenance of National Road Networks DISTANCE State-of-the-Art on Secondary Functions for Pavements and Noise Screens. Available online: https://www.cedr.eu/download/other_public_files/research_programme/call_2012/road_noise/distance/DISTANCE-BRRC-D31-V01-010415-State-of-the-art-on-secondary-functions-of-noise-barriers-and-pavements.pdf (accessed on 21 November 2020).
- Zouzelka, R.; Rathousky, J. Photocatalytic abatement of NOx pollutants in the air using commercial functional coating with porous morphology. Appl. Catal. B Environ. 2017, 217, 466–476. [Google Scholar] [CrossRef]
- EUROVIA NOxer®. Innovation for sustainable development and Air Quality improvement. In Proceedings of the Sharing the Road 16th World Meeting, Lisbon, Portugal, 25–28 May 2010. [Google Scholar]
- Automobile Association Euro Emissions Standards. Available online: https://www.theaa.com/driving-advice/fuels-environment/euro-emissions-standards (accessed on 21 November 2020).
- Statistics Poland Environment. 2017. Available online: https://stat.gov.pl/obszary-tematyczne/srodowisko-energia/srodowisko/ochrona-srodowiska-2017,1,18.html (accessed on 13 November 2020).
- Statistics Poland Environment. 2013. Available online: https://stat.gov.pl/obszary-tematyczne/srodowisko-energia/srodowisko/ochrona-srodowiska-2013,1,14.html (accessed on 13 November 2020).
- Municipal Road Management in Gliwice ZDM Gliwice. Available online: https://zdm.gliwice.pl/ (accessed on 1 October 2020).
- infogliwice.pl Info Gliwice. Available online: https://infogliwice.pl/ile-samochodow-przejezdza-codziennie-tunelem-dts-w-gliwicach/ (accessed on 1 October 2020).
- Burns, J.; Boogaard, H.; Polus, S.; Pfadenhauer, L.M.; Rohwer, A.C.; van Erp, A.M.; Turley, R.; Rehfuess, E.A. Interventions to reduce ambient air pollution and their effects on health: An abridged Cochrane systematic review. Environ. Int. 2020, 135, 105400. [Google Scholar] [CrossRef]
- Titos, G.; Lyamani, H.; Drinovec, L.; Olmo, F.J.; Močnik, G.; Alados-Arboledas, L. Evaluation of the impact of transportation changes on air quality. Atmos. Environ. 2015, 114, 19–31. [Google Scholar] [CrossRef]
- Hajji, A.M.; Yulistyorini, A.; Yue, H.; Patulak, D.C. Emission factors of NOx and PM of heavy construction equipment used in toll road project in Indonesia-Case study: Rembang-Pasuruan Toll Section II. IOP Conf. Ser. Mater. Sci. Eng. 2019, 669. [Google Scholar] [CrossRef]
- Wang, X.; Duan, Z.; Wu, L.; Yang, D. Estimation of carbon dioxide emission in highway construction: A case study in southwest region of China. J. Clean. Prod. 2015, 103, 705–714. [Google Scholar] [CrossRef]
- Ma, F.; Sha, A.; Lin, R.; Huang, Y.; Wang, C. Greenhouse Gas Emissions from Asphalt Pavement Construction: A Case Study in China. Int. J. Environ. Res. Public Health 2016, 13, 351. [Google Scholar] [CrossRef] [PubMed]
- Quiros, D.C.; Thiruvengadam, A.; Pradhan, S.; Besch, M.; Thiruvengadam, P.; Demirgok, B.; Carder, D.; Oshinuga, A.; Huai, T.; Hu, S. Real-World Emissions from Modern Heavy-Duty Diesel, Natural Gas, and Hybrid Diesel Trucks Operating Along Major California Freight Corridors. Emiss. Control Sci. Technol. 2016, 2, 156–172. [Google Scholar] [CrossRef]
- Velders, G.J.M.; Geilenkirchen, G.P.; de Lange, R. Higher than expected NOx emission from trucks may affect attainability of NO2 limit values in the Netherlands. Atmos. Environ. 2011, 45, 3025–3033. [Google Scholar] [CrossRef]


| Sampling Point | Mean Value (μg/m3) | SD (μg/m3) | RSD (%) | Skewness |
|---|---|---|---|---|
| 1 | 25.4 | 3.1 | 12.3 | −0.38 |
| 2 | 26.9 | 6.0 | 22.3 | 0.87 |
| 3 | 28.8 | 7.2 | 24.9 | −1.07 |
| 4 | 23.2 | 4.7 | 20.2 | −0.42 |
| 5 | 29.4 | 8.8 | 29.9 | −0.13 |
| 6 | 26.8 | 7.3 | 27.3 | −0.98 |
| 7 | 31.9 | 5.6 | 17.6 | −1.10 |
| 8 | 25.0 | 6.3 | 25.4 | −1.24 |
| 9 | 26.8 | 7.7 | 28.6 | −1.02 |
| 10 | 24.6 | 5.5 | 22.2 | 0.29 |
| 11 | 23.8 | 5.1 | 21.3 | 0.14 |
| Sampling Point | Mean Value (g/m3) | SD (μg/m3) | RSD (%) | Skewness |
|---|---|---|---|---|
| 1 | 22.3 | 1.8 | 8.1 | −1.04 |
| 2 | 24.0 | 3.2 | 13.2 | 0.35 |
| 3 | 28.9 | 4.3 | 15.0 | 0.61 |
| 4 | 22.9 | 3.4 | 14.7 | 1.27 |
| 5 | 25.1 | 3.8 | 15.1 | 0.12 |
| 6 | 26.6 | 5.0 | 18.8 | 0.11 |
| 7 | 26.2 | 4.1 | 15.6 | −0.34 |
| 8 | 24.7 | 2.3 | 9.5 | −0.04 |
| 9 | 22.3 | 3.3 | 14.8 | −0.07 |
| 10 | 23.7 | 2.7 | 11.3 | −0.03 |
| 11 | 26.3 | 3.8 | 14.3 | 0.37 |
Publisher’s Note: MDPI stays neutral with regard to jurisdictional claims in published maps and institutional affiliations. |
© 2020 by the authors. Licensee MDPI, Basel, Switzerland. This article is an open access article distributed under the terms and conditions of the Creative Commons Attribution (CC BY) license (http://creativecommons.org/licenses/by/4.0/).
Share and Cite
Żak, M.; Mainka, A. Cross-Regional Highway Built through a City Centre as an Example of the Sustainable Development of Urban Transport. Sustainability 2020, 12, 10403. https://doi.org/10.3390/su122410403
Żak M, Mainka A. Cross-Regional Highway Built through a City Centre as an Example of the Sustainable Development of Urban Transport. Sustainability. 2020; 12(24):10403. https://doi.org/10.3390/su122410403
Chicago/Turabian StyleŻak, Magdalena, and Anna Mainka. 2020. "Cross-Regional Highway Built through a City Centre as an Example of the Sustainable Development of Urban Transport" Sustainability 12, no. 24: 10403. https://doi.org/10.3390/su122410403
APA StyleŻak, M., & Mainka, A. (2020). Cross-Regional Highway Built through a City Centre as an Example of the Sustainable Development of Urban Transport. Sustainability, 12(24), 10403. https://doi.org/10.3390/su122410403