Incorporating Reservoir Greenhouse Gas Emissions into Carbon Footprint of Sugar Produced from Irrigated Sugarcane in Northeastern Nigeria


Abstract
:
1. Introduction
2. Materials and Methods
- Definition of objective and scope of LCA.
- Life-cycle inventory (LCI) data collection on the system boundary (reservoir, farm, and sugar factory).
- Data and process entry into the G-res tool and carbon emission models.
- Life-cycle impact analysis (LCIA) and presentation of findings.
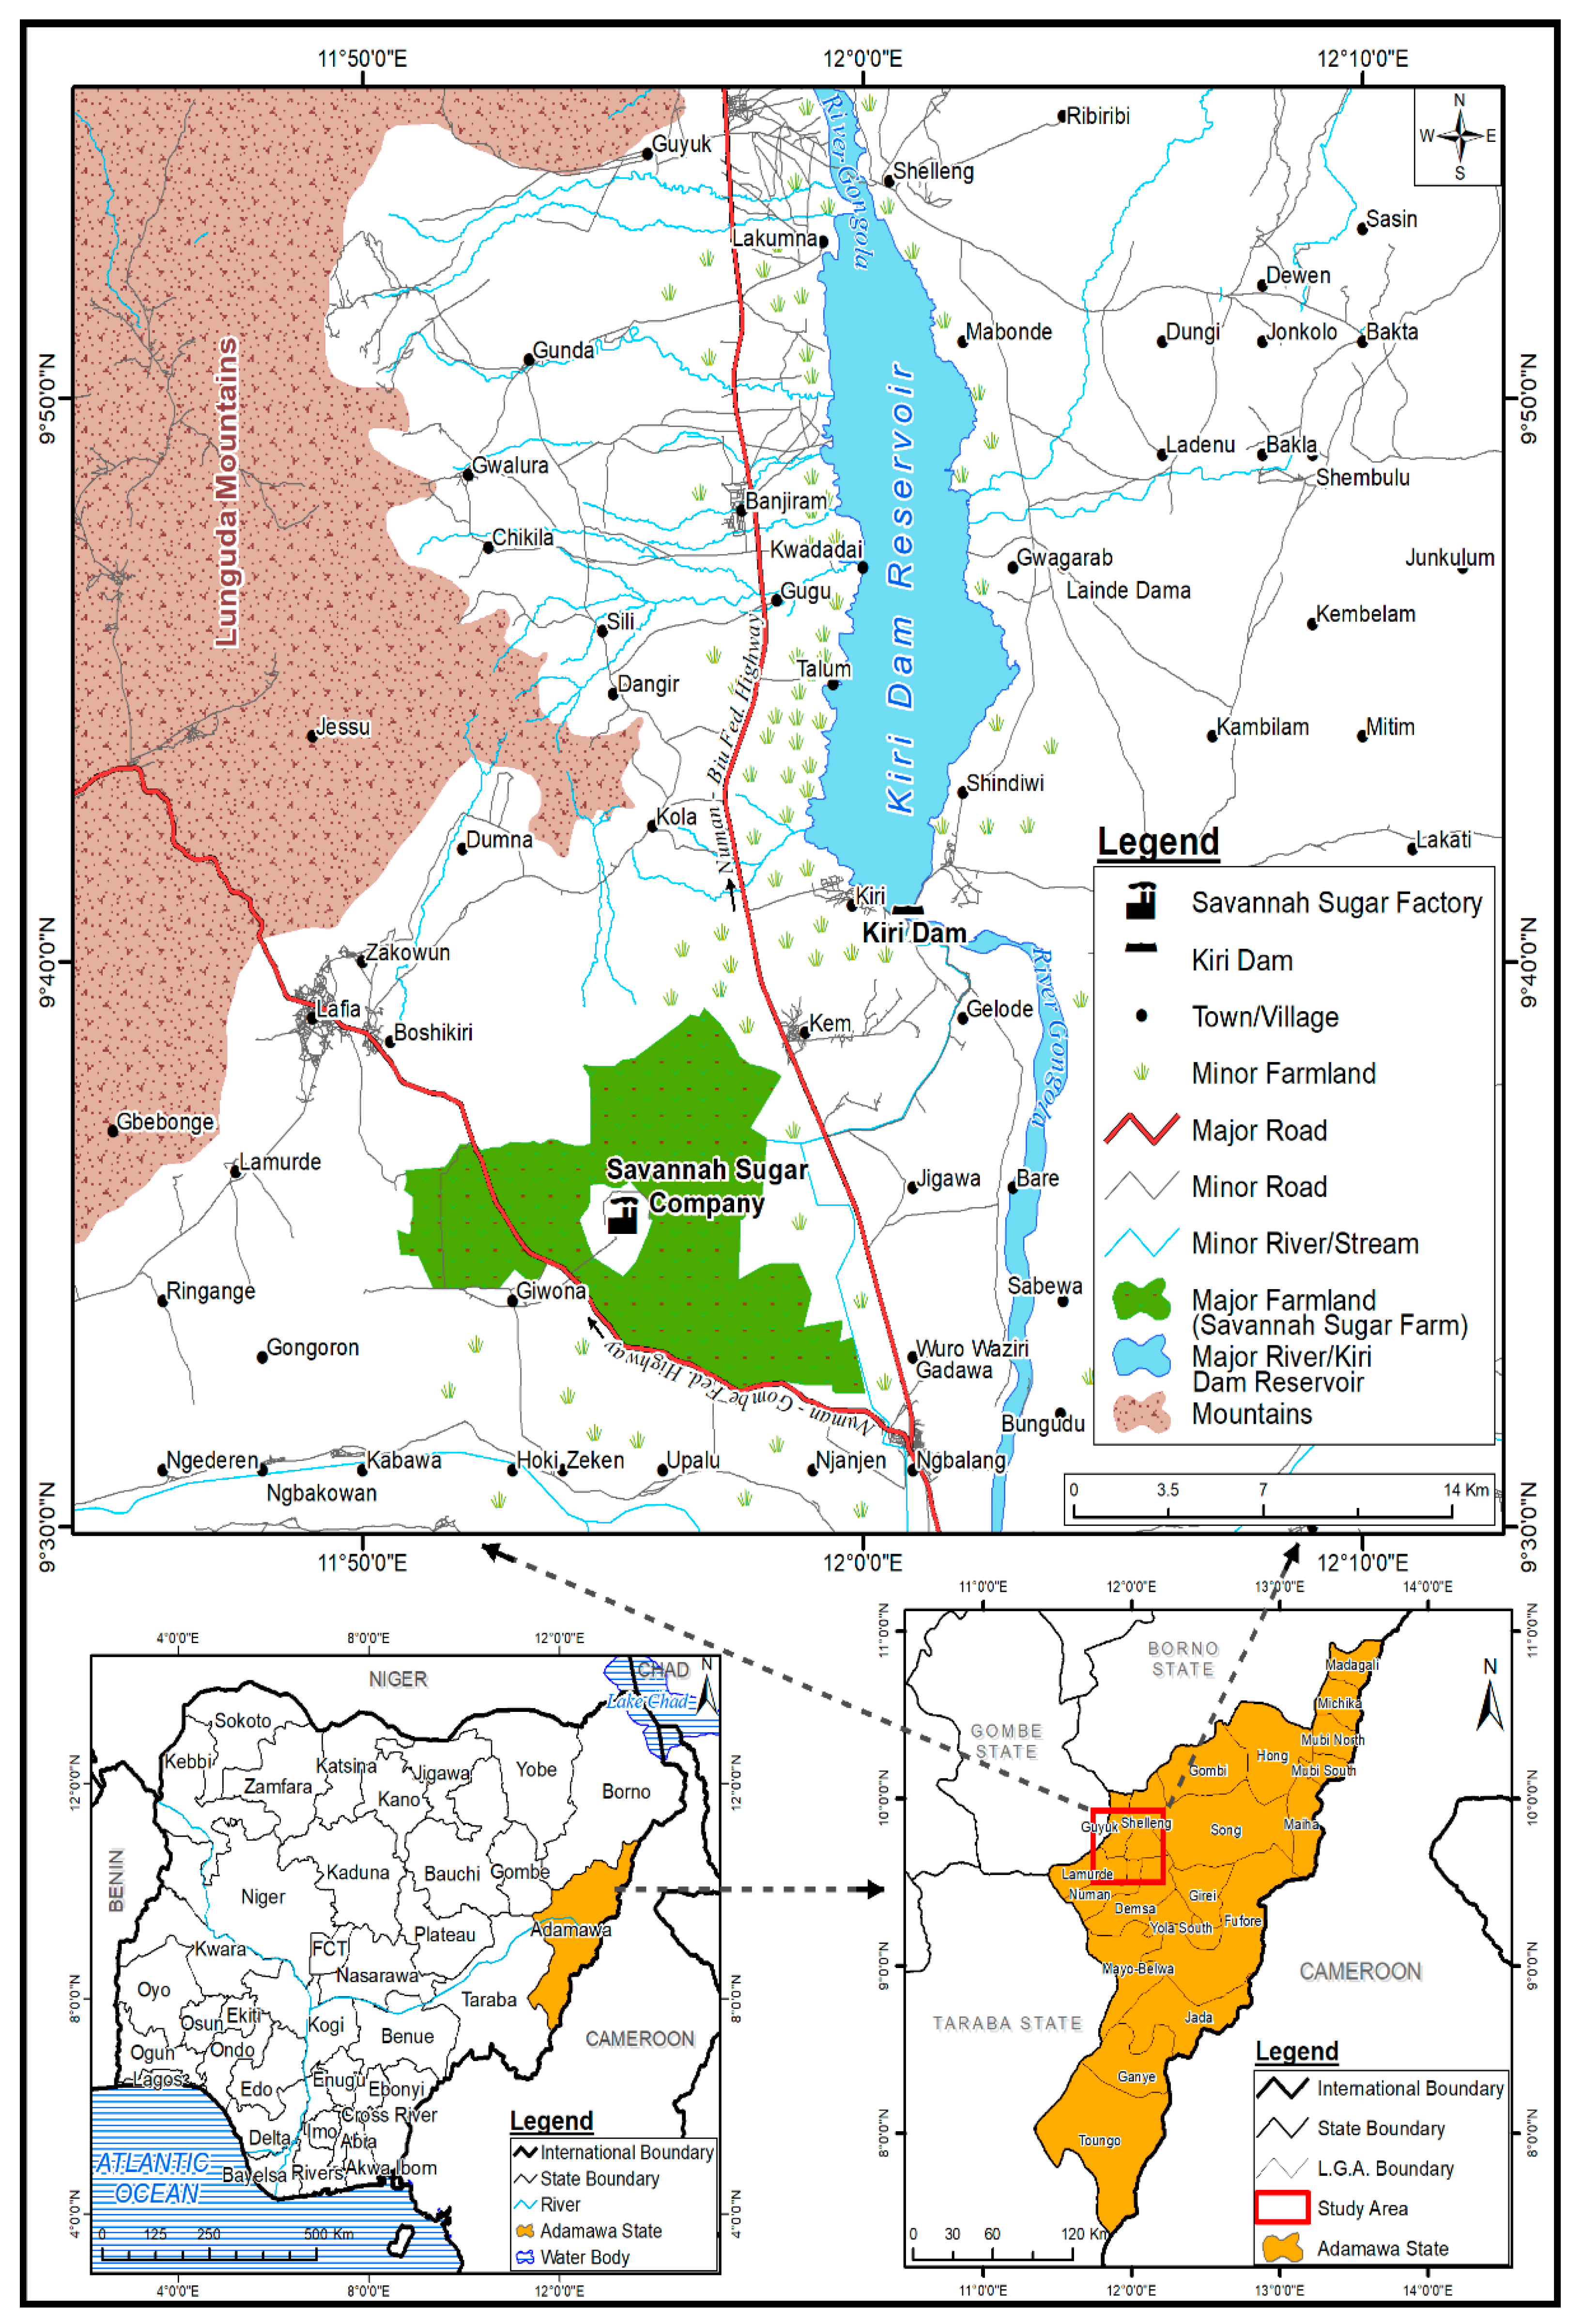
2.1. Study Area
2.2. Goal and Scope
2.3. Functional Unit
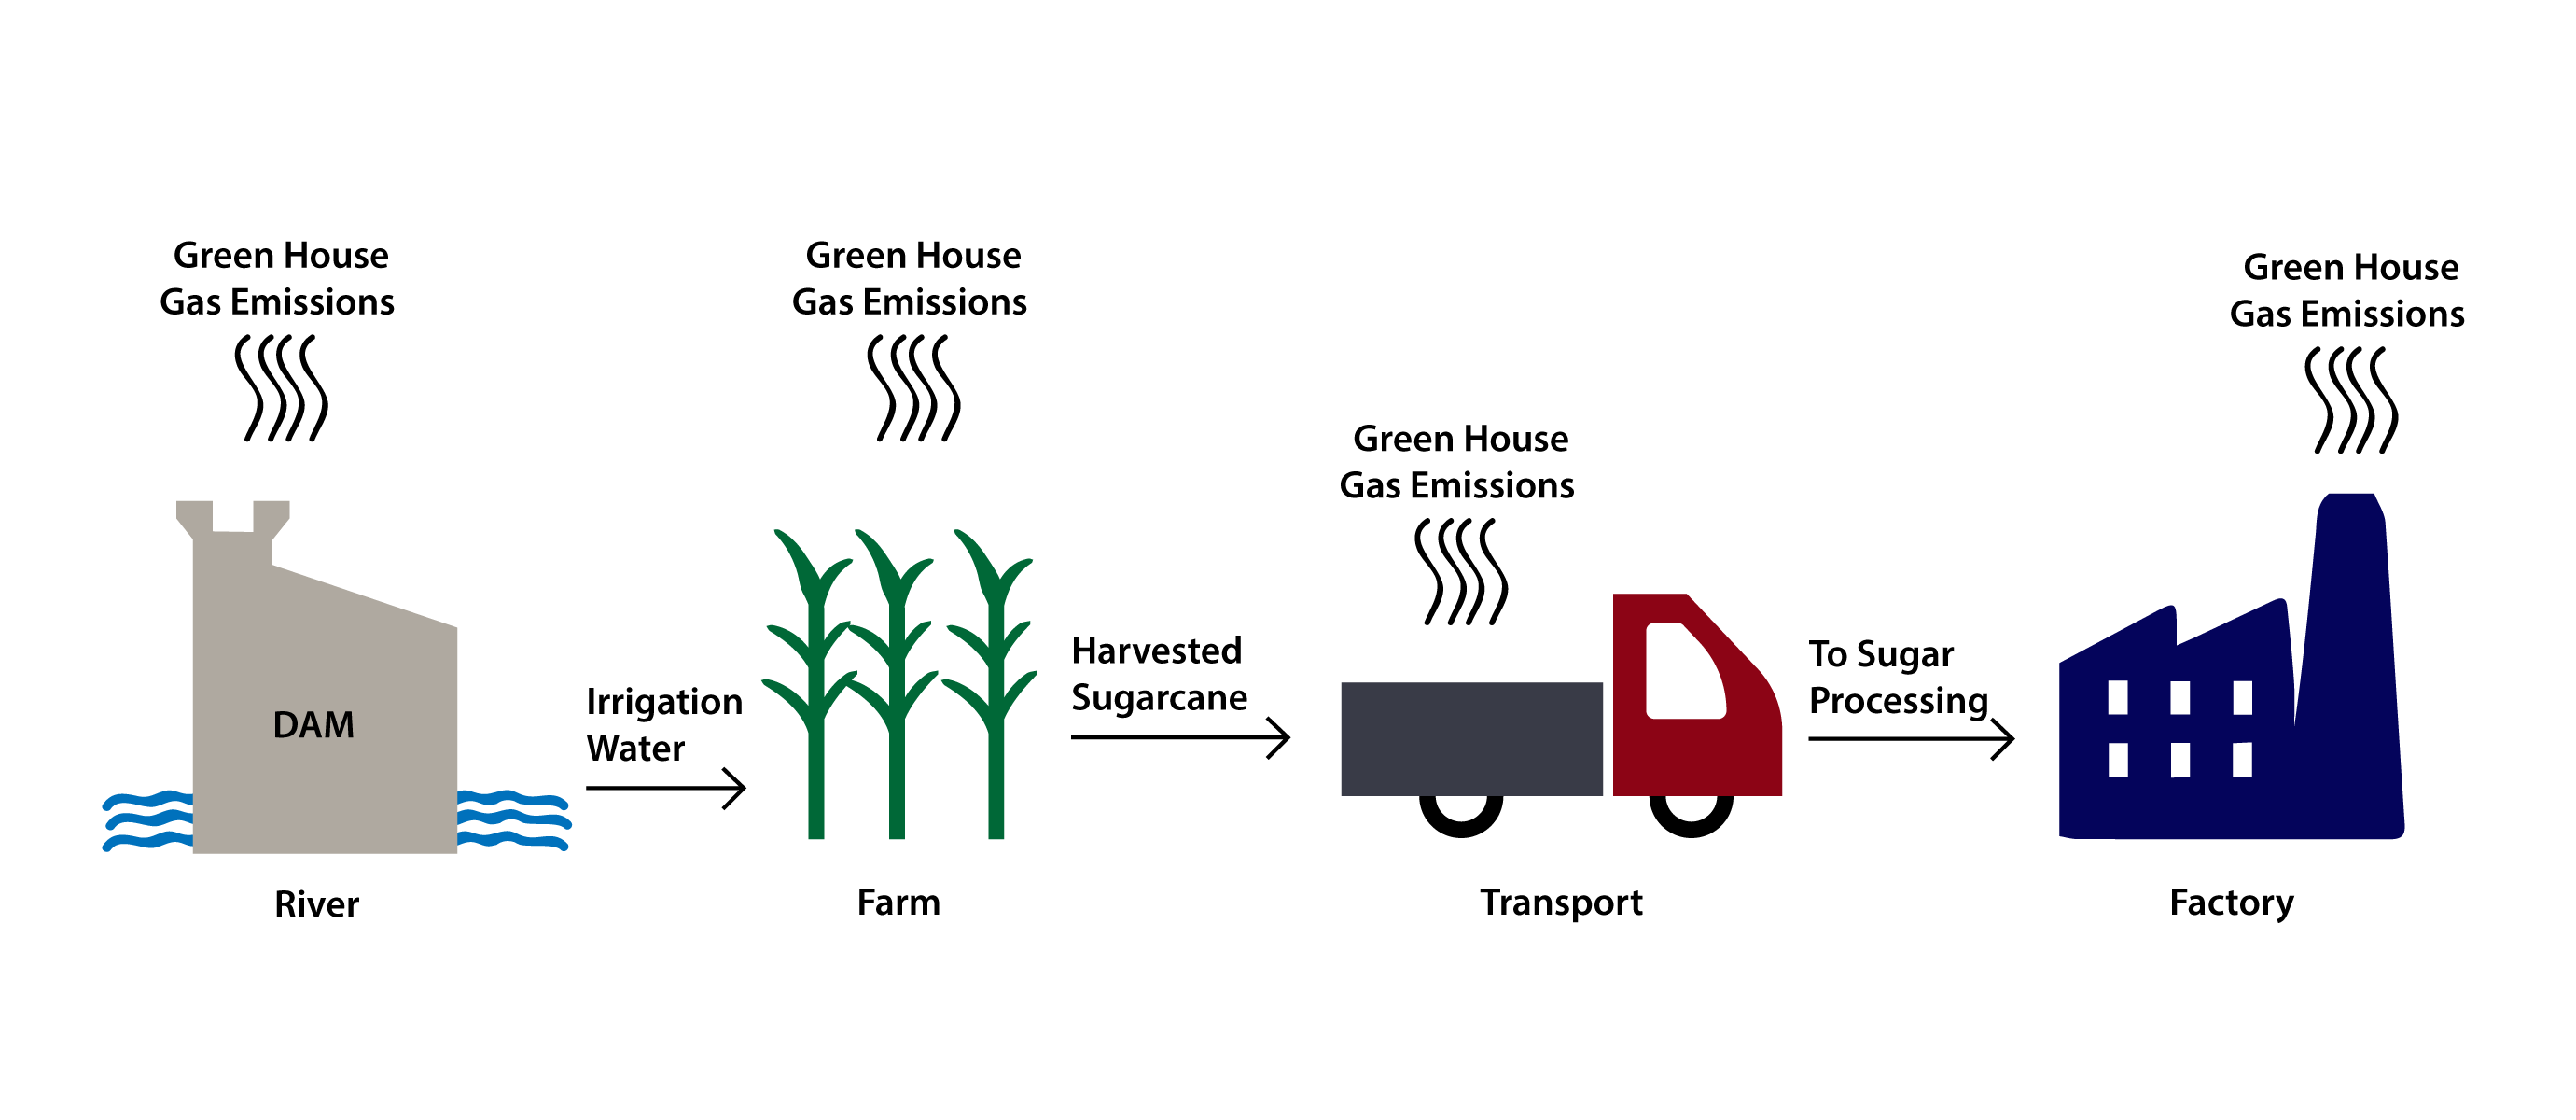
2.4. System Boundaries
2.5. Reservoir GHG Footprint Allocation
2.5.1. Allocation Method by Prairie YT, et al.
- Primary services: electricity, irrigation, water supply, flood control, fisheries, and environmental services.
- Secondary services: growth-enabling food and water security, transport, recreation, climate mitigation, and more investment opportunities.
- The overall GHG emissions are allocated as follows: 80% for primary, 15% for secondary, and 5% for tertiary. If one allocation stage includes more than one function, the allocation for that stage is divided evenly between them.
- Every allocation stage has a maximum of three services. This means a function of a lower allocation stage would never have a greater distribution than the service of a higher stage.
- When no tertiary services are available, the allocation (5%) is divided between the secondary functions. The allocation (20%) is divided between the primary services if there is no secondary service.
2.5.2. Allocation Method by Scherer L, & Pfister S
2.6. Life-Cycle Inventory
Data Collection
2.7. Study Limitations
2.8. Life-Cycle Impact Assessment
2.8.1. Life-Cycle Reservoir GHG Emissions (G-Res Tool)
- Post-impoundment describes the emission of GHGs, including CO2 and CH4 diffusive, bubbling, and degassing for CH4, into the atmosphere over the reservoir basin after flooding, derived from a semi-empirical formula based on flow measurements from about 223 reservoirs globally [13].
- Pre-impoundment takes into account the emissions within the area that the reservoir would fill.
- Unrelated anthropogenic sources (UAS) suggest that the carbon emissions from human-induced activities in the reservoir region will be eliminated due to sewage. The reference here is the catchment area, the land area where rainfall gathers and flows off into a rising channel. This portion of emissions is estimated by using as a reference a portion of the phosphorus load that exceeds the normal background load [13].
- Construction applies to emissions from the manufacture of materials, transport, and plant stages for dam construction and other related structures, determined from the use of materials and fuel, and also the associated emission factors [13].
2.8.2. Life-Cycle GHG Emissions of the Agriculture, Transport, and Industry Stages
- Cane trash burning emission
- Diesel emissions (field)
- Chemical application emissions
- Diesel emission (transportation)
- Bagasse emissions
- Lubricants emissions
- Fuel oil emissions
- Electricity grid emissions
2.8.3. Total Lifetime GHG Emission
2.9. Statistical Analysis
2.10. Sensitivity Analysis
3. Results
3.1. Allocation of Reservoir GHG Footprint
3.2. GHG Emissions from the Reservoir
3.2.1. Pre-Impoundment GHG Balance of the Reservoir Area
3.2.2. Post-Impoundment GHG Balance of the Reservoir
3.2.3. Emissions from the Reservoir Due to UAS
3.2.4. GHG Emissions Due to Construction
3.2.5. Net GHG Footprint
3.3. GHG Emissions from the Agricultural Stage (Cultivation)
3.3.1. GHG from Energy Use in Farming Operation
3.3.2. GHG Emissions from Fertilizer Application
3.4. GHG Emissions from Transportation of Sugarcane to the Sugar Factory
3.5. GHG Emissions from Biomass Burning
3.6. GHG Emissions from the Sugar Factory
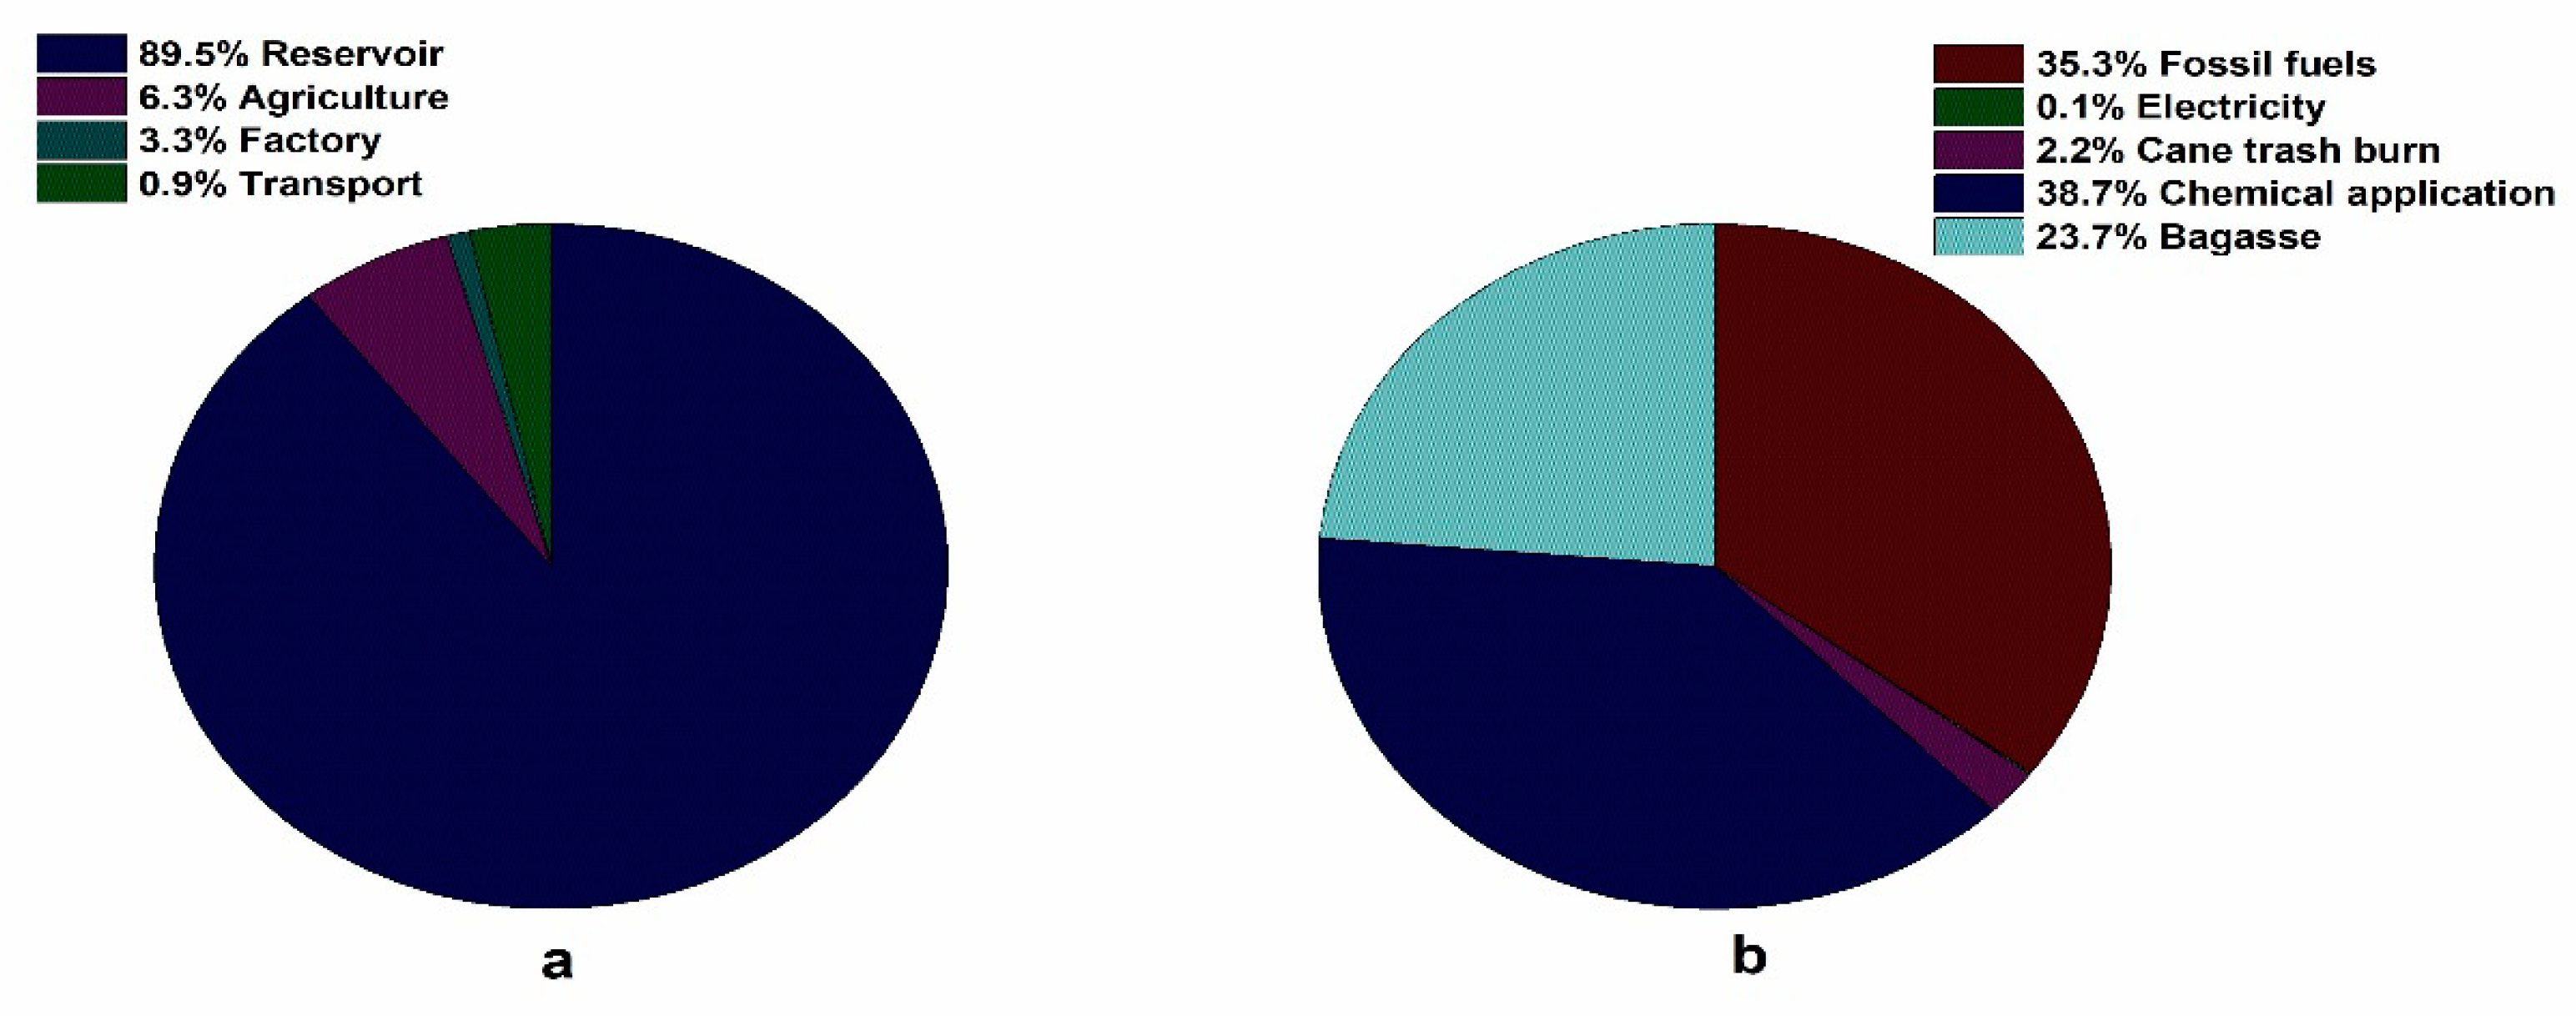
3.7. Overall Lifetime GHG Emissions from All Stages
3.8. Sensitivity Analysis Outcomes
4. Discussion
5. Conclusions
- (i)
- Significantly large GHG emissions from the reservoir could be reduced in terms of service purposes when more services are allocated to the reservoir.
- (ii)
- Coupled with improving sugarcane productivity per hectarage of cultivated land, GHG emissions at the agricultural stage can be curbed by adopting green harvest rather than cane burning.
- (iii)
- The industrial stage could use more bagasse to generate energy rather than fossil fuels, to promote cleaner and efficient generation.
Author Contributions
Funding
Conflicts of Interest
References
- IPCC. Climate Change 2014: Impacts, Adaptation and Vulnerability; IPCC: Cambridge, UK, 2014. [Google Scholar] [CrossRef] [Green Version]
- Paul, G.; Harris, P.G. Climate change. Clim. Chang. 2011, 20, 107–118. Available online: https://atlascorps.org/climate-change/ (accessed on 20 June 2019).
- United Nations. Climate Change, The Human Fingerprint on Greenhouse Gases. 2013. Available online: https://www.un.org/en/sections/issues-depth/climate-change/ (accessed on 15 July 2019).
- Caro, D. Carbon Footprint. Encycl. Ecol. 2019, 201, 252–257. [Google Scholar] [CrossRef]
- Demarty, M.; Bastien, J. GHG emissions from hydroelectric reservoirs in tropical and equatorial regions: Review of 20 years of CH4 emission measurements. Energy Policy 2011, 39, 4197–4206. [Google Scholar] [CrossRef]
- St. Louis, V.L.; Kelly, C.A.; Duchemin, É.; Rudd, J.W.M.; Rosenberg, D.M. Reservoir Surfaces as Sources of Greenhouse Gases to the Atmosphere: A Global Estimate. Bioscience 2000, 50, 766. [Google Scholar] [CrossRef]
- Downing, J.A.; Prairie, Y.T.; Cole, J.J.; Duarte, C.M.; Tranvik, L.J.; Striegl, R.G.; McDowell, W.H.; Kortelainen, P.; Caraco, N.F.; Melack, J.M.; et al. The global abundance and size distribution of lakes, ponds, and impoundments. Limnol. Oceanogr. 2006, 51, 2388–2397. [Google Scholar] [CrossRef] [Green Version]
- Lima, I.B.T.; Ramos, F.M.; Bambace, L.A.W.; Rosa, R.R. Methane emissions from large dams as renewable energy resources: A developing nation perspective. Mitig. Adapt. Strat. Glob. Chang. 2007, 13, 193–206. [Google Scholar] [CrossRef]
- Lehner, B.; Liermann, C.R.; Revenga, C.; Vorosmarty, C.J.; Fekete, B.M.; Crouzet, P.; Döll, P.; Endejan, M.; Frenken, K.; Magome, J.; et al. High-resolution mapping of the world’s reservoirs and dams for sustainable river-flow management. Front. Ecol. Environ. 2011, 9, 494–502. [Google Scholar] [CrossRef] [Green Version]
- World Bank Group. Greenhouse Gases from Reservoirs Caused by Biogeochemical Processes; World Bank Group: Washington, DC, USA, 2017. [Google Scholar] [CrossRef]
- Barros, N.; Cole, J.J.; Tranvik, L.J.; Prairie, Y.T.; Bastviken, D.; Huszar, V.L.M.; Del Giorgio, P.; Roland, F. Carbon emission from hydroelectric reservoirs linked to reservoir age and latitude. Nat. Geosci. 2011, 4, 593–596. [Google Scholar] [CrossRef]
- Raymond, P.A.; Hartmann, J.; Lauerwald, R.; Sobek, S.; McDonald, C.; Hoover, M.; Butman, D.; Striegl, R.; Mayorga, E. Erratum: Global carbon dioxide emissions from inland waters. Nature 2014, 507, 387. [Google Scholar] [CrossRef] [Green Version]
- Prairie, Y.T.; Alm, J.; Harby, A.; Mercier-Blais, S.; Nahas, R. The GHG Reservoir Tool (G-res) Technical documentation, UNESCO/IHA research project on the GHG status of freshwater reservoirs. Version 1.12. Joint publication of the UNESCO Chair in Global Environmental Change and the International Hydropower Association. 2017. Available online: https://assets-global.website-files.com/5f749e4b9399c80b5e421384/5fa83c07d5f3c691742fd0d8_g-res_technical_document_v2.1.pdf (accessed on 23 November 2020).
- IHA. Hydropower Emissions. In Proceedings of the World Hydropower Congress, Addis Ababa, Ethiopia, 9–11 May 2017. [Google Scholar]
- Scherer, L.; Pfister, S. Hydropower’s biogenic carbon footprint. PLoS ONE 2016, 11, e0161947. [Google Scholar] [CrossRef] [PubMed] [Green Version]
- Deemer, B.R.; Harrison, J.A.; Li, S.; Beaulieu, J.J.; DelSontro, T.; Barros, N.; Bezerra-Neto, J.F.; Powers, S.M.; Dos Santos, M.A.; Vonk, J.A. Greenhouse gas emissions from reservoir water surfaces: A new global synthesis. Bioscience 2016, 66, 949–964. [Google Scholar] [CrossRef] [PubMed]
- Bastviken, D.; Tranvik, L.J.; Downing, J.A.; Crill, P.M.; Enrich-Prast, A. Freshwater methane emissions offset the continental carbon sink. Science 2011, 331, 50. [Google Scholar] [CrossRef] [PubMed] [Green Version]
- Hertwich, E.G. Addressing biogenic greenhouse gas emissions from hydropower in LCA. Environ. Sci. Technol. 2013, 47, 9604–9611. [Google Scholar] [CrossRef] [PubMed]
- Fearnside, P.; Rosa, L.P.; Saut, P.; Guiana, F.; Paris, T.; Nations, U. Methane Quashes Green Credentials of Hydropower Preprint Analysis Quantifies Scientific Plagiarism. Nature 2006, 444, 524–525. [Google Scholar]
- Fearnside, P.M.; Pueyo, S. Greenhouse-gas emissions from tropical dams. Nat. Clim. Chang. 2012, 2, 382–384. [Google Scholar] [CrossRef]
- Giles, J. Methane quashes green credentials of hydropower. Nat. Cell Biol. 2006, 444, 524. [Google Scholar] [CrossRef]
- Rosa, L.P.; Dos Santos, M.A.; Matvienko, B.; Sikar, E.; Dos Santos, E.O. Scientific errors in the fearnside comments on greenhouse gas emissions (GHG) from hydroelectric dams and response to his political claiming. Clim. Chang. 2006, 75, 91–102. [Google Scholar] [CrossRef]
- Fearnside, P.M. Greenhouse gas emissions from Brazil’s Amazonian hydroelectric dams. Environ. Res. Lett. 2016, 11, 011002. [Google Scholar] [CrossRef]
- Steinhurst, W.; Knight, P.; Schultz, M. Hydropower Greenhouse Gas Emissions: State of the Research; Synap Energy Econ Inc.: Cambridge, MA, USA, 2012; pp. 1–23. [Google Scholar]
- Zhao, Y.; Wu, B.F.; Zeng, Y. Climate of the Past Geoscientific Instrumentation Methods and Data Systems Spatial and temporal patterns of greenhouse gas emissions from Three Gorges Reservoir of China. Biogeosciences 2013, 10, 1219–1230. [Google Scholar] [CrossRef] [Green Version]
- Almeida, R.M.; Shi, Q.; Gomes-Selman, J.M.; Wu, X.; Xue, Y.; Angarita, H.; Barros, N.; Forsberg, B.R.; García-Villacorta, R.; Hamilton, S.K.; et al. Reducing greenhouse gas emissions of Amazon hydropower with strategic dam planning. Nat. Commun. 2019, 10, 4281. [Google Scholar] [CrossRef] [PubMed]
- Räsänen, T.A.; Varis, O.; Scherer, L.; Kummu, M. Greenhouse gas emissions of hydropower in the Mekong River Basin. Environ. Res. Lett. 2018, 13, 034030. [Google Scholar] [CrossRef]
- Faria, F.A.M.D.; Jaramillo, P.; Sawakuchi, H.O.; Richey, E.J.; Barros, N. Estimating greenhouse gas emissions from future Amazonian hydroelectric reservoirs. Environ. Res. Lett. 2015, 10, 124019. [Google Scholar] [CrossRef] [Green Version]
- Yang, L.; Lu, F.; Zhou, X.; Wang, X.; Duan, X.; Sun, B. Progress in the studies on the greenhouse gas emissions from reservoirs. Acta Ecol. Sin. 2014, 34, 204–212. [Google Scholar] [CrossRef] [Green Version]
- Delmas, R.; Richard, S.; Galy-Lacaux, C. Emissions of greenhouse gases from the tropical hydroelectric reservoir of Petit Saut (French Guiana) compared with emissions from thermal alternatives. Glob. Biogeochem. Cycles 2001, 15, 993–1003. [Google Scholar] [CrossRef]
- Soumis, N.; Duchemin, É.; Canuel, R.; Lucotte, M. Greenhouse gas emissions from reservoirs of the western United States. Glob. Biogeochem. Cycles 2004, 18. [Google Scholar] [CrossRef]
- Zhao, Y.; Wu, B.F.; Zeng, Y. Drought monitoring project View project Application of remote sensing in ecology View project Spatial-temporal aspects of GHG emissions from TGR Spatial and temporal aspects of greenhouse gas emissions from Three Gorges Reservoir, China Spatial-temporal aspects of GHG emissions from TGR. Biogeosci. Discuss. 2012, 9, 14503–14535. [Google Scholar] [CrossRef] [Green Version]
- Fearnside, P.M. Greenhouse gas emissions from a hydroelectric reservoir (Brazil’s Tucuruídam) and the energy policy implications. Water Air Soil Pollut. 2002, 133, 69–96. [Google Scholar] [CrossRef]
- Tremblay, A.; Varfalvy, L.; Garneau, M.; Roehm, C. Greenhouse Gas Emissions-Fluxes and Processes: Hydroelectric Reservoirs and Natural Environments; Springer Nature: Cham, Switzerland, 2005. [Google Scholar]
- Song, C.; Gardner, K.H.; Klein, S.J.; Souza, S.P.; Mo, W. Cradle-to-grave greenhouse gas emissions from dams in the United States of America. Renew. Sustain. Energy Rev. 2018, 90, 945–956. [Google Scholar] [CrossRef] [Green Version]
- Dunkelberg, E.; Finkbeiner, M.; Hirschl, B. Sugarcane ethanol production in Malawi: Measures to optimize the carbon footprint and to avoid indirect emissions. Biomass Bioenergy 2014, 71, 37–45. [Google Scholar] [CrossRef]
- Väisänen, S.; Havukainen, J.; Uusitalo, V.; Soukka, R.; Luoranen, M. Carbon footprint of biobutanol by ABE fermentation from corn and sugarcane. Renew. Energy 2016, 89, 401–410. [Google Scholar] [CrossRef]
- Barbosa, L.D.S.N.S.; Hytönen, E.; Vainikka, P. Carbon mass balance in sugarcane biorefineries in Brazil for evaluating carbon capture and utilization opportunities. Biomass Bioenergy 2017, 105, 351–363. [Google Scholar] [CrossRef]
- Machado, K.; Seleme, R.; Maceno, M.M.C.; Zattar, I.C. Carbon footprint in the ethanol feedstocks cultivation—Agricultural CO2 emission assessment. Agric. Syst. 2017, 157, 140–145. [Google Scholar] [CrossRef]
- Machado, C.F.R.; Araújo, O.D.Q.F.; De Medeiros, J.L.; Alves, R.M.D.B. Carbon dioxide and ethanol from sugarcane biorefinery as renewable feedstocks to environment-oriented integrated chemical plants. J. Clean. Prod. 2018, 172, 1232–1242. [Google Scholar] [CrossRef]
- Mandegari, M.A.; Görgens, J.F.; Görgens, J.F. A new insight into sugarcane biorefineries with fossil fuel co-combustion: Techno-economic analysis and life cycle assessment. Energy Convers. Manag. 2018, 165, 76–91. [Google Scholar] [CrossRef]
- Carvalho, M.; Segundo, V.B.D.S.; De Medeiros, M.G.; Dos Santos, N.A.; Junior, L.M.C. Carbon footprint of the generation of bioelectricity from sugarcane bagasse in a sugar and ethanol industry. Int. J. Glob. Warm. 2019, 17, 235. [Google Scholar] [CrossRef]
- García, C.A.; García-Treviño, E.S.; Aguilar-Rivera, N.; Armendáriz, C. Carbon footprint of sugar production in Mexico. J. Clean. Prod. 2016, 112, 2632–2641. [Google Scholar] [CrossRef]
- Mendoza, T.C. Reducing the carbon footprint of sugar production in the Philippines. J. Agric. Technol. 2014, 10, 289–308. [Google Scholar]
- Yuttitham, M.; Gheewala, S.H.; Chidthaisong, A. Carbon footprint of sugar produced from sugarcane in eastern Thailand. J. Clean. Prod. 2011, 19, 2119–2127. [Google Scholar] [CrossRef]
- Cabral, O.M.R.; Rocha, H.R.; Gash, J.H.; Ligo, M.A.V.; Ramos, N.P.; Packer, A.P.; Batista, E.R. Fluxes of CO2 above a sugarcane plantation in Brazil. Agric. For. Meteorol. 2013, 182, 54–66. [Google Scholar] [CrossRef] [Green Version]
- Cardozo, N.P.; Bordonal, R.D.O.; La Scala, N. Greenhouse gas emission estimate in sugarcane irrigation in Brazil: Is it possible to reduce it, and still increase crop yield? J. Clean. Prod. 2016, 112, 3988–3997. [Google Scholar] [CrossRef] [Green Version]
- Pryor, S.W.; Smithers, J.; Lyne, P.; Van Antwerpen, R. Impact of agricultural practices on energy use and greenhouse gas emissions for South African sugarcane production. J. Clean. Prod. 2017, 141, 137–145. [Google Scholar] [CrossRef] [Green Version]
- Environmental Management-Life Cycle Assessment-Principles and Framework; ISO: 14040; ISO: Geneva, Switzerland, 1997.
- Yuguda, T.K. Environmental Impact Assessment of the Proposed Kiri Hydro-Electric Power Project; Ahmadu Bello University: Zaria, Nigeria, 2015. [Google Scholar]
- SSCL. Savannah Sugar Company Nigeria Limited, Agronomy Division Archives; SSCL: Numan, Nigeria, 2017; Volume 20. [Google Scholar]
- US EPA. Understanding Global Warming Potentials. 2014. Available online: https://www.epa.gov/energy/greenhouse-gases-equivalencies-calculator-calculations-and-references (accessed on 15 March 2020).
- Biograce. Harmonized Calculations of Biofuel Greenhouse Gas Emissions in Europe, Netherlands. BioGrace Standard Values–Version 4–Public. xls 2011. Available online: https://www.biograce.net (accessed on 8 January 2019).
- Stocker, T.F.; Qin, D.; Plattner, G.-K.; Tignor, M.; Allen, S.K.; Boschung, J.; Nauels, A.; Xia, Y.; Bex, V.; Midgley, P.M. Climate Change 2013 the Physical Science Basis: Working Group I Contribution to the Fifth assessment Report of the Intergovernmental Panel on Climate Change; Intergovernmental Panel on Climate Change: New York, NY, USA, 2013; Volume 9781107057. [Google Scholar] [CrossRef] [Green Version]
- IPCC. Intergovernmental Panel on Climate Change 2006 IPCC Guidelines for National Greenhouse Gas; Expert Meet Rep: Kanagawa, Japan, 2006; pp. 1–20. [Google Scholar]
- Khatiwada, D.; Silveira, S. Greenhouse gas balances of molasses based ethanol in Nepal. J. Clean. Prod. 2011, 19, 1471–1485. [Google Scholar] [CrossRef]
- Gadiga, B.L.; Garandi, I.D. “The Spacio-Temporal Changes of Kiri Dam and Its Implications” in Adamawa State, Nigeria. Int. J. Sci. Res. Publ. IJSRP 2018, 8. [Google Scholar] [CrossRef]
- UBRBDA. Upper Benue River Basin Development Authority, Hydro Meteorological Year Book Yola, Nigeria; UBRBDA: Yola, Nigeria, 2017. [Google Scholar]
- Zemba, A.A.; Adebayo, A.A.; Ba, A.M. Analysis of Environmental and Economic Effects of Kiri Dam, Adamawa State, Nigeria. Glob. J. Hum. Soc. Sci. 2016, 16. Available online: https://globaljournals.org/GJHSS_Volume16/1-Analysis-of-Environmental.pdf (accessed on 20 June 2020).
- Anikwe, M.A.N. Carbon storage in soils of Southeastern Nigeria under different management practices. Carbon Balance Manag. 2010, 5, 5–7. [Google Scholar] [CrossRef] [Green Version]
- UBRBDA. Upper Benue River Basin Development Authority Year Book; UBRBDA: Yola, Nigeria, 1990. [Google Scholar]
- Binbol, N.; Adebayo, A.; Kwon-Ndung, E. Influence of climatic factors on the growth and yield of sugar cane at Numan, Nigeria. Clim. Res. 2006, 32, 247–252. [Google Scholar] [CrossRef] [Green Version]
- Abubakar, M.S.; Umar, B.; Ahmad, D. Energy use patterns in sugar production: A case study of savannah sugar company, Numan, Adamawa State, Nigeria. J. Appl. Sci. Res. 2010, 6, 377–382. [Google Scholar]
- Seabra, J.E.A.; Macedo, I.C.; Chum, H.L.; Faroni, C.E.; Sarto, C.A. Life cycle assessment of Brazilian sugarcane products: GHG emissions and energy use. Biofuels Bioprod. Biorefining 2011, 5, 519–532. [Google Scholar] [CrossRef]
- França, D.D.A.; Longo, K.M.; Neto, T.G.S.; Santos, J.C.; Freitas, S.R.; Rudorff, B.F.T.; Cortez, E.V.; Anselmo, E.; Carvalho, J.A., Jr. Pre-harvest sugarcane burning: Determination of emission factors through laboratory measurements. Atmosphere 2012, 3, 164–180. [Google Scholar] [CrossRef] [Green Version]
- Yuguda, T.K.; Li, Y.; Xiong, W.; Zhang, W. Life cycle assessment of options for retrofitting an existing dam to generate hydro-electricity. Int. J. Life Cycle Assess. 2019, 25, 57–72. [Google Scholar] [CrossRef]
- Klöpffer, W.; Renner, I. Life-Cycle Based Sustainability Assessment of Products; Springer: Dordrecht, Germany, 2008; pp. 91–102. [Google Scholar] [CrossRef]
- Teodoru, C.R.; Bastien, J.; Bonneville, M.-C.; Del Giorgio, P.A.; Demarty, M.; Garneau, M.; Hélie, H.J.-F.; Pelletier, L.; Prairie, Y.T.; Roulet, N.T.; et al. The net carbon footprint of a newly created boreal hydroelectric reservoir. Glob. Biogeochem. Cycles 2012, 26. [Google Scholar] [CrossRef] [Green Version]
- CICS. The Canadian Institute for Climate Studies|Pacific Climate Impacts Consortium. 2013. Available online: https://pacificclimate.org/about-pcic/canadian-institute-climate-studies (accessed on 20 June 2020).
- Prairie, Y.T.; Alm, J.; Beaulieu, J.; Barros, N.; Battin, T.; Cole, J.; Del Giorgio, P.; DelSontro, T.; Guérin, F.; Harby, A.; et al. Greenhouse Gas Emissions from Freshwater Reservoirs: What Does the Atmosphere See? Ecosystems 2018, 21, 1058–1071. [Google Scholar] [CrossRef] [PubMed]
- Jiang, T.; Shen, Z.; Liu, Y.; Hou, Y. Carbon footprint assessment of four normal size hydropower stations in China. Sustainbility 2018, 10, 2018. [Google Scholar] [CrossRef] [Green Version]
- Bin, Z.; Zhe, L.; Chong, L.; Yongbo, C.; Jinsong, G. The net GHG flux assessment model of reservoir(G-res Tool) and its application in reservoirs in upper reaches of Yangtze River in China. J. Lake Sci. 2019, 31, 1479–1488. [Google Scholar] [CrossRef]
- IHA. G-Res Tool 2017. Available online: https://www.hydropower.org/gres (accessed on 27 March 2019).
- IPCC. Summary for Policy Makers Special Advisor; Timm Zwickel Chang Mitig: Geneva, Switzerland, 2011; pp. 5–8. [Google Scholar]
- Cellura, M.; Longo, S.; Mistretta, M. Sensitivity analysis to quantify uncertainty in Life Cycle Assessment: The case study of an Italian tile. Renew. Sustain. Energy Rev. 2011, 15, 4697–4705. [Google Scholar] [CrossRef]
- Wei, W.; Larrey-Lassalle, P.; Faure, T.; Dumoulin, N.; Roux, P.; Mathias, J.-D. How to conduct a proper sensitivity analysis in life cycle assessment: Taking into account correlations within LCI data and interactions within the LCA calculation model. Environ. Sci. Technol. 2014, 49, 377–385. [Google Scholar] [CrossRef]
- Ngote Sugar. Savannah Sugar Company Limited. 2018. Available online: https://dangotesugar.com.ng/operations-overview/sugar-production/savannah-sugar-company-limited/ (accessed on 20 May 2017).
- Lu, F.; Yang, L.; Wang, X.; Duan, X.; Mu, Y.; Song, W.; Zheng, F.; Niu, J.; Tong, L.; Zheng, H.; et al. Preliminary report on methane emissions from the Three Gorges Reservoir in the summer drainage period. J. Environ. Sci. 2011, 23, 2029–2033. [Google Scholar] [CrossRef]
- Yang, M.; Geng, X.; Grace, J.; Lu, C.; Zhu, Y.; Zhou, Y.; Lei, G. Spatial and seasonal CH4 flux in the littoral zone of Miyun reservoir near Beijing: The effects of water level and its fluctuation. PLoS ONE 2014, 9, e94275. [Google Scholar] [CrossRef]
- Maeck, A.; Hofmann, H.; Lorke, A. Pumping methane out of aquatic sediments: Ebullition forcing mechanisms in an impounded river. Biogeosciences 2014, 11, 2925–2938. [Google Scholar] [CrossRef] [Green Version]
- Myhre, G.; Shindell, D.; Pongratz, J. 2013: Anthropogenic and natural radiative forcing. In Climate Change 2013: The Physical Science Basis; Stocker, T.F., Qin, D., Plattner, G.K., Tignor, M., Allen, S.K., Boschung, J., Nauels, A., Xia, Y., Bex, V., Midgley, P.M., et al., Eds.; Cambridge Univ Press: Cambridge, UK, 2014. [Google Scholar]
- Varis, O.; Kummu, M.; Härkönen, S.; Huttunen, J.T. Greenhouse Gas Emissions from Reservoirs; Springer: Berlin/Heidelberg, Germany, 2012; pp. 69–94. [Google Scholar] [CrossRef]
- De Figueiredo, E.B.; Panosso, A.R.; Romão, R.; Scala, N. Greenhouse gas emission associated with sugar production in southern Brazil. Carbon Balance Manag. 2010, 5, 3. [Google Scholar] [CrossRef] [PubMed] [Green Version]
- Plassmann, K.; Norton, A.; Attarzadeh, N.; Jensen, M.P.; Brenton, P.; Edwards-Jones, G. Methodological complexities of product carbon footprinting: A sensitivity analysis of key variables in a developing country context. Environ. Sci. Policy 2010, 13, 393–404. [Google Scholar] [CrossRef]
- Rachid, C.T.C.C.; Santos, A.L.; Piccolo, M.C.; Balieiro, F.C.; Coutinho, H.L.C.; Peixoto, R.S.; Tiedje, J.M.; Rosado, A.S. Effect of Sugarcane Burning or Green Harvest Methods on the Brazilian Cerrado Soil Bacterial Community Structure. PLoS ONE 2013, 8, e59342. [Google Scholar] [CrossRef] [PubMed]
- Rathod, P.; Veeranna, K.C.; Animal, K.V. AESA Good Practice: Utilization of Sugarcane Trash for Livestock Feeding: An Alternative to on-Farm Burning. 2018. Available online: https://www.aesanetwork.org/utilization-of-sugarcane-trash-for-livestock-feeding-an-alternative-to-on-farm-burning/ (accessed on 9 November 2019).


| Catchment Data | Value | Source |
|---|---|---|
| Catchment area (km2) | 56,200 | [57] |
| Catchment annual runoff (mm) | 290 | [58] |
| Post impoundment areas | ||
| Farmland (km2) | 354.50 | [59] |
| Natural vegetation (km2) | 95.51 | [59] |
| Settlements (km2) | 63.82 | [59] |
| Water body (km2) | 620.41 | [59] |
| Pre impoundment areas | ||
| Farmland (km2) | 182.21 | [59] |
| Natural vegetation (km2) | 810.35 | [59] |
| Settlements (km2) | 16.22 | [59] |
| Water body (km2) | 125.46 | [59] |
| Reservoir Data | ||
| Impoundment year | 1978 | [58] |
| Reservoir area (km2) | 107 | [58] |
| Reservoir volume (km3) | 0.615 | [58] |
| Mean/normal operate level (m above sea level) (m) | 170.5 | [58] |
| Maximum depth (m) | 20 | [57] |
| Mean depth (m) | 5.75 a | Calculated by G-res tool |
| Littoral area (%) | 37.6 a | Calculated by G-res tool |
| Thermocline depth (m) | 250 a | Calculated by G-res tool |
| Water intake depth (m) | 10 a | Calculated by G-res tool |
| Water intake elevation (m above sea level) | 145 | [58] |
| Soil carbon content under impounded area (kgC/m2) | 3.5 | [60] |
| Annual wind speed at 10 m (m/s) | 2.6 | [58] |
| Water residence time (WRT, year) | 0.0146 a | Calculated by G-res tool |
| Annual discharge from the reservoir (m3/s) | 1336.6 a | Calculated by G-res tool |
| Phosphorous concentration (μg/L) | 75.5 a | Calculated by G-res tool |
| Reservoir mean global radiance (kwh/m2/d) | 4.5 | [58] |
| Dam construction | ||
| Open excavation (m3) | 731,765 | [61] |
| Earth and rockfill (m3) | 1,054,454 | [61] |
| Concrete (m3) | 29,326 | [61] |
| Steel and other metals (t) | 95 | [61] |
| Parameter | Unit | Value | Source |
|---|---|---|---|
| Agricultural stage (sugarcane) | |||
| Crop yield-cane harvested | ton cane/ha | 45 | [51] |
| Average cane age at harvest | months | 12 | [62] |
| Bagasse burned | % | 41.61 | [51] |
| Burned cane trash (% of harvested area) | % | 96 | [51] |
| NPK 15% N–15% P2O5–15% K2O | kg/ha | 400 | [51] |
| UREA 46%N | kg/ha | 300 | [51] |
| DAP 18% N–46% P2O5 | kg/ha | 150 | [51] |
| Percentage of N to N2O | % | 1 | [55] |
| Pesticides application rate | kg/ha | 2.5 | [51] |
| Diesel used in agriculture processes | L/ha | 127 | [51] |
| Transportation stage | |||
| Average diesel consumption | L/ton cane | 1.26 | [51] |
| Industrial stage (sugar production) | |||
| Sugarcane processed | ton/year | 167,059 | [51] |
| Molasses production | ton | 11,593 | [51] |
| Sugar produced | ton sugar/ha | 2.69 | [51] |
| Factory lime usage a | kg/ha | 40 | Calculated |
| Fuel consumption | L/t cane | 0.75 | [63] |
| Electric power imported | kWh | 36,873 | [63] |
| Lubricants b | Kg/ha | 0.47 | Calculated |
| Parameter | Unit | Value | Source |
|---|---|---|---|
| Agricultural stage (sugarcane) | |||
| Emissions from electrical grid | g CO2e/kWh | 138 | [53] |
| Cane trash burning emission factor | kg CO2e/kg dry matter | 1.085 | [65] |
| Diesel emission factor | g CO2e/MJ | 87.64 a | [53] |
| NPK 15–15–15 | g CO2e/kg | 7105 | [53] |
| UREA 46%N | g CO2e/kg | 3167 | [53] |
| DAP 18–46–0 | g CO2e/kg | 1527 | [53] |
| Pesticides emission factor | g CO2e/kg | 10,971.3 | [53] |
| Transport/industrial stage | |||
| Fuel oil emission factor | g CO2e/MJ | 84.98 b | [53] |
| Bagasse emission factor | kg CO2e/kg | 0.025 | [56] |
| Lubricants emission factor | g CO2e/kg | 947.0 | [53] |
| Lime emission factor | g CO2e/kg | 1030.2 | [53] |
| Year | Harvested Land Area (Ha) | Sugarcane Harvested (Tons) | Sugar Produced (Tons) | Sugarcane Yield (Tons/Ha) | Sugar Yield (Tons/Ha) | Sugarcane to Sugar Ratio (TC/TS) |
|---|---|---|---|---|---|---|
| 2006/07 | 2858 | 167,901 | 7031 | 58.7 | 2.46 | 23.4 |
| 2007/08 | 870 | 57,603 | 2375 | 64.24 | 2.65 | 20.6 |
| 2008/09 | 4585 | 199,044 | 12,275 | 43.4 | 2.68 | 16.4 |
| 2009/10 | 5320 | 247,030 | 17,851 | 46.4 | 3.36 | 13.5 |
| 2010/11 | 5614 | 244,845 | 18,172 | 43.61 | 3.1 | 13.2 |
| 2011/12 | 1334 | 67,124 | 3652 | 44.3 | 2.74 | 18.38 |
| 2012/13 | 4317 | 102,181 | 5011 | 23 | 1.16 | 20.4 |
| 2013/14 | 4620 | 123,495 | 6245 | 26.7 | 1.38 | 19.8 |
| 2014/15 | 3600 | 124,721 | 6606 | 34.64 | 1.79 | 18.88 |
| 2015/16 | 3910 | 189,412 | 12,695 | 48.4 | 3.09 | 15.7 |
| 2016/17 | 4593 | 314,302 | 19,926 | 65.2 | 4.13 | 15.77 |
| Reservoir Service | GHG Footprint (t CO2e/yr) (Prairie et al. Model) | GHG Footprint (t CO2e/yr) Scherer and Pfister Model) | Total Lifetime Emission (t CO2e) (Prairie et al. Model) | Total Lifetime Emission (t CO2e) Scherer and Pfister Model) |
|---|---|---|---|---|
| Flood control | – | – | – | – |
| Fisheries | 1603 | 1582 | 160,300 | 158,244 |
| Irrigation and sugar production | 51,298 | 55,648 | 5,129,800 | 5,564,880 |
| Navigation | – | – | – | – |
| Environmental flow | 9618 | 9236 | 961,800 | 923,660 |
| Recreation | 1603 | 1412 | 160,300 | 141,220 |
| Water supply | – | – | – | – |
| Hydroelectricity | – | – | – | – |
| Parameter | Quantity |
|---|---|
| Water residence time (year) | 0.1 |
| CH4 release rate due to UAS (g CO2e/m2/year) | 1480 |
| of which land use accounts for (%) | 95 |
| of which sewage accounts for (%) | 5 |
| UAS/Post-impoundment CH4 release (%) | 98 |
| Category | GHG Emission Rate (t CO2-eq/yr) |
|---|---|
| Pre-impoundment | 16,582 |
| Post-impoundment | 265,419 |
| Unrelated anthropogenic sources UAS | 64,122 |
| Construction | 33,060 |
| Reservoir Service | GHG Footprint (t CO2e/yr) (Prairie et al. Model) | GHG Footprint (t CO2e/yr) (Scherer and Pfister Model) | Total Lifetime Emission (t CO2e) (Prairie et al. Model) | Total Lifetime Emission (t CO2e) (Scherer and Pfister Model) |
|---|---|---|---|---|
| Flood control | – | – | – | – |
| Fisheries | 1090 | 1050 | 109,000 | 105,070 |
| Irrigation and sugar production | 51,298 | 50,374 | 5,129,800 | 5,037,412 |
| Navigation | – | – | – | – |
| Environmental flow | 1090 | 1282 | 109,000 | 128,200 |
| Recreation | 1090 | 1275 | 109,000 | 127,480 |
| Water supply | – | – | – | – |
| Hydroelectricity | 9618 | 8099 | 961,800 | 809,920 |
Publisher’s Note: MDPI stays neutral with regard to jurisdictional claims in published maps and institutional affiliations. |
© 2020 by the authors. Licensee MDPI, Basel, Switzerland. This article is an open access article distributed under the terms and conditions of the Creative Commons Attribution (CC BY) license (http://creativecommons.org/licenses/by/4.0/).
Share and Cite
Yuguda, T.K.; Li, Y.; Shekarau Luka, B.; Dzarma, G.W. Incorporating Reservoir Greenhouse Gas Emissions into Carbon Footprint of Sugar Produced from Irrigated Sugarcane in Northeastern Nigeria. Sustainability 2020, 12, 10380. https://doi.org/10.3390/su122410380
Yuguda TK, Li Y, Shekarau Luka B, Dzarma GW. Incorporating Reservoir Greenhouse Gas Emissions into Carbon Footprint of Sugar Produced from Irrigated Sugarcane in Northeastern Nigeria. Sustainability. 2020; 12(24):10380. https://doi.org/10.3390/su122410380
Chicago/Turabian StyleYuguda, Taitiya Kenneth, Yi Li, Bobby Shekarau Luka, and Goziya William Dzarma. 2020. "Incorporating Reservoir Greenhouse Gas Emissions into Carbon Footprint of Sugar Produced from Irrigated Sugarcane in Northeastern Nigeria" Sustainability 12, no. 24: 10380. https://doi.org/10.3390/su122410380
APA StyleYuguda, T. K., Li, Y., Shekarau Luka, B., & Dzarma, G. W. (2020). Incorporating Reservoir Greenhouse Gas Emissions into Carbon Footprint of Sugar Produced from Irrigated Sugarcane in Northeastern Nigeria. Sustainability, 12(24), 10380. https://doi.org/10.3390/su122410380