Article

Genetic Diversity of South African Indigenous Goat Population from Four Provinces Using Genome-Wide SNP Data

by
Tlou Caswell Chokoe
1,2,*,
Khanyisile Mdladla-Hadebe
3,
Farai Muchadeyi
3,
Edgar Dzomba
4,
Tlou Matelele
1,
Tumudi Mphahlele
1,
Takalani J. Mpofu
5,
Khathutshelo Nephawe
5 and
Bohani Mtileni
5
1
Farm Animal Genetic Resources, Department of Agriculture, Land Reform and Rural Development, Private Bag X973, Pretoria 0001, South Africa
2
School of Agriculture & Environmental Sciences, University of Limpopo, Private Bag X1106, Sovenga 0727, South Africa
3
Agricultural Research Council-Biotechnology Platform, Private Bag X5, Onderstepoort, Pretoria 0110, South Africa
4
Discipline of Genetics, University of Kwazulu-Natal, Private Bag X01, Scottsville 3209, South Africa
5
Department of Animal Sciences, Tshwane University of Technology, Private Bag X680, Pretoria 0001, South Africa
*
Author to whom correspondence should be addressed.
Sustainability 2020, 12(24), 10361; https://doi.org/10.3390/su122410361
Submission received: 9 October 2020 / Revised: 26 November 2020 / Accepted: 27 November 2020 / Published: 11 December 2020

Abstract

:
Genome-wide assessments of the genetic landscape of Farm Animal Genetic Resources (FAnGR) are key to developing sustainable breed improvements. Understanding the FAnGR adaptation to different environments and supporting their conservation programs from community initiative to national policymakers is very important. The objective of the study was to investigate the genetic diversity and population structure of communal indigenous goat populations from four provinces of South Africa. Communal indigenous goat populations from the Free State (FS) (n = 24), Gauteng (GP) (n = 28), Limpopo (LP) (n = 30), and North West (NW) (n = 35) provinces were genotyped using the Illumina Goats SNP50 BeadChip. An Illumina Goats SNP50 BeadChip data from commercial meat-type breeds: Boer (n = 33), Kalahari Red (n = 40), and Savanna (n = 31) was used in this study as reference populations. The Ho revealed that the genetic diversity of a population ranged between 0.39 ± 0.11 Ho in LP to 0.42 ± 0.09 Ho in NW. Analysis of molecular variance revealed variations of 3.39% (p < 0.0001) and 90.64% among and within populations, respectively. The first two Principal Component Analyses (PCAs) revealed a unique Limpopo population separated from GP, FS, and NW communal indigenous goat populations with high levels of admixture with commercial goat populations. There were unique populations of Kalahari and Savanna that were observed and admixed individuals. Marker FST (Limpopo versus commercial goat populations) revealed 442 outlier single nucleotide polymorphisms (SNPs) across all chromosomes, and the SNP with the highest FST value (FST = 0.72; chromosome 8) was located on the UHRF2 gene. Population differentiation tests (PCAdapt) revealed PC2 as optimal and five outlier SNPs were detected on chromosomes 10, 15, 20, and 21. The study revealed that the SNPs identified by the first two principal components show high FST values in LP communal goat populations and allowed us to identify candidate genes which can be used in the development of breed selection programs to improve this unique LP population and other communal goat population of FS, GP, and NW, and find genetic factors contributing to the adaptation to harsh environments. Effective management and utilization of South African communal indigenous goat populations is important, and effort should be made to maintain unique genetic resources for conservation.

1. Introduction

South Africa has a great diversity of agro-ecological zones and abundant Farm Animal Genetic Resources (FAnGR). It has more than 6 million indigenous goats, which are distributed across geographic regions of South Africa [1]. The majority of South African goats are indigenous and are kept by small holder farmers in communal areas under extensive production system [2]. The four provinces combined in this study contribute more than 51% of the communal indigenous goat populations of the country [1]. Morphological differences have important socio-cultural and economic values to the rural communities and as a result, most farmers have specific considerations and choices for goat coat colors [3,4,5]. Diversity in indigenous goats is important for maintaining biodiversity and is the basis of conservation and genetic improvement. Although indigenous goats in Southern Africa have low growth rates, small body size, low milk yield, and low carcass weights, their characteristics such as adaptation to local feed resources and response to environmental factors; heat tolerance, and disease and parasite tolerance have a potential for improvement and conservation of these resources [6,7].
Indigenous goat populations have also been used to produce improved breeds with good meat quality and high reproduction, such as the renowned Boer, Savanna, and Kalahari Red breeds. The Boer goat can be traced back to the Dutch farmers of South Africa in its early stage of development as a breed [8]. According to the Boer Goat Breed Association, the earliest breeding stock was a result of crossing between the shorthaired female goats that had white bodies and light-colored heads with a large dapple-colored male goat. Kalahari Red goats was developed from two lines of the brown lop-eared ‘unimproved’ indigenous goats in South Africa and Namibia, and of the Boer goats [9]. In 1991, selection of indigenous brown, and brown and white, goats from the former homelands of the Eastern Cape, the Karoo, and Namibia was also conducted by Albie Horn (http://studbook.co.za). In 1957, Messers Cilliers and Sons selected the white Savanna from indigenous goats [9]. The Savannah goat was first recognized as a distinct breed in the early 1990s, which resulted in the formation of the Savanna Goat Breeders Society in 21 November 1993.
Furthermore, the migration and evolution of goats have always been closely linked with human migration [9], and understanding their evolution can shed light on understanding human migration and culture. The history of indigenous FAnGRs and their adaptation to marginalized production systems, unfavorable environmental conditions, and human selection pressures is an important contributor to their diversity and survival. In turn, these FAnGRs dominate the communal production systems, which are often under extensive management with minimal production inputs. The societal importance of communal indigenous goats, including during marriage, cleansing, birth, death, and initiation ceremonies plays an important role to be termed the so-called “poor man’s cow”, as they refer to their role as the source of food and income [6].
It is expected that the effect of natural selection (i.e., adaptation to the specific environment) is more ostensible in the communal indigenous goat population and has played an important role in their development, while commercial breeds are subjected to more intense artificial selection [10]. Therefore, communal indigenous populations will tend to show the ability to use low-quality fodder, resistance to gastro-intestinal parasites, diseases, heat tolerance, and water scarcity. A small population with a cumulative effect on the overall expression of the phenotype highlights that adaptation is a complex trait that involves many biological processes and quantitative trait loci [11,12,13].
The most promising method for the investigation of genetic diversity and population structure is the analysis of single nucleotide polymorphisms (SNPs), which started its journey over a decade ago through advances in availability of reference genomes and development of high-throughput genotyping platforms [14]. Furthermore, the recent developments in genomic technologies resulting in the availability of the Illumina Goat 50K SNP BeadChip [15] have presented the opportunity to search for genomic regions that may have undergone selection. Such studies in cattle [16,17], sheep [18,19] chickens [20], and pigs [21,22] have each identified genes that have undertaken a positive selection and are likely to contribute directly to phenotypic variation. Furthermore, genetic diversity studies on local and international goat breeds, e.g., Italian [23], Moroccan [24], and South African [20,25], were conducted. Additionally, with regard to goat genetic diversity, more studies on goat 52 K single nucleotide polymorphism chip has been available for some time [15], and has already been used for national and multi-country goat diversity studies [7,26,27,28]. Using this standardized tool for genotyping, the AdaptMap initiative [11] gathered a dataset that includes genotypes of 148 goat populations which successfully investigated the distribution of goat genetic variation around the world, compared the present-day diversity patterns to those observed in ancient goat samples and in other ruminant livestock species, as well as reconstructed admixture and migration events that have shaped goat post-domestication history.
Studies on population structure and genetic diversity are important for describing the natural selection history and genetic relationships among FAnGR [29]. The genome-wide assessments of the genetic landscape of FAnGRs’ is a key aspect of developing sustainable breed improvement strategies and understanding adaptations to extreme environments [30,31]. Additionally, it has value in supporting conservation programs from community initiatives to national policy makers. To facilitate the rapid adaptation to changing environments, maintaining local genetic resources is very much required. The objective of this study was to investigate the population structure and genetic diversity of communal indigenous goat populations from four provinces of South Africa.

2. Materials and Methods

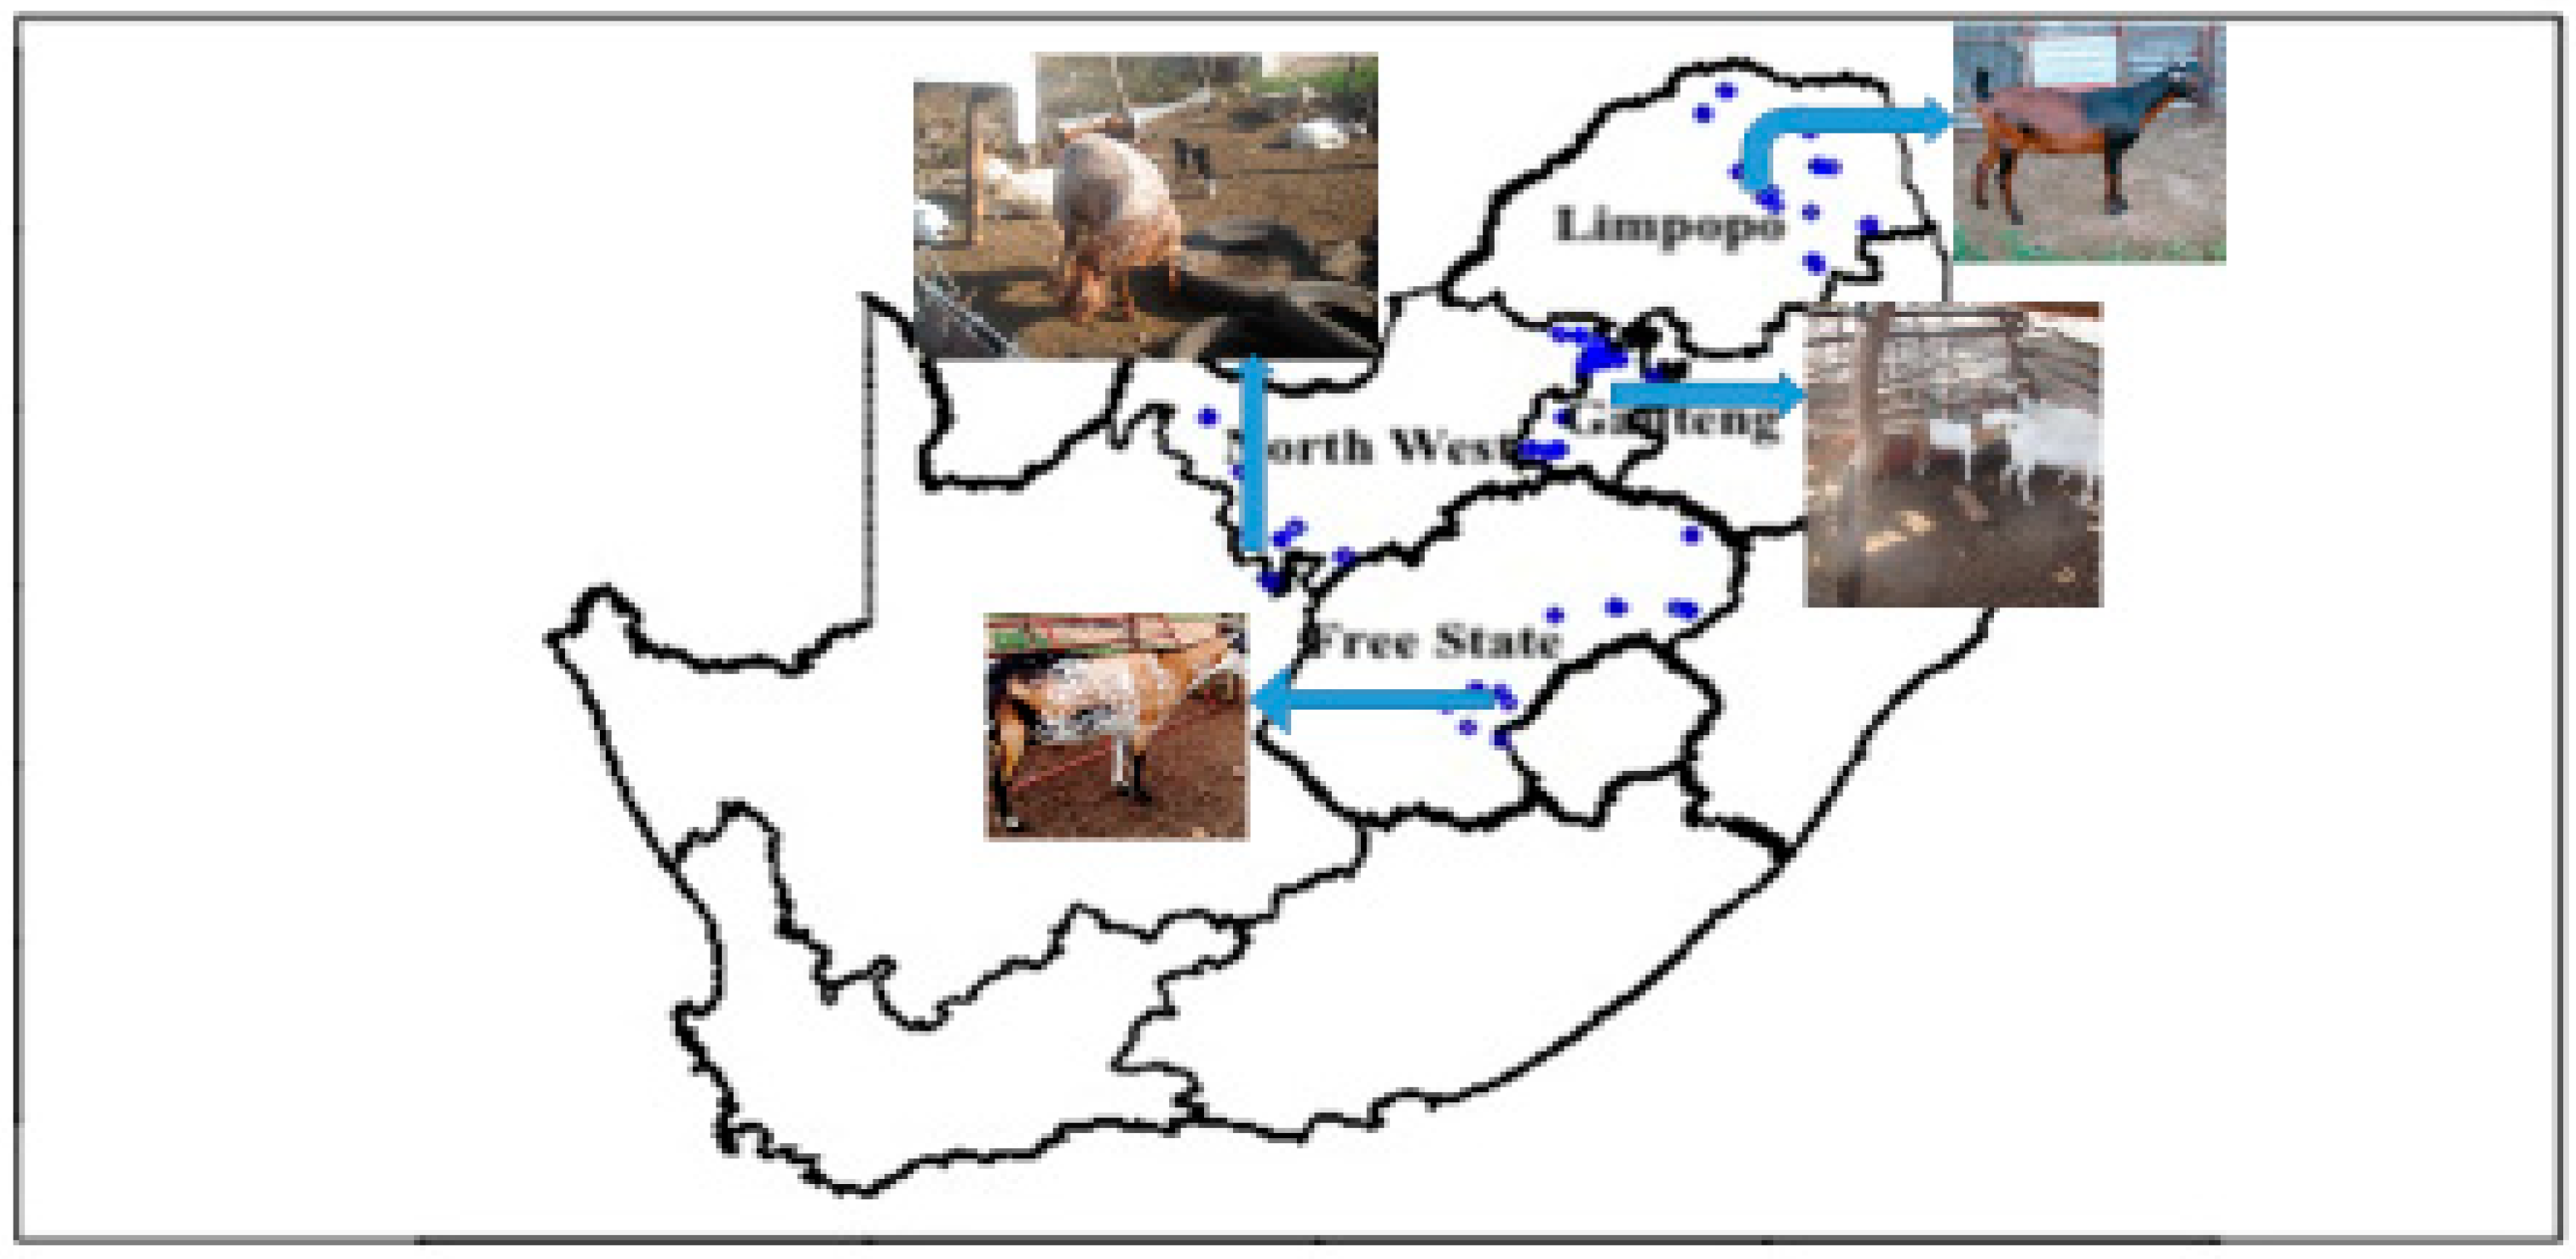
2.1. Population Description and Sampling

A total of 117 Communal indigenous goat populations were systematically randomly sampled from the Free State (n = 24), Gauteng (n = 28), Limpopo (n = 30), and North West (n = 35) provinces of South Africa (Figure 1). The sampling strategy targeted the major goat producing provinces of South Africa (Figure 1). From each animal, blood samples were collected by jugular venipuncture into 6-mL EDTA vacutainer tubes (Greiner Bio-One, GmbH, Kremsmünster, Austria). The DNeasy Blood and Tissue Kit (Qiagen) was used to extract Genomic DNA, as per the manufacturer’s instructions. A 1% agarose gel electrophoresis and Qubit 3.0 Fluorometer (Life Technologies, Carlsbad, CA, USA) were used to determined DNA quality and quantity, respectively. Descriptions of sampling locations and farms have been described in detail in [31].

2.2. Genotyping and Quality Control

The Illumina Goats SNP50 BeadChip [15] was used to genotype DNA samples by using the Infinium assay compatible with the Illumina HiScan SQ genotyping platform at the Agricultural Research Council-Biotechnology Platform, South Africa. The BeadChip was developed by the International Goat Genome Consortium (IGGC) with more than 50K SNPs across the whole genome with an inter-SNP spacing of approximately 40 kb [15]. The genotype input file was converted into a PLINK and SNP calling rate using the Illumina Genome Studio v2.0 [32] map/ped input file. Information on the chromosome number, chromosomal position, and Golden Helix SVS v8.3.4 (Golden Helix, Bozeman, MT, USA) were used to update the SNP marker information. PLINK was used to perform individual and SNP quality control procedures [32]. The mind function procedure was used for analyses of individuals with a missing genotype call rate of greater than 5%, which were excluded for further analysis. The three samples that did not meet the quality control threshold (95%) included 2 individuals from Limpopo and 1 from Gauteng, and they were removed from the final dataset. The removal of SNPs with less than 95% call rate (n = 683), and less than 5% minor allele frequency (n = 1228) and HWE exact test (n = 123) resulted in a total of 47,908 autosomal SNPs available for downstream analysis. The average genotyping rate in the remaining 117 samples was 0.99. Additionally, to evaluate population structure and relatedness, commercial populations represented by Boer (n = 33), Kalahari Red (n = 40), and Savanna (n = 31) reference population data obtained from a previous study [33] were included. To prepare dataset 2, the same QC criterion was used, resulting 46,081 SNPs and 195 individuals. In addition, a genome-wide identity-by-descent (IBD) similarity matrix was used to calculate and prune related individuals and the ‘–indep-pairwise 50 5 0.2-’ command was used to remove one of every pair of SNPs with r2 > 0.2 within 50-SNP sliding windows in PLINK [32] for dataset 3. From the IBD threshold of greater than 0.40, denoting substantial relatedness, twenty-seven animals were removed, therefore data set 3 consisted of 20,873 SNPs and 168 individuals.

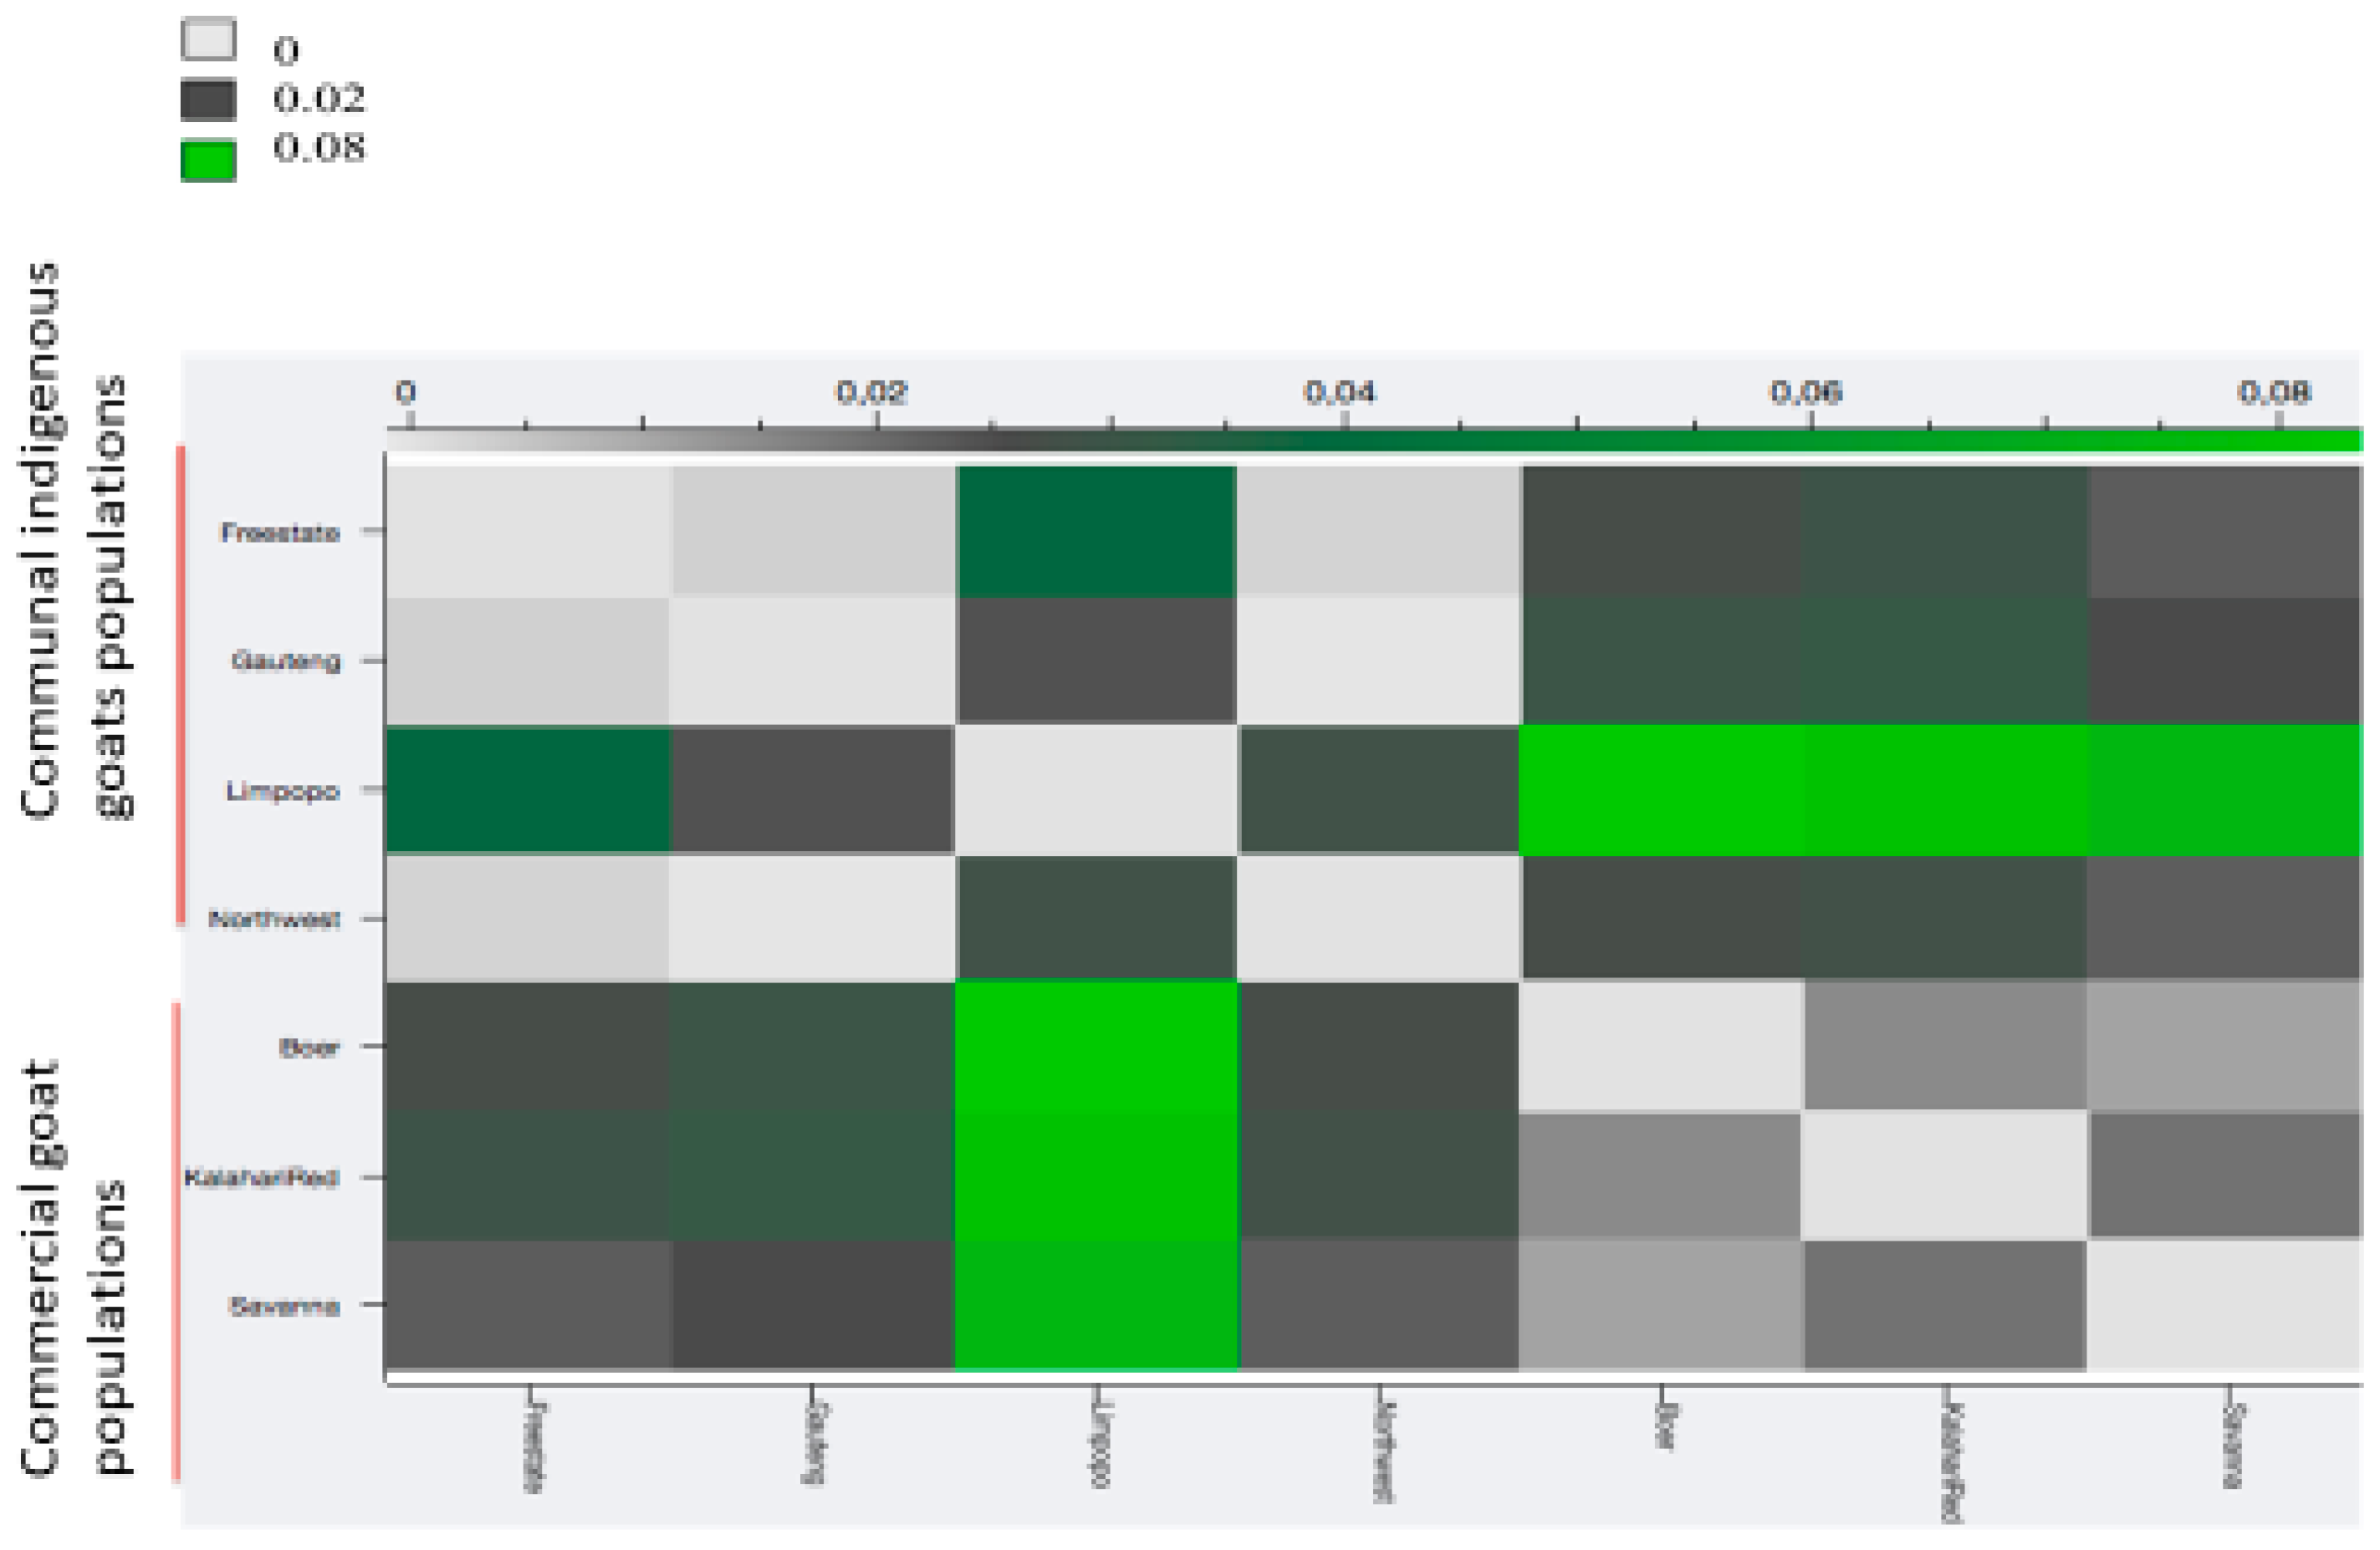
2.3. Genetic Diversity

Minor allele frequency (MAF) was estimated for each of the four communal indigenous goat populations using PLINK [32]. The fixed alleles (MAF = 0.00), rare alleles (>0.00–<0.05), intermediate alleles (≥0.05–<0.10), and common alleles (≥0.10–≤0.5) were categories for alleles that were used in different bins based on their frequency. PLINK was used to estimate within-population genetic diversity, observed heterozygosity (Ho), and the expected heterozygosity (HE) [32]. The observed heterozygosity (Ho) estimates for each population were calculated from observed genotype frequencies obtained from PLINK [32] as follows: (N-O)/N (where N is the number of non-missing genotypes and O is the number of observed homozygous genotypes for a given individual). Expected heterozygosity (HE) estimates for each population were calculated from expected genotype frequencies as follows: (N-E)/N (where N is the number of non-missing genotypes and E is the number of expected homozygous genotypes for a given individual). Allelic richness (Rt) over all loci for each population was computed using ADZE Allelic Diversity Analyzer: Version 1.0.

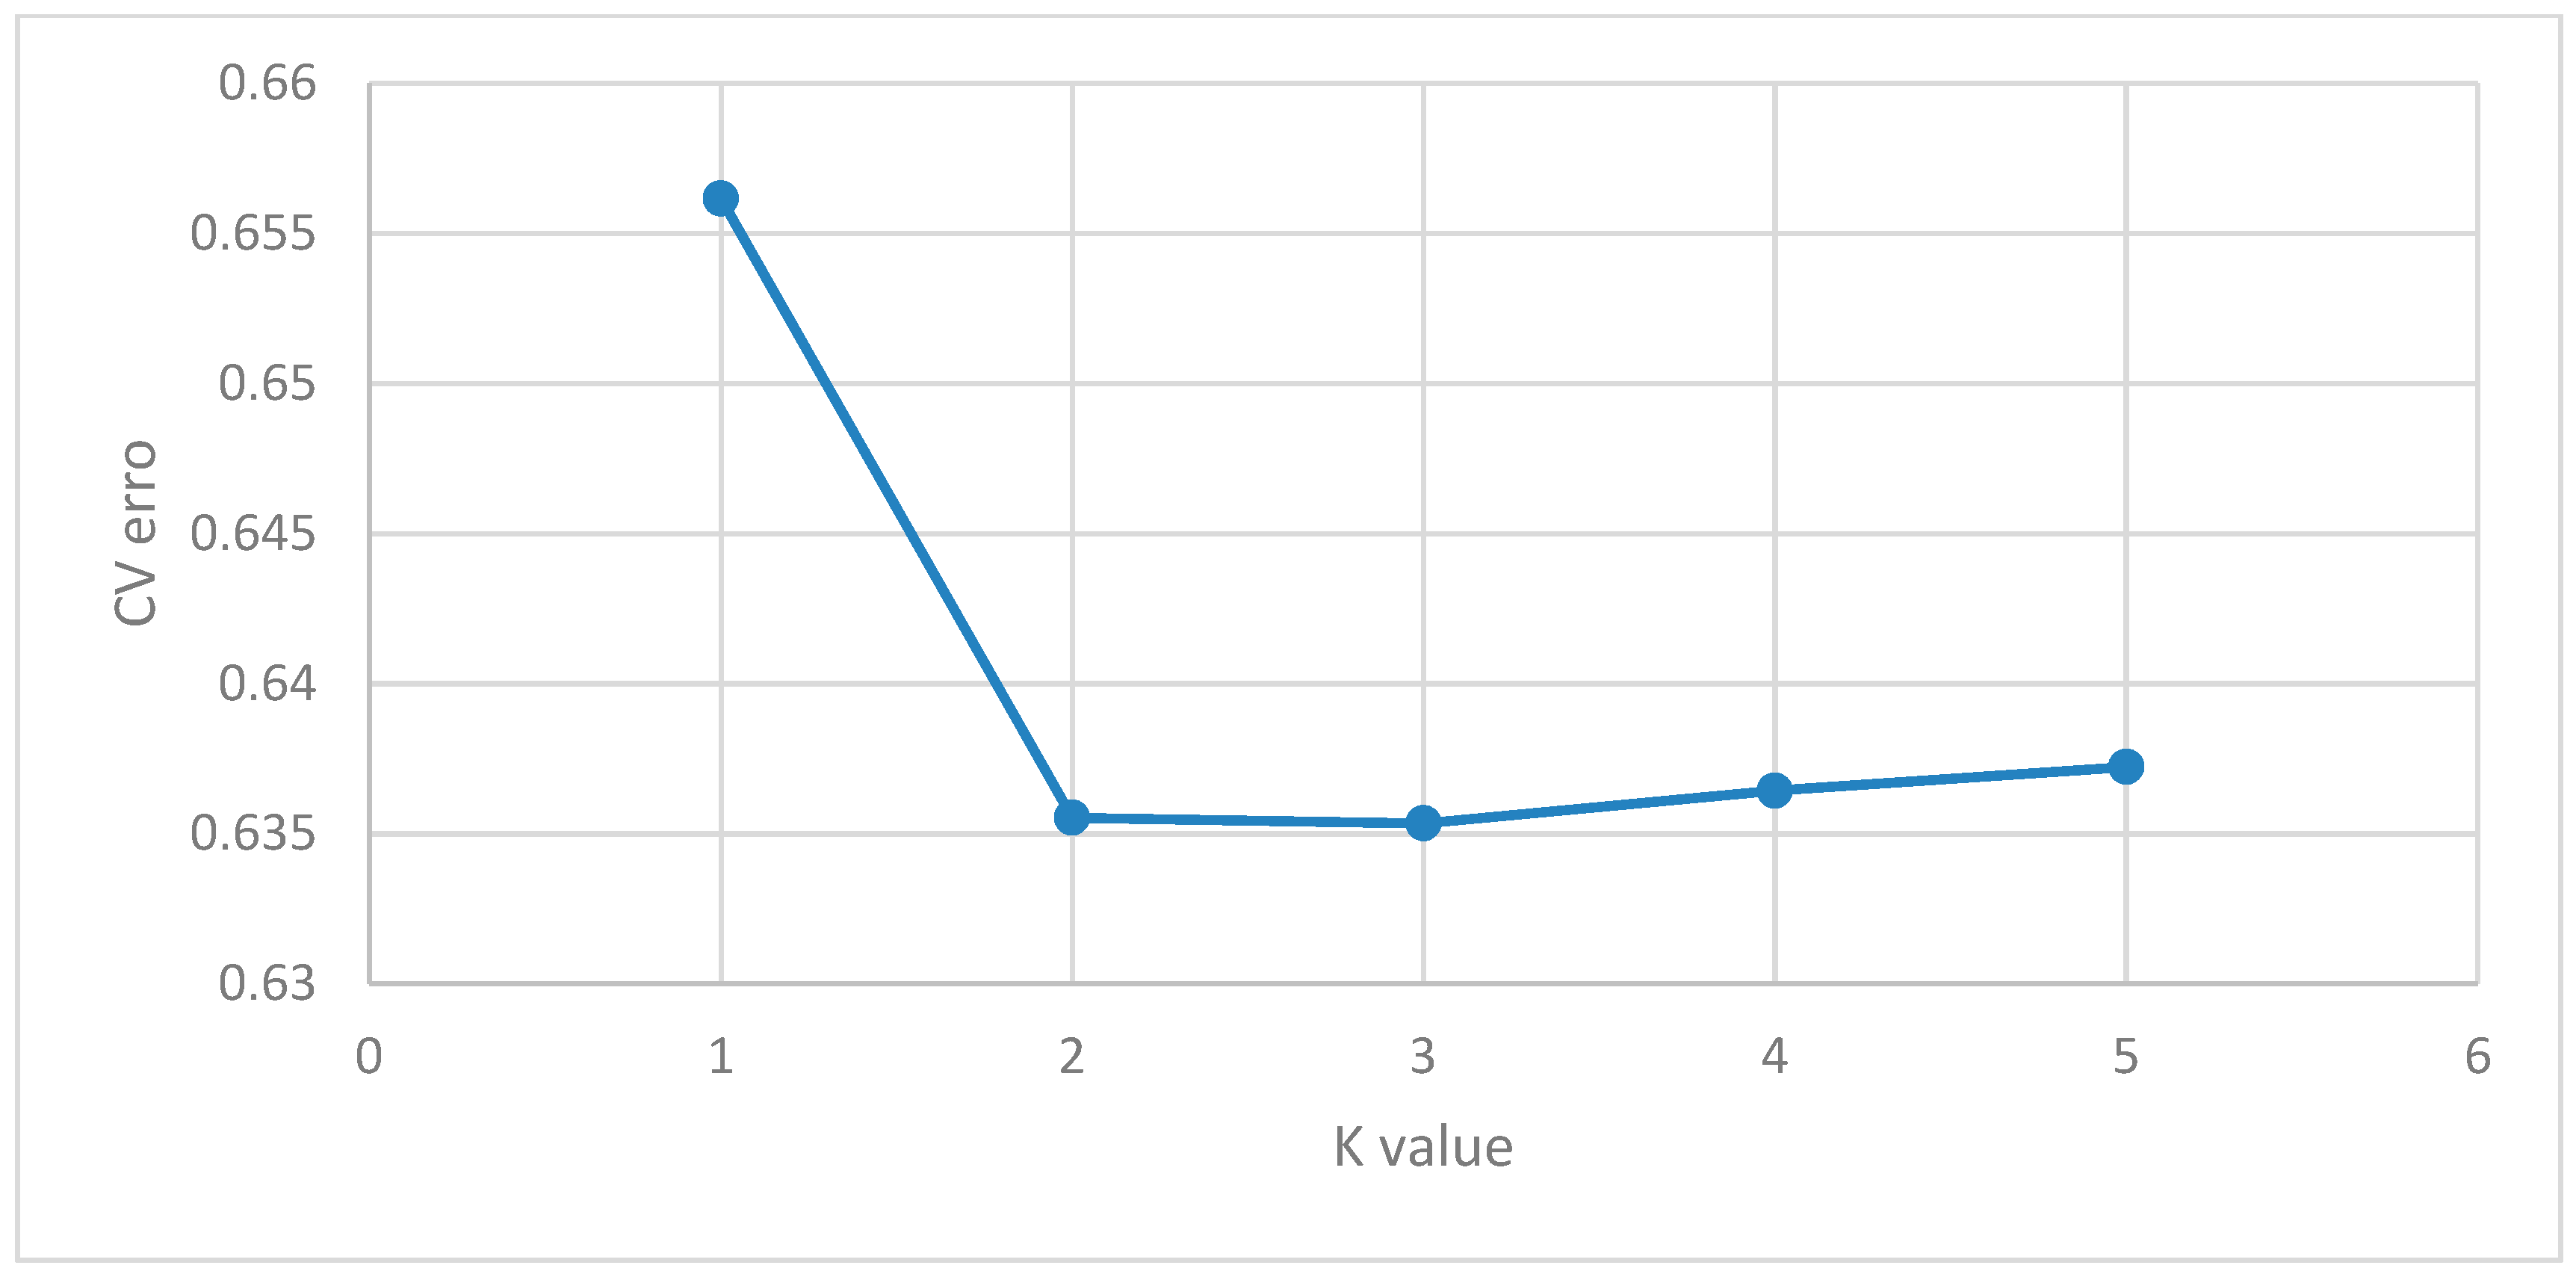
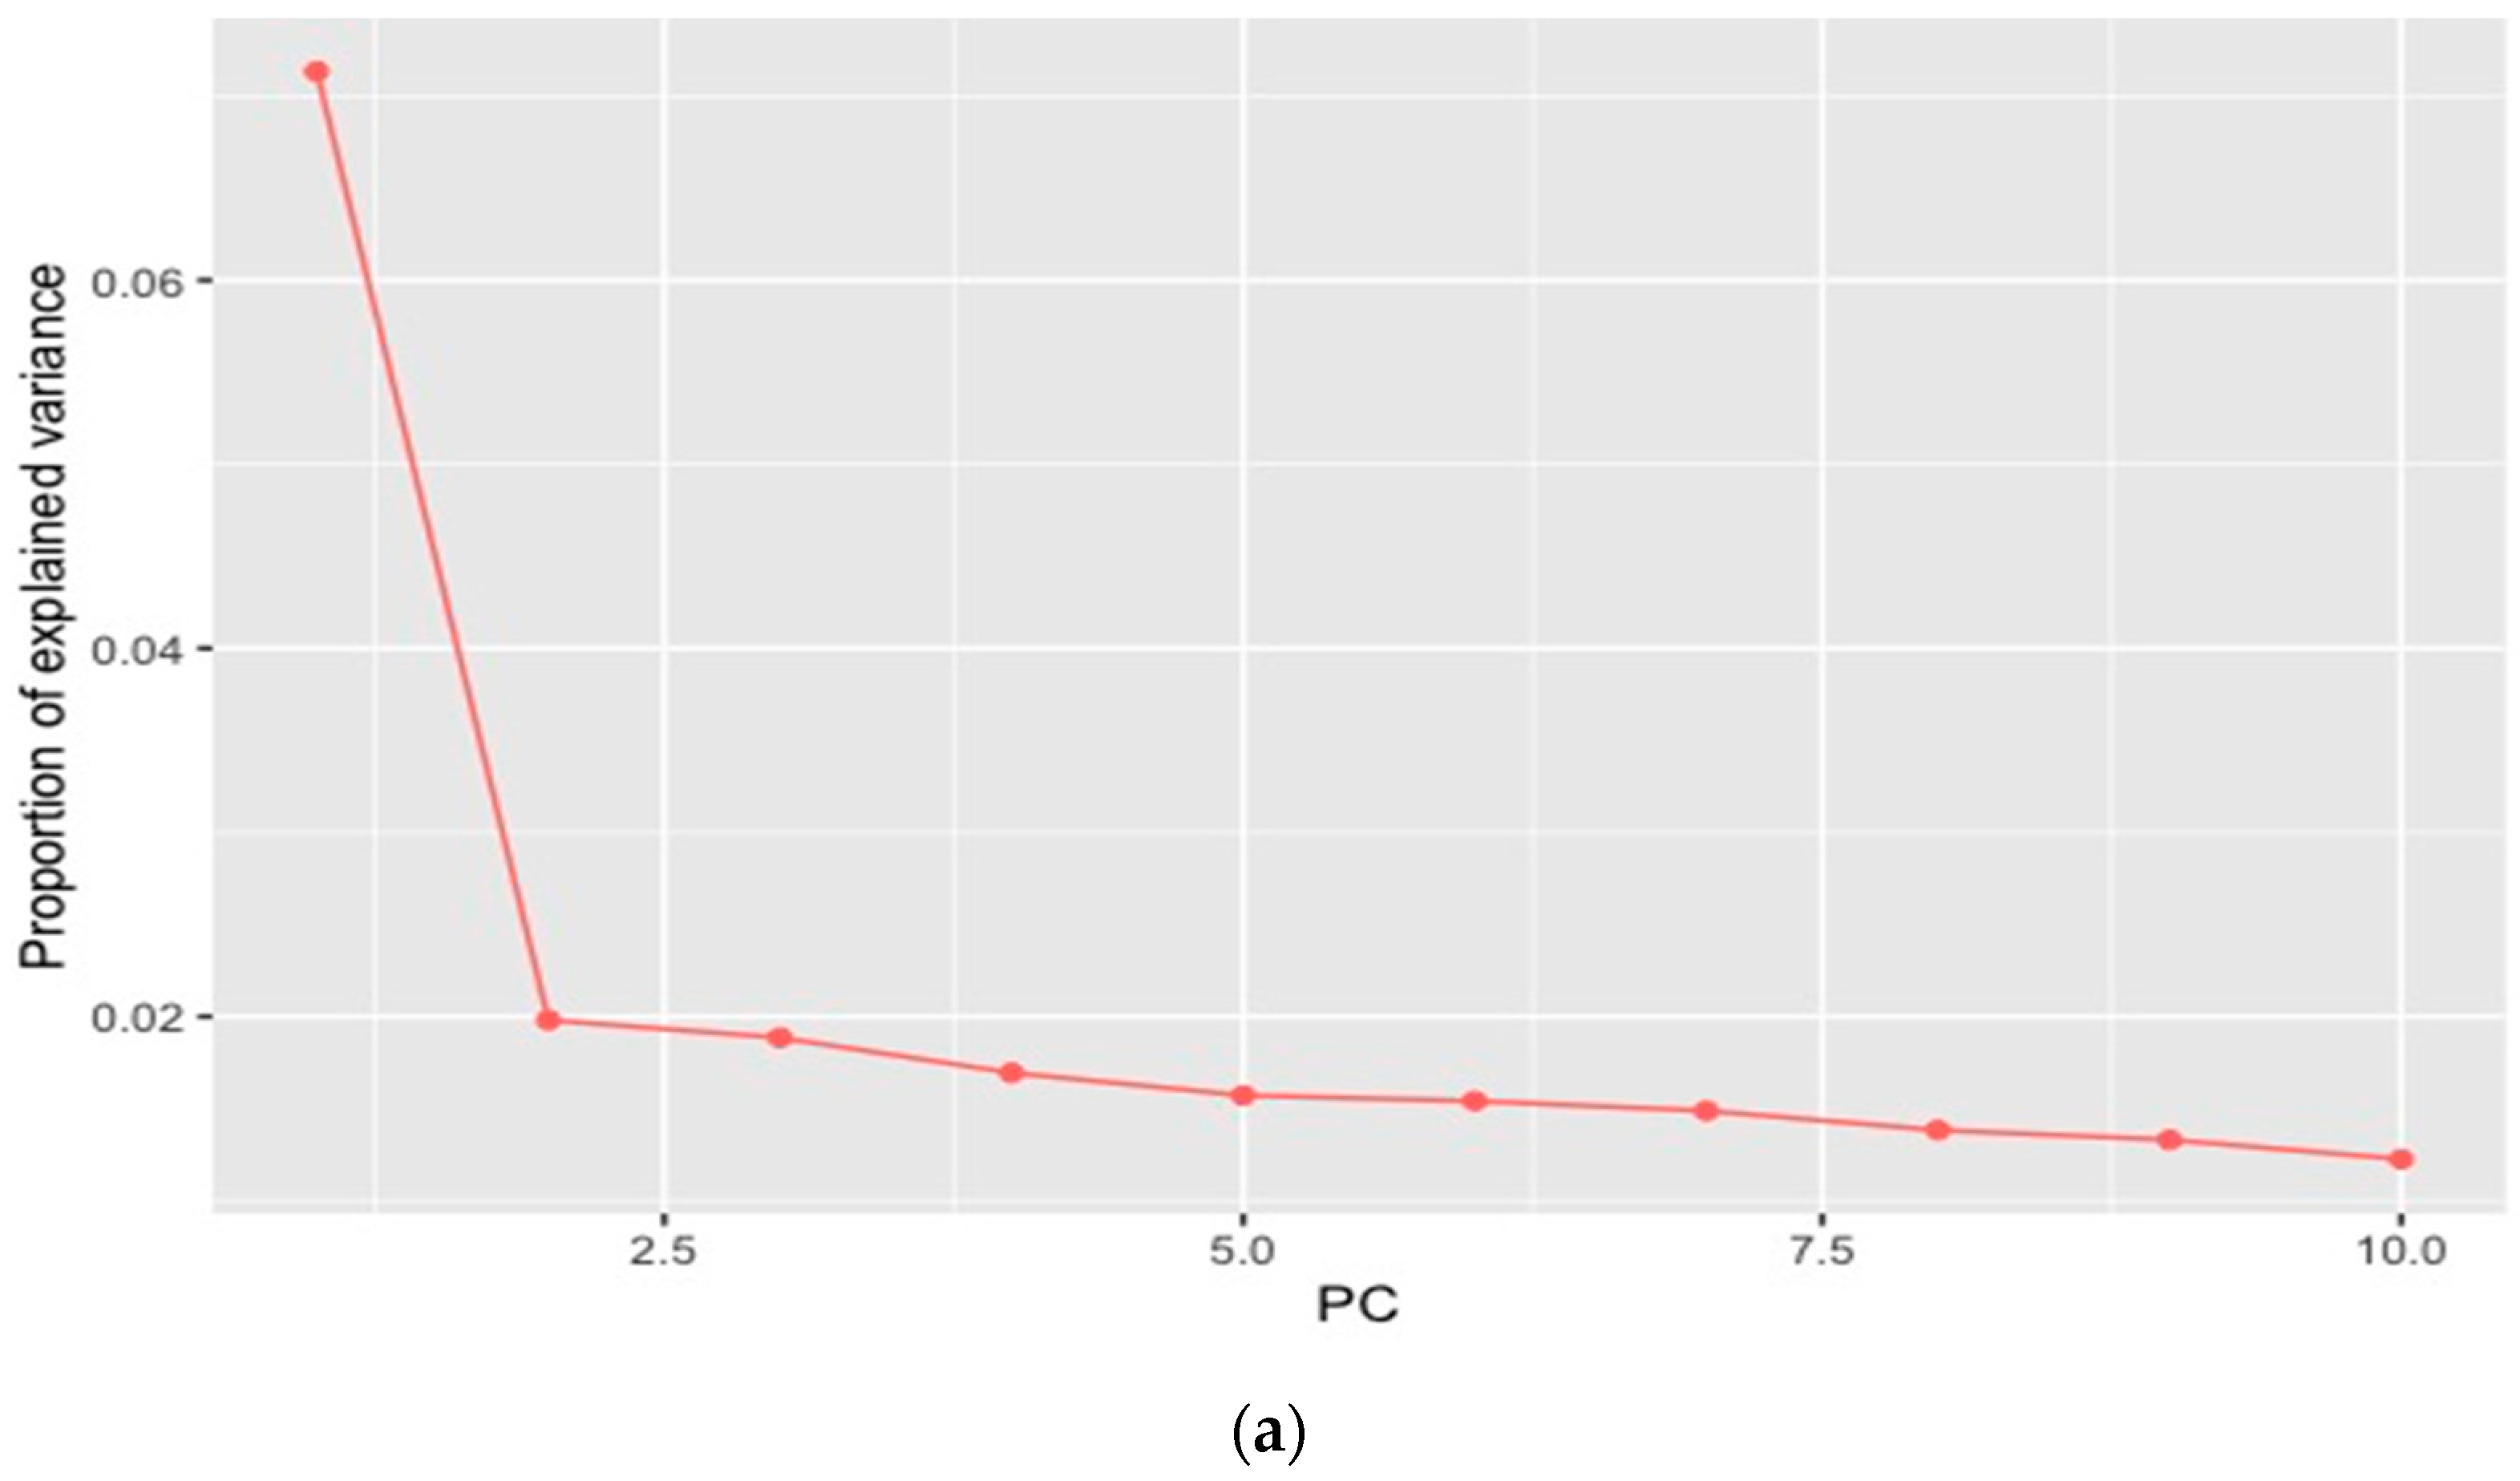
2.4. Population Structure Analysis

AMOVA was executed using dataset 2 and analyzed using ARLEQUIN 3.5 after conversion map/ped file conversion to arp file using PGDSpider. Two groups: The commercial and communal indigenous goat populations were created by doing the significance of variance components for each hierarchical comparison (among populations, among individuals, among individuals within populations). The pairwise fixation indexes (FST) [34] were used as a measure of genetic differentiation between population pairs using Golden Helix SVS v8.3.4 (Golden Helix, Bozeman, MT, USA). The Principal Component Analysis (PCA) was carried out using Golden Helix SVS v8.3.4 (Golden Helix, Bozeman, MT, USA), and to infer the most probable number of ancestral populations, ADMIXTURE 1.21 was used [35] using default settings. ADMIXTURE was run from K = 2 to K = 5. To explore the most probable number of clusters (K), ten-fold cross-validation (CV = 10) was specified, with the error profile obtained thereafter used as described by [35]. The GENESIS software was used for graphical display of the admixture output and was also used to visualize admixture plots [36].

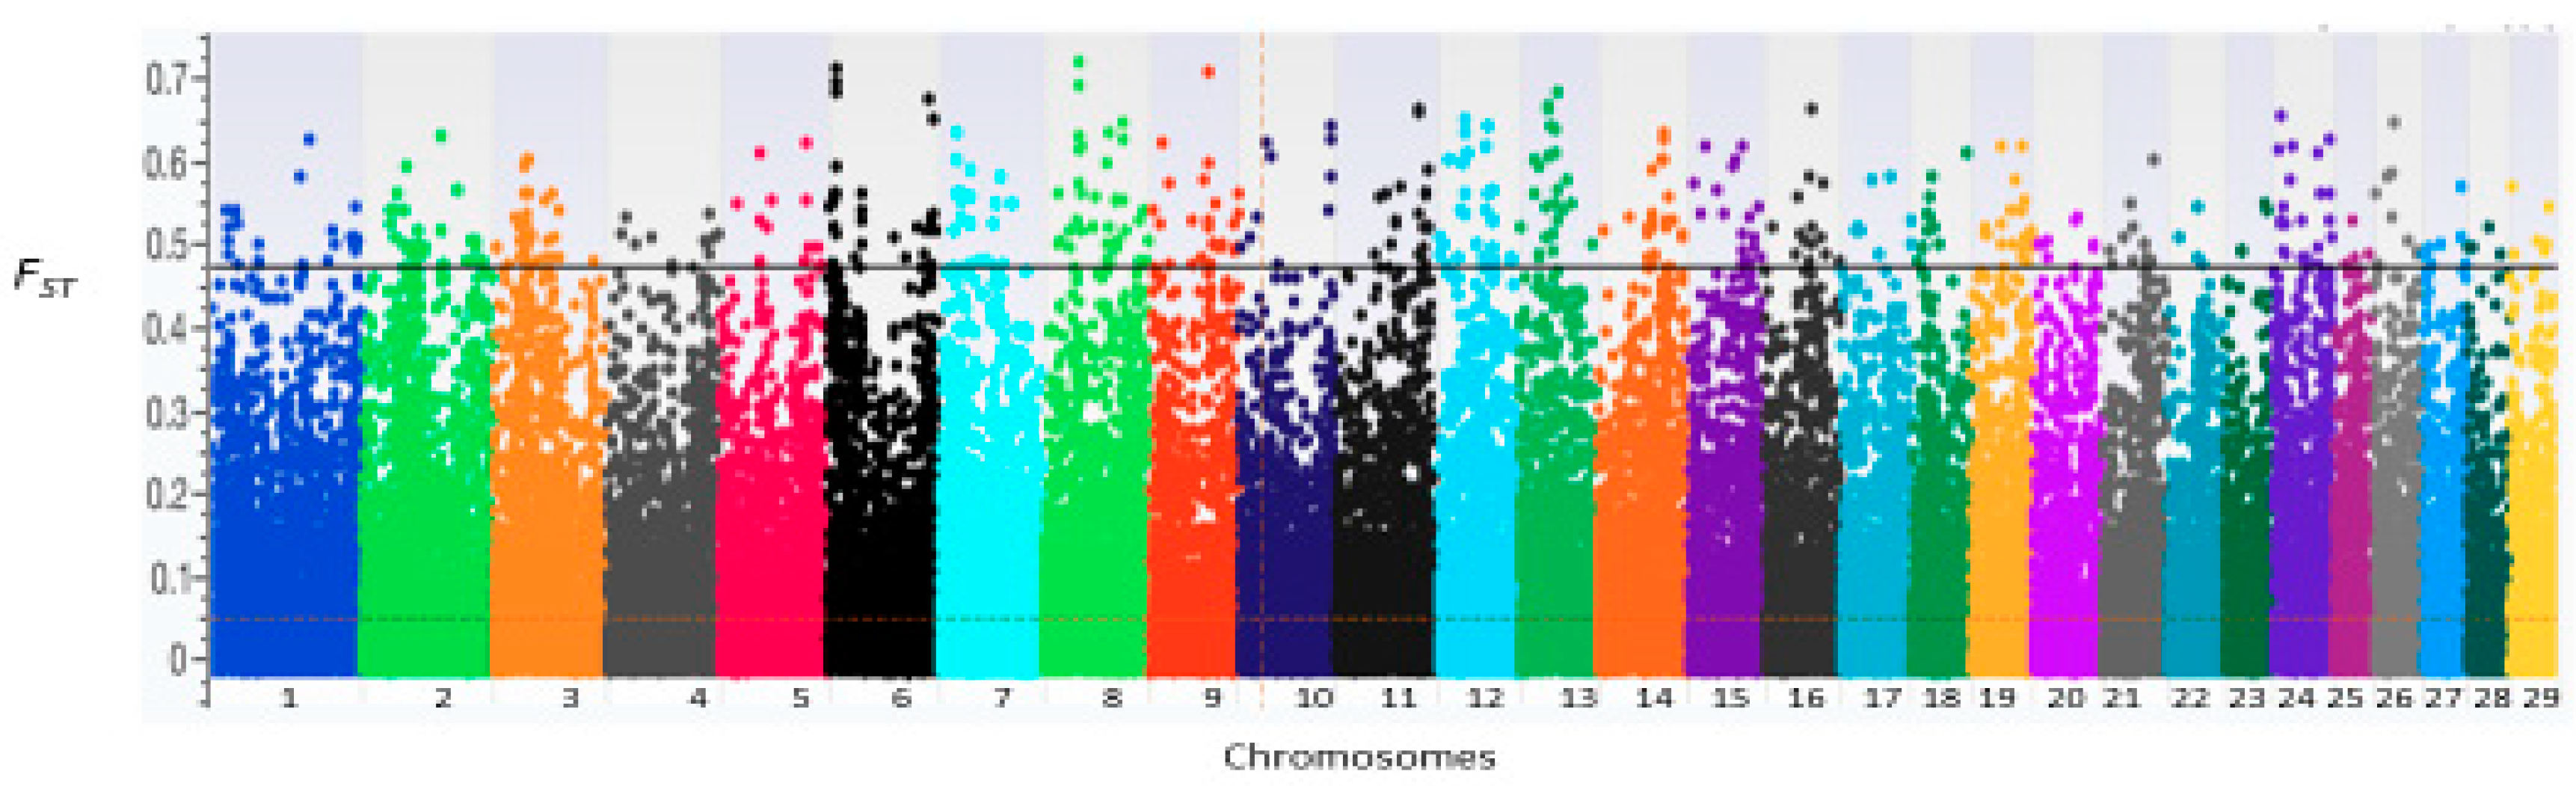
2.5. Identification of Signatures of Selection

Identification of signatures of divergent selection between populations using population differentiation (Fst) was calculated using Golden Helix SVS v8.3.4 (Golden Helix, Bozeman, MT, USA) between the Limpopo population versus commercial goat populations: Boer, Savanna, and Kalahari Red. Outliers were identified, and a region was considered to be a high-FST outlier if it corresponded to the upper 1% of the empirical genome-wide distribution of FST. The second approach used PCAdapt [37] to find outlier SNPs. We first assessed the optimal Principal Components (PC) from 1 to 10 and then the candidate SNPs significantly correlating to the optimal PCs. All outlier SNPs detected using both methods were mapped to gene-associated regions based on the goat genome annotation (ARS 1) on the BioMart database (www.ensembl.org/biomart). The genes in regions with evidence for selection were searched against the Kyoto Encyclopedia of Genes and Genomes (KEGG, http://www.genome.jp/kegg/) pathways and literature search.

3. Results

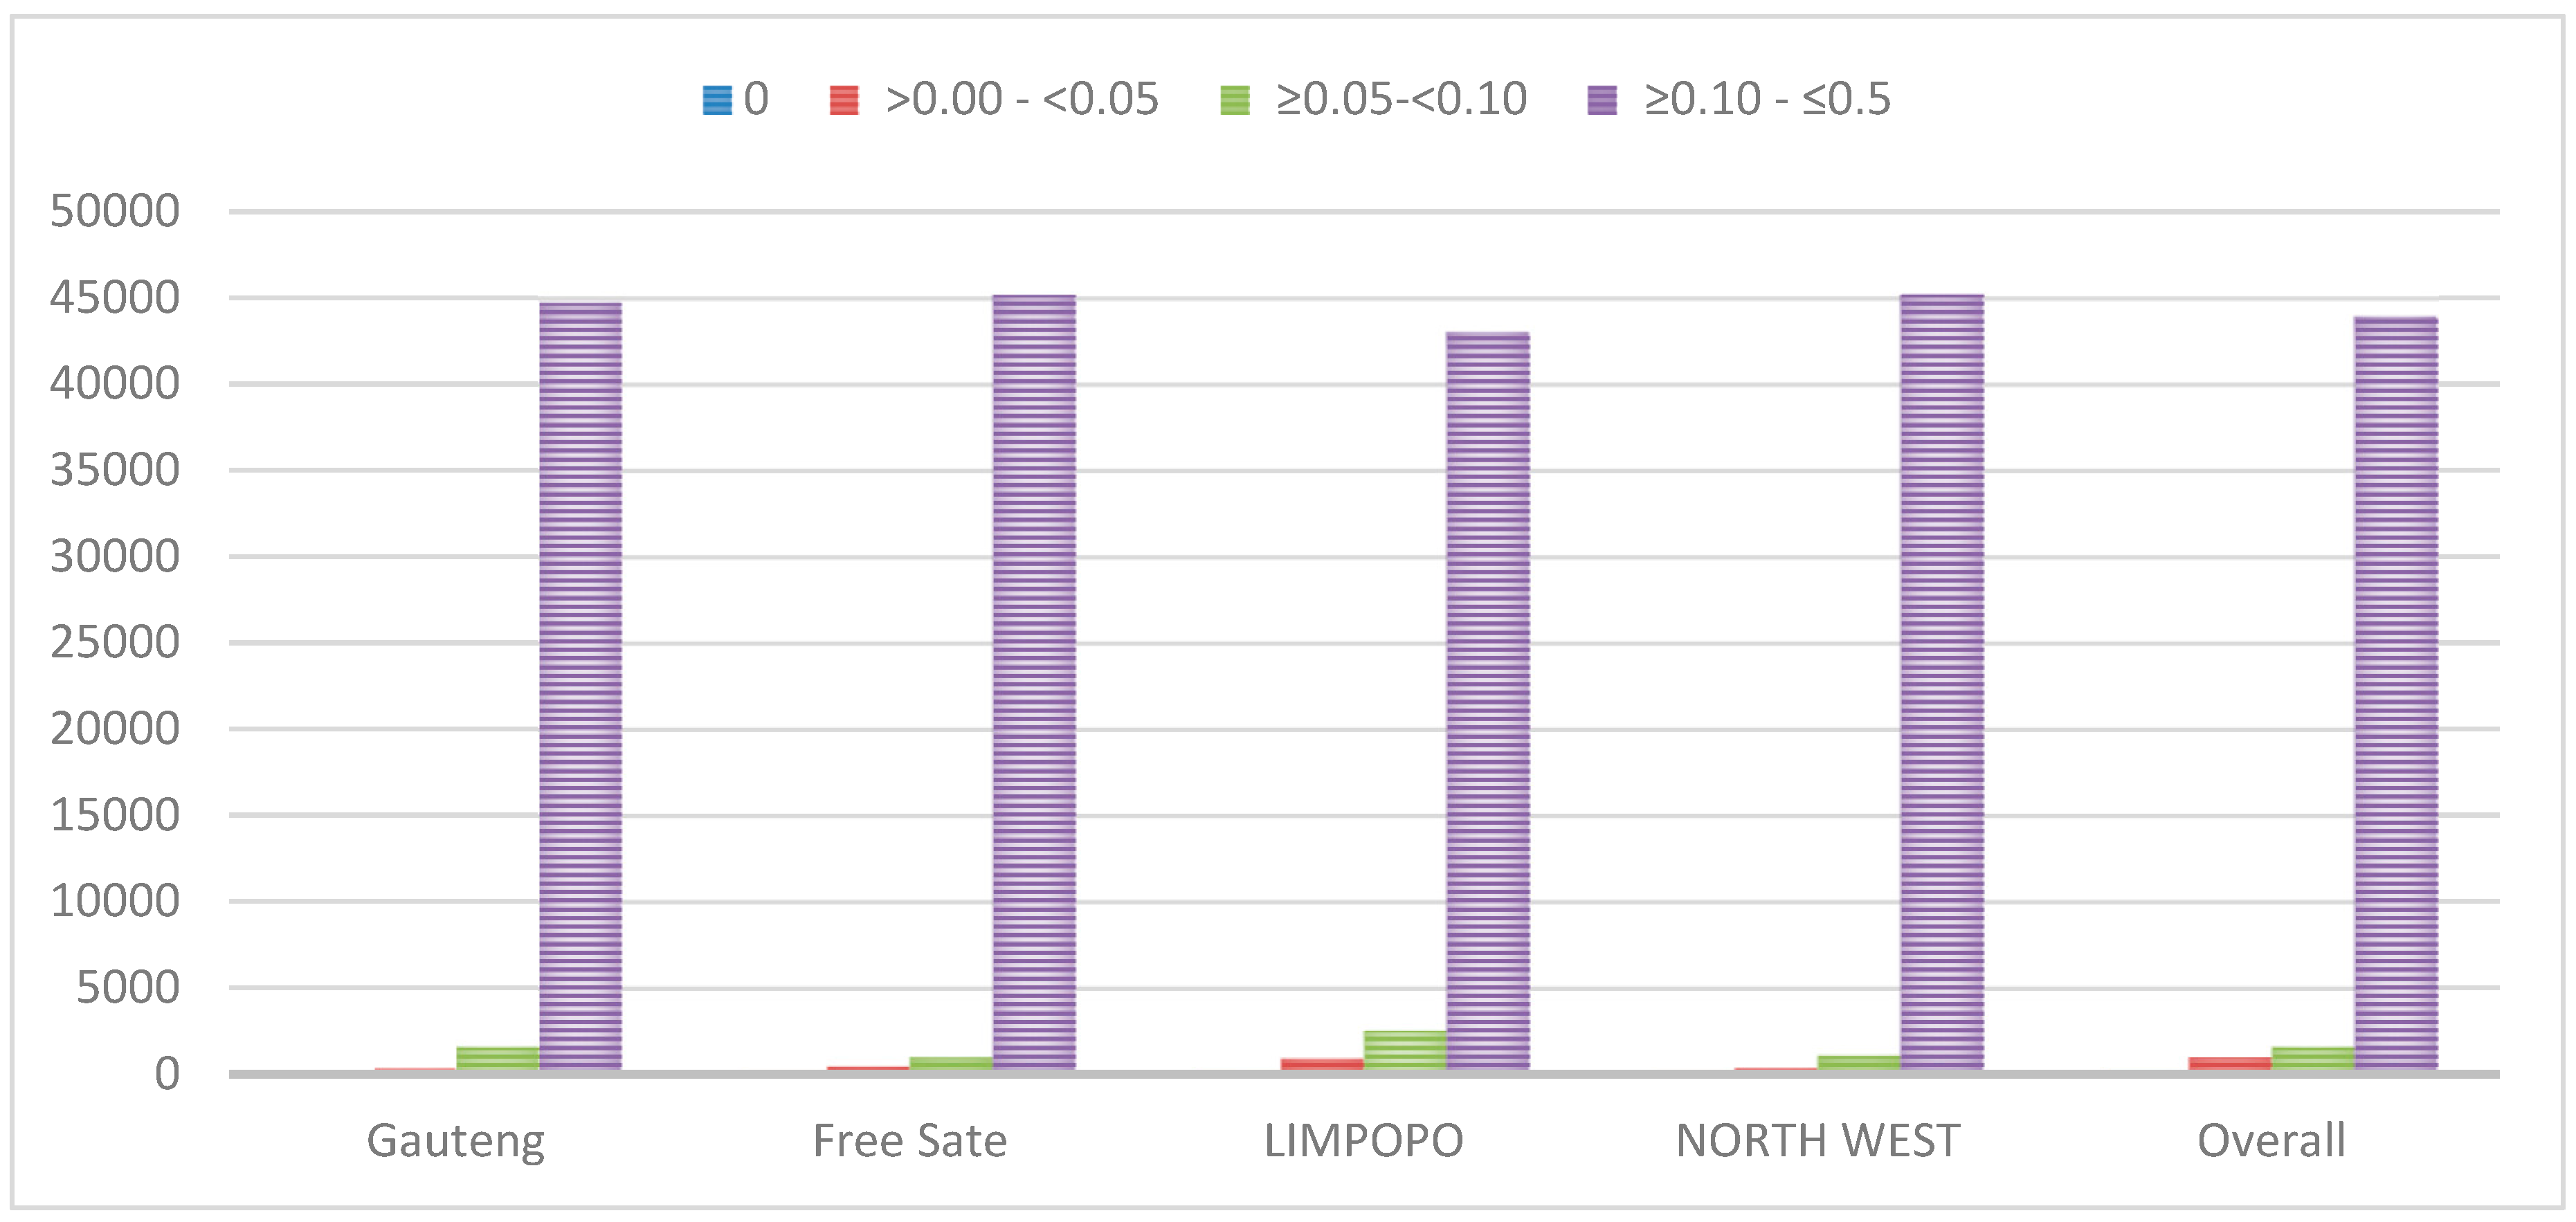
3.1. Quality Control and Genetic Diversity

The mean minor allele frequencies (MAFs) for Gauteng, Free State, Limpopo, and North West were 0.33 ± 0.11, 0.33 ± 0.11, 0.29 ± 0.12, and 0.33 ± 0.11, respectively, with an overall mean of 0.32 ± 0.12 across the Communal indigenous populations. Figure 2 is presenting minor allele frequency distribution for different categories in each population. The number of fixed SNPs (MAF = 0.00) varied from 5 in North West populations to 151 in Limpopo. Polymorphic SNPs were high (<90%) across all populations. The allelic richness for Gauteng, Free State, Limpopo, and North West were 1.99 ± 0.02, 1.99 ± 0.02, 1.99 ± 0.05, and 1.99 ± 0.01, respectively, and with the mean number of alleles per locus being 1.99 ± 0.03 across the communal indigenous populations.
The Ho reflects the genetic diversity and history of a population, with Free State and Gauteng having an HE of 0.40 ± 0.13 and Ho of 0.41 ± 0.09; North West recording an HE of 0.39 ± 0.1 and Ho of 0.42 ± 0.09; and Limpopo recording an HE of 0.38 ± 0.14 and Ho of 0.39 ± 0.11.

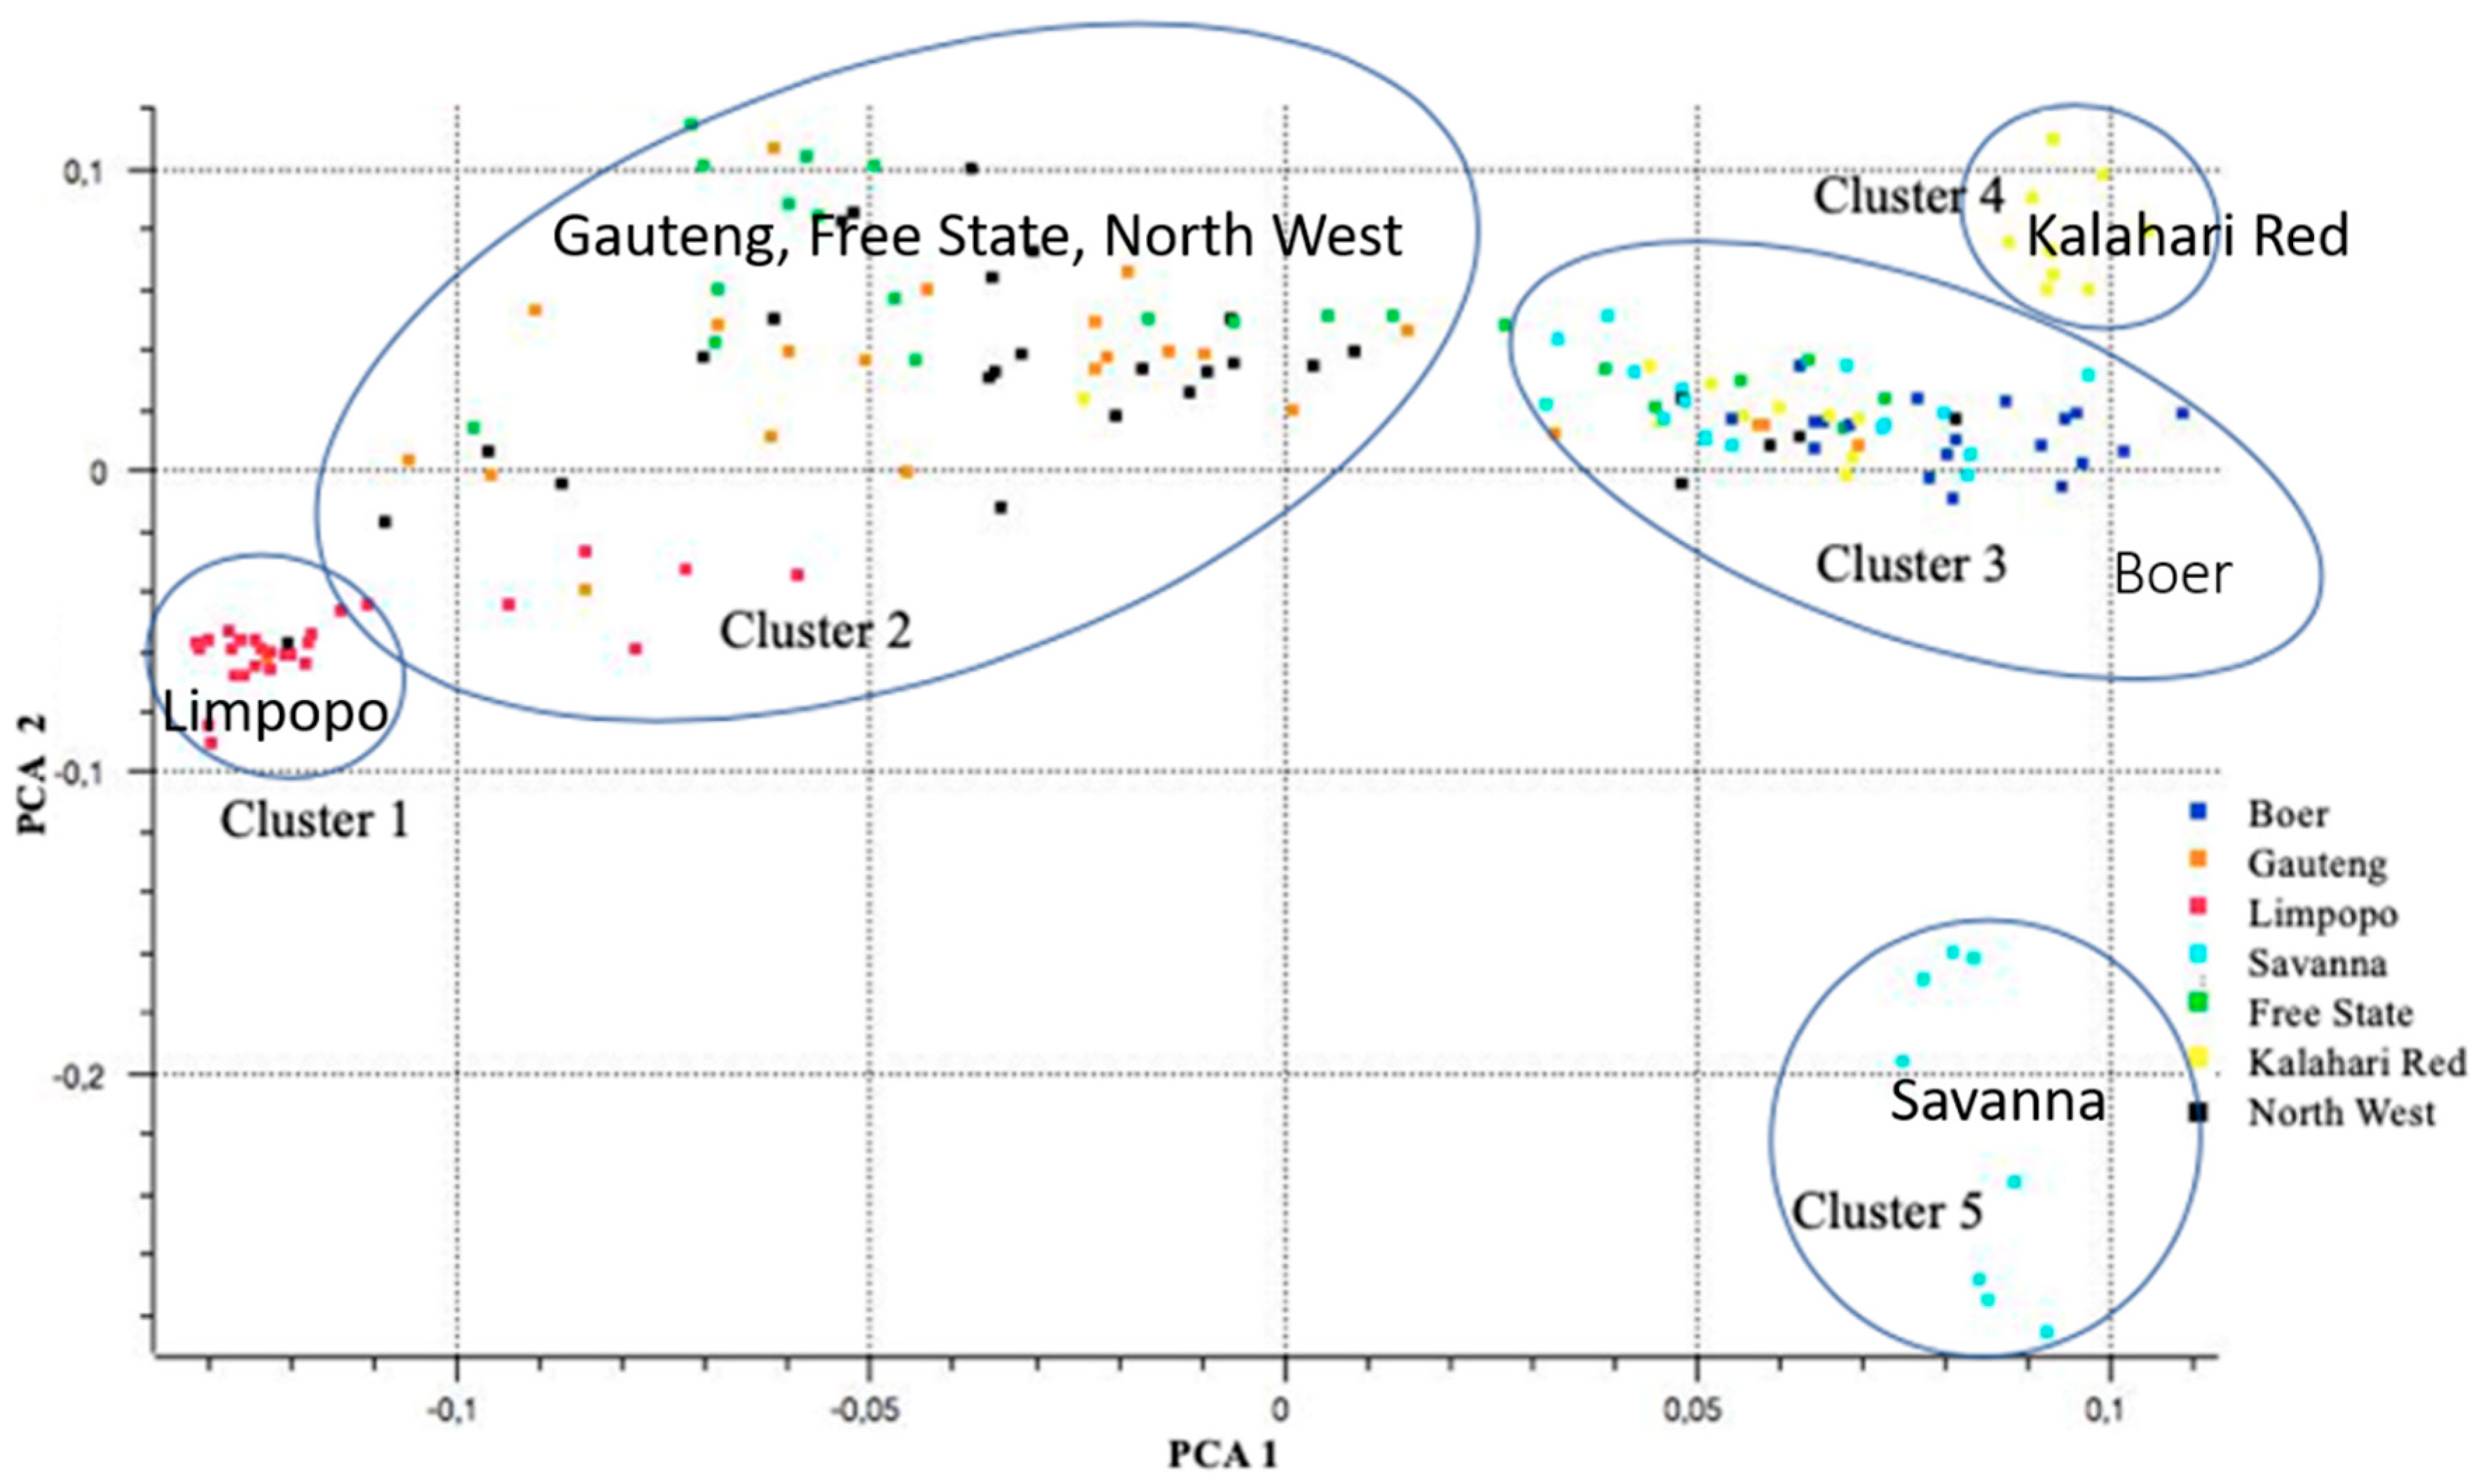
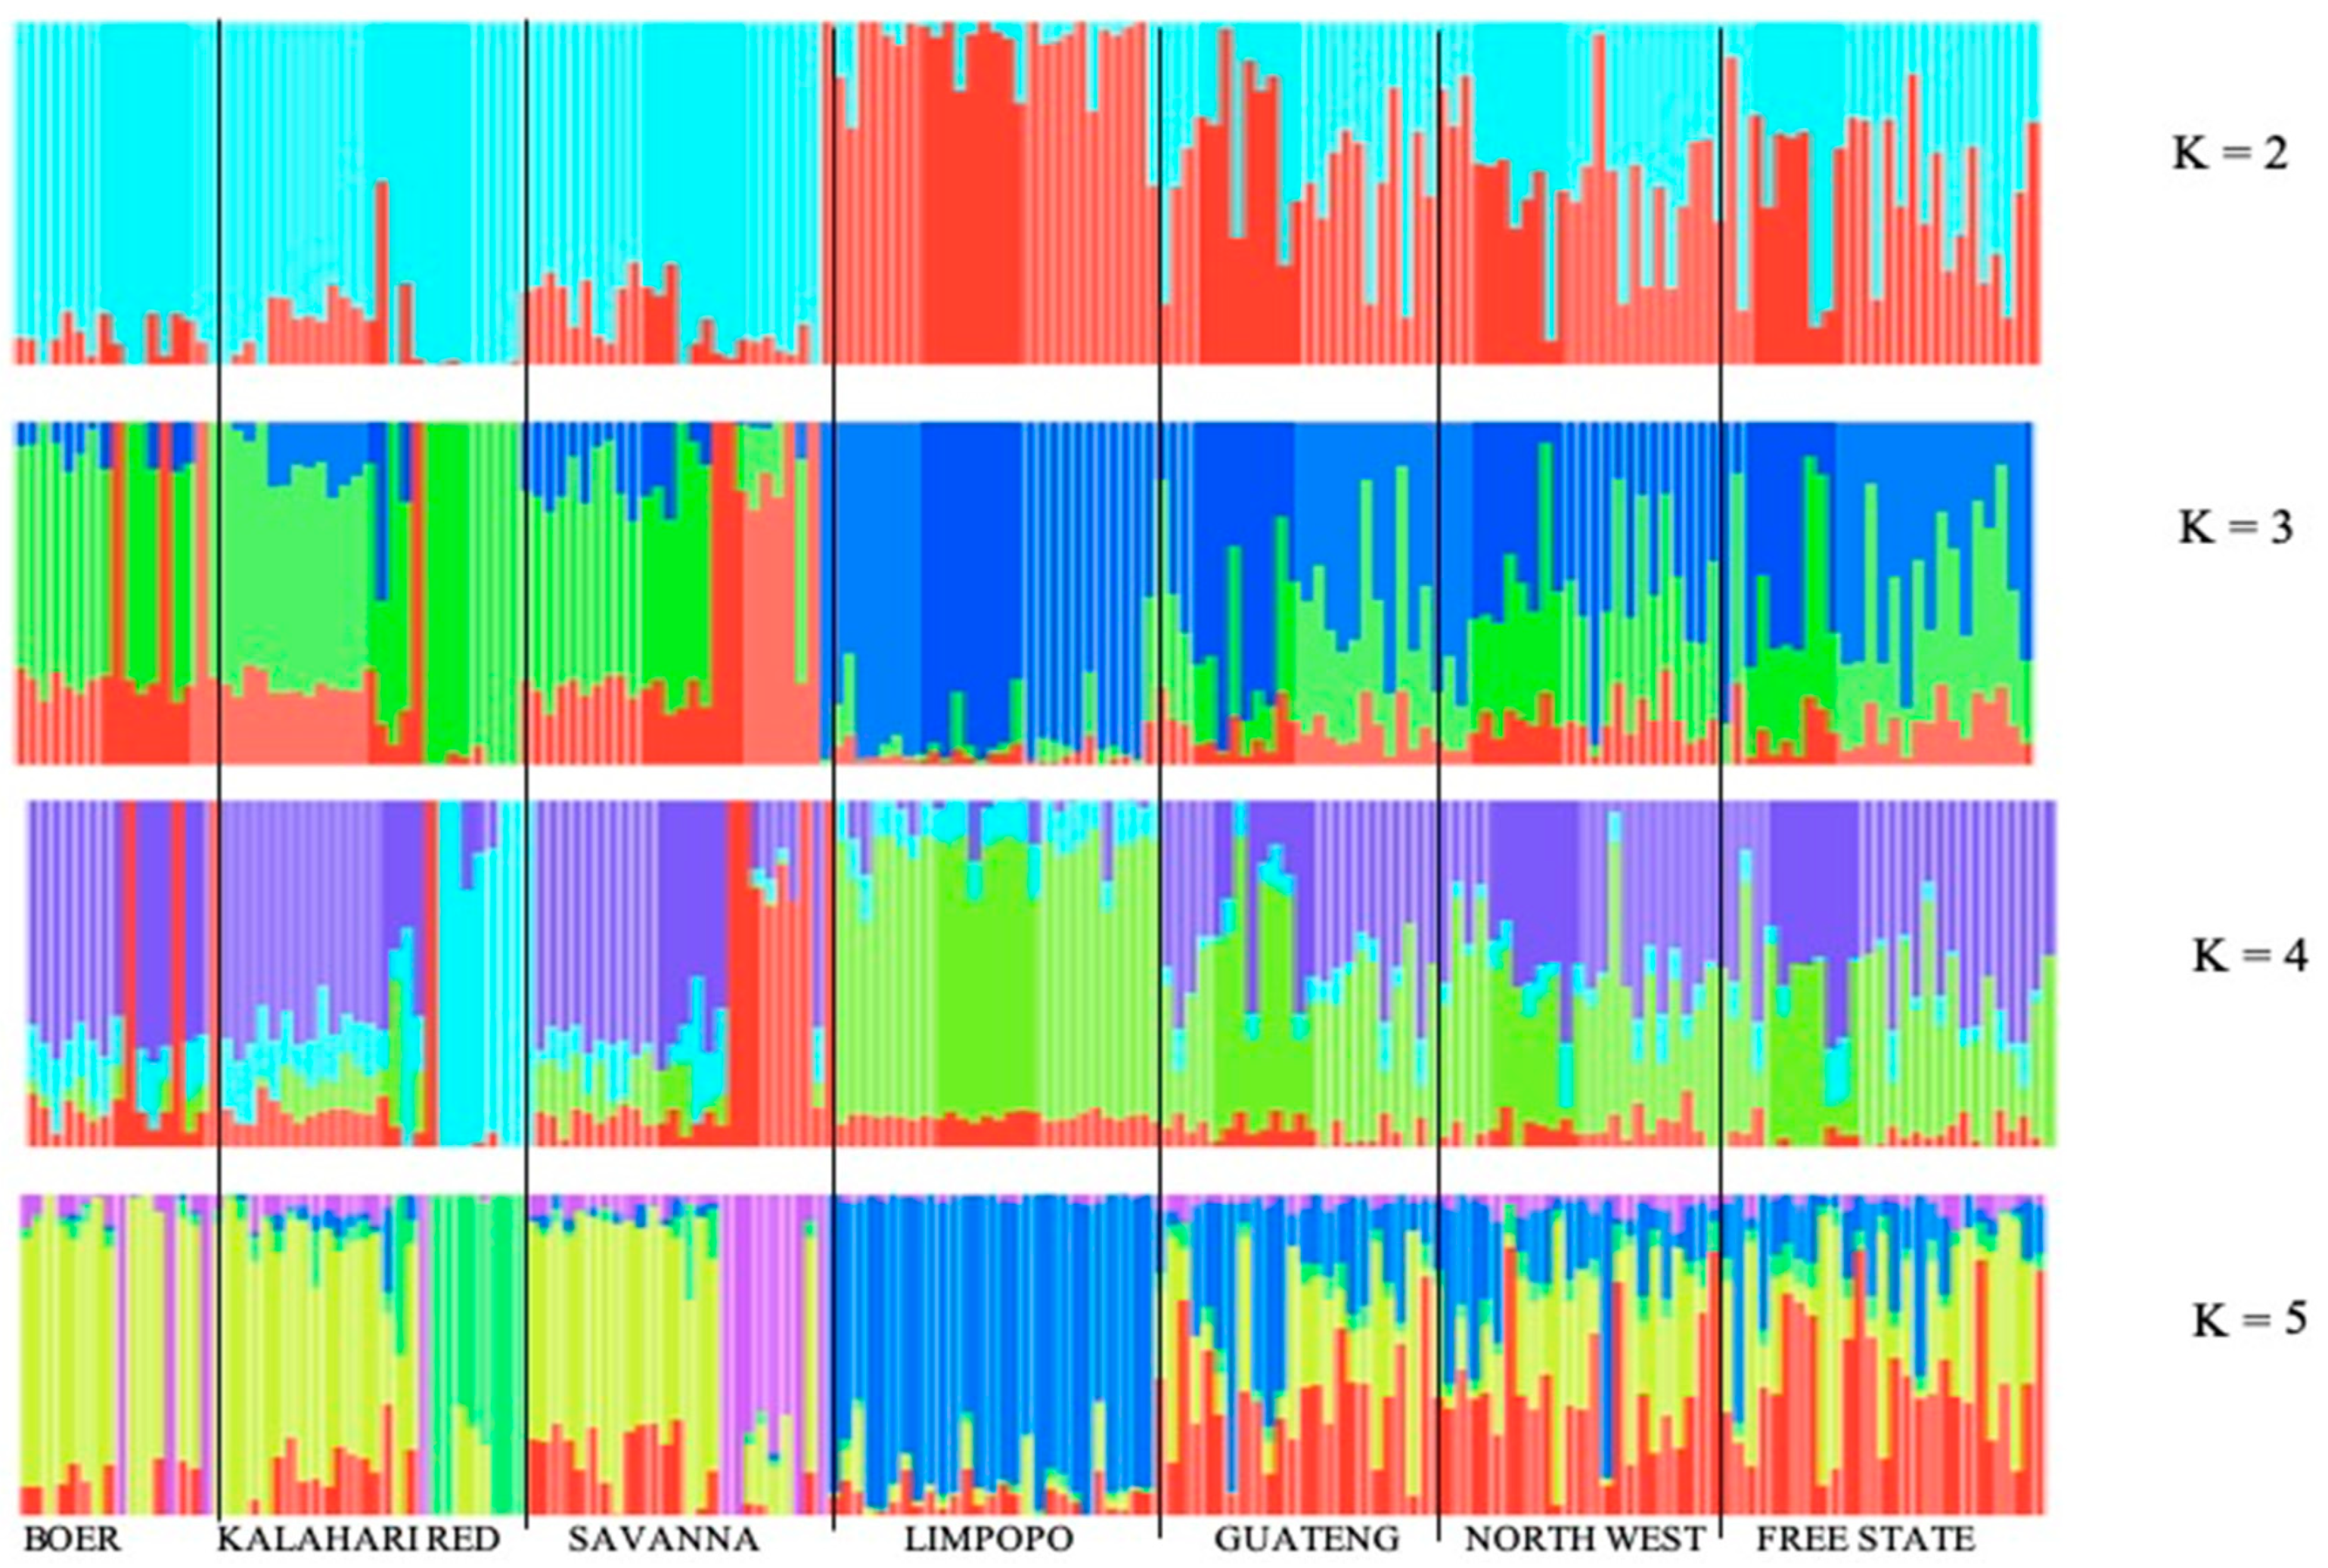
3.2. Source of Variation and Population Structure

Analysis of AMOVA revealed variations of 3.39% (p < 0.0001) and 90.64% among and within populations, respectively (Table 1).
The PCA of the Communal indigenous goat and commercial goat populations is presented in Figure 3. The analysis ignores population membership, but reveals clear population structures as samples from the same population cluster together. The first two PCs, separated Limpopo population (Cluster 1), and Cluster 2, consisting of Gauteng, Free State, and North West populations, whilst Cluster 3, Cluster 4, and Cluster 5 consisted of commercial goat populations. Additionally, outliers were evident for the Cluster 2 populations in Cluster 3. The Communal indigenous goat populations provided weak sub-structuring with an overlap of populations from Free State, Gauteng, and North West.
In Figure 4, ADMIXTURE was used to further understand the degree of admixture in the populations and increased K from 2 to 5, where K is the assumed number of ancestral populations. K = 2, Limpopo separated and a subset of Kalahari Red was revealed. K = 3 revealed two sub-groups of the Savanna goats and Boer that shared genetic background with the Savanna. The analysis suggested K = 3 (CV error = 0.65048) as the most likely number of genetically distinct groups, reflecting three genetic backgrounds (Figure 5). At K = 4, communal indigenous goat populations from Gauteng, Free State, and North West showed clear evidence of genetic heterogeneity, with shared genome ancestry with other populations. Increasing values of K to 5 indicated higher levels of breed homogeneity in the Limpopo population, shown as Cluster 1 of PCA (Figure 4). Increasing K beyond 5 did not reveal any new distinct clusters or patterns.
The pairwise mean FST supports the population relationships based on PCA and ADMIXTURE. High FST (FST = 0.084) was shown between the Limpopo population and commercial goat populations (Boer, Kalahari Red, and Savanna). A low FST value (range 0 to 0.038) within the Communal indigenous goat populations was found, indicating a low genetic differentiation between these populations as shown in Figure 6 and additional file 1, Table S2.

3.3. Candidate Genes under Selection

A total of 442 differentiated SNPs with an FST threshold ≥0.47 were considered to be under selection. The distribution of FST across all chromosomes is shown in Figure 7. Outlier SNPs were found across all chromosomes with varying numbers. In general, bigger chromosomes had a higher number than the smaller chromosomes. Chromosome 8 had the highest number with 37 SNPs, and chromosomes 28 had 4 SNPs.
Table 2 shows the top ten SNP and additional file 1, Table S1 has the full list of outlier SNPs. The SNP with the highest FST value (FST 0.72) was at chromosome 8 and sits on the UHRF2 gene. The 133 candidate genes (Additional file 1, Table S2) were adjacent to these outlier’s loci that associated significantly with pathways involved in the immune system, thermoregulation, and longevity (additional file 1, Table S3). The other four important genes from the top ten outlier SNPs that were found include with the FST value (FST 0.69) at chromosome 8 which sits on the GLDC gene, FST value (FST 0.68) at chromosome 6 which sits on the NDST3 gene, FST value (FST 0.68; 0.67) at chromosome 13 which sits on the CFAP61 and CUBN genes, respectively.
Outlier detection using principal components (PCs) shows the decay of eigenvalues confirmed to the use of K = 2 as optimal (Figure 8a). The Q-Q plot confirmed the expected uniform distribution of the p-values (Figure 8b). Figure 8c shows a Manhattan plot indicating the outlier SNPs that have been detected based on the expected FDR equal to 10%.
The results show that twenty-five outliers were significant to each PC, however, only 5 could be retained (Table 3). The 5 SNPs were found on chromosomes 10, 15, 20, and 21, and were associated with the PC2. In this study, the gene search did not reveal any genes.

4. Discussion

The ability to adapt to a changing environment is the genetic diversity of indigenous FAnGR, as they provide information to support improvement and conservation efforts. To design genetic improvement and conservation strategies at national and global levels, information on within and between genetic diversity and population structure becomes paramount [38]. In this study, population structure and genetic diversity of communal indigenous goat populations from the goat producing provinces of Free State (FS), Gauteng (GP), Limpopo (LP), and North West (NW) provinces were investigated.
Communal indigenous goat populations are genetically diverse, exclusive, and are adapted to particular production systems, and their value of diversity has been strongly emphasized [33,39]. The overall mean of the minor allele frequency (MAF) was 0.32 ± 0.12 across the communal indigenous goat populations. It has been indicated that the communal indigenous goat populations were more diverse than the commercial goat populations with regards to the observed within-population diversity measures. These results support the findings by [33] on the Communal indigenous goat population, where goat ecotypes of Venda and Zulu showed the maximum number of alleles per locus.
The number of fixed SNPs (MAF = 0.00) varied from five in NW populations to 151 in LP populations. Polymorphic SNPs were high (<90%) for all populations. The mean MAFs were estimated on 49,942 SNPs and 117 (<0.95 call rate) individuals for FS, GP, LP, and NW, respectively, with an overall mean of 0.32 ± 0.12 across the communal indigenous goat populations. The results are comparable to the results from [25], who recorded 43,759 (82.03%) observed for the South African Angora breed and [31] observing the overall proportion of informative SNPs (87.09%). In this study, a level of polymorphic SNPs was at a 95% call rate threshold, which was similar to the study of [33], whilst in [25]’s study, it was a 98% call rate threshold, which was higher for the Angora goat breed. The importance of the differences in the SNP quality control thresholds has to be emphasized, as it has an influence on the resultant proportion of useful SNPs.
Analysis of the distributions of alleles across populations is important for evaluating genetic diversity and population relationships [40]. Allelic richness was identical to allele frequency, implying that there was no bias based on sample size. The low levels of allelic diversity indicate that the communal indigenous goat populations are experiencing low levels of nonrandom mating when bred and not maintaining allelic diversity over the entire populations. The level of allelic diversity in this study was similar to that reported for nine Chinese cashmere goats, but lower than in the Chinese cashmere [40] and Swiss [27,41] goat populations. The high mean number of alleles per locus and expected heterozygosities indicated that the overall gene diversity was high in the population.
A key point to design/update breeding programs and conservation strategies is represented by genomic characterization of the genetic diversity of breeds. Communal indigenous goat populations from the four provinces of FS, GP, LP, and NW have not been comprehensively studied for population structure and diversity, thus genetic characterization of these populations is of paramount importance. Heterozygosity was calculated to determine genetic variation ranging from 0.42 ± 0.09 in NW and 0.39 ± 0.11 in LP. Ref. [6] reported heterozygosity values ranging from 0.387 in Swazi goats and 0.41 in Tswana goats, whilst [33] reported similar values for communal indigenous goat populations. Ref. [23] showed levels of Ho ranging from 0.35 to 0.41 for 14 Italian goat breeds using the same SNP Beadchip, whilst [42] revealed low values in Nubian goat populations (0.338) and high values in (0.413) rangeland goat populations. Management practices that caused breed segregation were reported to be responsible for the low Ho that characterizes the Malawi populations, whereas the high Ho observed for populations in East Africa most likely mirror admixture by cross-breeding [26]. An increase in heterozygosity due to pastoralism and nomadism was frequently reported in sheep [43,44] and is consistent with specific geographical patterns in Iranian goats [45]. These similarities between the studies in heterozygosity values may be attributed to the overlap of geographical locations and the use of population types under similar production environments used. More similarities in HE and Ho in some of the populations may be due to the use of populations/breeds which were previously not used during the development of the 50K SNP panel, as it was noted in other Southern African indigenous goat populations such as the Binga, Chipinge, Matopo, and Shurugwi goat populations of Zimbabwe [46]. This can suggest that these values represent the genetic diversity levels of the communal indigenous goat populations.
In the study, it was shown that populations can be exploited through appropriate breeding strategies to improve productivity, as large within-population variation (90.64%) was observed. It was revealed that the level of the among-population genetic variation was lower than that reported in commercially developed breed populations including Angora with 16.12% [47,48]. This high within-population variation is supported by the population structure analysis. The PC1 and PC2 show the highest level of genetic heterogeneity and weak sub-structuring in the FS, GP, and NW provinces, which might be triggered by continuing crossbreeding with improved breeds to improve their productivity practiced in these regions (farmer communication). Limpopo Communal goat populations and commercial breeds had the highest FST (0.084), while GP populations had a low FST value (range 0 to 0.038). Indigenous breeds in the Southern African regions have shown high genetic diversity, but weak population sub-structuring [10]. The highest genetic distance (FST) was observed to be higher than 0.25, moderate to between 0.05 and 0.25, and the lowest estimate below 0.05 when microsatellite markers were used [42]. Many authors in sheep studies for genetic distance among most of the populations recorded FST values (0.101), (0.042) and almost negligible (<0.05) and/or moderate (0.05 < FST < 0.25) [49,50]. Significant genetic distance estimates among populations was revealed by some of the authors. Among the goat populations, there is relatively low to moderate genetic sub-differentiation. An indication of significant differentiation among populations is considered to be a fixation index (FST) of about 0.15 [42].
The commercial goats from different geographical areas and breeding backgrounds provided stronger sub-structuring. According to [33], samples were taken from a farm with closed populations of Savanna and Kalahari Red in Griquastad, Northern Cape, and these populations were used as reference populations. The Kalahari Red and Savanna populations that were found to be kept in commercial farms, corporations, and research stations showed levels of admixture. In shaping the differentiation of breeds, isolation by geographical distance can play an important role, however, in the populations under study, management and breeding strategies seemed to have more effect. The PCA, ADMIXTURE, and pairwise FST results are in agreement, thus emphasizing the exclusive genetic diversity and clustering populations according to the breed type and production system of communal indigenous goat population of Limpopo.
Searching for genomic regions that show high levels of differentiation between populations or by looking for regions of low genetic diversity within a population is possible by detection of signatures of selection from genotype data [51]. In this study, 442 and 5 SNPs based on the FST and PC analysis, respectively, were identified. The 5 SNPs were related to PC2, which showed communal indigenous goat population of Limpopo as having a unique genetic background. The SNP with the highest FST value (FST 0.72) was identified to be at chromosome 8 and sits on the UHRF2 gene. Ref. [52] reported that selected genes in other studies on sheep were mostly enriched in biological processes, including metabolic processes, regulation of biological processes, developmental processes, and reproductive processes. An additional four important genes from the top ten outlier SNPs were discovered with the FST value (FST 0.69) at chromosome 8 sits on the GLDC gene, FST value (FST 0.68) at chromosome 6 sits on the NDST3 gene, and FST value (FST 0.68; 0.67) at chromosome 13 sits on the CFAP61 and CUBN gene, respectively. The candidate genes found in this study were involved in pathways involved in metabolism, disease response, thermoregulation, and longevity. In other studies that investigated coat color, Ref .[51] detected regions on chromosomes 5, 13, and 18 in the black vs. white comparison, regions on chromosomes 5, 9, and 13 in the white vs. black and red comparison, and regions on chromosomes 8, 22, and 29 in the red vs. white comparison. Analysis of the data by [51] for the three groups of solid coat colors detected signatures of selection near at least five genes that are known to be involved in the color and pattern definition of the coat: ADAMTS20, MC1R, ASIP, SOX18, and TIMP3. Two of these genes (MC1R and SOX18) were specifically detected in the comparison between solid black and solid white individuals, whereas the remaining three were identified in both solid black vs. solid white and solid black and red vs. solid white groups.
The 133 candidate genes were adjacent to the outlier’s loci that associated significantly with pathways involved in the immune system, thermoregulation, and longevity. In the study, chromosome 8 had the highest number with 37 SNPs, and chromosomes 28 had 4 SNPs. The results show that twenty-five outliers were significant to each PC, however, only 5 could be retained, which were found on chromosomes 10, 15, 20, and 21, and were associated with the PC2, while the gene search did not reveal any genes. Ref. [53] has emphasized that studying differences in different genes could elucidate the underlying genetics of the differences between Sudanese goat breeds in regard to bone formation and body measurement characteristics, which is applicable to the South African communal indigenous goat populations. Significant roles in the processes of oocyte maturation, regulation of follicular growth, and ovulation in livestock is played by other enriched pathways, such as bile secretion (hsa04976), retrograde endocannabinoid signaling (hsa04723), the hippo signaling pathway (hsa04390), the oxytocin signaling pathway (hsa04921), and ovarian steroidogenesis (hsa04913) [50].
Genetic diversity observed between these communal indigenous goat populations with more attention on Limpopo populations provide a unique opportunity to conserve the population. The study confirms the observation that communal indigenous goat populations kept closer to the metropolitan cities have different production values, and therefore market seems to be more of a breeding factor for GP communal indigenous goat population. Crossbreeding with commercial goat populations, especially the use of the dominant Boer goat bucks, was in evidence. The impact of crossbreeding if not given attention by policy makers will have a negative impact on the genetic diversity of the communal indigenous goat populations and to their genetic merit, and thus conservation programs will be affected.

5. Conclusions

The communal indigenous goat populations showed a weak sub-structuring with admixed individuals with evidence of gene flow and shared genome ancestry with commercial goat populations, while the Limpopo population separated to form its own cluster. Further research is required to identify the genomic regions which are associated with different important environmental adaptation and economical traits in communal indigenous goat populations using the recent updated Illumina Goat 50K SNP BeadChip in other goat producing provinces of South Africa. The patterns of genetic diversity and population structure showed that effective management and utilization of South African communal indigenous goat populations is important, and effort should be made to maintain these unique genetic resources for conservation.

Supplementary Materials

The following are available online at https://www.mdpi.com/2071-1050/12/24/10361/s1. Additional file 1: Table S1. Per Marker FST of Limpopo versus Commercial goat populations Boer, Kalahari, and Savanna. Table S2. Genes and gene descriptions harboring SNPs with FST > 0.47. Table S3: KEGG Pathways for FST analysis Limpopo populations versus Commercial goat populations.

Author Contributions

T.C.C., K.M.-H., B.M., conceptualised and planned the study. T.C.C., T.M. (Tumudi Mphahlele), T.M. (Tlou Matelele), T.J.M., conducted the experiment. T.C.C., drafted the manuscript. T.C.C., K.M.-H., F.M., E.D., K.N., B.M., analyzed the data. B.M., K.M.-H., F.M., supervised the study. All authors have read and agreed to the published version of the manuscript.

Funding

Research grants from the Department of Agriculture, Land Reform and Rural Development’s Directorate Genetic Resources and Directorate Policy Research and Support funded the fieldwork data used for this paper from the project “Characterisation of indigenous goats” as well as full genome sequences of indigenous goats. The first author would like to acknowledge support by the University of Limpopo for allowing him to be their Ph.D. student.

Acknowledgments

The authors are indebted to Jullian Jaftha and Noluthando Netnou-Nkoana from the Department of Agriculture, Land Reform and Rural Development, and the research staff of the Agricultural Research Council, Biotechnology Platform for logistical support and assistance during the laboratory work.

Conflicts of Interest

The authors declare that they have no conflict of interest.

Compliance with Ethical Standards

Permission for the study and ethical approval was obtained from the Animal Research Ethics Committee of both the University of Limpopo and the Department of Agriculture, Land Reform and Rural Development. Furthermore, verbal consent was given by the goat owners.

References

  1. Department of Agriculture, Forestry and Fisheries (DAFF). Newsletter: Livestock Statistics, Estimated Livestock Numbers in RSA. 2014. Available online: http://www.daff.gov.za/daffweb3/Resource-Centre (accessed on 13 June 2018).
  2. Matshaba, B.; Schwalbach, L.M.; Mphaphathi, M.; Nemes, C.; Ngwane, C.; Greyling, J.P.; Váradi, É.; Nedambale, T.L. Characterization of semen from the unimproved South African indigenous goats. In Proceedings of the Second RUFORUM Biennial Meeting, Entebbe, Uganda, 20–24 September 2010. [Google Scholar]
  3. Chokoe, T.C.; Matelele, T.C.; Maqhashu, A.; Ramukhithi, F.V.; Mphahlele, T.D.; Mpofu, T.J.; Nephawe, K.A.; Mtileni, B. Phenotypic Diversity of South African Indigenous Goat Population in Selected Rural Areas. Am. J. Anim. Vet. Sci. 2020, 15, 59–66. [Google Scholar] [CrossRef]
  4. Gwaze, F.R.; Chimonyo, M.; Dzama, K. Communal goat production in Southern Africa: A review. Trop. Anim. Health Prod. 2009, 41, 1157–1168. [Google Scholar] [CrossRef] [PubMed]
  5. Mahanjana, A.M.; Cronjé, P.B. Factors affecting goat production in a communal farming system in the Eastern Cape region of South Africa. S. Afr. J. Anim. Sci. 2000, 30, 149–154. [Google Scholar] [CrossRef] [Green Version]
  6. Monau, P.I.; Raphaka, K.; Zvinorova-Chimboza, P.; Gondwe, T. Sustainable Utilization of Indigenous Goats in Southern Africa. Diversity 2020, 12, 20. [Google Scholar] [CrossRef] [Green Version]
  7. Mdladla, K.; Dzomba, E.F.; Muchadeyi, F.C. Landscape genomics and pathway analysis to understand genetic adaptation of South African indigenous goat populations. Heredity 2018, 120, 369–378. [Google Scholar] [CrossRef]
  8. Casey, N.; Van Niekerk, W. The Boer goat. I. Origin, adaptability, performance testing, reproduction and milk production. Small Rumin. Res. 1988, 1, 291–302. [Google Scholar] [CrossRef]
  9. Campbell, Q.P. The origin and description of southern Africa’s indigenous goats. S. Afr. J. Anim. Sci. 2003, 4, 18–22. [Google Scholar]
  10. Onzima, R.B.; Upadhyay, M.R.; Doekes, H.P.; Brito, L.F.; Bosse, M.; Kanis, E.; Groenen, M.A.M.; Crooijmans, R.P.M.A. Genome-Wide Characterization of Selection Signatures and Runs of Homozygosity in Ugandan Goat Breeds. Front. Genet. 2018, 9, 318. [Google Scholar] [CrossRef]
  11. Stella, A.; Nicolazzi, E.L.; Van Tassell, C.P.; Rothschild, M.; Colli, L.; Rosen, B.D. AdaptMap: Exploring goat diversity and adaptation. Genet. Sel. Evol. 2018. [Google Scholar] [CrossRef] [Green Version]
  12. Kim, E.; Elbeltagy, A.; Aboul-Naga, A.; Rischkowsky, B.; Sayre, B.; Mwacharo, J.; Rothschild, M. Multiple genomic signatures of selection in goats and sheep indigenous to a hot arid environment. Heredity 2016, 116, 255–264. [Google Scholar] [CrossRef]
  13. Mwacharo, J.M.; Kim, E.-S.; Elbeltagy, A.R.; Aboul-Naga, A.M.; Rischkowsky, B.A.; Rothschild, M.F. Genomic footprints of dryland stress adaptation in Egyptian fat-tail sheep and their divergence from East African and western Asia cohorts. Sci. Rep. 2017, 7, 17647. [Google Scholar] [CrossRef] [PubMed] [Green Version]
  14. Guo, J.; Tao, H.; Li, P.; Li, L.; Zhong, T.; Wang, L. Whole-genome sequencing reveals selection signatures associated with important traits in six goat breeds. Sci. Rep. 2018, 8, 10405. [Google Scholar] [CrossRef] [PubMed] [Green Version]
  15. Tosser-Klopp, G.; Bardou, P.; Bouchez, O.; Cabau, C.; Crooijmans, R.; Dong, Y.; Donnadieu-Tonon, C.; Eggen, A.; Heuven, H.C.; Jamli, S. Design and characterization of a 52K SNP chip for goats. PLoS ONE 2014, 9, e86227. [Google Scholar] [CrossRef] [PubMed]
  16. Zhao, F.; McParland, S.; Kearney, F.; Du, L.; Berry, D.P. Detection of selection signaturesin dairy and beef cattle using high-density genomic information. Genet. Sel. Evol. 2015, 47, 49. [Google Scholar] [CrossRef] [PubMed] [Green Version]
  17. Makina, S.O.; Muchadeyi, F.C.; Marle-Kster, E.; Taylor, J.F.; Makgahlela, M.L.; Maiwashe, A. Genome-wide scan for selection signatures in six cattle breeds in South Africa. Genet. Sel. Evol. 2015, 47, 92. [Google Scholar] [CrossRef] [PubMed] [Green Version]
  18. Moradi, M.H.; Nejati-Javaremi, A.; Moradi-Shahrbabak, M.; Dodds, K.G.; McEwan, J.C. Genomic scan of selective sweeps in thin and fat tail sheep breeds for identifying of candidate regions associated with fat deposition. BMC Genom. 2012, 13, 10. [Google Scholar] [CrossRef] [PubMed] [Green Version]
  19. McRae, K.M.; McEwan, J.C.; Dodds, K.G.; Gemmell, N.J. Signatures of selection in sheep bred for resistance or susceptibility to gastrointestinal nematodes. BMC Genom. 2014, 15, 637. [Google Scholar] [CrossRef] [Green Version]
  20. Stainton, J.J.; Haley, C.S.; Charlesworth, B.; Kranis, A.; Watson, K.; Wiener, P. Detecting signatures of selection in nine distinct lines of broiler chickens. Anim. Genet. 2015, 46, 37–49. [Google Scholar] [CrossRef]
  21. Ai, H.; Huang, L.; Ren, J. Genetic diversity, linkage disequilibrium and selection signatures in Chinese and Western pigs revealed by genome-wide SNP markers. PLoS ONE 2013, 8, e56001. [Google Scholar] [CrossRef] [Green Version]
  22. Ai, H.; Yang, B.; Li, J.; Xie, X.; Chen, H.; Ren, J. Population history and genomic signaturesfor high-altitude adaptation in Tibetan pigs. BMC Genom. 2014, 15, 834. [Google Scholar] [CrossRef] [Green Version]
  23. Nicoloso, L.; Bomba, L.; Colli, L.; Negrini, R.; Milanesi, M.; Mazza, R.; Sechi, T.; Frattini, S.; Talenti, A.; Coizet, B. Genetic diversity of Italian goat breeds assessed with a medium-density SNP chip. Genet. Sel. Evol. 2015, 47, 62. [Google Scholar] [CrossRef] [PubMed]
  24. Benjelloun, B.; Alberto, F.J.; Streeter, I.; Boyer, F.; Coissac, E.; Stucki, S. Characterizing neutral genomic diversity and selection signatures in indigenous populations of moroccan goats (Capra hircus) using WGS data. Front. Genet. 2015, 6, 107. [Google Scholar] [CrossRef]
  25. Lashmar, S.; Visser, C.; van Marle-Köster, E. Validation of the 50k Illumina goat SNP chip in the South African Angora goat. S. Afr. J. Anim. Sci. 2015, 45, 56–59. [Google Scholar] [CrossRef] [Green Version]
  26. Colli, L.; Milanesi, M.; Talenti, A.; Bertolini, F.; Chen, M.; Chen, M.; Crisa, A.; Daly, K.G.; Del Covo, M.; Guldbrandtsen, B.; et al. Genome-wide SNP profiling of worldwide goat populations reveals strong partitioning of diversity and highlights post-domestication migration routes. Genet. Sel. Evol. 2018, 50, 58. [Google Scholar] [CrossRef] [PubMed] [Green Version]
  27. Glowatzki-Mullis, M.L.; Muntwyler, J.; Baumle, E.; Gaillard, C. Genetic diversity measures of Swiss goat breeds as decision-making support for conservation policy. Small Rumin. Res. 2008, 74, 202–211. [Google Scholar] [CrossRef]
  28. Ağaoağlu, O.K.; Ertuğrul, O. Assessment of genetic diversity, genetic relationship and bottleneck using microsatellites in some native Turkish goat breeds. Small Rumin. Res. 2012, 105, 53–60. [Google Scholar] [CrossRef]
  29. Mukhongo, D.M.; Mwai, O.; Tapio, M.; Muigai, A. Genetic diversity and population structure of the indigenous sheep in Kenya based on microsatellite analysis: Implications for their conservation. J. Livest. Sci. 2014, 5, 65–78. [Google Scholar]
  30. Xu, S.-S.; Gao, L.; Xie, X.-L.; Ren, Y.-L.; Shen, Z.-Q.; Wang, F.; Shen, M.; Eyϸórsdóttir, E.; Hallsson, J.H.; Kiseleva, T. Genome-Wide Association Analyses Highlight the Potential for Different Genetic Mechanisms for Litter Size Among Sheep Breeds. Front. Genet. 2018, 9, 118. [Google Scholar] [CrossRef]
  31. Mdladla, K.; Dzomba, E.F.; Muchadeyi, F.C. Characterization of the village goat production systems in the rural communities of the Eastern Cape, KwaZulu-Natal, Limpopo and North West Provinces of South Africa. Trop. Anim. Health Prod. 2017, 49, 515–527. [Google Scholar] [CrossRef]
  32. Purcell, S.; Neale, B.; Todd-Brown, K.; Thomas, L.; Ferreira, M.A.; Bender, D.; Maller, J.; Sklar, P.; De Bakker, P.I.; Daly, M.J. PLINK: A tool set for whole-genome association and population-based linkage analyses. Am. J. Hum. Genet. 2007, 81, 559–575. [Google Scholar] [CrossRef] [Green Version]
  33. Mdladla, K. Landscape Genomic Approach to Investigate Genetic Adaptation in South African Indigenous Goat Populations. Ph.D. Thesis, University of Kwa-Zulu Natal, Durban, South Africa, 2016. [Google Scholar]
  34. Weir, B.S.; Cockerham, C.C. Estimating F-statistics for the analysis of population structure. Evolution 1984, 38, 1358–1370. [Google Scholar] [PubMed]
  35. Alexander, D.H.; Novembre, J.; Lange, K. Fast model-based estimation of ancestry inunrelated individuals. Genet. Res. 2009, 19, 1655–1664. [Google Scholar] [CrossRef] [PubMed] [Green Version]
  36. Buchmann, R.; Hazelhurst, S. Genesis Manual; University of the Witwatersrand: Johannesburg, South Africa, 2014. [Google Scholar]
  37. Luu, K.; Bazin, E.; Blum, M.G.B. pcadapt: An R package to perform genome scans for selection based on principal component analysis. Mol. Ecol. Res. 2017, 17, 67–77. [Google Scholar] [CrossRef] [PubMed]
  38. Tittensor, D.P.; Walpole, M.; Hill, S.L.L.; Boyce, D.G.; Britten, G.L.; Burgess, N.D. A mid-term analysis of progress toward international biodiversity targets. Science 2014, 346, 241–244. [Google Scholar] [CrossRef]
  39. Morrison, J.W. A guide to the Identification of the Natural Indigenous Goats of Southern Africa. 2007. Available online: http://www.landbou.com/wp.../03/f2297405-a93f-4399-bdb7-6f3de538d75d.pdf (accessed on 20 April 2018).
  40. Kalinowski, S.T. Counting alleles with rarefaction: Private alleles and hierarchical sampling designs. Conserv. Genet. 2004, 5, 539–543. [Google Scholar] [CrossRef]
  41. Liu, J.B.; Wang, F.; Lang, X. Analysis of geographic and pairwise distances among chinese cashmere goat populations. Asian Australas. J. Anim. Sci. 2013, 26, 323–333. [Google Scholar] [CrossRef] [Green Version]
  42. Brito, L.F.; Kijas, J.W.; Ventura, R.V.; Sargolzaei, M.; Porto-Neto, L.R.; Cánovas, A. Genetic diversity and signatures of selection in various goat breeds revealed by genome-wide SNP markers. BMC Genom. 2017, 18, 229. [Google Scholar] [CrossRef] [Green Version]
  43. Zhao, Y.X.; Yang, J.; Lv, F.H.; Hu, X.J.; Xie, X.L.; Zhang, M. Genomic reconstruction of the history of native sheep reveals the peopling patterns of nomads and the expansion of early pastoralism in East Asia. Mol. Biol. Evol. 2017, 34, 2380–2395. [Google Scholar] [CrossRef]
  44. Tapio, M.; Ozerov, M.; Tapio, I.; Toro, M.A.; Marzanov, N.; Cinkulov, M. Microsatellite- based genetic diversity and population structure of domestic sheep in northern Eurasia. BMC Genet. 2010, 11, 76. [Google Scholar] [CrossRef] [Green Version]
  45. Vahidi, S.M.F.; Tarang, A.R.; Naqvi, A.N.; Anbaran, M.F.; Boettcher, P.; Joost, S. Investigation of the genetic diversity of domestic Capra hircus breeds reared within an early goat domestication area in Iran. Genet. Sel. Evol. 2014, 46, 27. [Google Scholar] [CrossRef] [Green Version]
  46. Zvinorova, P.I. A Genome-Wide Association Study on Mechanisms Underlying Genetic Resistance to Gastrointestinal Parasites in Goats. Ph.D. Thesis, Stellenbosch University, Stellenbosch, South Africa, 2017. [Google Scholar]
  47. Ozoje, M. Incidence and relative effects of qualitative traits in West African Dwarf goat. Small Rumin. Res. 2002, 43, 97–100. [Google Scholar] [CrossRef]
  48. Pieters, A. Genetic Characterization of Commercial Goat Populations in South Africa. Master’s Thesis, University of Pretoria, Pretoria, South Africa, 2007. [Google Scholar]
  49. Ahmed, Z.; Babar, M.E.; Hussain, T.; Nadeem, A.; Awan, F.I.; Wajid, A.; Ali, M.M. Genetic diversity analysis of Kail sheep by using microsatellite markers. J. Anim. Plant. Sci. 2014, 24, 1329–1333. [Google Scholar]
  50. Yang, J.; Li, W.R.; Lv, F.H.; He, S.G.; Tian, S.L.; Peng, W.F.; Sun, Y.W.; Zhao, Y.X.; Tu, X.L.; Zhang, M. Whole-genome sequencing of native sheep provides insights into rapid adaptations to extreme environments. Mol. Biol. Evol. 2016, 33, 2576–2592. [Google Scholar] [CrossRef] [PubMed] [Green Version]
  51. Bertolini, F.; Servin, B.; Talenti, A.; Rochat, E.; Kim, E.S.; Oget, C.; Palhière, I.; Crisà, A.; Catillo, G.; Steri, R.; et al. Signatures of selection and environmental adaptation across the goat genome post-domestication. Genet. Sel. Evol. 2018, 50, 57. [Google Scholar] [CrossRef]
  52. Islam, R.; Li, Y.; Liu, X.; Berihulay, H.; Abied, A.; Gebreselassie, G.; Ma, Q.; Ma, Y. Genome-Wide Runs of Homozygosity, Effective Population Size, and Detection of Positive Selection Signatures in Six Chinese Goat Breeds. Genes 2019, 10, 938. [Google Scholar] [CrossRef] [Green Version]
  53. Rahmatalla, S.A.; Arends, D.; Reissmann, M.; Ahmed, A.S.; Wimmers, K.; Reyer, H.; Brockmann, G.A. Whole genome population genetics analysis of Sudanese goats identifies regions harboring genes associated with major traits. BMC Genet. 2017, 18, 92. [Google Scholar] [CrossRef] [Green Version]
Figure 1. South African map showing the geographical locations of communal indigenous goat populations.
Sustainability 12 10361 g001
Figure 2. Distribution of minor allele frequencies (MAF) in communal indigenous goat populations.
Sustainability 12 10361 g002
Figure 3. Plot of two principal components showing genetic relationships among the commercial goat populations: Boer, Kalahari Red, and Savanna with the communal indigenous goat populations from Free State, Gauteng, Limpopo, and North West.
Sustainability 12 10361 g003
Figure 4. Population structure plots showing proportions of ancestral populations for each individual for K = 2 to 5.
Sustainability 12 10361 g004
Figure 5. Cross-validation (CV) error for the optimal K value.
Sustainability 12 10361 g005
Figure 6. FST distances for communal indigenous goat populations from Free State, Gauteng, Limpopo, and North West with commercial goat populations.
Sustainability 12 10361 g006
Figure 7. Manhattan plots of the pairwise genome-wide chromosomal FST analysis. Limpopo communal indigenous goat population versus commercial goat population of Boer, Savanna, and Kalahari Red. The significant thresholds (dashed line) are set at the top 1% of the FST distribution.
Sustainability 12 10361 g007
Figure 8. Detection of outlier SNPs using principal components (PCs). (a) shows the screen plot of the PCs; (b) Q-Q plot for the distribution of the p-values; and (c) Manhattan plot for the communal indigenous goat population SNPs.
Sustainability 12 10361 g008aSustainability 12 10361 g008b
Table 1. Analysis of molecular variance analysis using different data sets of commercial goat population.
Source of VariationDegrees of Difference (d.f.)Sum of SquaresVariance ComponentsPercentage of Variation
Among populations180,565.150341.26752 Va3.39
Among population within groups599,867.875185.19042 Vb1.84
Among individuals within populations1821,814,879.906416.85973 Vc4.12
Within populations1891,727,110.0009138.14815 Vd90.64
Table 2. Top ten outlier single nucleotide polymorphisms (SNPs) for the estimated chromosomes and genes using FST.
MarkerCHRPositionFSTGeneGene Description
snp28078-scaffold300-34122128381972940.72UHRF2ubiquitin like with PHD and ring finger domains 2
snp19368-scaffold1958-104157680345380.71-
snp3556-scaffold1110-1061769593650700.70-
snp19366-scaffold1958-28303681103920.69-
snp28077-scaffold300-33698138381548950.69GLDCglycine decarboxylase
snp51703-scaffold760-153052674382690.68NDST3N-deacetylase and N-sulfotransferase 3
snp32526-scaffold371-144367313392305630.68CFAP61cilia and flagella associated protein 61
snp48555-scaffold690-43287761046317670.67-
snp49002-scaffold7-160377213307882220.67CUBNcubilin
snp49005-scaffold7-173901213306529820.66CUBNcubilin
Table 3. Outlier SNPs using principal components.
MarkerChromosomePositionPC
snp2141-scaffold1065-30854510748037202
snp32432-scaffold37-60347515125844992
snp32448-scaffold37-127301615132540402
snp34005-scaffold40-268062220508484702
snp15603-scaffold165-51451021539724192
PC—principal component.
Publisher’s Note: MDPI stays neutral with regard to jurisdictional claims in published maps and institutional affiliations.

