A Comparative Assessment for the Potential Energy Production from PV Installation on Residential Buildings


Abstract
1. Introduction
- −
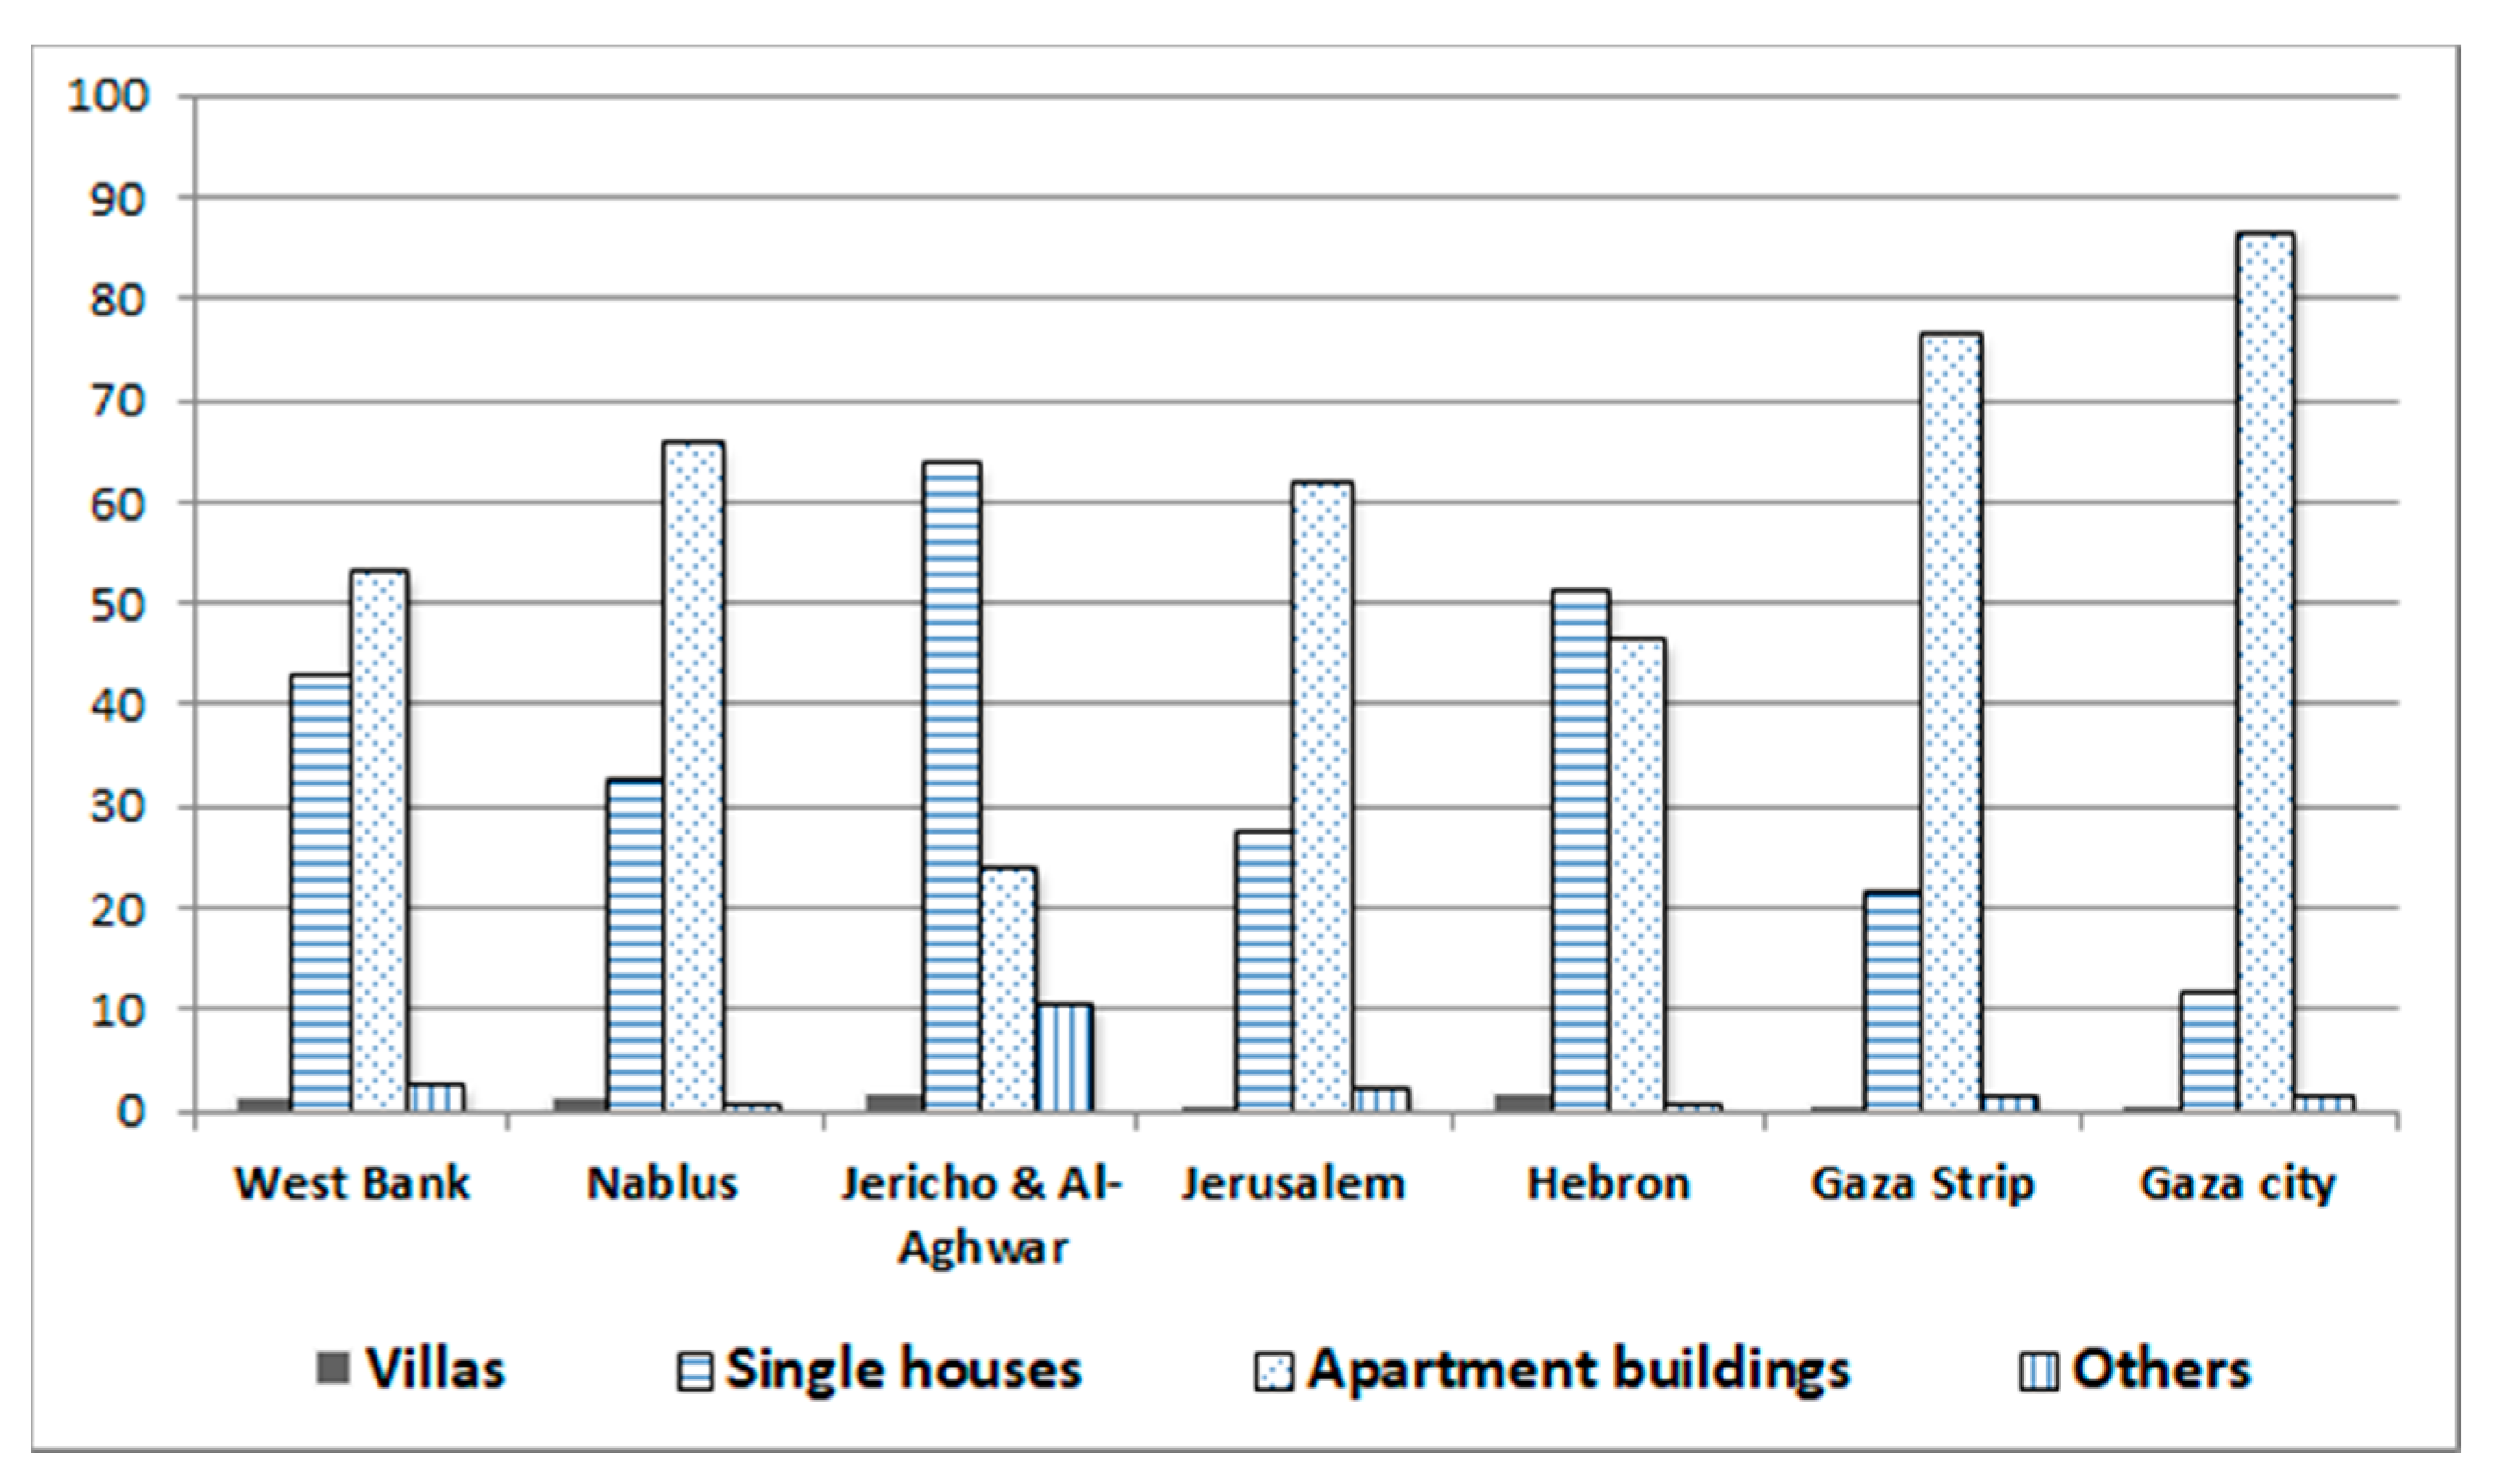
- Building type A: residential buildings for single families consisting of a maximum of two floors intended for single-family use. These buildings are usually located on sorted land plots with an area of 500–800 m2, and the construction percentage is 30% of the land area so that the average roof area in this pattern is 200 m2 including the stair’s roof. This pattern could contain buildings in the form of two common units with a staircase and the roof area reaches 300 m2.
- −
- Building type B: residential buildings for multiple-family apartment buildings. Such buildings consist of 5–7 floors; each floor includes two to four apartments [35]. These buildings are located on sorted land plots with an area of 800–1500 m2 and a construction rate of 50% of the land area is permitted. Thus, the average roof area of this pattern is from 300 to 600 m2 including the stair’s roof.
- −
- Building type C: residential buildings for extended families. Those buildings consist of 4 floors. Each floor consists of one apartment or two. The average area of the sorted land lots is 400–600 m2—and the permitted area of the building is around 49%, which led to an average built area 180 up to 250 m2, including the stair’s roof.
- -
- Most of these buildings tend in their design to regular forms of square or rectangular shapes. The floors are usually distributed as parking in the basement or ground, and residential apartments on the upper floors.
- -
- Each floor consists of one or four apartments, and the building contains one or more vertical access units (staircase) in addition to the elevator and skylights, which are often in B and C patterns [36].
- -
- The roof is concrete slab, normally flat, and has a parapet of 80 cm height.
- -
- The staircase roof is used for water tanks and solar water heating units.
- -
- The residential buildings envelope is not thermally insulated. The glass used for the window is single/double glazing with an aluminum frame. The walls use the typical components of stone, concrete, hollow concrete block, and plaster.
2. Materials and Methods
2.1. Selecting Residential Building Types
2.2. Estimating Electricity Consumption
2.3. Solar PV Simulation
3. Results
3.1. Residential Building Type A
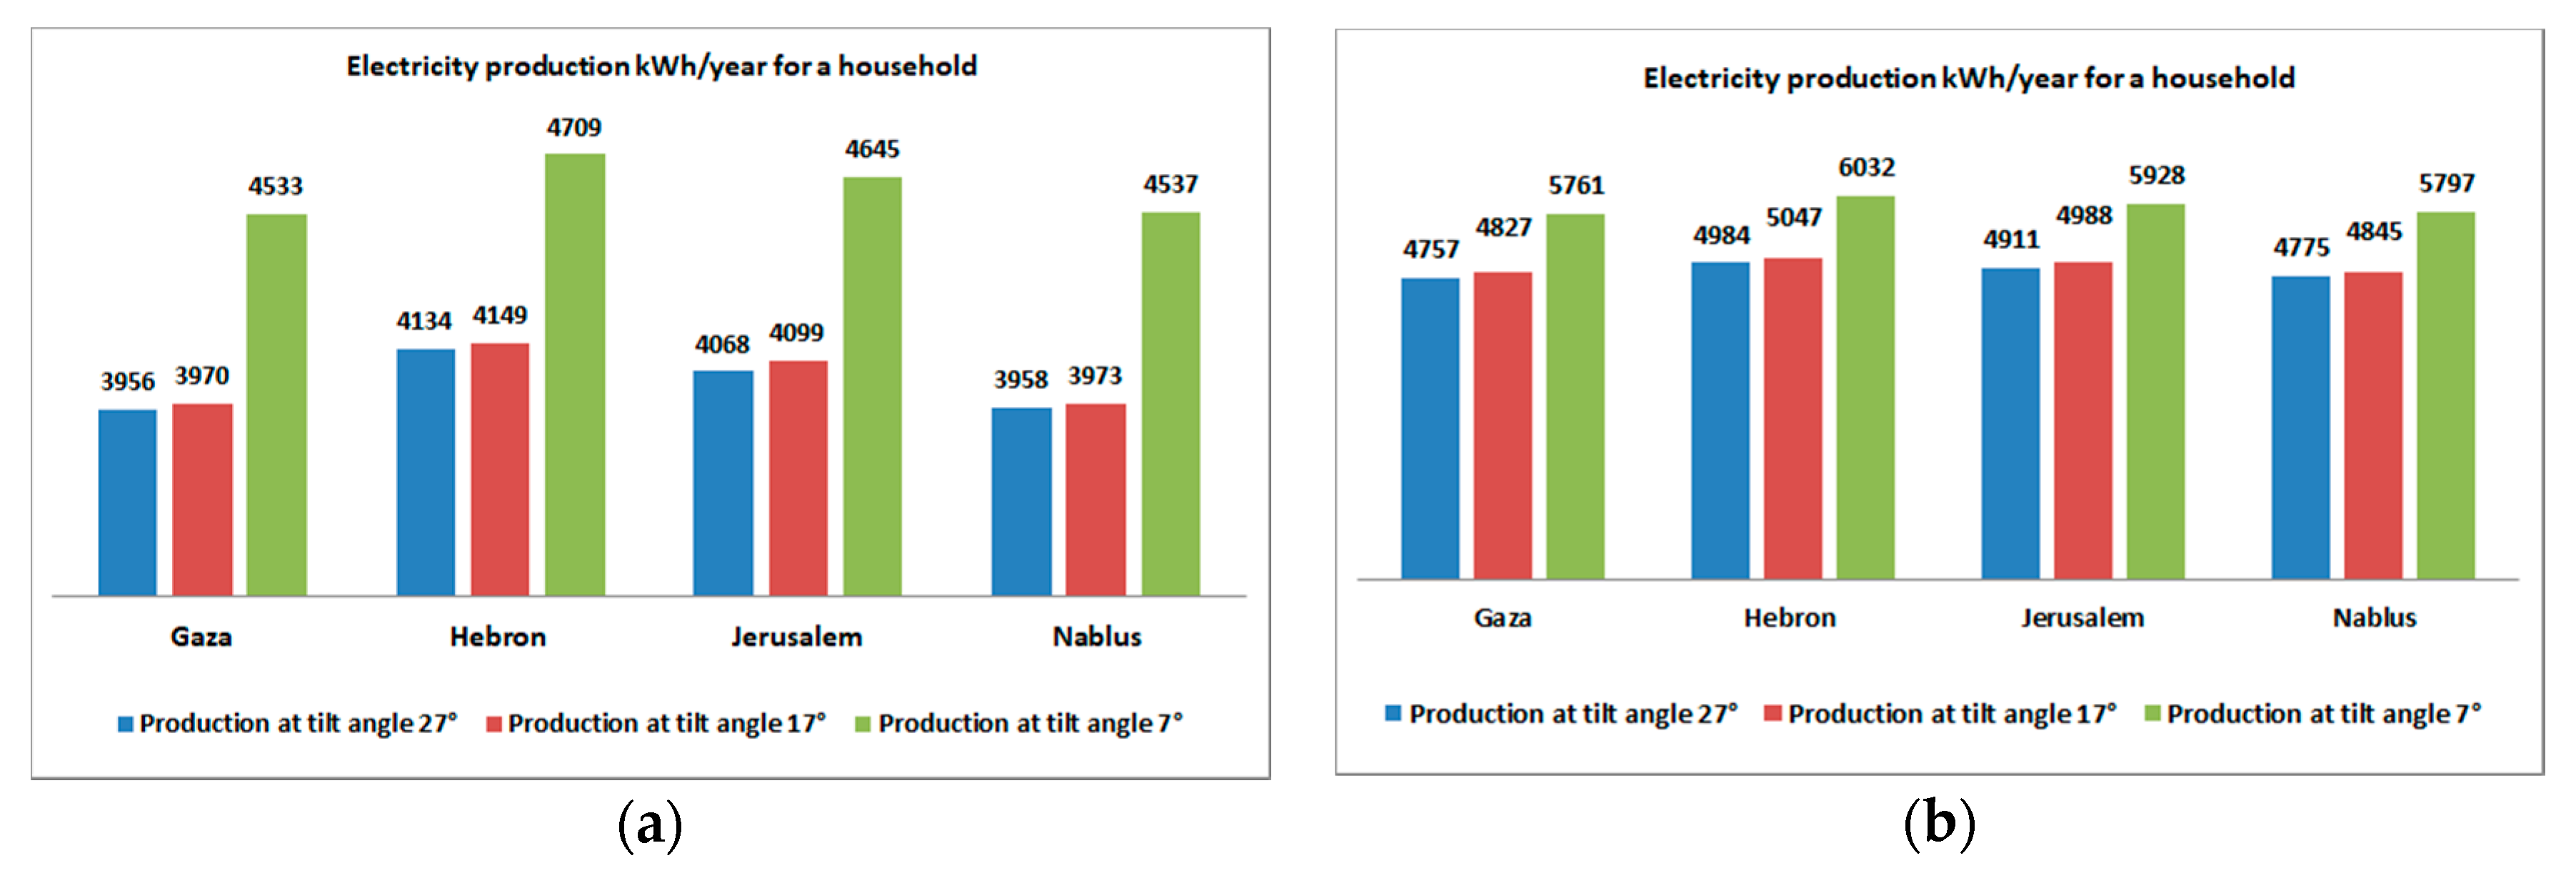
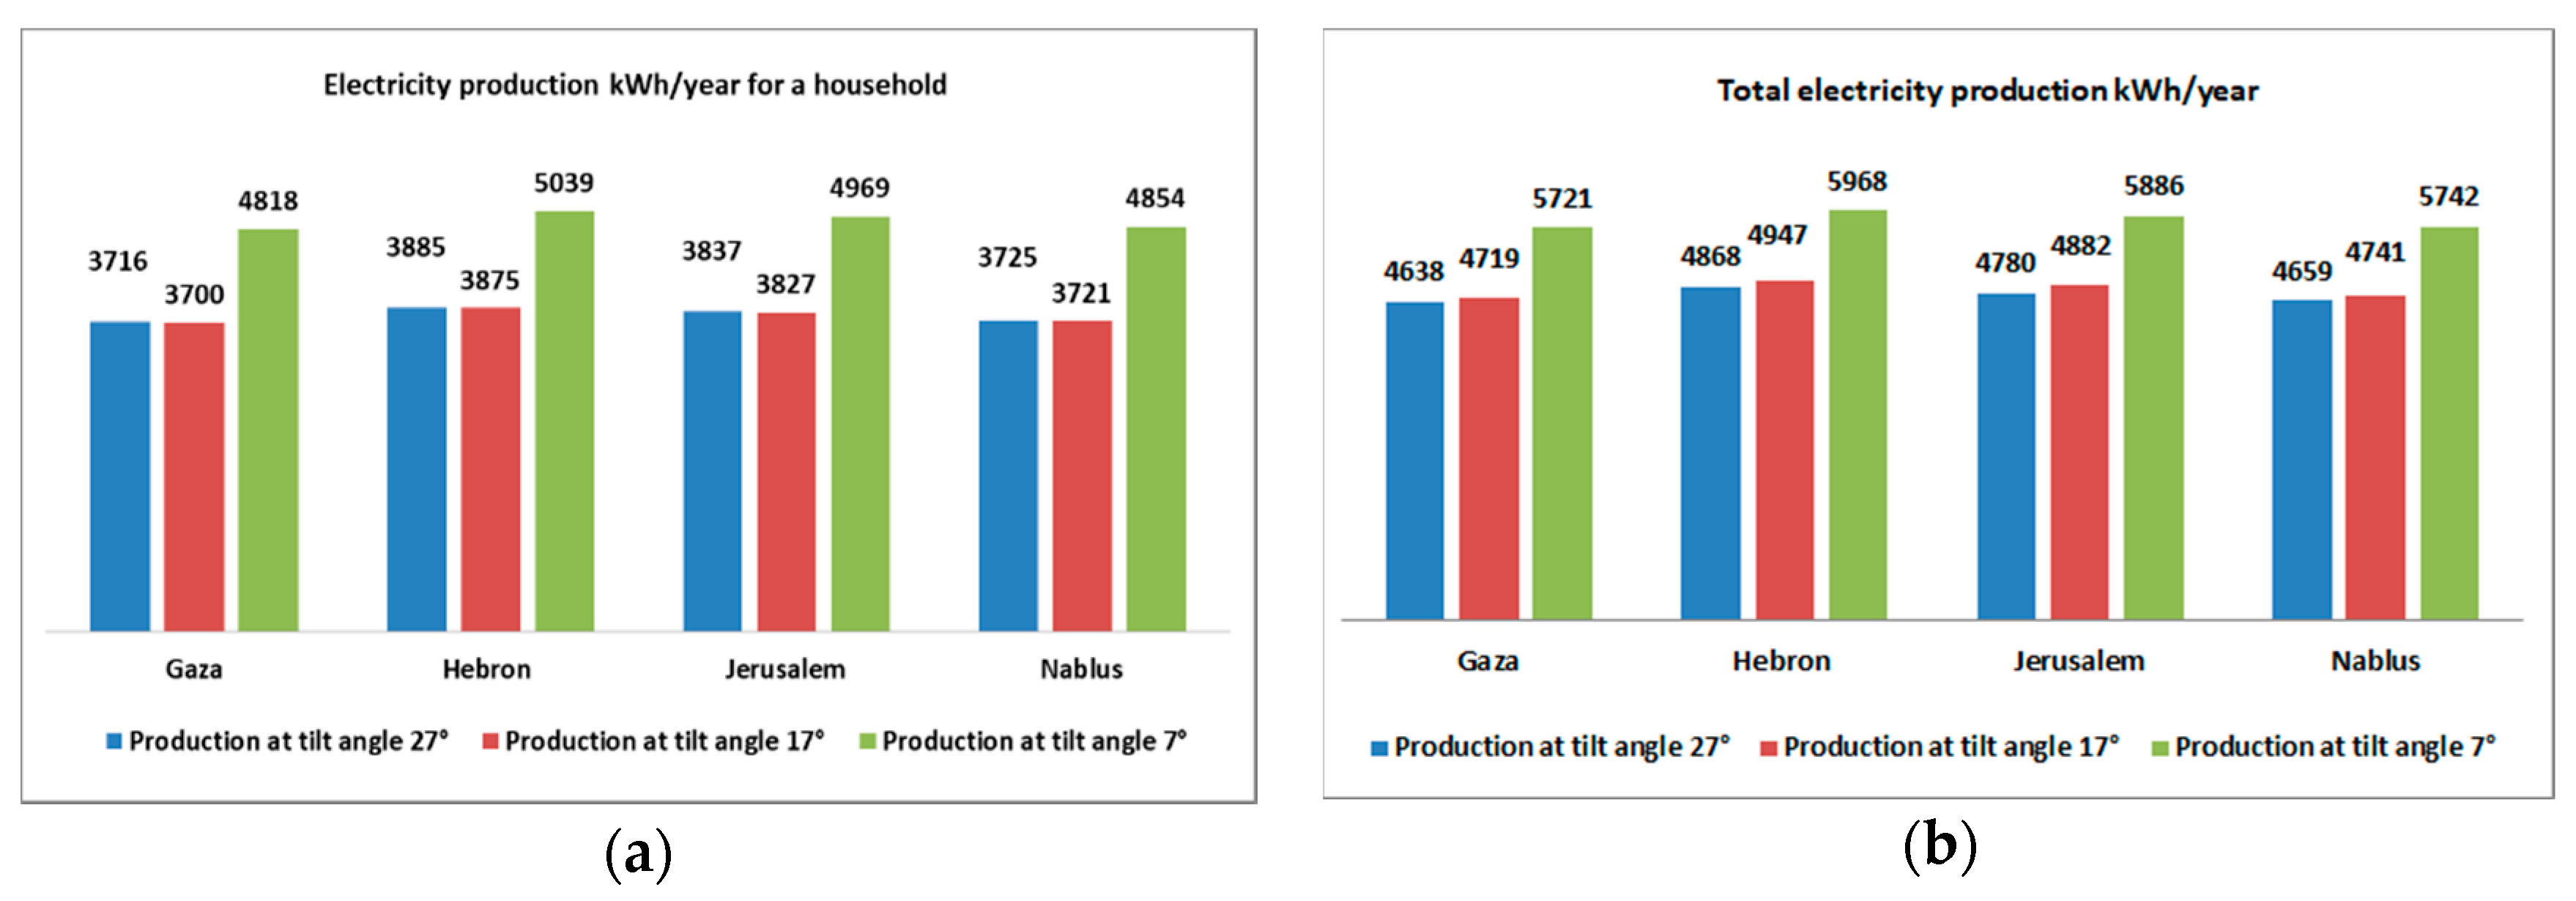
3.2. Residential Building Type B
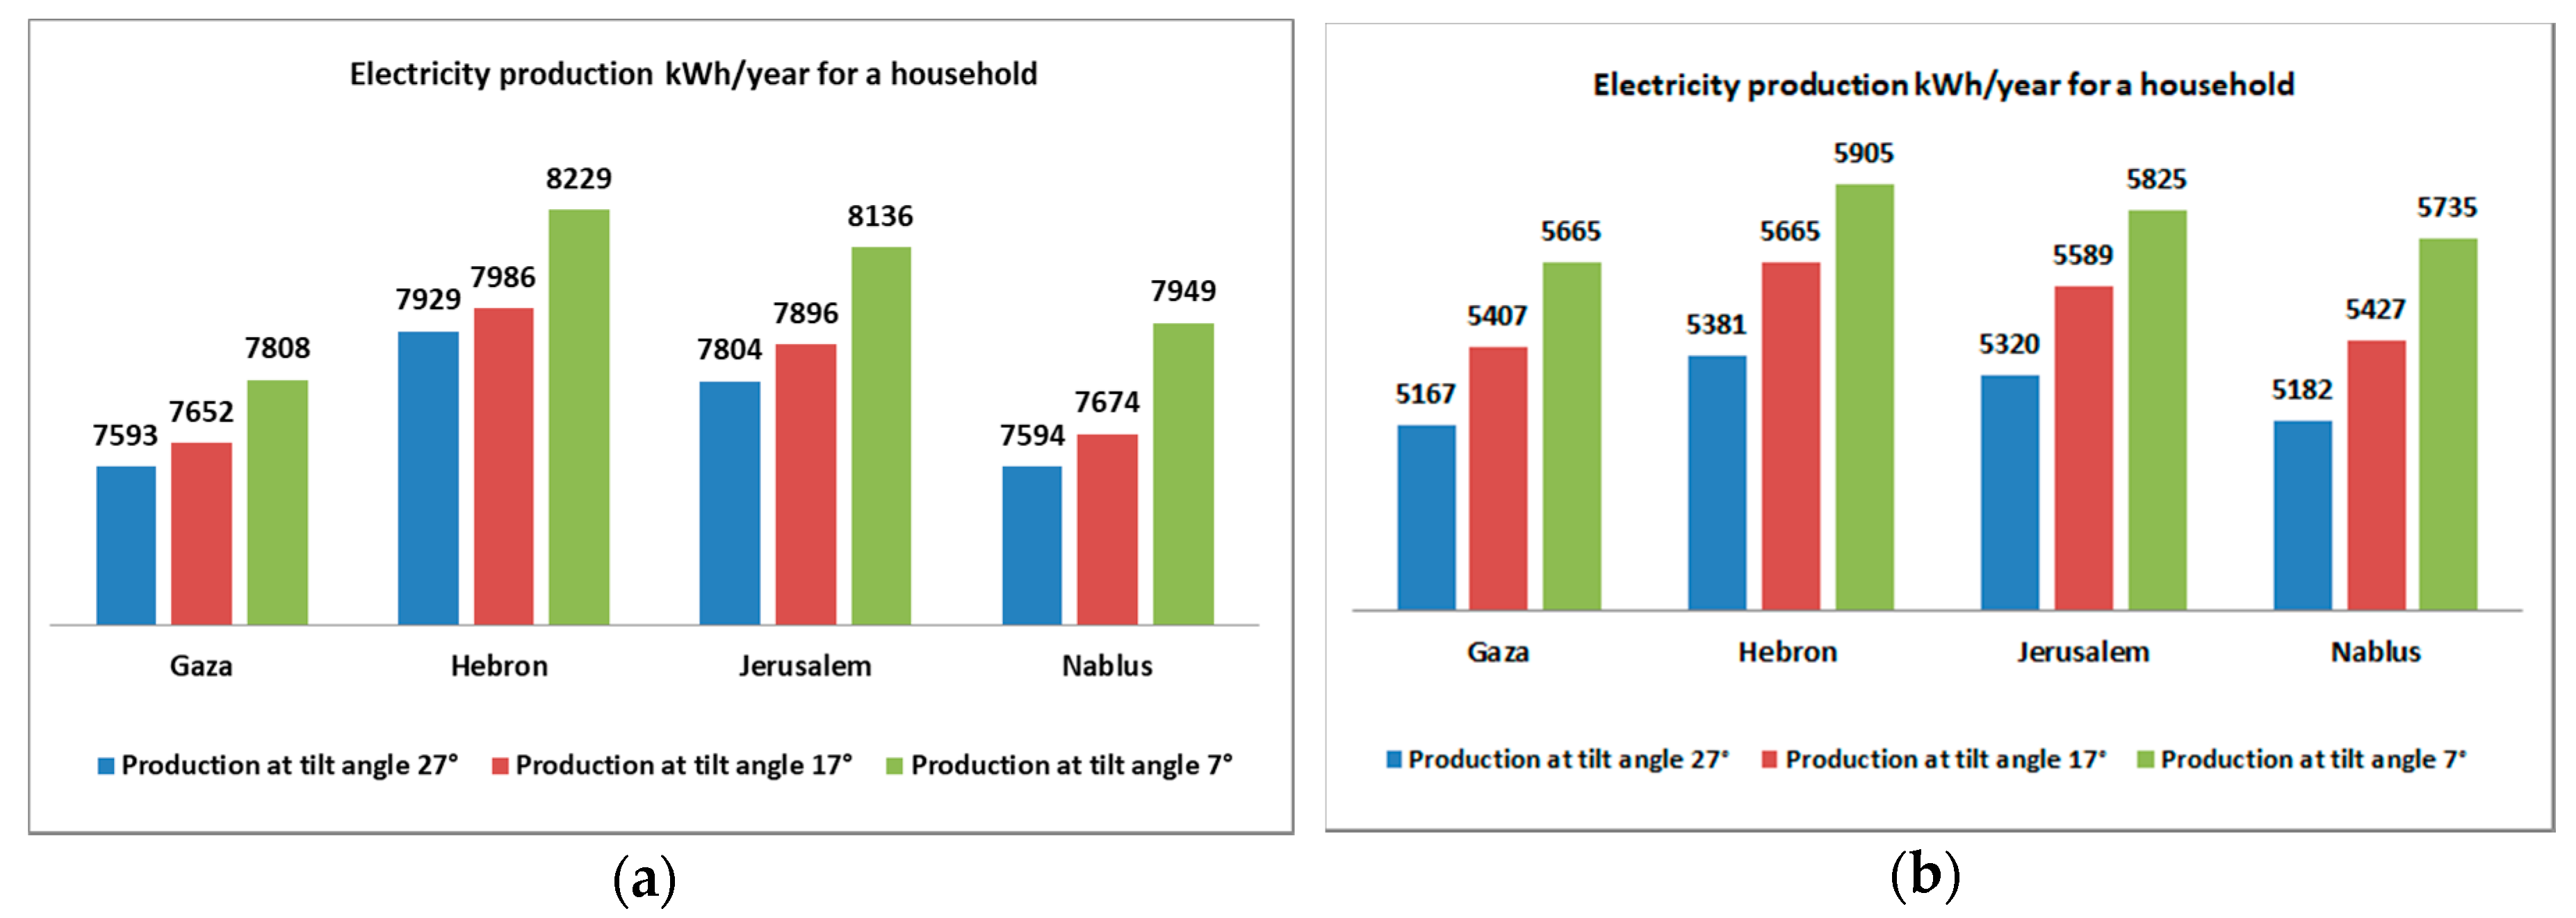
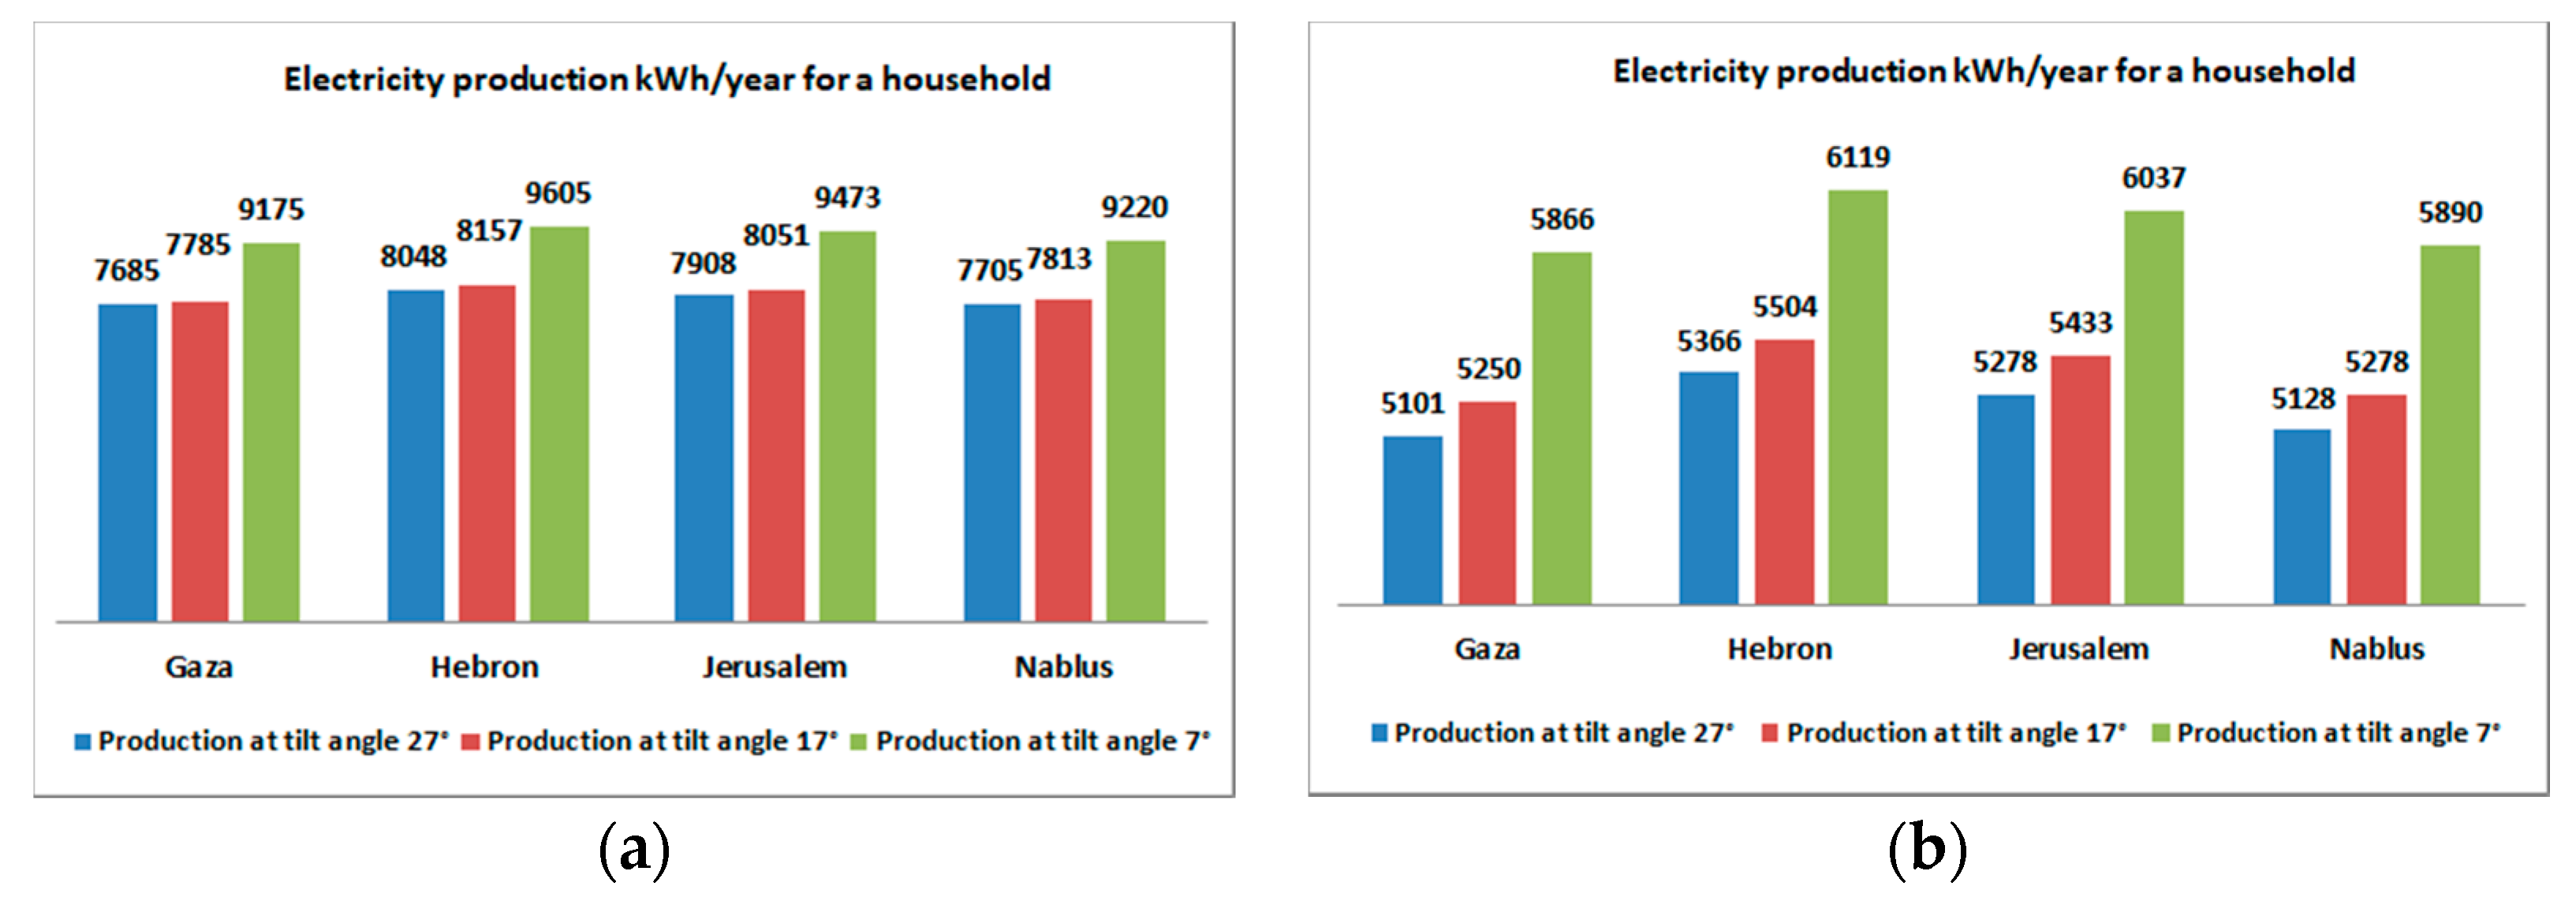
3.3. Residential Building Type C
4. Conclusions
Author Contributions
Funding
Conflicts of Interest
References
- Dehwah, A.H.; Asif, M.; Rahman, M.T. Prospects of PV application in unregulated building rooftops in developing countries: A perspective from Saudi Arabia. Energy Build. 2018, 171, 76–87. [Google Scholar] [CrossRef]
- Vulkan, A.; Kloog, I.; Dorman, M.; Erell, E. Modeling the potential for PV installation in residential buildings in dense urban areas. Energy Build. 2018, 169, 97–109. [Google Scholar] [CrossRef]
- Davies, D.; Ruyssevelt, P.; Munro, D.; Bates, J. Photovoltaics (PV)-electricity from the sun. In Investment in Renewable Energy. Proceedings; Institution of Mechanical Engineers: London, UK, 1998. [Google Scholar]
- Beckers, B. (Ed.) Solar Energy at Urban Scale; John Wiley & Sons: Hoboken, NJ, USA, 2013. [Google Scholar]
- Kazem, H.A.; Khatib, T. Techno-economical assessment of grid connected photovoltaic power systems productivity in Sohar, Oman. Sustain. Energy Technol. Assess. 2013, 3, 61–65. [Google Scholar] [CrossRef]
- Jacobson, M.Z.; Jadhav, V. World estimates of PV optimal tilt angles and ratios of sunlight incident upon tilted and tracked PV panels relative to horizontal panels. Sol. Energy 2018, 169, 55–66. [Google Scholar] [CrossRef]
- Salameh, T.; Tawalbeh, M.; Juaidi, A.; Abdallah, R.; Issa, S.; Alami, A.H. A novel numerical simulation model for the PVT water system in the GCC region. In Proceedings of the 2020 Advances in Science and Engineering Technology International Conferences (ASET), Dubai, UAE, 4 February–9 April 2020; pp. 1–5. [Google Scholar]
- Salameh, T.; Tawalbeh, M.; Juaidi, A.; Abdallah, R.; Hamid, A.K. A novel three-dimensional numerical model for PV/T water system in hot climate region. Renew. Energ. 2020, 164, 1320–1333. [Google Scholar] [CrossRef]
- Khan, J.; Arsalan, M.H. Solar power technologies for sustainable electricity generation e a review. Renew. Sustain. Energy Rev. 2016, 55, 414–425. [Google Scholar] [CrossRef]
- Traverso, M.; Asdrubali, F.; Francia, A.; Finkbeiner, M. Towards life cycle sustainability assessment: An implementation to photovoltaic modules. Int. J. Life Cycle Assess. 2012, 17, 1068–1079. [Google Scholar] [CrossRef]
- Magrassi, F.; Rocco, E.; Barberis, S.; Gallo, M. Hybrid solar power system versus photovoltaic plant: A comparative analysis through a life cycle approach. Renew. Energ. 2019, 130, 290–304. [Google Scholar] [CrossRef]
- Li, L.; Zhang, J. Optimal Design of Solar Photovoltaic and Concentrated Solar Power System for Coal-Fired Power Plants in NSW; University of Technology Sydney: Ultimo, Australia, 2020. [Google Scholar]
- European Parliament, Directive (EU) 2018/844 of 30 May 2018 Amending 556 Directive 2010/31/EU on the Energy Performance of Buildings and Directive 557 2012/27/EU on Energy Efficiency. 2018. Available online: https://ec.europa.eu/energy/topics/energy-efficiency/energy-efficient-buildings/energy-performance-buildings-directive_en (accessed on 12 August 2020).
- Toledo, C.; López-Vicente, R.; Abad, J.; Urbina, A. Thermal performance of PV modules as building elements: Analysis under real operating conditions of different technologies. Energy Build. 2020, 55, 110087. [Google Scholar] [CrossRef]
- Ratti, C.; Baker, N.; Steemers, K. Energy consumption and urban texture. Energy Build. 2005, 37, 762–776. [Google Scholar] [CrossRef]
- Li, D.; Liu, G.; Liao, S. Solar potential in urban residential buildings. Sol. Energy 2015, 111, 225–235. [Google Scholar] [CrossRef]
- Peronato, G.; Rey, E.; Andersen, M. Sampling of building surfaces towards an early assessment of BIPV potential in urban contexts. In Proceedings of the 31st International PLEA Conference (No. CONF), Bologna, Italy, 9–11 September 2015. [Google Scholar]
- Lee, K.S.; Lee, J.W.; Lee, J.S. Feasibility study on the relation between housing density and solar accessibility and potential uses. Renew. Energy 2016, 85, 749–758. [Google Scholar] [CrossRef]
- Moran, P.; O’Connell, J.; Goggins, J. Sustainable energy efficiency retrofits as residential buildings move towards nearly zero energy building (NZEB) standards. Energy Build. 2020, 211, 109816. [Google Scholar] [CrossRef]
- Gaglia, A.G.; Dialynas, E.N.; Argiriou, A.A.; Kostopoulou, E.; Tsiamitros, D.; Stimoniaris, D.; Laskos, K.M. Energy performance of European residential buildings: Energy use, technical and environmental characteristics of the Greek residential sector–energy conservation and CO₂ reduction. Energy Build. 2019, 183, 86–104. [Google Scholar] [CrossRef]
- Sharma, A.; Kolhe, M.; Konara, K.M.S.Y.; Ulltveit-Moe, N.; Muddineni, K.; Mudgal, A.; Garud, S. Performance assessment of institutional photovoltaic based energy system for operating as a micro-grid. Sustain. Energy Technol. Assess. 2020, 37, 100563. [Google Scholar] [CrossRef]
- Poullikkas, A. A comparative assessment of net metering and feed in tariff schemes for residential PV systems. Sustain. Energy Technol. Assess. 2013, 3, 1–8. [Google Scholar] [CrossRef]
- Juaidi, A.; Montoya, F.G.; Ibrik, I.H.; Manzano-Agugliaro, F. An overview of renewable energy potential in Palestine. Renew. Sustain. Energy Rev. 2016, 65, 943–960. [Google Scholar] [CrossRef]
- Abdallah, R.; Juaidi, A.; Abdel-Fattah, S.; Manzano-Agugliaro, F. Estimating the Optimum Tilt Angles for South-Facing Surfaces in Palestine. Energies 2020, 13, 623. [Google Scholar] [CrossRef]
- Abu-Hafeetha, M. Planning for Solar Energy as an Energy Option for Palestine. Master’s Thesis, An-Najah National University, Nablus, Palestina, 2019. [Google Scholar]
- Palestinian Central Bureau of Statistics (PCBS). In Energy Consumption in the Palestinian Territory, Annual Report, Ramallah. 2017. Available online: http://www.pcbs.gov.ps/default.aspx (accessed on 20 April 2020).
- The World Bank. West Bank and Gaza Energy Efficiency Action Plan 2020–2030 World Bank Final Report, June 2016; The World Bank: Washington, DC, USA, 2016. [Google Scholar]
- Coccolo, S.; Monna, S.; Kämpf, J.; Mauree, D.; Scartezzini, J.-L. Energy demand and urban microclimate of old and new residential districts in a hot arid climate. In Proceedings of the PLEA 2016 Buildings, People: Towards Regenerative Environments, Los Angeles, CA, USA, 11–13 July 2016. [Google Scholar]
- Haasona, F. Palestinian Energy and Natural Resources Authority; Palestinian Authority: Ramallah, Palestine, 2019. [Google Scholar]
- Arda, M.A.D.A.; Sharqieh, O.; Taha, M. Recommended National Sustainable Urban and Energy Savings Actions for Palestine, Cleaner Energy Saving Mediterranean Cities. Palestine Report, Project Funded by European Union. 2015. Available online: https://www.climamed.eu/wp-content/uploads/files/Palestine-Report-Recommended-National-Sustainable-Urban-and-Energy-Savings-Actions.pdf (accessed on 7 December 2020).
- Esawi, O. Innovative Solutions for Low-cost Housing in Gaza Strip. Islamic Univ. J. (Ser. Nat. Stud. Eng.) 2008, 16, 131–154. [Google Scholar]
- Abu, O.M. Evaluation of Housing Projects in the West Bank—Case Study in Nablus, Ramallah, and Jenin Cities. Master’s Thesis, An-Najah National University, Nablus, Palestine, 2013. [Google Scholar]
- MLG. Buildings System and Regulation of the Land Outside the Boundaries of Local Bodies; Report; Palestinian Ministry of Local Government: Ramallah, Palestine, 2016.
- MLG. Building and Organization System for Local Authorities No. (6) of 2011; Report; Palestinian Ministry of Local Government: Ramallah, Palestine, 2011.
- Elewi, H. Functional Adaptability of Multi-Story Residential Buildings Nablus City Case Study. Master’s Thesis, An-Najah National University, Nablus, Palestine, 2019. [Google Scholar]
- Itma, M. Impact of Sociocultural Values on Housing Design in Palestine. In Climate Change and Sustainable Heritage; Hofbauer, C.K., Kandjani, E.M., Meuwissen, J.M.C., Eds.; Cambridge Scholars Publishing, Lady Stephenson Library: Newcastle upon Tyne, UK, 2018; pp. 130–142. [Google Scholar]
- PLA the Palestinian Land Authority. Available online: http://www.pla.pna.ps/:7–2020 (accessed on 3 January 2020).
- Applied Research Institute-Jerusalem. Monitoring Report 2003. Available online: https://www.arij.org/ (accessed on 20 April 2020).
- Available online: https://valentin-software.com/en/products/pvsol-premium/ (accessed on 27 April 2020).
- Abdallah, R.; Natsheh, E.; Juaidi, A.; Samara, S.; Manzano-Agugliaro, F. A Multi-Level World Comprehensive Neural Network Model for Maximum Annual Solar Irradiation on a Flat Surface. Energies 2020, 13, 6422. [Google Scholar] [CrossRef]
- Johnson, D.O.; Ogunseye, A.A. Grid-connected photovoltaic system design for local government offices in Nigeria. Nigerian J. Technol. 2017, 36, 571–581. [Google Scholar] [CrossRef][Green Version]
- Copper, J.K.; Sproul, A.B.; Bruce, A.G. A method to calculate array spacing and potential system size of photovoltaic arrays in the urban environment using vector analysis. Appl. Energy 2016, 161, 11–23. [Google Scholar] [CrossRef]
- Faiman, D.; Feuermann, D.; Ibbetson, P.; Medwed, B.; Zemel, A. PV Systems for Israel’s Cities: How Large Should They be? A Design Guide; 20 0 0 RD-24–99; Israel Ministry of National Infrastructures: Jerusalem, Israel, 2000.


| Building Type | Building Shape | Total Roof Area (m2) | Number of Floors | Number of Apartment/Floor | Roof Area/Apartment (m2) | Stairs RoofArea-Used for Water Tanks and Solar Water Heating (m2) | Building Orientation | The shaded Area (m2) | Area available for PV Installation (m2) |
|---|---|---|---|---|---|---|---|---|---|
| A1 |  | 200 | 2 | 1 | 200 | 17 | South-North East-West | 14 12 | 169 171 |
| A2 |  | 300 | 2 | 2 | 150 | 17 | South-North East-West | 21 24 | 262 259 |
| B1 |  | 300 | 5–7 (6) | 2 | 30–21.5 (25) | 22 | South-North East-West | 25 30 | 253 248 |
| B2 |  | 600 | 5–7 (6) | 4 | 30–21.5 (25) | 70 | South-North East-West | 29 35 | 501 495 |
| C1 |  | 180 | 4 | 1 | 45 | 17 | South-North East-West | 14 12 | 149 151 |
| C2 |  | 250 | 4 | 2 | 31.25 | 17 | South-North East-West | 21 24 | 212 209 |
| City | Nablus | Jerusalem | Hebron | Gaza | ||||||||||||||
|---|---|---|---|---|---|---|---|---|---|---|---|---|---|---|---|---|---|---|
| Building Type | Orientation | Tilt Angle | Total Production (kWh/year) | Production by Household (kWh/year) | Production to Consumption 2016 (%) | Production to Consumption 2030 (%) | Total Production (kWh/year) | Production by Household (kWh/year) | Production to Consumption 2016 (%) | Production to Consumption 2030 (%) | Total Production (kWh/year) | Production by Household (kWh/year) | Production to Consumption 2016 (%) | Production to Consumption 2030 (%) | Total Production (kWh/year) | Production by Household (kWh/year) | Production to Consumption 2016 (%) | Production to Consumption 2030 (%) |
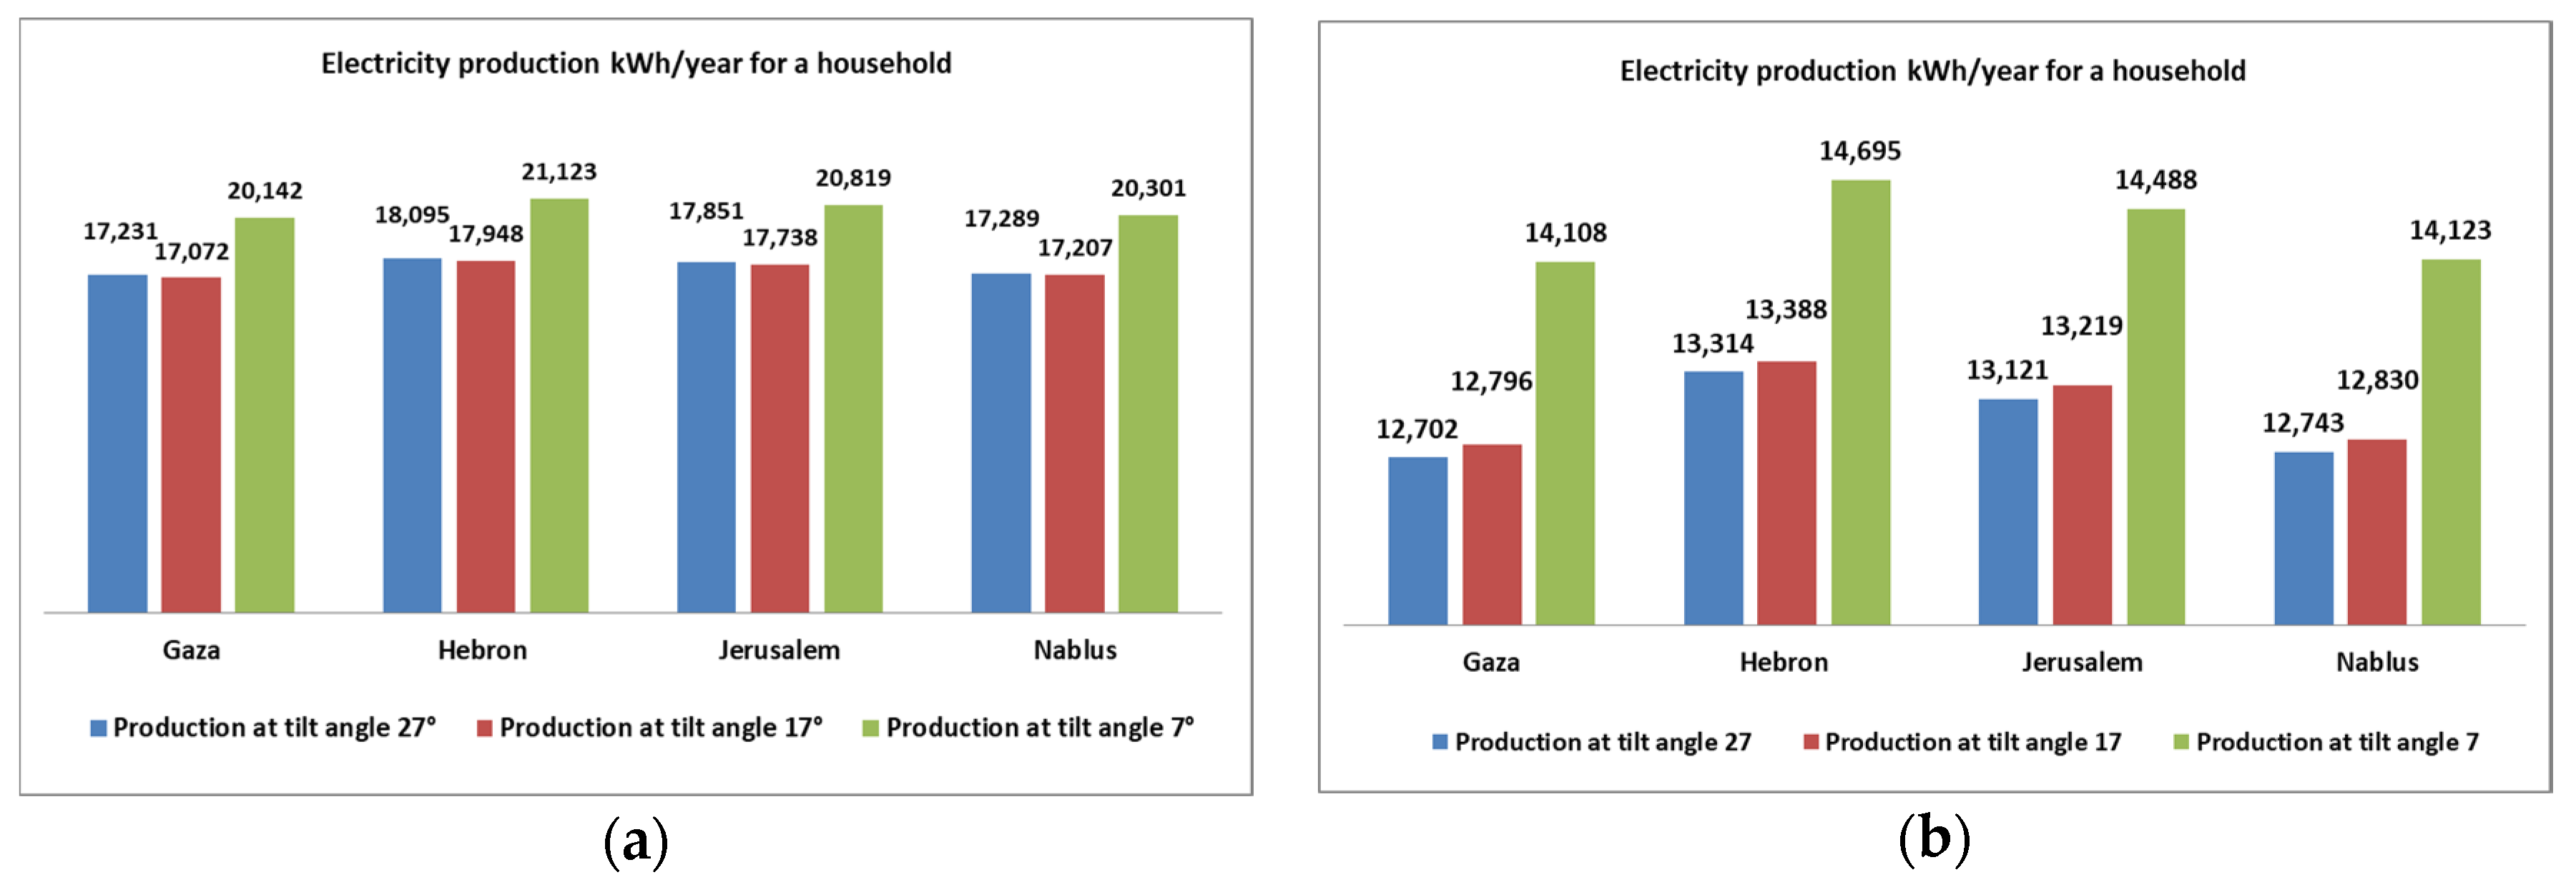
| A1 | S-N | 27° | 34,577 | 17,289 | 530 | 279 | 35,702 | 17,851 | 337 | 220 | 36,189 | 18,095 | 513 | 282 | 34,462 | 17,231 | 542 | 279 |
| 17° | 34,414 | 17,207 | 527 | 277 | 35,475 | 17,738 | 334 | 219 | 35,896 | 17,948 | 509 | 280 | 34,144 | 17,072 | 537 | 276 | ||
| 7° | 40,602 | 20,301 | 622 | 327 | 41,638 | 20,819 | 393 | 257 | 42,245 | 21,123 | 599 | 329 | 40,284 | 20,142 | 633 | 326 | ||
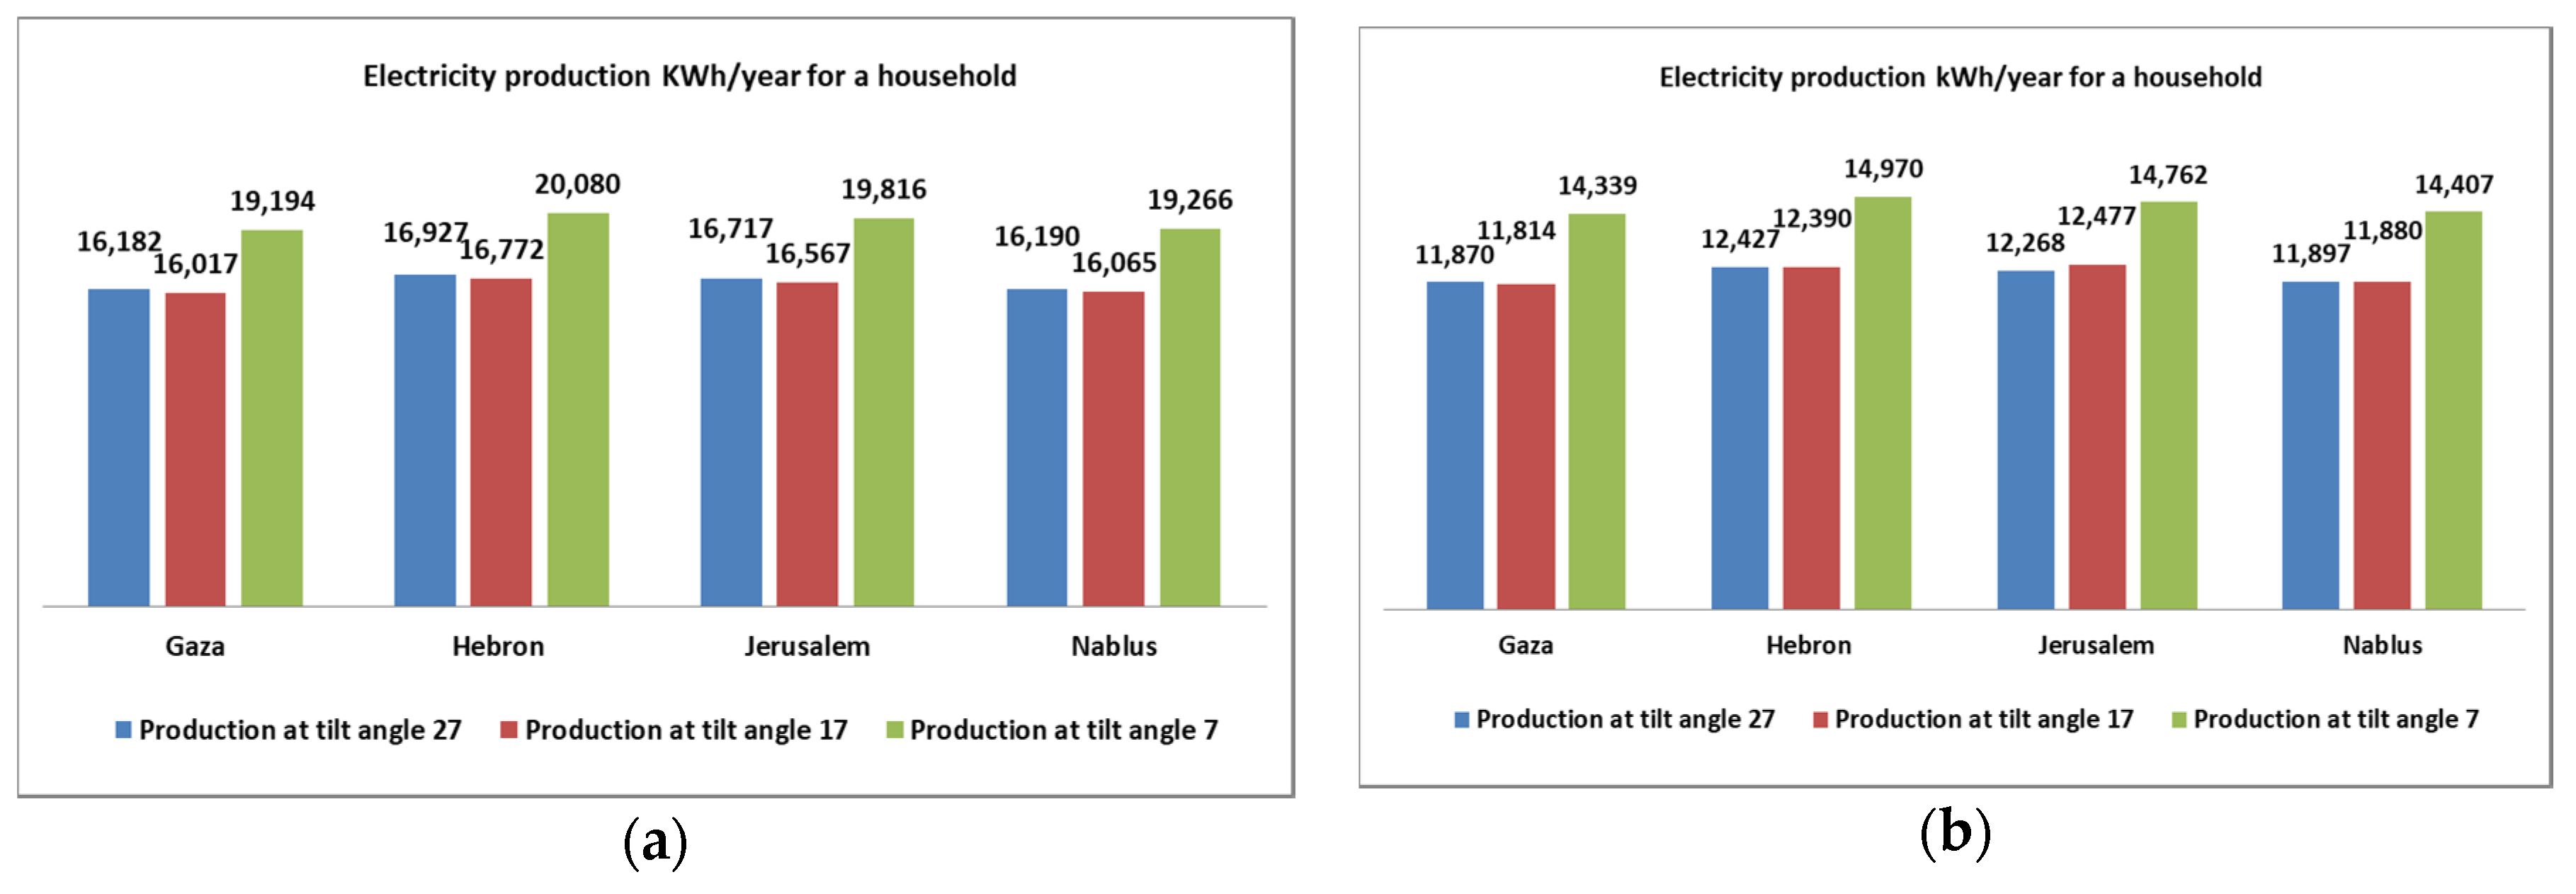
| E-W | 27° | 32,379 | 16,190 | 496 | 261 | 33,433 | 16,717 | 315 | 206 | 33,854 | 16,927 | 480 | 264 | 32,364 | 16,182 | 509 | 262 | |
| 17° | 32,130 | 16,065 | 492 | 259 | 33,134 | 16,567 | 312 | 205 | 33,543 | 16,772 | 475 | 261 | 32,033 | 16,017 | 504 | 259 | ||
| 7° | 38,532 | 19,266 | 590 | 311 | 39,632 | 19,816 | 374 | 245 | 40,159 | 20,080 | 569 | 313 | 38,388 | 19,194 | 604 | 311 | ||
| A2 | S-N | 27° | 50,971 | 12,743 | 390 | 205 | 52,484 | 13,121 | 247 | 162 | 53,257 | 13,314 | 377 | 207 | 50,808 | 12,702 | 399 | 206 |
| 17° | 51,321 | 12,830 | 393 | 207 | 52,874 | 13,219 | 249 | 163 | 53,551 | 13,388 | 379 | 209 | 51,184 | 12,796 | 402 | 207 | ||
| 7° | 56,493 | 14,123 | 433 | 228 | 57,952 | 14,488 | 273 | 179 | 58,781 | 14,695 | 417 | 229 | 56,433 | 14,108 | 444 | 228 | ||
| E-W | 27° | 47,587 | 11,897 | 364 | 192 | 49,073 | 12,268 | 231 | 151 | 49,709 | 12,427 | 352 | 194 | 47,481 | 11,870 | 373 | 192 | |
| 17° | 47,519 | 11,880 | 364 | 191 | 49,908 | 12,477 | 235 | 154 | 49,558 | 12,390 | 351 | 193 | 47,255 | 11,814 | 372 | 191 | ||
| 7° | 57,628 | 14,407 | 441 | 232 | 59,047 | 14,762 | 278 | 182 | 59,881 | 14,970 | 424 | 233 | 57,357 | 14,339 | 451 | 232 | ||
| B1 | S-N | 27° | 47,498 | 3958 | 121 | 64 | 48,813 | 4068 | 77 | 50 | 49,610 | 4134 | 117 | 64 | 47,471 | 3956 | 124 | 64 |
| 17° | 47,670 | 3973 | 122 | 64 | 49,182 | 4099 | 77 | 51 | 49,792 | 4149 | 118 | 65 | 47,635 | 3970 | 125 | 64 | ||
| 7° | 54,440 | 4537 | 139 | 73 | 55,738 | 4645 | 88 | 57 | 56,510 | 4709 | 133 | 73 | 54,394 | 4533 | 143 | 73 | ||
| E-W | 27° | 44,700 | 3725 | 114 | 60 | 46,047 | 3837 | 72 | 47 | 46,621 | 3885 | 110 | 61 | 44,597 | 3716 | 117 | 60 | |
| 17° | 44,653 | 3721 | 114 | 60 | 45,919 | 3827 | 72 | 47 | 46,496 | 3875 | 110 | 60 | 44,403 | 3700 | 116 | 60 | ||
| 7° | 58,251 | 5825 | 178 | 94 | 59,631 | 5963 | 112 | 74 | 60,473 | 6047 | 171 | 94 | 57,820 | 5782 | 182 | 94 | ||
| B2 | S-N | 27° | 95,497 | 3979 | 122 | 64 | 98,222 | 4093 | 77 | 51 | 99,671 | 4153 | 118 | 65 | 95,145 | 3964 | 125 | 64 |
| 17° | 96,897 | 4037 | 124 | 65 | 99,760 | 4157 | 78 | 51 | 100,947 | 4206 | 119 | 66 | 96,542 | 4023 | 126 | 65 | ||
| 7° | 115,949 | 4831 | 148 | 78 | 118,569 | 4940 | 93 | 61 | 120,641 | 5027 | 142 | 78 | 115,215 | 4801 | 151 | 78 | ||
| E-W | 27° | 93,181 | 3883 | 119 | 63 | 95,608 | 3984 | 75 | 49 | 97,355 | 4056 | 115 | 63 | 92,756 | 3865 | 122 | 63 | |
| 17° | 94,816 | 3951 | 121 | 64 | 97,635 | 4068 | 77 | 50 | 98,933 | 4122 | 117 | 64 | 94,372 | 3932 | 124 | 64 | ||
| 7° | 114,846 | 4785 | 147 | 77 | 117,711 | 4905 | 92 | 61 | 119,369 | 4974 | 141 | 77 | 114,415 | 4767 | 150 | 77 | ||
| C1 | S-N | 27° | 30,375 | 7594 | 233 | 122 | 31,217 | 7804 | 147 | 96 | 31,715 | 7929 | 225 | 124 | 30,373 | 7593 | 239 | 123 |
| 17° | 30,694 | 7674 | 235 | 124 | 31,584 | 7896 | 149 | 97 | 31,943 | 7986 | 226 | 124 | 30,608 | 7652 | 241 | 124 | ||
| 7° | 31,794 | 7824 | 240 | 126 | 32,543 | 8009 | 151 | 99 | 32,916 | 8102 | 230 | 126 | 31,232 | 7684 | 242 | 124 | ||
| E-W | 27° | 30,819 | 7705 | 236 | 124 | 31,631 | 7908 | 149 | 98 | 32,191 | 8048 | 228 | 125 | 30,738 | 7685 | 242 | 124 | |
| 17° | 31,252 | 7813 | 239 | 126 | 32,203 | 8051 | 152 | 99 | 32,626 | 8157 | 231 | 127 | 31,139 | 7785 | 245 | 126 | ||
| 7° | 36,881 | 9220 | 282 | 149 | 37,890 | 9473 | 179 | 117 | 38,418 | 9605 | 272 | 150 | 36,699 | 9175 | 289 | 148 | ||
| C2 | S-N | 27° | 41,452 | 5182 | 159 | 84 | 42,561 | 5320 | 100 | 66 | 43,047 | 5381 | 153 | 84 | 41,337 | 5167 | 162 | 84 |
| 17° | 43,412 | 5427 | 166 | 87 | 44,713 | 5589 | 105 | 69 | 45,319 | 5665 | 161 | 88 | 43,254 | 5407 | 170 | 87 | ||
| 7° | 45,879 | 5735 | 176 | 92 | 46,602 | 5825 | 110 | 72 | 47,240 | 5905 | 167 | 92 | 45,317 | 5665 | 178 | 92 | ||
| E-W | 27° | 41,022 | 5128 | 157 | 83 | 42,226 | 5278 | 100 | 65 | 42,925 | 5366 | 152 | 84 | 40,804 | 5101 | 160 | 83 | |
| 17° | 42,224 | 5278 | 162 | 85 | 43,464 | 5433 | 102 | 67 | 44,028 | 5504 | 156 | 86 | 42,000 | 5250 | 165 | 85 | ||
| 7° | 47,121 | 5890 | 180 | 95 | 48,297 | 6037 | 114 | 75 | 48,955 | 6119 | 173 | 95 | 46,929 | 5866 | 184 | 95 | ||
Publisher’s Note: MDPI stays neutral with regard to jurisdictional claims in published maps and institutional affiliations. |
© 2020 by the authors. Licensee MDPI, Basel, Switzerland. This article is an open access article distributed under the terms and conditions of the Creative Commons Attribution (CC BY) license (http://creativecommons.org/licenses/by/4.0/).
Share and Cite
Monna, S.; Juaidi, A.; Abdallah, R.; Itma, M. A Comparative Assessment for the Potential Energy Production from PV Installation on Residential Buildings. Sustainability 2020, 12, 10344. https://doi.org/10.3390/su122410344
Monna S, Juaidi A, Abdallah R, Itma M. A Comparative Assessment for the Potential Energy Production from PV Installation on Residential Buildings. Sustainability. 2020; 12(24):10344. https://doi.org/10.3390/su122410344
Chicago/Turabian StyleMonna, Sameh, Adel Juaidi, Ramez Abdallah, and Mohammed Itma. 2020. "A Comparative Assessment for the Potential Energy Production from PV Installation on Residential Buildings" Sustainability 12, no. 24: 10344. https://doi.org/10.3390/su122410344
APA StyleMonna, S., Juaidi, A., Abdallah, R., & Itma, M. (2020). A Comparative Assessment for the Potential Energy Production from PV Installation on Residential Buildings. Sustainability, 12(24), 10344. https://doi.org/10.3390/su122410344