Article

An Operational Framework for Urban Vulnerability to Floods in the Guayas Estuary Region: The Duran Case Study

by
Mercy J. Borbor-Cordova
1,2,*,
Geremy Ger
2,
Angel A. Valdiviezo-Ajila
3,
Mijail Arias-Hidalgo
2,4,5,
David Matamoros
2,5,6,
Indira Nolivos
1,5,
Gonzalo Menoscal-Aldas
7,
Federica Valle
8,
Alessandro Pezzoli
9 and
Maria del Pilar Cornejo-Rodriguez
1,2
1
Facultad de Ingenieria Maritima y Ciencias del Mar, Escuela Superior Politecnica del Litoral, Campus Gustavo Galindo Km. 30.5 Vía Perimetral, Guayaquil 09-01-5863, Ecuador
2
Pacific International Center for Disaster Risk Reduction, PIC-DRR, Escuela Superior Politécnica del Litoral, ESPOL, Campus Gustavo Galindo Km. 30.5 Vía Perimetral, Guayaquil 09-01-5863, Ecuador
3
Servicio Nacional de Gestión de Riesgos y Emergencias, Samborondón 092301, Ecuador
4
Facultad de Ciencias de la Tierra, Escuela Superior Politécnica del Litoral, ESPOL, Campus Gustavo Galindo Km 30.5 Vía Perimetral, Guayaquil 09-01-5863, Ecuador
5
Centro del Agua y Desarrollo Sustentable, Escuela Superior Politécnica del Litoral, ESPOL, Campus Gustavo Galindo Km. 30.5 Vía Perimetral, Guayaquil 09-01-5863, Ecuador
6
Facultad de Ciencias Naturales y Matemáticas, Escuela Superior Politécnica del Litoral, ESPOL, Campus Gustavo Galindo Km. 30.5 Vía Perimetral, Guayaquil 09-01-5863, Ecuador
7
Dirección de Riesgos y Ambiente, Municipio de Santa Elena, Santa Elena 240150, Ecuador
8
Department of Economics and Statistics, Politecnico di Torino & Universita di Torino, 10125 Torino, Italy
9
Interuniversity Department of Regional and Urban Studies and Planning (DIST), Politecnico di Torino & Universita di Torino, 10125 Torino, Italy
*
Author to whom correspondence should be addressed.
Sustainability 2020, 12(24), 10292; https://doi.org/10.3390/su122410292
Submission received: 31 October 2020 / Revised: 27 November 2020 / Accepted: 30 November 2020 / Published: 9 December 2020
(This article belongs to the Special Issue Risk-Informed Sustainable Development in the Urban Tropics)

Abstract

:
Duran is a coastal city located in the Guayas Estuary region in which 24% of urban sectors suffers from the effects of chronic flooding. This study seeks to assess the causes of Duran’s vulnerability by considering exposure, population sensitivity and adaptive capacity to establish alternatives to reduce its vulnerability to flooding. An operational framework is proposed based on the vulnerability definition of the Intergovernmental Panel on Climate Change (IPCC) and applying a census-based Index of Vulnerability, a geographic information system and local knowledge of urban development. A Principal Component and equal weighting analysis were applied as well as a spatial clustering to explore the spatial vulnerability across the city. A total of 34% of the city area is mapped as having high and very high vulnerability, mostly occupied by informal settlements (e.g., 288 hectares). Underlying factors were poor quality housing, lack of city services and low adaptive capacity of the community. However, some government housing programs (e.g., El Recreo), with better housing and adaptive capacity were also highly vulnerable. Limited urban planning governance has led to the overloading of storm water and drainage infrastructure which cause chronic flooding. Understanding the underlying causes of vulnerability is critical in order develop integrated strategies that increase city resilience to climate change.

1. Introduction

Latin America’s major coastal cities are becoming more densely populated and growing at accelerated rates; this phenomenon is leading to unstructured periurban development which reduces the ability of cities to protect themselves from recurring and major flooding events [1,2,3,4,5]. According to the Intergovernmental Panel on Climate Change (IPCC), extreme flooding events will increase in intensity and frequency, leading to impacts on the human health, community property, and economic productivity of cities [6]. At the heart of flood impact is the vulnerability of urban systems, which is based on climate, ecosystem, socio-economic, institutional and cultural factors. Considering that the region is exposed to extreme events such as El Niño and climate change it is necessary to assess the vulnerability of cities to climate events in the region. The IPCC defines vulnerability to climate change as the: “Level at which a system is susceptible, or unable to withstand, the adverse effects of climate change, including climate variability and extreme phenomena. Vulnerability is based on the nature, magnitude and speed of the climate variation to which a system is exposed, its sensitivity, and its adaptability” [6]. The current state of the art for studying urban flooding is shifting from flood protection and management to disaster risk reduction and city resilience [7,8]. These perspectives contribute to Sustainable Development Goals (SDGs) 11 and 13 of sustainable cities and communities, and climate actions, respectively, yet require an interdisciplinary framework that includes an understanding of the social vulnerability, city economy, the ecological services of the urban ecosystems and city governance around climate hazards [9].
This study analyzes the case of Duran, a coastal city located in the Guayas Estuary region in Ecuador. According to the 2010 census, Duran has a population of approximately 235,769 inhabitants (intermediate city) and an area of 311.73 km2 [10], with 97.9% of its population living in urban areas and only 2.7% living in rural areas [11,12]. In the 1990s–2000s the population increased from 85,000 to 178,715 inhabitants, generating an urban growth rate of 6.7%, while between 2000 and 2010 its population growth rate was reduced by 3.08% [13]. Population growth in the 2000–2010s has been one of the fastest in coastal Ecuador and has been linked to migration processes to the city of Guayaquil. Rapid unplanned urbanization in flood-prone areas, environmental degradation and the lack of adequate city governance has exacerbated the impacts of climate events.
As the city of Duran has grown in population, the occurrence of flooding and landslide events has also increased due to exposure in sectors that were previously wetlands or floodplains. Figure 1 shows the increase in the number of flood events, related to climate, such as precipitation events, tidal effects, and socio-ecological and institutional factors at the local level. It has become important to determine what the main drivers among these factors are and how local government can assess vulnerability across the city to develop their urban land planning (ULP) and disaster risk reduction strategies. In Ecuador, local government has the remit to develop these plans and recently passed environmental law explicitly states that municipalities have the responsibility to include climate adaptation and risk reduction measures in consideration of vulnerability to climate and other hazards in those plans [14].
In order to enhance the capacities for disaster risk management at the local level, the Municipality of Duran and an interdisciplinary group of researchers at the Escuela Superior Politecnica del Litoral (ESPOL) developed a strategic alliance within the project entitled “Climate Resilience for cities, Strategies to reduce hydroclimate risks at Duran city (RESCLIMA)”, which analyzed multiple hazards such as flooding, urban heat island and landslides. In this article, we present the part of the vulnerability analysis as a critical component to understand the climate risks within the context of adaptation to climate change and urban resilience.
The novelty of this work is related to its focus on Duran’s social vulnerability and governance challenges of city authorities to manage informal settlements. This study shifts from a purely technical hydrological analysis to a more holistic understanding of flood drivers emphasizing spatial planning as a mean to reduce city vulnerability. The objective of this study is to apply a methodological framework to analyze the vulnerability of the city of Duran to flood events, identifying the urban sectors of greatest vulnerability (intracity). In fact, a Principal Component and equal weighting analysis were applied as well as a spatial clustering to explore the social vulnerability across the city. Such innovative applied methodology will enable researchers and policy makers to outline specific strategies and actions at the urban sector level. Although this conceptual framework is applied to a coastal city, it is expected that this framework will be applicable to other cities with consideration of the socio-ecological context of their territory. A vulnerability analysis methodology would be a relevant tool to provide inputs to territorial planning, linked to risk management and adaptation to climate change for cities in Ecuador and the Latin American region.

2. Materials and Methods

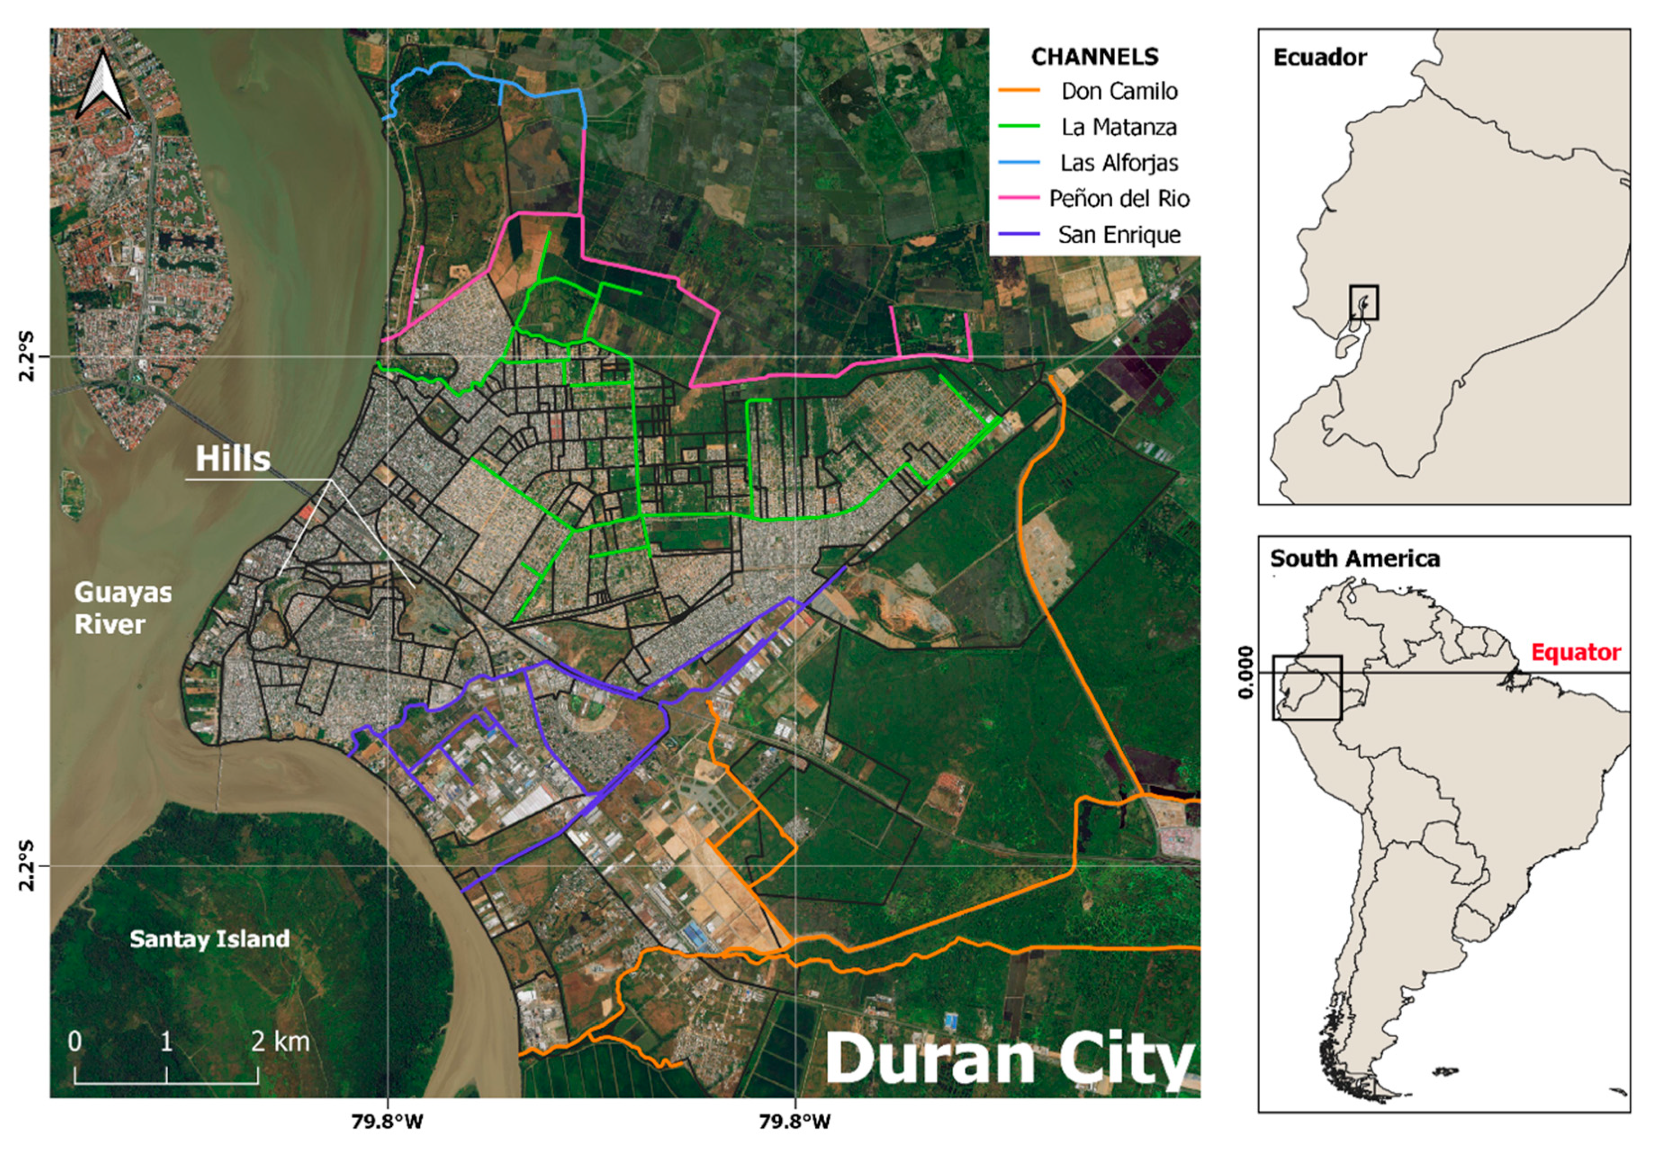
2.1. Study Area: Duran as a Socio-Ecological System

Duran is an intermediate city of Guayas province known for its excellent geographical location and its compositional characteristics (fertile lands, industrial areas, tourism potential, etc.). It is the second most populated city in the Guayas province, and country’s sixth, located no more than 10 min from Guayaquil City (the country’s most important economic city) [10,13].
Currently, it has an area of 300 km2, of which 16% is considered as an urban area, divided into three parishes: Eloy Alfaro, Divino Niño and El Recreo. According to geographical information systems (GIS) provided by the Municipal Autonomous Government of Duran, 268 urban areas and 3772 blocks have been established within the city that is surrounded by the Babahoyo and Guayas rivers which form the Guayas Estuary, and settled in coastal lowlands, floodplains and historically mangrove-populated areas (Figure 2).
Duran’s climate and environment is linked to the Guayas Estuary ecosystem and its geographical position in the coastal region. The climate is known as tropical savanna with December to April comprising the rainy season and the rest of the year the dry season [13]. The average annual rainfall is 1200 mm with interannual variability linked to El Niño years, in which rainfall can rise to 3500 mm per year as in 1997 [15]. In combination with the tides, Duran and its natural channels and lowlands are strongly affected by the streamflow of the Babahoyo and Guayas rivers. Human settlements in Duran are threatened by a process of increasing sedimentation which appears to be occurring in the estuary resulting in high tides and faster river currents that increase flood risk for low lying areas around the margins of the river [16,17,18,19].

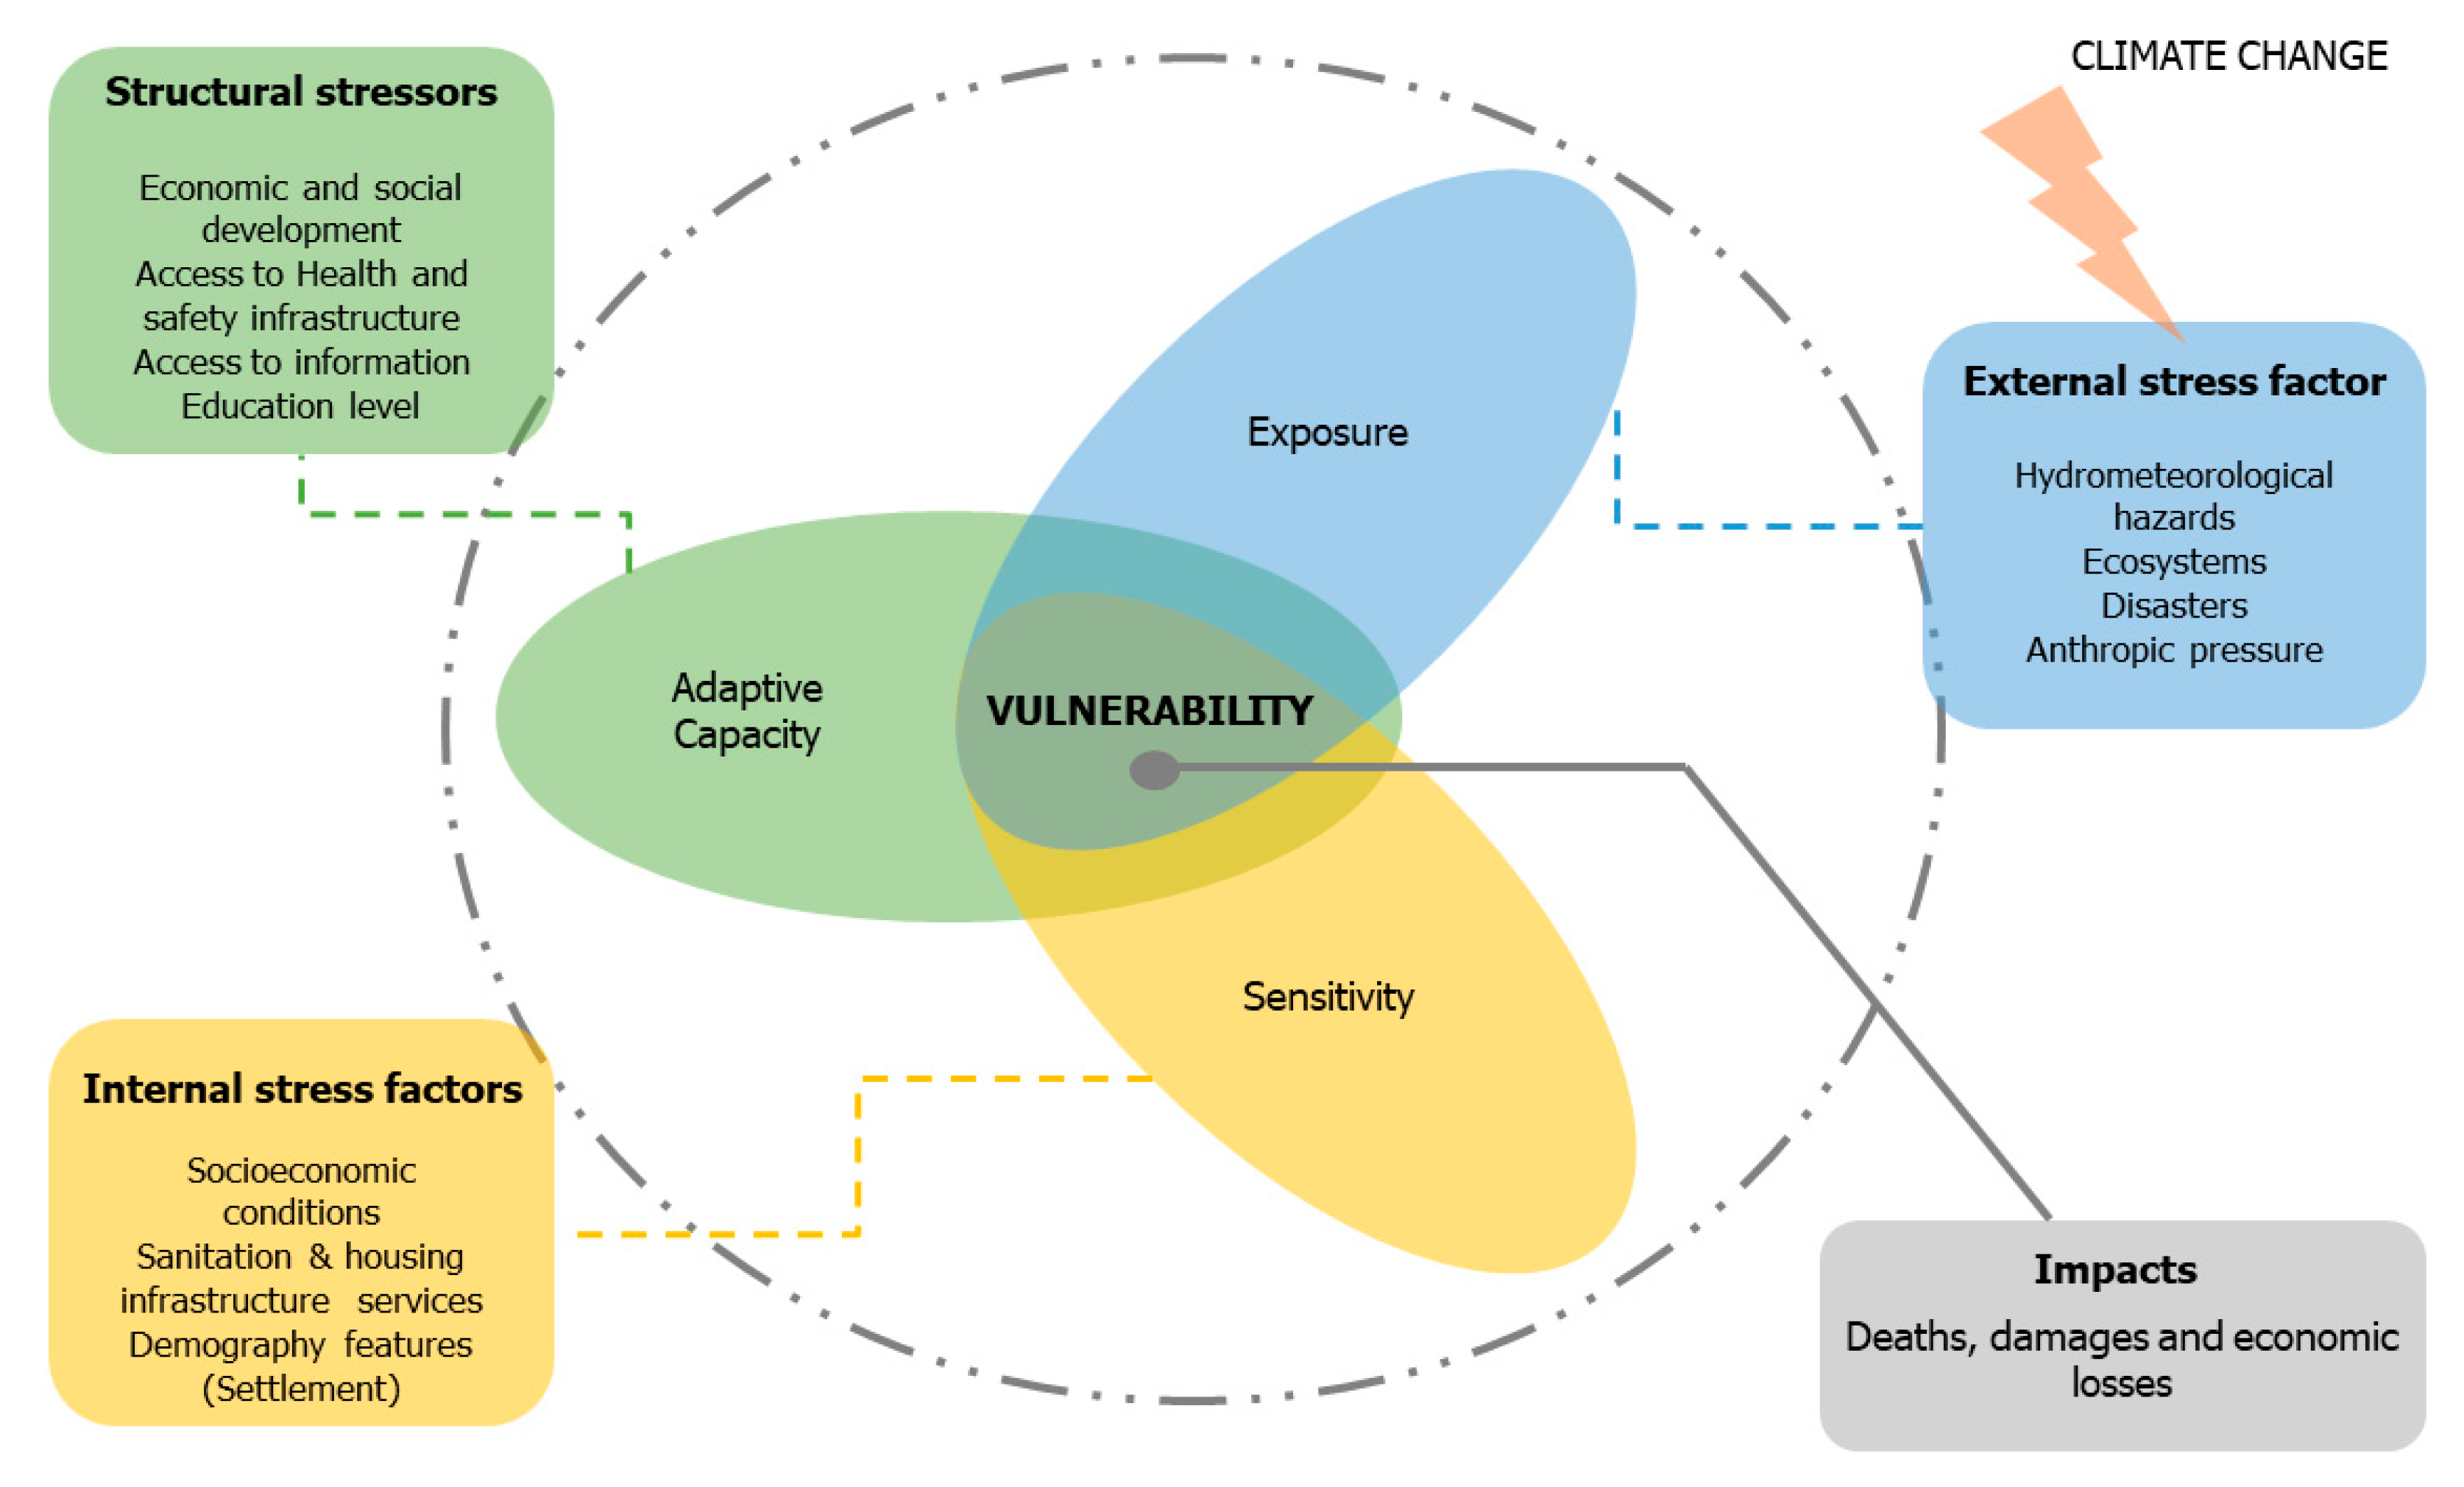
2.2. Operational Conceptual Framework of Vulnerability: Applied to a Coastal City

Throughout history the concept of vulnerability has been discussed, evaluated and described from various fields of research. Vulnerability in the field of risk assessment is a complex concept that has been defined as the state of sensitive/susceptibility to stress exposure damage associated with climate, socio-economic conditions and lack of adaptability [20]. According to a similar concept from the (IPCC), vulnerability is a predisposition to be adversely affected, composed of factors like exposure, sensitivity to harm and lack of responsiveness and adaptation [6,21,22]
Despite the different conceptual frameworks of vulnerability, it is possible to find common elements in most of the proposed definitions for vulnerability (exposure, sensitivity, resilience). For this reason, the concept of vulnerability adopted in this study was based on the 2014 Intergovernmental Panel on Climate Change (IPCC) report. In this way the incorporation of data and information from the city that was generally dispersed in different information sources such as: municipal directorates, governmental departments and the Academy can be integrated as one [6,21].
According with [6,22,23,24,25] vulnerability components represented in Figure 3 are: exposure, sensitivity (susceptibility) and adaptive capacity, defined as: (i) the degree to which a system is exposed to extreme climatic changes, including all elements that may be adversely affected, such as: individuals, livelihoods, habitats, environmental services and infrastructure; (ii) the degree to which the climate-related inputs and their changes influence a system, either negatively or positively; (iii) the ability of a system to adapt, react or reorganize in ways which retain its essential purpose, identity and structure.
Combining these three components into a spatial framework allows for a detailed study of the underlying causes of flood vulnerability, and later exploring adaptation or response measures of the various urban actors.

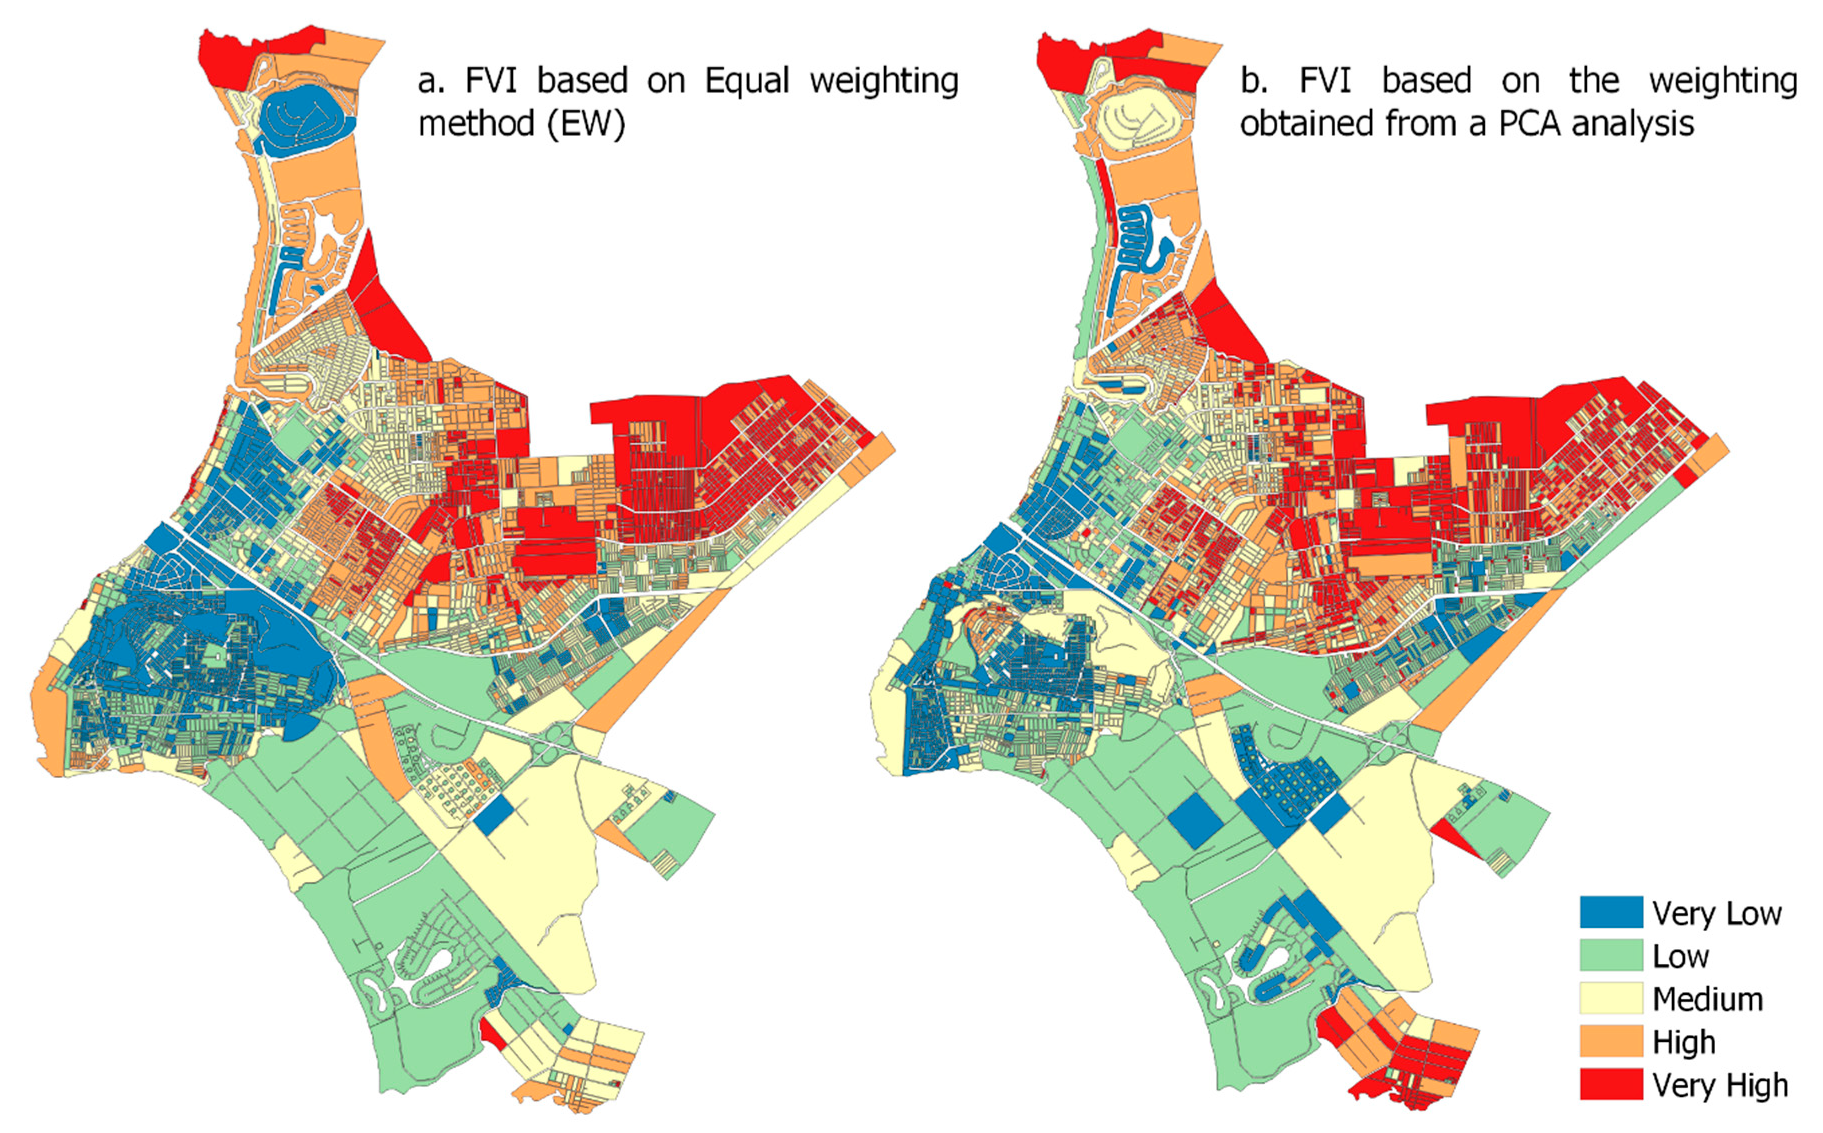
2.3. Flood Vulnerability Index, Methodologies for Weighting Indicators

This work opted for the development of a flood vulnerability index (FVI) which allowed for the assessment of various aspects of a city’s vulnerability regarded as social and economic as in other approaches, is relatively easy and encourages research on small spatial scales, also this kind of methodology can be extended to city officers and understood by decision-makers [23].
There is a lot of literature on the definition of vulnerability, where it is described as a multiplicative or summative model of different factors [25,26,27,28]; however, in this study, the FVI was estimated as an algebraic sum of its components (exposure (E), sensitivity (S) and adaptability (AC)), under previously defined weights. There are multiple weighting strategies for determining indexes, some of which are derived from mathematical models, such as principal component analysis (PCA), data envelope analysis and non-observed component models (UCM), or participatory approaches such as budget allocation processes (BAP) [29,30]. Additionally, many studies have used composite indicators based on equal weighting (EW), i.e., for each component (E, S and AC) all indicators are provided the same weight [31,32,33].
In total, two summarizing and two weighting methods were applied to assess the vulnerability index (FVI); one weighting measure considered the general Equation (1) used in a previous study implemented for the Latin America and Caribe region developed by Corporación Andina de Fomento (CAF) in 2014 [25,31,34], in which the definition of vulnerability is a representation of the balance between a potential threat and a system’s ability to mitigate that risk. As such, equal weights are distributed in the FVI between the Exposure Index (50%) and together, the Sensitivity Index (25%) and the Adaptive Capacity Index (25%), these three indexes are calculated by giving the same ponderation to each indicator (Table 1) [35,36,37,38]
FVI = 0.5 E + 0.25 S − 0.25 AC
In the second method, an FVI was obtained based on weights extracted from a core component analysis (PCA), using Equation (2) [29,39].
FVI j = i = 1 n w i ( X ij X i ¯ ) S i   i   =   1 ,   .   .   .   ,   n ;   j   =   1 ,   .   .   .   ,   J   i = 1
where FVIj is the vulnerability index, Wi is the weight represented by the factorial loads of higher value, Xij is the value of the indicator, j indicates the blocks, while i represents indicators, X ¯ i is the mean value of the indicator and Si is the standard deviation [39,40]. To obtain weights from the PCA, it was important to choose factors that: (i) have associated eigen values greater than one; (ii) contribute individually to the explanation of the general variance by more than 10%; and (iii) contribute cumulatively to the explanation of the overall variance by more than 50% [29,39,41,42,43].

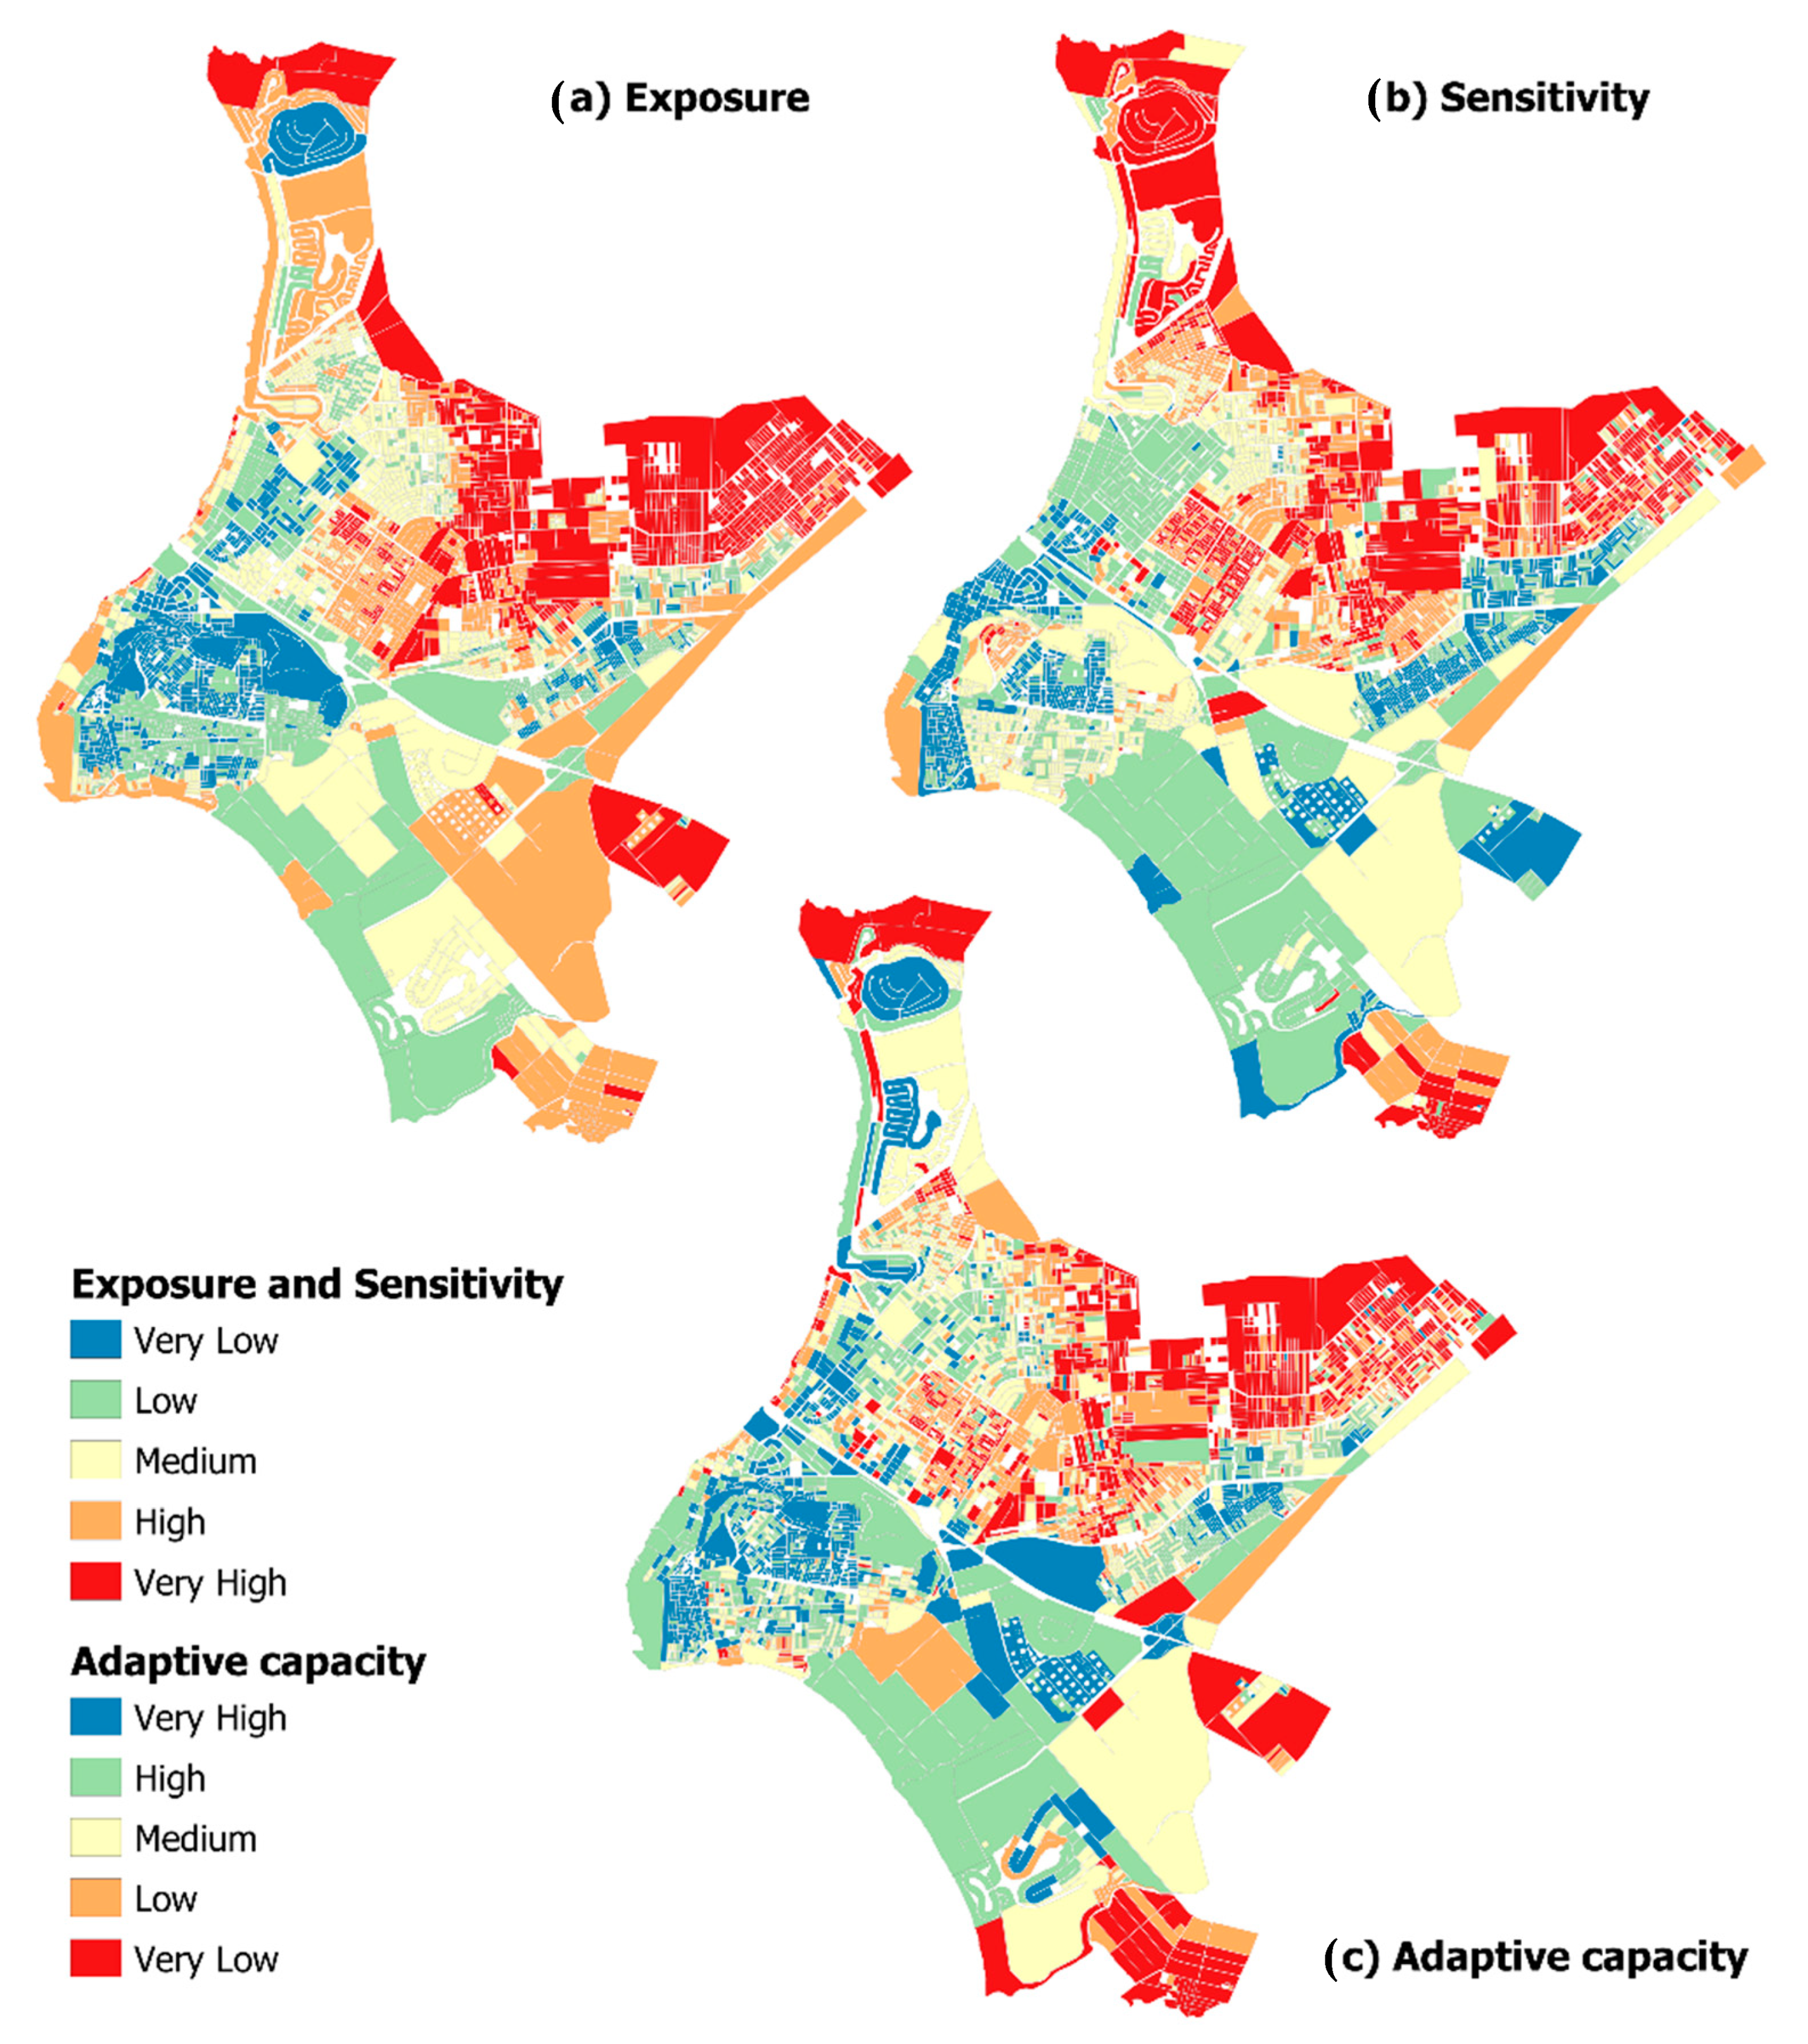
2.4. Variables: Exposure, Sensitivity, and Adaptive Capacity Indexes of the Duran

In this analysis, the Exposure Index was calculated by four variables related to: geomorphology (flood level), recurrence of flooding (history of events), population density as an exposed factor and susceptibility to flooding due to soil features. The exposure was classified in five levels from very low to very high, and data input was obtained from previous studies executed by National Risk Management Service of Ecuador (SNGRE acronym in Spanish), which took into consideration the following factors:
  • The flux density combined with the slope and geomorphology.
  • Land use and vegetation cover as well as soil texture.
  • Hydrogeology in relation to its potential to generate areas susceptible to flooding.
  • Rains as a trigger for floods.
In the SNGRE’s methodology, values of 150 mm as maximum 24-h precipitation were used for a 100-y return period (Tr), applying the Gumbel distribution to time series of extreme rains with a record time of more than 10 years. These values in combination with isohyets annual rainfall and vegetation allows for the identification of areas susceptible to flooding.
The Sensitivity Index was calculated by nine variables, from the 2010 population and housing census, this component was divided into two groups: socio-economic aspects, and sanitation and housing infrastructure services. These variables help to show the distribution of the most vulnerable population groups because of their socio-economic conditions and urban context where they live [23,25,44,45,46,47,48,49,50].
The adaptive capacity to adjust, respond and recover to the climate impacts was explained by five variables that encompass all those factors that allow blocks to be able to cope with the effects of flooding (Table 1), The variables for the FVI were selected based on expert knowledge and references of previous studies [25,47,50,51]. Subsequently, we integrated the variables described in Table 1 in a spatial analysis that allowed us to explore the underlying causes of the vulnerability to flooding, and moreover explore adaptation or response measures by the different urban stakeholders [22,23,24,25]

2.5. Data Processing

The selected indicators to obtain the FVI index were available in different formats, so they needed to be processed before being used and added to a shapefile extension (.shp) containing the blocks, which were the study geographic units. Data from the 2010 Population and Housing Census coupled directly with the shape extension file, and were collected through the REDATAM+SP program. This tool allows managing large volume census databases for processing and analysis, as well as downloading data for each spatial unit of interest in Excel format (xlsx) [52].
Spatial data such as the Digital Terrain Elevation (DEM) and flood susceptibility (return period of 100 y) were in raster format, so it was appropriate to adapt them to the format mentioned above. For this, using zonal statistics tool from QGIS software, the mean value of blocks areas was extracted from raster images to fit the blocks areas in a shape file extension.
Each indicator identified in Section 2.4 as measured in different scales and units. For this reason, all indicators had to be standardized. The numerical values that obtained exposure, sensitivity, adaptive capacity as well as FVI indexes were normalized to a scale of 0 to 1. To this, Equation (3) and (4) were used [39,40,50]. Equation (3) was used when the relationship between the variable and FVI is positive i.e., if the indicator value increases, the vulnerability will increase as well.
N   = X X min X max X min
On the other hand, when the relationship between the FVI and the indicator is negative (adaptive capacity indicators) the Equation (4) is used, where Xmin. and Xmax. correspond to the minimum and maximum values of the total data, X is the original value and N is the already normalized value,
N = X max X X max X min
In order to show spatial distributions at the block level, each set of standard indicators was categorized into five levels per quantity given the nature and distribution of the data [39,44,51,53].
A correlation test for the input data must be performed before starting a Principal Component Analysis (PCA). Typically, a few associations between the measures may exist to justify the PCA, preventing multicollinearity. In practice, a correlation beginning with 0.3–0.4 to 0.8–0.9 is taken into consideration as accepted [53,54,55]. In addition, the Kaiser–Meyer–Olkin sample adequacy measure (KMO) was used. This indicates that if KMO > 0.8 the application of factorial analysis is warranted for PCA determination, KMO explains the proportion of variance in variables that may be caused by underlying factors [56,57,58,59].
The principal component analysis was performed in Excel (Microsoft) using the freeware add-in Real Statistics Resource Pack, a supplement that extends the basic statistical capabilities of Excel by offering advanced worksheet functions and data analysis software [60]—a similar tool was applied by [44].

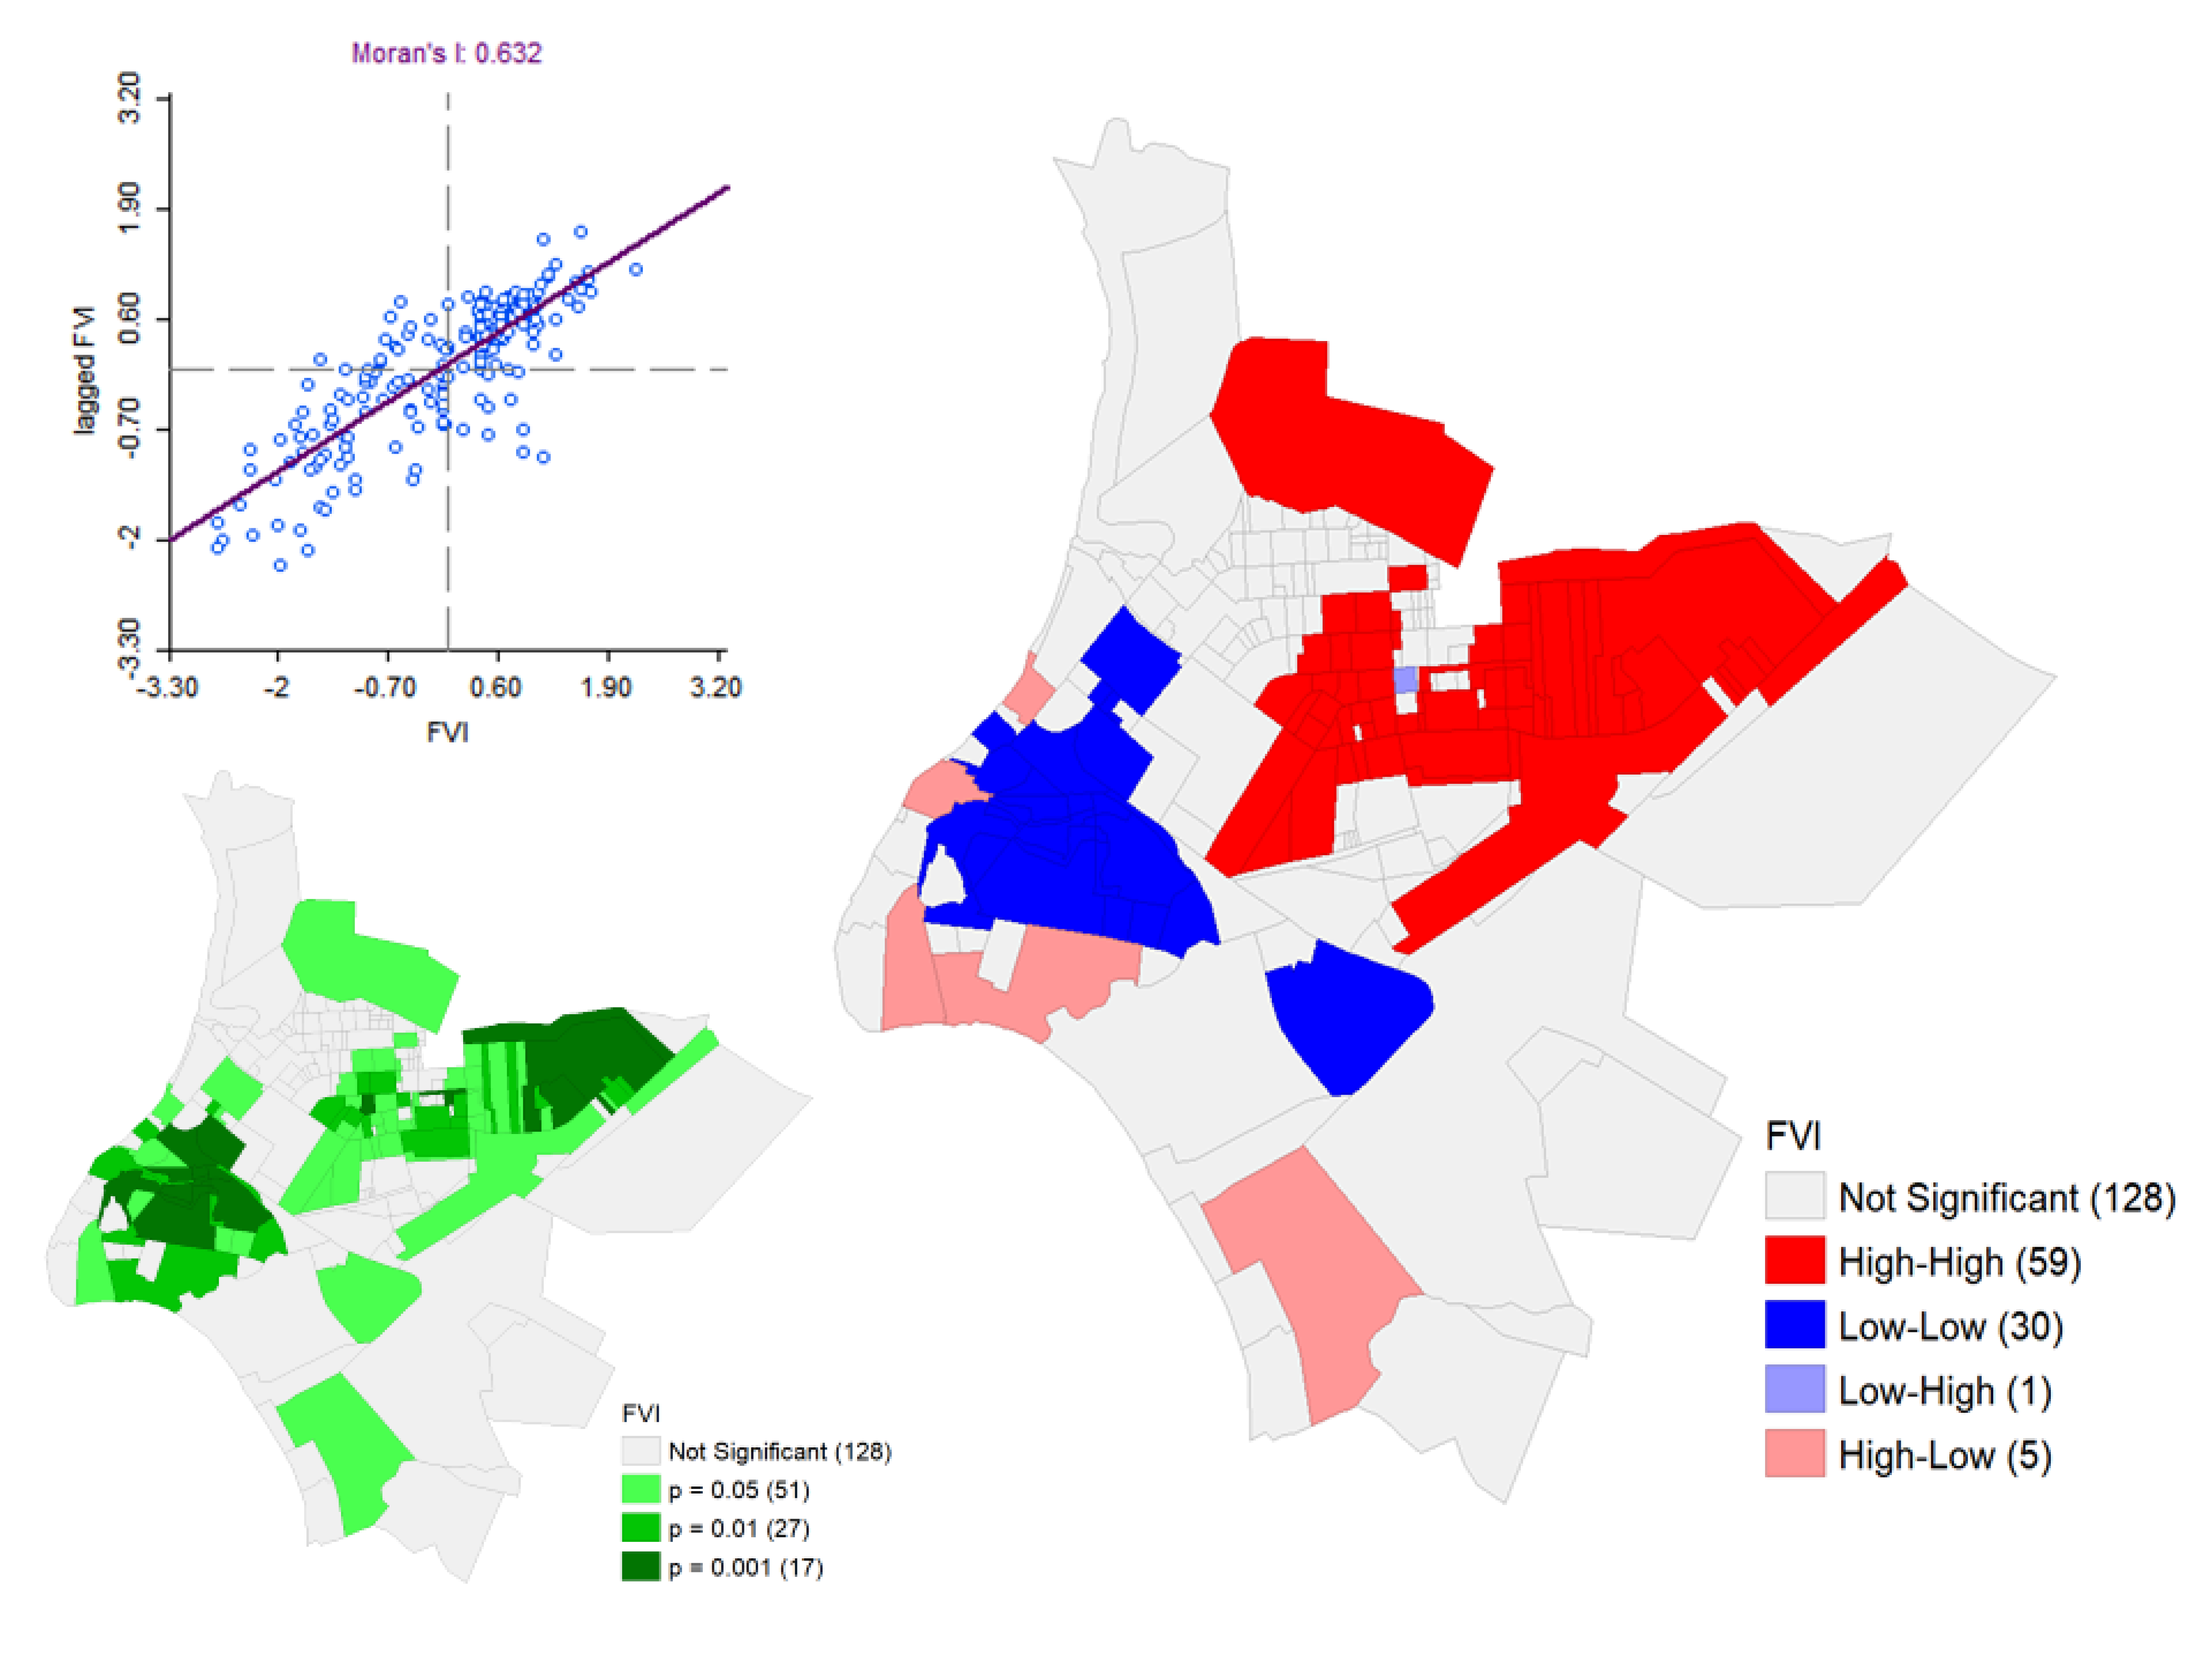
2.6. Spatial Autocorrelation and Local Spatial Identification Patterns (LISA)

Spatial autocorrelation is a statistical method that allows the analysis of a phenomenon’s behavior through the spatial units that make it up. This method indicates the degree to which, from a horizontal perspective, elements or processes in a spatial unit are identical to those adjacent or contiguous spatial units [61,62].
To evaluate the vulnerability index’s spatial distribution, the I Moran analysis was applied to the vulnerability index, which is within the range of −1 and 1 as indicated [50]. There are three situations: (i) Positive spatial auto-correlation: shows a propensity to group the geographical units, its index near 1, (ii) negative spatial autocorrelation: suggests a propensity to dispersion of geographical units and an index close to −1,on the other hand the third situation (iii) it indicates a random pattern in neighboring geographic units without autocorrelation, its index is about zero [51,63].
The study of spatial autocorrelation was quantitatively checked, by identifying local spatial recognition patterns (LISA). The geographical information systems obtained in Section 4.3 were generated using GeoDa software which is freely accessible and whose primary skill corresponds to spatial data analysis [64,65].

3. Results

3.1. Understanding the Vulnerability of the City: Exposure, Sensitivity, and Adaptive Capacity

The flood vulnerability index (FVI) composite was established as a function of indexes of exposure, sensitivity, and adaptive capacity at the urban sector level within the city of Duran (Figure 3). Table 2 shows the weights obtained for each variable using the PCA and EW analysis, respectively. The PCA yielded higher weights, the first four components account for more than 60% of the variance, thus PCA was used to obtain the FVI index. The PCA method allows for a better discrimination of weights factors and variance explanation than the EW method, these findings are confirmed by other researchers that have been used PCA for composite vulnerability index. Each component explains a proportion of the total variance and makes it easier to identify the underlying factors for the vulnerability [66,67,68].
Each component of the FVI, exposure, sensitivity and adaptive capacity were categorized in five levels using a normalization process that allow for the categorization of the variable from very high (5), to high (4), medium (3), low (2) and very low (1) value. Some of the variables used to determine the indexes are represented in the Figure 4; (a) population density with a maximum 350–100 inhabitants per ha, (b) flooding susceptibility with highest level at the northeast of the city, (c) percentage of households with wall material not concrete or brick, (d) percentage of households without access to public sewer system, (e) access to health and policy department.
The Exposure Index is related to the geomorphology, presence or absence of the flooding upon a specific urban sector. Elevation (Dem) is the most important factor for exposure (0.738), followed by flood susceptibility (0.654) related to the presence of flooding, and subsequently by population density. The highest level of exposure is associated with low lying lands and naturally flooding valleys less suitable for housing development [30].
Regarding the sensitivity index, the most important weight factors are the housing wall conditions (0.808), followed by access to piped water at the house (0.775), garbage collection service (0.759) and paved roads (0.723) which are city services. Demographic factors are in less proportion, such as the age dependency (0.508) and finally people with disabilities (0.444) and illiterate population (0.35). The sensitivity index contributes the highest weight to FVI, and is mostly dependent on the limited distribution of basic infrastructure and sanitation services, more than 40% of the population does not have access to paved roads, drinking water or sewage systems, 22% do not have access to garbage collection services and 15% do not have access to electricity. Moreover, high values in the standard deviation show that there is strong socio-economic inequality at the block level.
The adaptive capacity index shows an inverse relation with the variables and is mostly explained by the distance of the inhabitants to health, police and other city services (0.654); the larger the distance from these services, the lower the adaptive capacity of the urban sector. Other variables that weigh in this index are the access to health care service or social security (0.572), bachelors or higher level of education (0.543), access to technology such as internet (0.506) and percentage of professionals living in the urban sector (0.373). Only 20% of the population has access to public or private health insurance, and there is a low percentage of population (Y%) with a higher level of education.
Figure 5 shows the vulnerability maps for Duran using the EW and PCA methods, respectively. The pattern of spatial distribution is similar for both methods at the block level showing consistency in the results. Urban sectors of high and very high levels of vulnerability are located mainly at the northeast of the city, these sectors represent 40% of the city and have been occupied mainly by informal settlements during the last ten years. Low and very low levels of vulnerability are located southeast of the city in what is considered the consolidated downtown area, occupying 40% of the territory. Medium levels of vulnerability are concentrated to the southwest where new residential development area and industrial zone are located, covering 20% of city.

3.2. Selecting a Method for an Operational City Vulnerability Analysis

Applying either EW or PCA at the city level, the most vulnerable blocks are found in the northwest while the least vulnerable in the east and southeast of the city. Selecting the methods that municipalities can apply for interventions will depend on the information and knowledge that city officers and decision makers have of the city. It is important to highlight how the FVI is distributed within the city’s urban area. In Figure 6 PCA established that 34% of the city area are at high and very high levels of exposure and sensitivity.
The difference in results between the two selected methods is related to the weighting factor applied on the determination of composite indices. The final value of the flood vulnerability index for our first method (EW) was obtained from the arithmetic sum of three subscripts (E, S, CA)—each indicator had the same weight within each vulnerability subscript, and the exposure had the highest weight following the same criteria as a previous vulnerability analysis for the neighbor city of Guayaquil [24]. In the PCA method a single composite index was generated from the arithmetic sum of all the indicators. The weighting of the variables pointed out that the sensibility index has the greater impact on the final FVI, the walls or housing conditions and the city infrastructure being the main determinants of vulnerability at block level. Using the PCA method the first four components alone explained 61% of the variance of the data.
Figure 6 shows the components of the vulnerability index, the main cause of high exposure in the northwest corresponds to the natural physical conditions of the territory; that is, areas with high flood susceptibility either by soil type or its slope, in addition to the ground level that is below the flood level of 3.5 m above sea level. The high exposure in the northwest reflects the area where the largest number of flood events are concentrated, while in the southeast region the neighborhoods of the hills of the city (El Cerro Las Cabras, and El Cerro los Almendros) have low exposure levels of flooding associated with a level of terrain above the flood level.
The sensitivity index is related to the socioeconomic conditions of the population Figure 5a. Again, the northwest region shows high levels of sensitivity associated with sectors with informal settlements which do not have access to basic maintenance, infrastructure and health services; i.e., without access to electricity, drinking water, sewer systems or rainwater systems. In addition, the population under the age of 14 in conjunction with the population that does not know how to read or write is concentrated in the northwest sector, while the long-lived population tends to cluster in the urban area of the city.
The adaptive capacity index reveals a spatial distribution similar to exposure and sensitivity components. In the northwest there are low levels of adaptive capacity associated with nonfavorable social conditions such as lack of access to and/or proximity to health centers and police offices. In addition, the percentage of the population that has public or private health insurance in these sectors is very low, as is the percentage of the population with higher education. The opposite situation is the case in the southern and northeast of the city, which has a better infrastructure, and the population has better economic conditions, greater access to health insurance and higher levels of education.

4. Discussion

4.1. The Need of an Operational Framework for Cities and Municipalities in Ecuador: In the Policy Context

The current land use and climate change policy in Ecuador, states that subnational government is responsible to develop plans for land planning which should include an assessment of the vulnerability to multihazard risk, as well the climate actions for human settlements [14,69]. In this context, there are 221 municipalities in Ecuador that would need an operational vulnerability framework to be applied in their territory in a systematic and standardized format.
The methodology for the FVI, presented as part of the RESCLIMA project, was implemented as a demonstration site. The methodology is a hybrid of data-driven census combined with municipality reports, expert criteria of researchers and the city staff from different departments. In this study, we compared and PCA and EW, concluding that PCA better represents the reality of the vulnerability of Duran.
Using the scale of census block and subsequently aggregated to urban sector scale, the methodology provides a fine resolution map with the spatial distribution of the level of vulnerability across the city. Moreover, identifying the exposure, sensitivity and adaptive capacity or recovering spatial indexes as part of the vulnerability assessment, the city officers can develop specific measures for reducing exposure, increasing capacity, supporting recovery and developing long term strategies for climate change scenarios [70].
Overall, the results based on the vulnerability index reveals that the periurban sectors especially those located northwest of the city, have a very high level of vulnerability associated with informal settlements and lack of urban infrastructure. Informal settlements refer to a wide range of residential areas formed by communities housed in self-constructed shelters that are perceived as informal based on their legal status, their physical conditions, or both [71]. In the case of Duran, the municipality is implementing a process to give rights of land tenure only if the dwellings are in areas with acceptable levels of risk to hazards such as flooding and/or landslides.
In this study, we found that the exposure index is the main determinant of the FVI, followed by the sensitivity index. These high levels of vulnerability are related to the natural conditions (degradation of environmental services) of the sector and to the lack of urban design regulations. This lack of planning and regulation, coupled with a rapid population growth, has resulted in development of informal settlements [11,12], with a population density that no longer allows for the sustainable use of land. The proposed vulnerability framework would be improved if data on the economic impacts as well as losses and damages on the livelihoods and health of the communities can be included. The monetization of the damage would be a good indicator for decision makers to allocate resources in urban planning and disaster risk reduction.

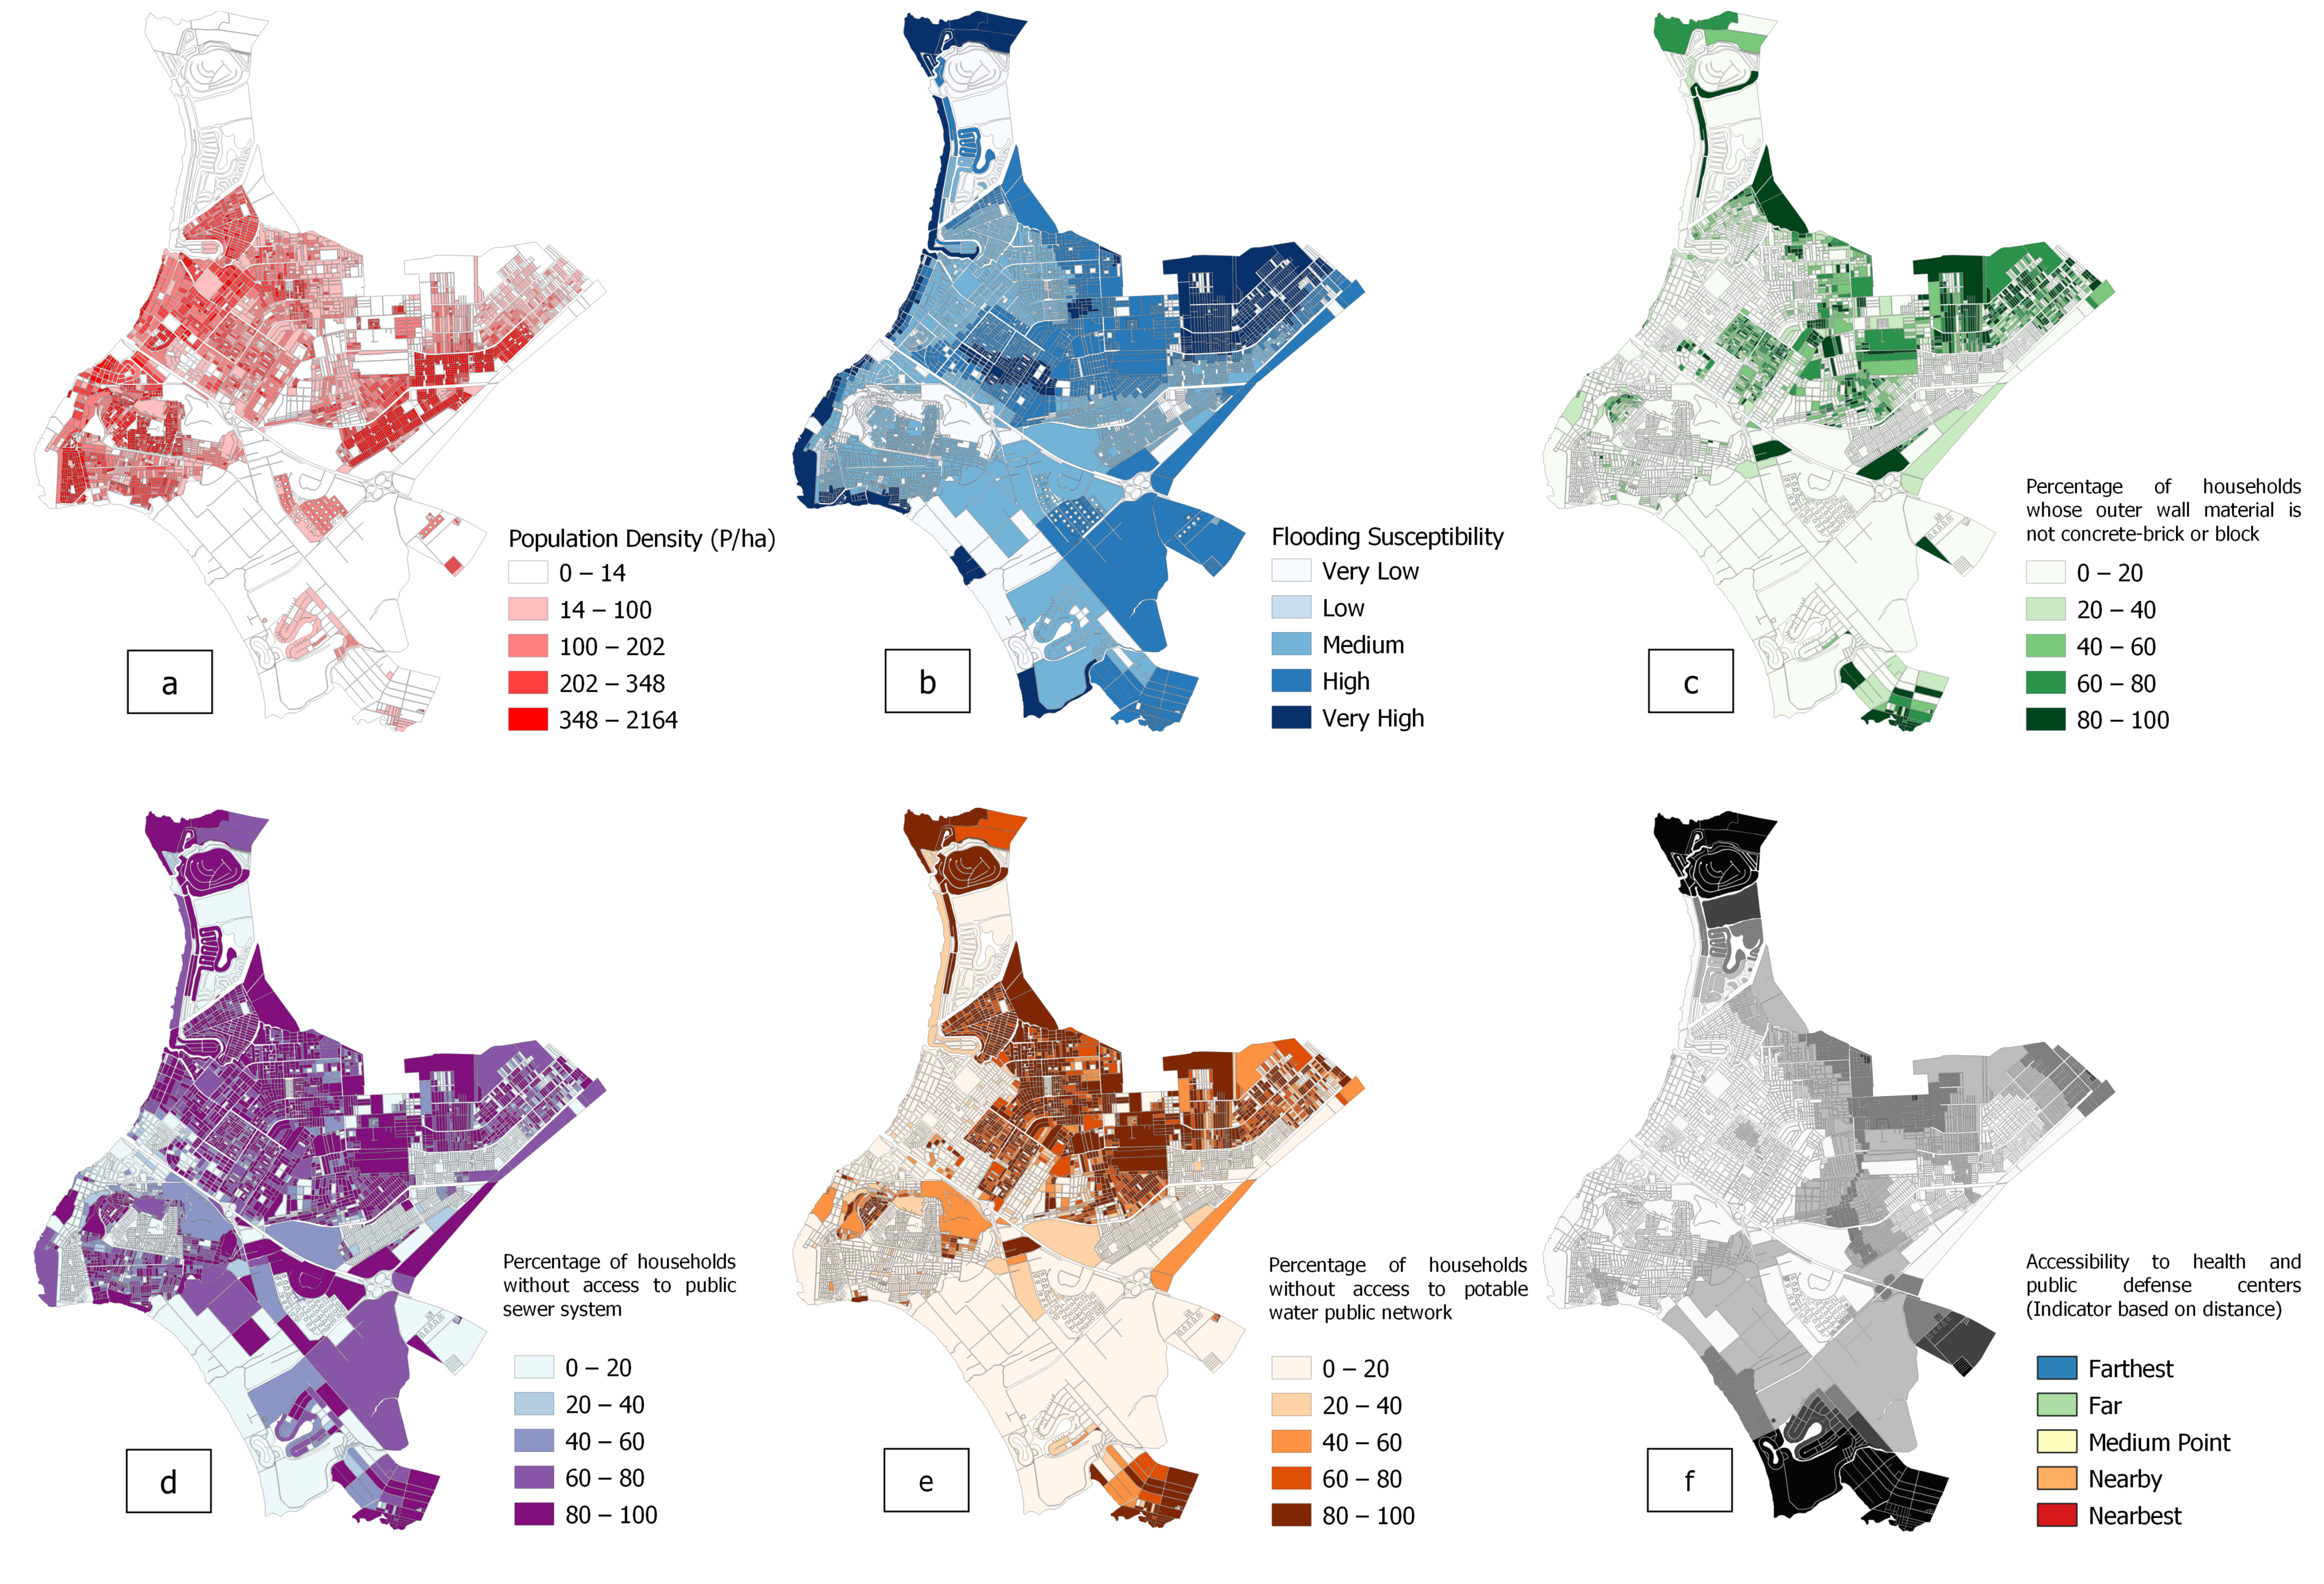
4.2. Underlying Drivers of Social Vulnerability to Flooding: Population and Informal Settlements

In Section 4.2 we explore the underlying drivers of the social vulnerability to the flooding events in the urban sectors. Figure 6 shows the determinants of vulnerability in different urban sectors of Duran, those sectors whose vulnerability rates were greater than 0.6 as represented in Figure 7; that is, those with high and very high levels of the FVI, together with the normalized population density index.
The urban sectors have been classified in regularized and informal settlements in Figure 8 (non-legalized). The existence and spatial distribution of these vulnerable sectors are related to the political history of urbanization, similar to many places in Latin America, housing programs from the government have been practically absent, leading to informal settlements [44]. National migration to Guayaquil and Duran, lead to the creation of “invasiones” (slums) on the periurban area of Duran, mostly wetlands or rice paddies. There are large areas of Duran, named “288 hectares, sector 1, 2, 3, and others” that are “invasiones”, some of which are in the process of regularization by the municipality.
In Table 3 we summarized the conditions for exposure, sensitivity and adaptive capacity for the “288 hectares (informal settlements)”, the lowlands conditions, bad housing, no access to city services such as water, sewage, social security and located a large distance from health and city offices. According to the census, inhabitants settled in these areas are usually young families [12,72]. In this case, exposure is high but the informality and lack of city services make the communities that live there highly vulnerable to flooding.
On the other hand, in the 1990s as part of a political campaign, the housing program called “Casa para Todos” was developed in what later was to become El Recreo (Table 3). This program included basic services for each house from the beginning of its implementation, however over time the number of families occupying many plots has increased, resulting in unplanned development in which the lack of technical drainage management, as well as waste and land filling at drainages sites has led to chronic flood events [73,74,75]. These conditions will be exacerbated during El Niño years and in the climate change scenarios. This research, along with other studies, stress that that flood vulnerability indexes need to be analyzed within the local socio-political context [76,77,78,79]. In this case, while El Recreo has city services, access to health centers and a higher adaptive capacity than other sectors, its exposure is high with inhabitants impacted by a chronic flooding related to unplanned development [80] and poor urban hydrology management [31].
Figure 8 shows a total of 37 non-legalized urban sectors (barrios), that are high and very highly vulnerable to flood, are greater in numbers that legalized barrios (12), while population density is lower in informal settlements compared to those in consolidated urban sectors. Considering specific context of each urban sector is important to develop adaptation measures and urban interventions.
This vulnerability analysis confirms that the governance arrangements of a city, such as the municipal services and infrastructure (e.g., roads, levies and sanitation), the changes in the urban landscape and ecological services as results of political decision making, the land use regulations and compliance and informality are underlying causes that increase the flood vulnerability [76]. While in the neighborhoods of 288 hectares, the city is not providing the infrastructure and services thus reducing the capacity of respond and recover to the flooding events; in the El Recreo neighborhood the unplanned urbanization growth, a weak institutional land planning and a combined overloaded storm and sewage water system make El Recreo still highly vulnerable to flooding almost every rainy season.

4.3. Spatial Distribution of the Flood Vulnerability Index

A cluster analysis was performed in this study with the aim of identifying the patterns of spatial association of urban sectors with high vulnerability, and also to identify atypical observations (outliers) of sites of high vulnerability [64]. The Moran Global Spatial Autocorrelation Index was 0.632, indicating a pattern of clusters of urban sectors with similar conditions. In the analysis at city scale, it is noted that all the northeast urban sectors are concentrated in the high–high quadrant. The Moran Local Space Autocorrelation Index grouped urban sectors into four categories that allow differentiated attention policies to be nurtured, in this case highlighting those sectors that should be considered by a decision-makers (Figure 9):
(i)
Cluster high–high shows urban sectors with a high FVI that have as neighbors’ other sectors also with high FVI. Applying a statistical confidence level of 0.95, a statistically significant cluster is observed that integrates 36% of the Duran’s urban sectors. This cluster includes all the areas of informal settlements which are highly sensitive to flooding as we analyzed in Section 4.2.
(ii)
The low–low urban sectors with low FIV and whose neighbors are in the same condition; however, within these sectors there is a population with precarious housing and socio-economic conditions, located in the skirt’s hills where basic infrastructure systems have not yet been built due land informality, suggesting that the vulnerability analysis needs to include the social-urban development context in the analysis.
(iii)
The high–low cluster, composed of urban sectors with FVI between medium and high that have experienced flood events even without rains but only with tidal events such as the Abel Gilbert sector, however with neighbors in the opposite situation. Some periurban areas such as Fincas Delia are also in this group because vulnerability is exacerbated in rural areas due to lack of city resources (adaptive capacity).
This brief analysis highlights the explanatory power of spatial analysis tools that outperform other statistical indicators which are traditionally used to analyze the complexity of vulnerability at neighborhood and city levels. These tools are useful for urban planners and decision-makers, the exclusion of the spatial variability of social vulnerability in the context of risk reduction strategies may lead to nonefficiency decisions.

4.4. Limitations and Further Risk Research

This study investigates the causes of vulnerability in the city of Duran in Ecuador, aiming to provide a methodological framework that can be applied to many other cities by municipalities and urban planners, however, some limitations of this study need to be addressed in future urban risk research and planning. In other words, this research can be used to develop a cost–benefit analysis in the presence of high-income inequality to help the urban planner in the development of strategies for the management of the most vulnerable and risky area.
However, we consider that the following factors need to be enhanced; (a) urban data related to the informal settlements were not included in census data due to their 10 year gap, during which time new informal settlements are developed in the periurban areas of the city, (b) more research is needed on peripheral urbanization and informality, local surveys and interviews with community stakeholders would help to better understand the underlying causes of vulnerability, (c) more detailed information on the infrastructure of the city, drainage, levies and storm water system is critical to better determine the level of exposure of neighborhoods. A limitation of this type of analysis is the lack of validation of the vulnerability by urban stakeholders, however, this may be misleading because of their subjectivity. Thus, identifying another set of indicators such as economic losses, morbidity/mortality in children and elders and community self-resilience needs to be considered in future research. In the current context of the COVID-19 pandemic it is critical to analyze how the social vulnerability is coevolving after the shocks and impacts on this new normality. Intermediate cities such as Duran are growing in number and extension across Ecuador and Latin America, many of them face the same urban risks and now the global pandemic, thus comparative analysis and lessons learned in vulnerability and risk studies are important from the perspective of climate change and sustainable development policy in the region.

5. Conclusions

The subnational governments and cities in Latin America, such as the Duran case presented in this study, have a critical role in establishing strategies for identifying, preventing and reducing the risks of disasters and for adapting to climate change. The determination of vulnerability and urban risks to different threats is a critical task that requires data integration, local knowledge and policy context. The vulnerability framework presented in this research needs to be complemented by an integrative and participatory process that ensures an increased resilience of the city. The main reflections obtained from this study that can be applied to the region are:
  • Rapid urbanization processes, due to different climatic, political and economic circumstances, has led to informal settlements in hazardous areas. City data and local context knowledge of these underlying factors is critical in order understand the complex dynamics of vulnerability and for developing sustainable urban planning, disaster risk reduction strategies and climate resilient cities.
  • Although we promote the use of census-based indicators for vulnerability assessments at the city and neighborhood levels, we conclude that census data alone is not enough to understand the sensitivity and adaptive capacity of the system. Unplanned housing development, overloading of storm water systems, illegal connections to sewage systems and weak city governance may exacerbate the risks of flooding and other urban risks.
  • It is critical to strengthen the governance of the city with its different urban actors and articulate with academia and other national actors in order to reduce the vulnerability of cities to the risks of urban disasters, and develop strategies for adaptation and recovery in the face of climate change.
  • The experience of the RESCLIMA project, a coordinated effort between a local government and academia, has enhanced the integration of local municipal information and assisted in decision-making and establishing a dialogue processes between its institutional, social and productive actors.
  • While cities are a part of ecosystems, ecosystems are not considered in urban planning. Cities must integrate coastal ecosystem services (mangroves, forests, wetlands, etc.) into urban and landscape design, and hazard and exposure analysis need to be considered in their future scenarios of development.
The next steps for the implementation of the flood vulnerability framework are to link the urban planning in a broader context of climate change adaptation and resilience. This requires the capacity of urban planners, city officers and decision makers in how to apply the vulnerability framework to the urban land planning and ongoing city initiatives to be enhanced. In the case of Duran, a new process of how social vulnerability would explain the impacts of other shocks such as the COVID-19 pandemic is evolving, the evidence of what would be and effective and efficient multisectorial approach will be assessed.

Author Contributions

Conceptualization, M.J.B.-C. and A.A.V.-A.; methodology, M.J.B.-C., G.G., F.V., A.P. and A.A.V.-A.; validation and ground truth, M.A.-H., D.M., G.M.-A., G.G. and I.N.; formal analysis, M.J.B.-C., G.G. and A.A.V.-A.; investigation, F.V., A.A.V.-A. and G.G.; writing—original draft preparation, M.J.B.-C. and G.G.; writing—review and editing, all authors; visualization, G.G.; project administration, M.d.P.C.-R.; funding acquisition, M.J.B.-C., M.d.P.C.-R., G.M.-A. and A.A.V.-A. All authors have read and agreed to the published version of the manuscript.

Funding

This research was funded by the Municipality of Duran and the Escuela Superior Politecnica del Litoral (ESPOL), as part of the project RESCLIMA executed by the Pacific International Center for Disaster Risk Reduction (CIP-DRR).

Acknowledgments

Many thanks to Ashley Casierra, Rommel Caiza, Gabriel Mantilla and Annabell Constantine who help in the fieldwork, mapping, and data processing. We also appreciate the information technology contribution of Daniel Ochoa, the media production of Ronald Villafuerte, and early language editing of Bart Daly and the administrative support of Andrea E. Vega.

Conflicts of Interest

The authors declare no conflict of interest.

Appendix A. Flood Vulnerability at Representative Sectors in Duran

Figure A1. The high and very high level of vulnerability were identified at the informal settlements, a representative sector of the city are the neighborhoods called “288 hectares” (Non regularized). Those areas are characterized by high levels of exposure related with the low lands and recurrence of flooding; high level of sensitivity because of their precarious housing conditions, lack of services and infrastructure; and low adaptive capacity related with level of education and limited community organization.
Sustainability 12 10292 g0a1
Figure A2. The neighborhood named El Recreo (regularized) are part of a housing program with services and city infrastructure with a medium level of vulnerability. However, those neighborhoods experience a chronic seasonal flooding because of the overloading of the storm water system, construction of additional story buildings in the same plot, and finally due to the influence of the tides that it was not considered in the sewage and drainage design. Ground truth and local context is needed to identify the underlying causes of flood vulnerability.
Sustainability 12 10292 g0a2

References

  1. Bulkeley, H.; Casta, V. A survey of urban climate change experiments in 100 cities. Glob. Environ. Chang. 2013, 23, 92–102. [Google Scholar] [CrossRef] [Green Version]
  2. Dawson, R.J.; Khan, M.S.A.; Gornitz, V.; Lemos, M.F.; Atkinson, L.; Pullen, J.; Osorio, J.C. Urban Areas in Coastal Zones. In Climate Change and Cities: Second Assessment Report of the Urban Climate Change Research Network; Rosenzweig, C., Solecki, W., Romero-Lankao, P., Mehrotra, S., Dhakal, S., Ali Ibrahim, S., Eds.; Cambridge University Press: New York, NY, USA, 2018; pp. 319–362. [Google Scholar]
  3. Hallegatte, S.; Green, C.; Nicholls, R.J.; Corfee-morlot, J. Future flood losses in major coastal cities. Nat. Clim. Chang. 2013, 3, 802–806. [Google Scholar] [CrossRef]
  4. Masson, V.; Marchadier, C.; Adolphe, L.; Aguejdad, R.; Avner, P.; Bonhomme, M.; Bretagne, G.; Briottet, X.; Bueno, B.; Munck, C. De Urban Climate Adapting cities to climate change: A systemic modelling approach. Urban Clim. 2014, 10, 407–429. [Google Scholar] [CrossRef]
  5. Wong, P.P.; Losada, I.J.; Gattuso, J.-P.; Hinkel, J.; Khattabi, A.; McInnes, K.L.; Saito, Y.; Sallenger, A. Coastal systems and low-lying areas. In Climate Change 2014: Impacts, Adaptation, and Vulnerability. Part A: Global and Sectoral Aspects. Contribution of Working Group II to the Fifth Assessment Report of the Intergovernmental Panel on Climate Change; Cambridge University Press: Cambridge, UK; New York, NY, USA, 2014; pp. 361–409. [Google Scholar]
  6. IPCC. Cambio climático 2014-Impactos, adaptación y vulnerabilidad. Resum. Para Las Responsab. Politicas 2014, 33. [Google Scholar] [CrossRef]
  7. Herath, H.M.M.; Wijesekera, N.T.S. A State-of-the-Art Review of Flood Risk Assessment in Urban Area. IOP Conf. Ser. Earth Environ. Sci. 2019, 281. [Google Scholar] [CrossRef]
  8. Meng, M.; Dabrowski, M.; Stead, D. Enhancing flood resilience and climate adaptation: The state of the art and new directions for spatial planning. Sustainability 2020, 12, 7864. [Google Scholar] [CrossRef]
  9. United Nations Office for Disaster Risk Reduction. Making Development Sustainable: The Future of Disaster Risk Management; United Nations Office for Disaster Risk Reduction (UNISDR): Geneva, Switzerland, 2015. [Google Scholar]
  10. Gobierno Autónomo Descentralizado del Cantón Durán Plan Estratégico Institucional. 2013. Available online: http://app.sni.gob.ec/snilink/sni/PORTAL_SNI/data_sigad_plus/sigadplusdiagnostico/0960001890001_PDOT%20Dur%C3%A1n%20Diagn%C3%B3stico%200960001890001_15-03-2015_09-33-07.pdf (accessed on 1 December 2020).
  11. INEC Empleo (Encuesta Nacional de Empleo, Desempleo y Subempleo-ENEMDU); Instituto Nacional de Estadísticas y Censos (INEC): Quito-Ecuador, Ecuador, 2016; pp. 47–63.
  12. INEC Resultados Censo 2010 de Población y Vivienda del Ecuador. Instituto Nacional de Estadística y Censos (INEC). Quito–Ecuador. 2010. Available online: https://www.ecuadorencifras.gob.ec/wp-content/descargas/Manu-lateral/Resultadosprovinciales/guayas.pdf (accessed on 20 October 2019).
  13. GAD Durán. PLAN DE DESARROLLO Y ORDENAMIENTO TERRITORIAL; Geografia Urbana: Durán, Ecuador, 2015. [Google Scholar]
  14. Reglamento al Código Orgánico del Ambiente; Lexis Finder: Quito, Ecuador, 2019; Volume 752, pp. 1–192.
  15. Gálvez, H.; Regalado, J. Comportamiento de las Precipitaciones en la Costa Ecuatoriana en el 2008. Acta Oceanográfica Del Pacífico; INOCAR: Guayaquil, Ecuador, 2009; pp. 3–6. [Google Scholar]
  16. Stenfert, J.G.; Rubaij Bouman, R.M.; Tutein Nolthenius, R.C.; Joosten, S. Flood Risk Guayaquil: A Critical Analysis on Inundations; Delft University of Technology, Department of Hydraulic Engineering, Faculty of Civil Engineering: Delft, The Netherlands, 2017. [Google Scholar]
  17. De Risi, R.; Jalayer, F.; De Paola, F.; Carozza, S.; Yonas, N.; Giugni, M.; Gasparini, P. From Flood Risk Mapping toward Reducing Vulnerability: The Case of Addis Ababa. Nat. Hazards 2020, 100, 387–415. [Google Scholar] [CrossRef] [Green Version]
  18. Zapata, C.; Puente, A.; García, A.; García-Alba, J.; Espinoza, J. The use of hydrodynamic models in the determination of the chart datum shape in a tropical estuary. Water 2019, 11, 902. [Google Scholar] [CrossRef] [Green Version]
  19. Espinoza, M.E. Gulf of Guayaquil Tidal Simulation Using Delft3D Hyrodinamic Model During an El Niño Event and Normal Conditions. Bachelor´s Thesis, Escuela Superior Politécnica del Litoral, Facultad de Ingeniería Marítima y Ciencias del Mar, Guayaquil, Ecuador, 2018; p. 69. [Google Scholar]
  20. Van Amerongen, D.; Mariotto, A.; Kaplan, M.G.; Guadagnoli, E. Appropriateness of coronary angiography after myocardial infarction among Medicare beneficiaries. Managed care versus fee for service. N. Engl. J. Med. 2001, 344, 774–775. [Google Scholar] [CrossRef]
  21. IPCC. Cambio Climático 2007; Informe de síntesis. Contribución de los Grupos de trabajo I, II y III al Cuarto Informe de evaluación del Grupo Intergubernamental de Expertos sobre el Cambio Climát; IPCC: Geneva, Switzerland, 2007; ISBN 9291693227. [Google Scholar]
  22. Wilhelmi, O.V.; Hayden, M.H. Connecting people and place: A new framework for reducing urban vulnerability to extreme heat. Environ. Res. Lett. 2010, 5. [Google Scholar] [CrossRef]
  23. Nasiri, H.; Yusof, M.J.M.; Ali, T.A.M.; Hussein, M.K.B. District flood vulnerability index: Urban decision-making tool. Int. J. Environ. Sci. Technol. 2019, 16, 2249–2258. [Google Scholar] [CrossRef] [Green Version]
  24. CAF. Índice de Vulnerabilidad y Adaptación al Cambio Climático en la Región de América Latina y el Caribe; Corporacion Andina de Fomento (CAF): Caracas, Venezuela, 2014. [Google Scholar]
  25. Stennett-Brown, R.K.; Stephenson, T.S.; Taylor, M.A. Caribbean climate change vulnerability: Lessons from an aggregate index approach. PLoS ONE 2019, 14, e0219250. [Google Scholar] [CrossRef] [PubMed] [Green Version]
  26. Noriega, O.; Rojas, Y.G.; Barrios, J.R. Análisis de la vulnerabilidad y el riesgo a inundaciones en la cuenca baja del río Gaira, en el Distrito de Santa Marta. Prospectiva 2011, 9, 93–102. [Google Scholar]
  27. Choez, B.D.B.; Ríos, S.J.C.; Del Valle, D.J.M. Analysis of the vulnerability to flooding in the Santa Ana de Vuelta larga Parish, province of Manabi, Ecuador. Investig. Geogr. 2019. [Google Scholar] [CrossRef]
  28. CIFFEN Estrategia Provincial del Cambio Climatico- Implementación de un Sistema de Información de Vulnerabilidad Sectorial de la Provincia de Guayas Frente al Cambio y la Variabilidad Climatica; Gobierno Autónomo Descentralizado Provincial del Guayas, Dirección de Medio Ambiente: Guayaquil, Ecuador, 2012.
  29. OECD. Handbook on Constructing Composite Indicators: Methodology and User Guide; OECD: Paris, France, 2008; ISBN 9789264043459. [Google Scholar]
  30. Fritzsche, K.; Schneiderbauer, S.; Bubeck, P.; Kienberger, S.; Buth, M.; Zebisch, M.; Kahlenborn, W. El Libro de la Vulnerabilidad. Concepto y Lineamientos Para la Evaluación Estandarizada de la Vulnerabilidad; Deutsche Gesellschaft für Internationale Zusammenarbeit (GIZ) GmbH: Bonn y Eschborn, Germany, 2017. [Google Scholar]
  31. Menezes, J.A.; Confalonieri, U.; Madureira, A.P.; De Brito Duval, I.; Dos Santos, R.B.; Margonari, C. Mapping human vulnerability to climate change in the Brazilian Amazon: The construction of a municipal vulnerability index. PLoS ONE 2018, 13, e0190808. [Google Scholar] [CrossRef] [Green Version]
  32. Brenkert, A.L.; Malone, E.L. Modeling vulnerability and resilience to climate change: A case study of India and Indian states. Clim. Chang. 2005, 72, 57–102. [Google Scholar] [CrossRef]
  33. Bigi, V.; Pezzoli, A.; Comino, E.; Rosso, M. A Vulnerability Assessment in Scant Data Context: The Case of North Horr Sub-County. Sustainability 2020, 12, 6024. [Google Scholar] [CrossRef]
  34. Defne, Z.; Aretxabaleta, A.L.; Ganju, N.K.; Kalra, T.S.; Jones, D.K.; Smith, K.E.L. A geospatially resolved wetland vulnerability index: Synthesis of physical drivers. PLoS ONE 2020, 15, e0228504. [Google Scholar] [CrossRef] [Green Version]
  35. de Almeida, L.Q.; de Araujo, A.M.S.; Welle, T.; Birkmann, J. DRIB Index 2020: Validating and enhancing disaster risk indicators in Brazil. Int. J. Disaster Risk Reduct. 2020, 42. [Google Scholar] [CrossRef]
  36. Papathoma-Köhle, M.; Cristofari, G.; Wenk, M.; Fuchs, S. The importance of indicator weights for vulnerability indices and implications for decision making in disaster management. Int. J. Disaster Risk Reduct. 2019, 36, 101103. [Google Scholar] [CrossRef]
  37. Bao, J.; Li, X.; Yu, C. The construction and validation of the heat vulnerability index, a review. Int. J. Environ. Res. Public Health 2015, 12, 7220–7234. [Google Scholar] [CrossRef] [PubMed] [Green Version]
  38. Papathoma-Köhle, M.; Schlögl, M.; Fuchs, S. Vulnerability indicators for natural hazards: An innovative selection and weighting approach. Sci. Rep. 2019, 9, 1–14. [Google Scholar] [CrossRef]
  39. Sitaula, B.K. Quantitative Assessment of Vulnerability to Climate Change in Rural Municipalities of Bosnia and Herzegovina. Sustainability 2017, 9, 1208. [Google Scholar] [CrossRef] [Green Version]
  40. Flores, C.M.F.; Hernández, V.H. Segregación socioespacial y accesibilidad al empleo en Ciudad Juárez, Chihuahua (2000–2004). Región y Sociedad 2015, 25. [Google Scholar] [CrossRef]
  41. Gbetibouo, G.A.; Ringler, C. Mapping South African Farming Sector Vulnerability to Climate Change and Variability: A Subnational Assessment; International Food Policy Research Institute (IFPRI): Washington, DC, USA, 2009; pp. 2–4. [Google Scholar]
  42. Martínez-noriegas, H.A.; Medrano-broche, B.E.; Fernández-, L.; Tejeda-rodríguez, Y.E.; Introducción, I. Análisis Multivariado De Datos Como Soporte a La Decisión En La Selección De Estudiantes En Proyectos De Software/Multivariate Data Analysis as Decision Making Support in Student Selection in Software Projects. Ing. Ind. 2013, 34, 130–142. [Google Scholar]
  43. Kirby, R.H. Measuring Social Vulnerability to Environmental Hazards in the Dutch Province of Zeeland. Master’s Thesis, Louisiana State University, Baton Rouge, LA, USA, 2015. [Google Scholar]
  44. Inostroza, L.; Palme, M.; De La Barrera, F. A heat vulnerability index: Spatial patterns of exposure, sensitivity and adaptive capacity for Santiago de Chile. PLoS ONE 2016, 11, e0162464. [Google Scholar] [CrossRef] [Green Version]
  45. Dickin, S.K.; Schuster-Wallace, C.J.; Elliott, S.J. Developing a Vulnerability Mapping Methodology: Applying the Water-Associated Disease Index to Dengue in Malaysia. PLoS ONE 2013, 8, e63584. [Google Scholar] [CrossRef] [Green Version]
  46. I Care Environnement. Vulnerabilidad y Adaptación al Cambio Climático en Guayaquil; CAF: Caracas, Venezuela, 2018; ISBN 9789804220999. [Google Scholar]
  47. Libélula Comunicación, Ambiente y Desarrollo Sac. Vulnerabilidad en Arequipa al Cambio Climático y Adaptación Metropolitana; CAF: Caracas, Venezuela, 2018; ISBN 9789804220609. [Google Scholar]
  48. Fekete, A. Validation of a social vulnerability index in context to river-floods in Germany. Nat. Hazards Earth Syst. Sci. 2009, 9, 393–403. [Google Scholar] [CrossRef] [Green Version]
  49. Factor Ideas Integral Services, S.L. Vulnerabilidad y adaptación al cambio climático en São Paulo. Caracas: CAF. 2018. Available online: http://scioteca.caf.com/handle/123456789/1349. (accessed on 1 December 2020).
  50. Stewart-ibarra, A.M.; Muñoz, Á.G.; Ryan, S.J.; Ayala, E.B.; Borbor-cordova, M.J. Spatiotemporal clustering, climate periodicity, and social-ecological risk factors for dengue during an outbreak in Machala, Ecuador, in 2010. BMC Infect. Dis. 2014, 1–16. [Google Scholar] [CrossRef] [Green Version]
  51. Zulaica, L.; Celemín, P. Análisis Territorial de las Condiciones de Habitabilidad en el Periurbano de la Ciudad de Mar del Plata (Argentina), a Partir de la Construcción de un Indice y de la Aplicación de Métodos de Asociación Espacial; Revista de Geografía: Norte Grande, Chile, 2008; pp. 129–146. [Google Scholar]
  52. Mancilla Flores, E.M. Aplicación del Redatam; Revista Varianza: La Paz, Bolivia, 1997; pp. 8–14. [Google Scholar]
  53. Xenarios, S.; Nemes, A.; Sarker, G.W.; Sekhar, N.U. Assessing vulnerability to climate change: Are communities in flood-prone areas in Bangladesh more vulnerable than those in drought-prone areas? Assessing vulnerability to climate change: Are communities in flood-prone areas in Bangladesh more vulnerab. Water Resour. Rural Dev. 2016, 7, 1–19. [Google Scholar] [CrossRef]
  54. Wajda, Ł.; Duda-Chodak, A.; Tarko, T.; Kamiński, P. Application of principal component analysis for the optimisation of lead(II) biosorption. World J. Microbiol. Biotechnol. 2017, 33, 1–10. [Google Scholar] [CrossRef] [PubMed] [Green Version]
  55. Beaumont, R. An Introduction to Principal Component Analysis & Factor Analysis Using SPSS 19 and R (psych Package). 2012. Available online: http://assessment-matters.weebly.com/blogs/an-introduction-toprincipal-component-analysis-factor-analysisusing-spss-19-and-r-psych-package (accessed on 15 May 2020).
  56. Sánchez, C.S.-G.; Nuñez Peiró, M.; Neila González, F.J. Isla de Calor Urbana y Población Vulnerable. El Caso De Madrid Sur; Universidad de Sevilla, Escuela Técnica Superior de Arquitectura: Sevilla, España, 2017; pp. 545–556. [Google Scholar]
  57. Enrique, J.; Bohórquez, T.; Enrique, J.; Bohórquez, T. Evaluación de la vulnerabilidad social ante amenazas naturales en Manzanillo (Colima). Un aporte de método; UNAM: Mexico City, Mexico, 2013; pp. 79–93. [Google Scholar]
  58. Salinas, P.H.; Albornoz, V.J.; Reyes, P.A.; Erazo, B.M.; Ide, V.R. Análisis de componentes principales aplicado a variables respecto a la mujer gestante en la región de las Américas. Rev. Chil. De Obstet. Y Ginecol. 2006, 71, 17–25. [Google Scholar] [CrossRef] [Green Version]
  59. Cisneros, J.C.; Maribel, K.; Chimbo, O.; Trejo, C.A. Análisis factorial exploratorio como método multivariante para validación de datos académicos en plataformas virtuales; Revista Lasallista de Investigación: Caldas, Colombia, 2018; Volume 15. [Google Scholar] [CrossRef]
  60. Louloudis, G. The Worth of Hydro Geochemical Data Factor Analysis (PCA) in Interpretation of Underground Water Origin. Megalopolis Lignite Bearing Fields Mine Water and Regional Waters Relations Case Study. In Proceedings of the 15th International Conference on Environmental Science and Technology, Rhodes, Greece, 31 August–2 September 2017; pp. 72–82. [Google Scholar]
  61. Garrocho, C.; Socioecon, D.G.; Campos-alanís, J.; Socioecon, D.G. Análisis espacial de los inmuebles dañados por el sismo 19S-2017 en la Ciudad de México. Salud Pública, México 2018, 60, 31–40. [Google Scholar] [CrossRef]
  62. Consuelo, A.C.; Rangel, C.G.; Alanís, J.C. Análisis espacial de la segregación residencial de adultos mayores en la Zona Metropolitana del Valle de Toluca. Rev. De Urban. 2016, 27–45. [Google Scholar] [CrossRef] [Green Version]
  63. Zulaica, L.; Ferraro, R. Vulnerability and Sustainability Dimensions in One Area of Mar de Plata Peri-Urban; Rev. De Geogr.: Mar del Plata, Argentina, 2010; pp. 197–219. [Google Scholar]
  64. Anselin, L. Interactive Techniques and Exploratory Spatial Data Analysis. 1996. Available online: https://www.geos.ed.ac.uk/~gisteac/gis_book_abridged/files/ch17.pdf (accessed on 10 January 2020).
  65. Anselin, L.; Syabri, I.; Kho, Y. GeoDa: An Introduction to Spatial Data Analysis. In Geographical Analysis; Department of Geography, University of Illinois: Champaign, IL, USA, 2006; Volume 38, pp. 5–22. [Google Scholar]
  66. Wang, F.; Xu, Z.; Sun, R.; Gong, Y.; Liu, G.; Zhang, J.; Wang, L.; Zhang, C.; Fan, S.; Zhang, J. Genetic dissection of the introgressive genomic components from Gossypium barbadense L. that contribute to improved fiber quality in Gossypium hirsutum L. Mol. Breed. 2013, 32, 547–562. [Google Scholar] [CrossRef]
  67. Abdi, H.; Williams, L.J. Principal component analysis. Wiley Interdiscip. Rev. Comput. Stat. 2010, 2, 433–459. [Google Scholar] [CrossRef]
  68. Chen, T.; Wilson, L.T.; Liang, Q.; Xia, G.; Chen, W.; Chi, D. Influences of irrigation, nitrogen and zeolite management on the physicochemical properties of rice. Arch. Agron. Soil Sci. 2017, 63, 1210–1226. [Google Scholar] [CrossRef]
  69. Reglamento de Ley de Ordenamiento Territorial, Uso y Gestión de Suelo; Lexis Finder: Quito, Ecuador, 2019; pp. 1–30.
  70. Lankao, P.R.; Nychka, D.; Tribbia, J. Development and greenhouse gas emissions deviate from the ‘modernization’ theory and ‘convergence’ hypothesis. Clim. Res. 2008, 38, 17–29. [Google Scholar] [CrossRef]
  71. Lampis, A.; Fraser, A. The Global Urban Economic Dialogue Series Climate Change; United Nations Human Settlements Programme (UN-HABITAT): Nairobi, Kenya, 2012; ISBN 9789211320275. [Google Scholar]
  72. Castillo, R.; Jácome, F. Medición de la Pobreza Multidimensional en Ecuador, Capítulo 10, Reporte de pobreza por consumo 2006–2014; INEC: Quito, Ecuador, 2015; pp. 352–366. ISBN 978-9942-22-026-4. [Google Scholar]
  73. Ran, J.; MacGillivray, B.H.; Gong, Y.; Hales, T.C. The application of frameworks for measuring social vulnerability and resilience to geophysical hazards within developing countries: A systematic review and narrative synthesis. Sci. Total Environ. 2020, 711, 134486. [Google Scholar] [CrossRef]
  74. Xiong, J.; Li, J.; Cheng, W.; Wang, N.; Guo, L. A GIS-based support vector machine model for flash flood vulnerability assessment and mapping in China. ISPRS Int. J. Geo-Inf. 2019, 8, 297. [Google Scholar] [CrossRef] [Green Version]
  75. Müller, A.; Reiter, J.; Weiland, U. Assessment of urban vulnerability towards floods using an indicator-based approach-a case study for Santiago de Chile. Nat. Hazards Earth Syst. Sci. 2011, 11, 2107–2123. [Google Scholar] [CrossRef] [Green Version]
  76. Romero-Lankao, P.; Hughes, S.; Qin, H.; Hardoy, J.; Rosas-Huerta, A.; Borquez, R.; Lampis, A. Scale, urban risk and adaptation capacity in neighborhoods of Latin American cities. Habitat Int. 2014, 42, 224–235. [Google Scholar] [CrossRef]
  77. Chen, W.; Cutter, S.L.; Emrich, C.T.; Shi, P. Measuring social vulnerability to natural hazards in the Yangtze River Delta region, China. Int. J. Disaster Risk Sci. 2013, 4, 169–181. [Google Scholar] [CrossRef] [Green Version]
  78. Friedmann, J.; Miller, J. The Urban field. Urban Theory 2017, 73–94. [Google Scholar] [CrossRef]
  79. Wölfer, R. Analysis of the Subsurface Urban Drainage Systems for Durán City, Ecuador. Master’s Thesis, Magdeburg-Stendal University of Applied Sciences, Magdeburg, Germany, 2019. [Google Scholar]
  80. Koks, E.E.; Jongman, B.; Husby, T.G.; Botzen, W.J.W. Combining hazard, exposure and social vulnerability to provide lessons for flood risk management. Environ. Sci. Policy 2015, 47, 42–52. [Google Scholar] [CrossRef]
Figure 1. (a) Occurrence of flooding events and landslides at Duran city (1970–2018), Source: DesInventar database. (b,c) Uncontrolled urban growth between 2003 and 2018 Source: Google Earth.
Sustainability 12 10292 g001
Figure 2. Location of Duran, intermediate city that provides access to Guayaquil areas.
Sustainability 12 10292 g002
Figure 3. Conceptual Flood Reference Framework, 2015, Development: RESCLIMA Project, 2018.
Sustainability 12 10292 g003
Figure 4. Spatial distribution of some of the variables used in the indexes of exposure, sensitivity and adaptive capacity that were integrated in the Flood Vulnerability Index (FVI). The variables (a,b) are part of the exposure; (ce) are part of sensitivity and (f) is part of adaptive capacity.
Sustainability 12 10292 g004
Figure 5. Flood Vulnerability Index Maps applying (a) Equal Weighting (EW) and (b) Principal Component Analysis (PCA), respectively.
Sustainability 12 10292 g005
Figure 6. Flood vulnerability index at urban sectors is constructed based on (a) exposure of the urban sectors to flood intensity and frequency, (b) sensitivity associated to urban demography, housing conditions and urban infrastructure and (c) adaptive capacity related to education, community resources and access to health and police centers.
Sustainability 12 10292 g006
Figure 7. Urban sectors (neighborhood) with high and very high vulnerability at Duran.
Sustainability 12 10292 g007
Figure 8. List of most vulnerable sectors of Duran, description of the level of FVI and population density exposed.
Sustainability 12 10292 g008
Figure 9. I Moran Analysis, LISA to identify the patterns of spatial association with vulnerability levels.
Sustainability 12 10292 g009
Table 1. Selected indicator to assess the flood vulnerability index (FVI). a Data extracted from: National Risk Management Service of Ecuador (SNGRE) Ecuador 2015, Desinventar, Duran Municipality and Census 2010b, b,c Data extracted from: Census, INEC 2010.
Indexes Description
aExposureSusceptibility to flooding (SF 100 yrs)
Occurrence of at least one flood event (yes-1, no-0) (Flo Eve)
Digital Elevation Models (DEM)
Population density (Pop Dens)
bSensitivity or
susceptibility
Percentage of population that cannot read or write (%Pop illit)
Percentage of disabled population (%Pop Disab)
Percentage of the population that is not economically active (People under the age of 14 and over 65, relative to the total population) (%Dep Age)
Percentage of homes that do not have access to cobbled or concrete streets or roads (%Hou way)
Percentage of homes whose external wall material is not concrete-brick or block (%Hou wall)
Percentage of homes without access to safe drinking water by public network (%Houwater)
Percentage of homes without access to public sewerage system (%Hou sewar)
Percentage of homes without access to electricity (%Hou elect)
Percentage of homes without garbage collection system per collection cart (%Hou garba)
cAdaptive capacityPercentage of population with access to public or private health insurance (%Pop healt)
Percentage of population that has access to communication technologies, population that used telephone or internet (highest value variable is selected) (%Pop techn)
Percentage of the population whose level of education is post-baccalaureate, higher or postgraduate validated by the national education system. (%Pop educates)
Percentage of population engaged in administrative, support, public administration defense and human health care activities (%Pop actHD)
Access to health and public defense facilities, depending on distance. The closer the centroid is to one block from these facilities, the less the vulnerability (Pop acces)
Table 2. Statistical data and weights according to the principal component analysis (PCA) and equal weighting (EW) methods.
Components VariablesW (PCA)W (EW)MeanSd
Exposure SF 5 yrs0.6540.253.5290.926
Flo Eve0.4020.250.0910.288
Dem0.7380.251.9280.777
Pop Dens0.5270.25222.288191.168
Sensitivity %Pop illit0.3590.1114.4266.452
%Pop Disab0.4440.1115.6827.261
%Dep Age0.5080.11134.31212.728
%Hou way0.7230.11162.52443.601
%Hou wall0.8080.11124.64131.478
%Hou water0.7750.11142.01340.504
%Hou sewar0.6930.11159.17438.709
%Hou elect0.6780.11115.10626.329
%Hou garba0.7590.11122.89031.037
Adaptive capacity %Pop health0.5720.2021.32615.420
%Pop techn0.5060.2048.78218.403
%Pop educates0.5430.207.2259.053
%Pop actHD0.3730.203.9935.632
Pop acces0.6540.204.4640.850
Table 3. Description of the components of the flood vulnerability index, exposure, sensitivity and adaptive capacity for two urban sectors; “288 hectares” (informal settlements) and “El Recreo” (regularized), see Figure A1 and Figure A2 in Appendix A.
Urban Sector &
Level of Vulnerability
ExposureSensitivityAdaptive Capacity
288 Ha
Una Sola Fuerza
1, 2 and 3
High and very high vulnerability
Lowlands, previous wetlands or rice paddies, recurrent flooding events, low population density.Slums with bad housing, lacking city services as water, sewage, road access. According to census data there are young families with children. Low levels of education, informality, lacking social security, and far from health and city services. Limited community organization.
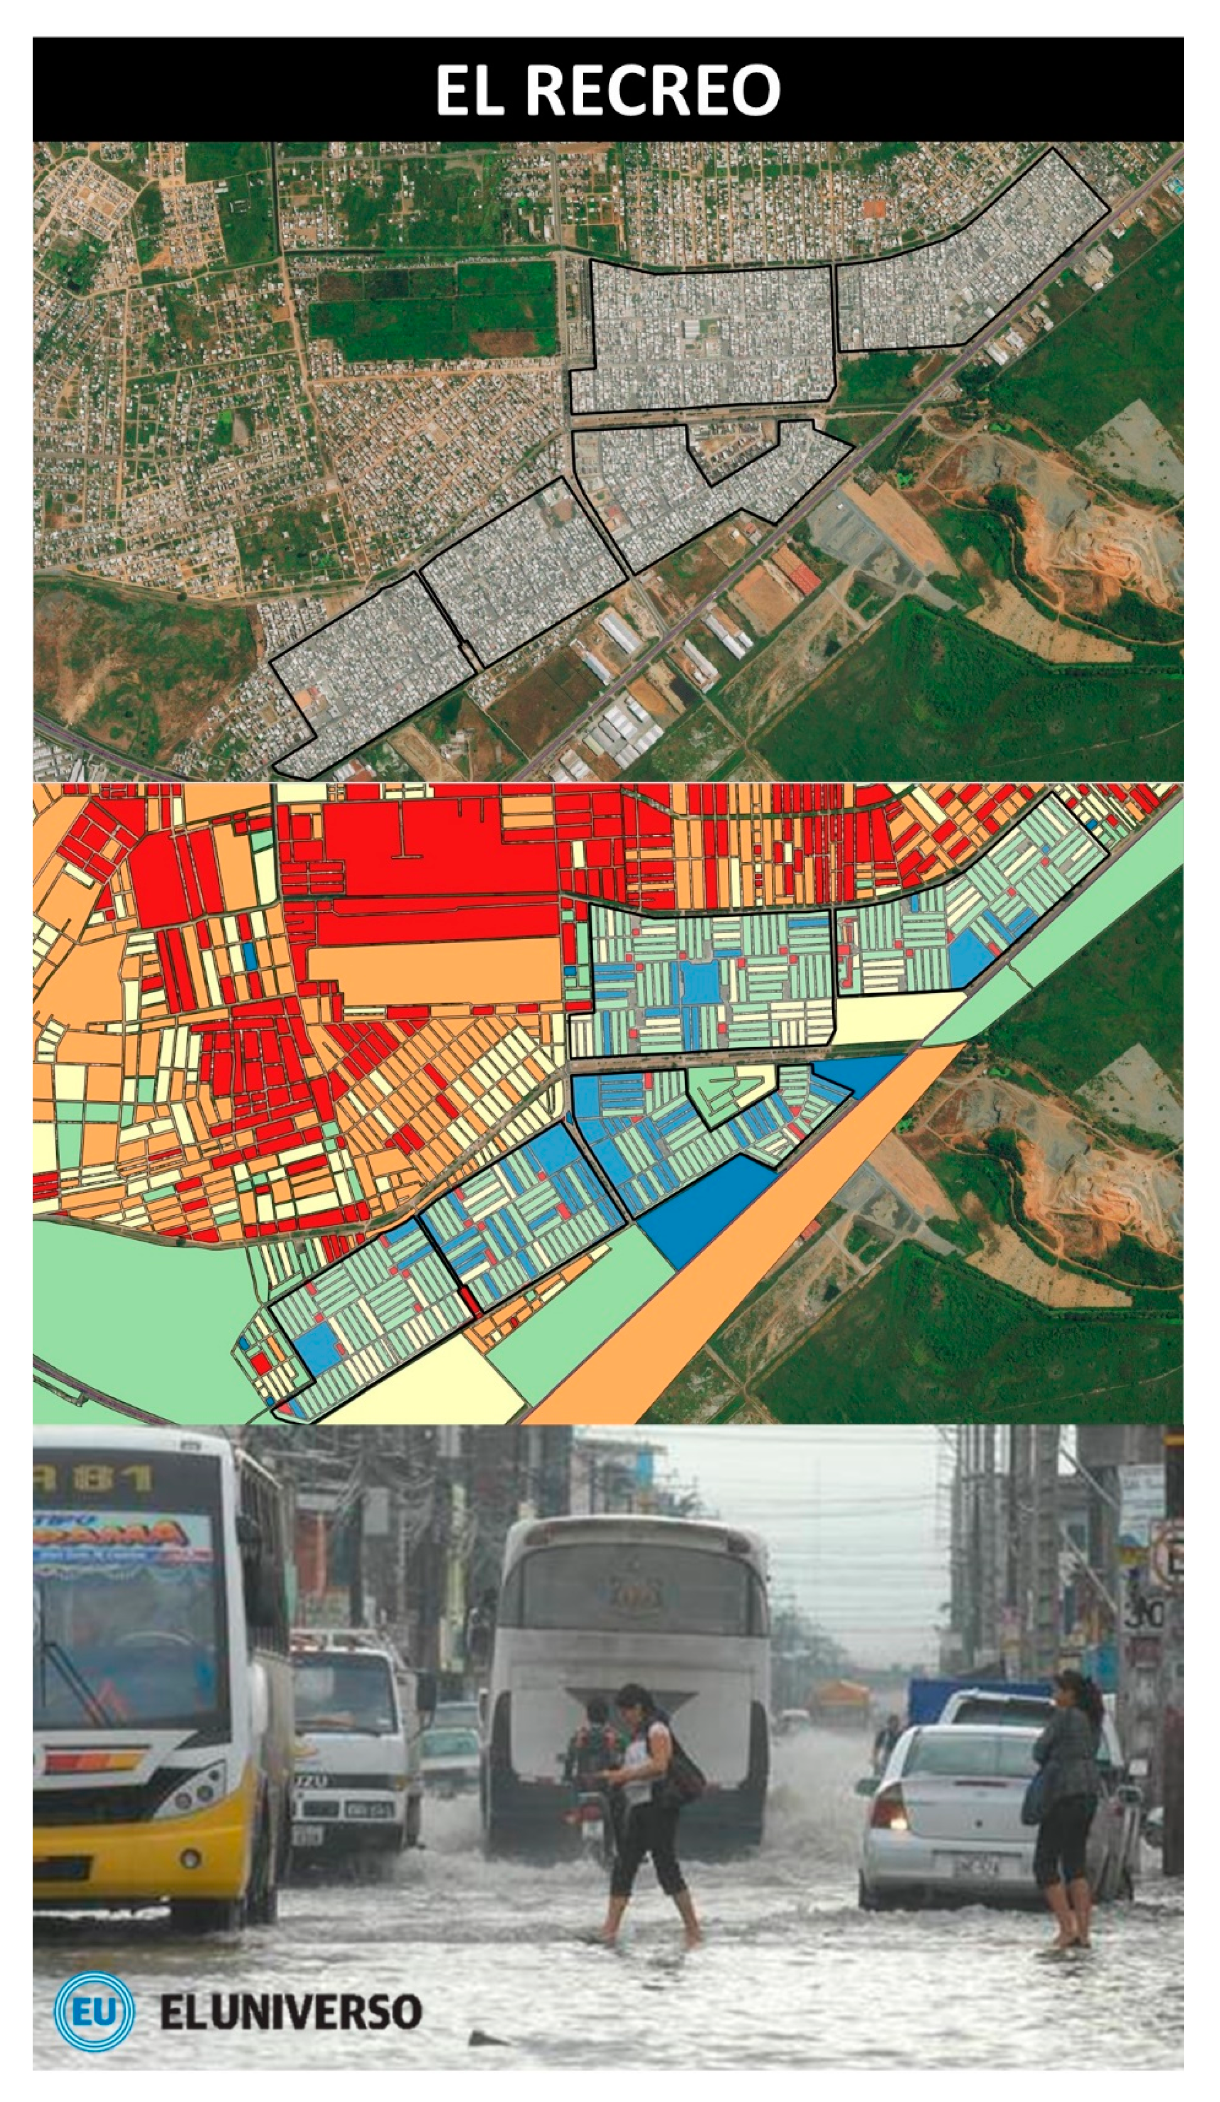
El Recreo 1, 2, 3
4, and 5
Medium vulnerability
Lowlands, chronic recurrent flooding events, higher population density. Government housing program with basic city services, water, urban sewage, paved roads. There are different groups ages and members of the same family living in the same plot, building additional apartments in the same plot. Higher levels of education, better access to social security, health centers and a more organized community.
Publisher’s Note: MDPI stays neutral with regard to jurisdictional claims in published maps and institutional affiliations.

