Abstract
The long-term use of wetlands stresses wetland ecosystems and leads to degradation and C loss. This study explored an optimal remote sensing-multivariate linear regression model (RS-MLRM) for estimating wetland soil organic carbon (SOC) by using a combination of the measured SOC and above ground biomass (AGB) from 273 samples, textural features, spectral information, and a vegetation index calculated from Landsat-8 images using the Ningxia Basin of the Yellow River as the study area. To derive the optimal predictor model for SOC, these variables were regressed against the measured SOC. These were used to predict SOC and evaluate the contribution of wetland restoration and conservation projects to soil carbon sequestration and sinks on the Ningxia Basin of the Yellow River in early (2000 and 2005), intermediate (2010), and recent (2015) years. The results show that from 2000 to 2015, the project-induced contribution to C sequestration was 20.49 TC, with an annual sink of 1.37 TC. This accounted for 54.06% of the total wetland ecosystem C sequestration on the Ningxia Basin of the Yellow River. Moreover, there was a significant success of restoration and conservation projects regarding C sequestration. These restoration and conservation projects have substantially contributed to CO2 mitigation in the arid area.
1. Introduction
Although the terrestrial biosphere absorbs about 25% of anthropogenic carbon dioxide (CO2) emissions, the rate of land carbon uptake remains highly unpredictable. This leads to uncertainties in climate projections [1]. The rise in CO2 concentration has drawn wide attention from governments and academics worldwide [2]. The signing of the Paris Agreement in 2016 shows that [3] many countries have reached a general political consensus on international cooperation on global climate change. In 2018, Nature listed the major events of climate policy as one of the twelve things that need attention [4]. It has also been ranked amongst the 125 most challenging scientific issues published by Science [5], positing how high the greenhouse effect makes the earth’s temperature rise.
The Global Carbon Budget report in 2018 stated that CO2 emissions from worldwide fossil fuel combustion were expected to increase by 2.7% from the previous year. Fossil fuel combustion emitted 990 million tons of carbon into the atmosphere in 2017. In 2018, CO2 emissions were likely to have hit a record high, however, the data is not yet available. To achieve the goal of controlling the temperature increase to 1.5 °C in the Paris Agreement, CO2 emissions need to be reduced to 50% by 2030 and brought to zero by 2050 [6].
Climate change has become a universal problem with global warming as the main feature. The circulation and distribution of carbon in each cycle has become a trending issue of global climate change research [7]. Its primary endeavor focuses on how to improve the carbon sequestration capacity of terrestrial ecosystems and increase carbon storage. All countries are searching for methods to recollect the carbon emitted from energy consumption and fix it in soils and vegetation [8,9]. In the Paris Agreement of 2015, China stated that by 2030 it would cap CO2 emissions. At present, China is positioned to make significant contributions to reducing CO2 emissions through its ecological restoration projects [10].
A wetland is a unique ecosystem formed by the interaction of land and water. It plays an important but complex role in the global carbon cycle, carbon emissions, and stabilizing global climate change. This contributes to the regulation of greenhouse gas levels through carbon sequestration [9]. Although wetland areas only account for 4–6% of the total land area, its carbon storage accounts for 12–24% of the global terrestrial carbon storage. The huge carbon storage capacity of wetlands makes them integral to global soil carbon storage [10].
Studies have shown that most wetlands have much higher CO2 fixation than CO2 and CH4 emissions, and large amounts of organic matter are stored in the soil [11]. This makes them the most efficient net CO2 sinks and contributors to the balancing of carbon-containing greenhouse gases in the atmosphere [12]. Although wetlands are regarded as one of the largest unknown ecosystems concerning future C dynamics, particularly carbon budgets [13], they are an important organic carbon pool [14]. They are equivalent to aquatic and forest ecosystems in terms of their roles in maintaining the earth’s health [14]. Therefore, it is of great significance to increase attention over the carbon sequestration capacity as well as to quantify the temporal and spatial changes of carbon storage in wetland ecosystems.
Related research on wetland carbon storage began in the late 1990s. Many researchers had mainly focused on wetland types [15], estimation methods [16], and influencing factors [17]. In recent years, the research on the carbon sequestration and sinks of wetlands has shown an obvious upward trend. This has attracted more and more attention [18] and has prompted extensive academic interest.
As a highly important ecological factor in wetland ecosystems, soil organic carbon (SOC) provides information on several key processes, such as biomass production, necromass degradation, and organic carbon storage [19]. It plays an important role in the global carbon cycle and has a significant impact on wetland ecosystem productivity, terrestrial ecosystem greenhouse gas emissions, atmosphere regulation, and global warming [20]. SOC is the most important carbon pool in wetlands. Although it is also an important global carbon stock and could represent 20–30% of global soil carbon [21], the rate of land carbon uptake remains highly unpredictable, leading to uncertainties in climate projections [22].
The long-term use of wetlands leads to ecosystem degradation and carbon loss. Recent studies have indicated that the implementation of the ecological restoration projects has significantly increased ecosystem carbon sequestration across the region [4]. It has also improved ecosystem services, by preventing carbon loss from vegetation and soil, subsequently enhancing carbon stocks and carbon sinks [23,24].
The wetland ecosystems of arid regions are an indispensable part of the broader terrestrial ecosystems. However, in arid regions, wetland SOC of restoration and conservation projects have not been well-studied and estimating SOC from space remains a challenge. Previous study areas include the arid regions around Xinjiang Ebinur Lake [25], the Baotou section of the Yellow River wetland [24], and the Central Asia arid zone of the Aral Sea [26]. There are relatively few studies on the construction of wetland biomass types and soil inversion models, soil carbon and sink, together with the relationship between spatial distribution and environmental factors. Therefore, a comprehensive analysis and evaluation of arid wetland soil is still required [27]. In the context of global climate change and increasing carbon emissions, there is an urgent need for carbon sequestration and carbon sink studies for wetland restoration and conservation projects.
The Ningxia Basin of the Yellow River is part of the arid region of Northwest China. Since 2002, a series of wetland ecological restoration and conservation projects have been successively carried out in the Ningxia Basin of the Yellow River, such as the restoration of farmland from the lake and dredging operations. Additionally, various other projects have improved connectivity in smaller water systems. The wetland areas and the coverage of vegetation have continuously increased. These projects have successfully protected the regional environment and have restored degraded wetland ecosystems, countered wetland shrinkage in the region, and brought substantial increases in vegetation biomass since 2010. This has brought ecological, social, economic, and environmental benefits.
There are two national wetland nature reserves, five national wetland parks, and an international wetland city (Yinchuan City), which was accredited in the first batch of international wetland cities on 25 October 2018. Ningxia Yellow River Irrigation District was included in the World Cultural Heritage sites in October 2017. However, the total carbon sequestration benefit arising from the wetland restoration projects has not yet been systematically evaluated for the Ningxia Basin of the Yellow River. The carbon sequestration achieved in some individual projects has been investigated [28]. The potential of wetlands to store carbon, especially in soils, often exceeds that of other terrestrial ecosystems in the arid regions of the upper Yellow River. Related studies which assessed wetland soil carbon stocks have been neglected to date. Nonetheless, as these systems are sensitive to global climate change and represent a significant proportion of the global carbon stocks, they require urgent attention [17].
The Ningxia Basin of the Yellow River has long been affected by complex and multi-variable factors such as water and sediment changes, river channel swings and sand invasion, human activities, and climate change. It exhibits the characteristics of a diverse wetland, distinct spatial differentiation, growing wetland area, and fragile ecosystems. It forms a unique irrigation and drainage system [20] and has extremely high scientific research value. However, most research on the Yellow River wetlands in the Ningxia arid area has focused on dynamic changes [5], ecological assessments [29], biodiversity surveys, and ecological restoration [29]. There are few studies on wetland soil carbon sequestration, soil sinks, and their temporal and spatial dynamic evolution, and more emphasis on the construction of single factor inversion models. The remote sensing (RS) images and parameters selected are different in the constructed model. The inversion objects are mostly single species of the same type, but the inversion accuracy needs to be improved. It is difficult to accurately estimate wetland SOC in such complex areas using single-factor models; therefore, either or both a multi-factor and multi-characteristic variables model are required [28]. This will improve the accuracy and usefulness of developing a SOC inversion model using a combination of spectral information, texture features, principal components, vegetation indices, and field measurements.
In our study of large-scale carbon content in ecosystems, the estimation of SOC by remote sensing (RS) shows the advantages of this method, including a high degree of accuracy. At the same time, it shows how this method overcomes the difficulties associated with obtaining ground station data. The main methods include RS information parameters for fitting biomass, and a combination of RS data and process models, artificial neural network model methods, and reference plot methods [11]. The combination of “3S” technology and actual field data can solve the problem associated with organic carbon estimation from point to region [19,20,21]. The combination of spectral information, texture features, vegetation indices, and measured data to establish a SOC estimation model can promote the precision of SOC estimation.
The status of wetland carbon storage is especially important in the global carbon cycle and carbon balance accounting. Nevertheless, the current spatial information of regional wetland carbon storage is extremely lacking and is easily overlooked when conducting large-scale assessments and establishing models. To a certain extent, it hinders the correct estimation of wetland carbon storage.
In our study, we explored the potential of texture features, a vegetation index, and principal component analysis (PCA) of multi-source remote sense data for estimating SOC. We also evaluated the contribution of wetland ecology restoration and protection projects to C sinks from 2000 to 2015. The spatial distribution rules of SOC were analyzed in the Ningxia Basin of the Yellow River in early (2000 to 2005), intermediate (2010), and recent (2015) years during the restoration stages of the wetland ecosystem. The objective of this research was to estimate SOC in wetlands using a combination of texture features, vegetation index, PCA (principal component analysis), vegetation biomass, and soil factor detection data.
Five specific objectives were established to accomplish this:
- (1)
- Identify the best texture features, vegetation index, and PCA to use for estimating SOC;
- (2)
- Establish the regression models between texture features and/or PCA, vegetation index, and field-measured SOC;
- (3)
- Assess the potential and accuracy of estimating SOC using multi-factor biomass prediction models including texture features and/or PCA;
- (4)
- Estimate the net SOC density of a wetland ecosystem by comparing the changes between the years of the project from 2000 to 2005, an intermediate year (2010), to a recent year (2015);
- (5)
- Estimate the wetland project-induced carbon contribution against the total ecosystem soil carbon sequestration by comparing the change in ecosystem carbon stocks between the carbon sink of the project region and a reference area (the carbon sink of the reference area was equivalent to the average soil carbon density of the wetland areas of the Ningxia Basin of the Yellow River during the same period).
The wetland SOC was then used to construct a spatial distribution map, which was analyzed to explore environmental factors. The model and approach used in this study will be a useful reference for future studies on the effect of climate change, the Yellow River, and human activities in large river-basin areas. The research results have important theoretical and practical significance for deepening the study of wetland formation. These results will help improve the monitoring methods in wetland ecosystems, conserve freshwater ecosystems, and protect rare, endangered birds along with other wildlife.
2. Materials and Methods
2.1. Study Area
The climate type is continental temperate arid, with an annual average temperature of 9.0 °C and rainfall of 180–200 mm. The potential annual evaporation is 1825 mm, the average annual humidity is 55%, and the Palmer Drought Severity Index is 7.8–8.0.
Located in the arid inland region of Northwest China and the upper Yellow River, the Ningxia Basin of the Yellow River (37°46′ N to 39°23′ N and 105°5′ E to 106°56′ E) has a fragile ecological environment that is sensitive to climate change. The Yellow River runs from south to north through the Yinchuan Plain for 193 km and crosses canals and ditches that provide water for irrigation and extensive wetlands. The soil types are swamp, saline–alkali, and silty soil.
The biodiversity is high. The dominant vegetation types are Cattails, Phragmites australis, and Suaeda glauca. Phragmites australis are widespread over the Ningxia Basin of the Yellow River, and account for 70–90% of the vegetative cover; many other types of vegetation are widely distributed. There are 9 wetland vegetation types, 30 sub-types, and 132 groups in the Yinchuan Plain. There are 202 species of 119 genera, and 52 families of vascular plants that live in the wetland plant resources. There are 29 families and 67 genera in phytoplankton, mainly distributed in the Yinchuan, Wuzhong, and Shizuishan areas on both sides of the Yellow River.
The Ningxia Basin of the Yellow River consists of river, lake, marsh, and constructed wetlands. In 2002, the Ningxia government implemented a series of wetland ecology restoration and protection projects, such as Wuzhong Yellow River National Wetland Park, Huangsha Gudu National Wetland Park, Yuehai National Wetland Park, Mingcui Lake National Wetland Park, Xinghai Lake National Wetland Park, Shahu Lake National Wetland Nature Reserve, and Qingtongxia Reservoir National Wetland Nature Reserve. In addition, various other restoration projects have addressed connectivity in smaller water systems. These projects have successfully countered wetland shrinkage in the region and brought substantial increases in vegetation biomass since 2010. Such increases have provided ecological, social, economic, and environmental benefits.
2.2. Image Data Acquisition
The RS image data used in this study were determined from thematic mapper (TM) images (resolution 30 × 30 m) acquired on 17 July 2000, 18 July 2005, and 27 July 2010. The Landsat-8 OLI (Operational Land Imager) images (resolution 30 × 30 m) were acquired on 28 July 2015. Images taken during the wet season were chosen to ensure comparability. The image data met the requirements of this study as it has shown the characteristics needed to determine vegetation indices, texture features, and principal components.
2.3. Sample Layout and Experimental Data
Applying the OLI-8 image in 2015, seven Wetlands Restoration and Conservation projects (including the five National Wetland Parks and the two National Wetland Nature Reserves) were selected in the Ningxia Basin of the Yellow River. Sampling plots were evenly distributed throughout the wetland restoration and conservation projects areas. Field measurements were conducted in the seven project areas from August 2014 to 2015 to obtain wetland vegetation data and soil monitoring data, which were essentially the same as the RS image.
Furthermore, thirteen representative sample sites were selected within each project area using a grid selection method; therefore, a total of 91 sample areas were identified. Three sample squares (1 × 1 m) were then randomly selected in each sample area. During this time, a total of five sample strips and 273 effective sample points and sample squares were arranged, including 60 river sites, 75 lake sites, 87 marsh sites, and 51 sample sites in the constructed wetland. The sample strips were laid from the center of the lakes and marshes to the lakeshore area, and from the Yellow River channel to both sides. This was done to understand the changes through time in wetland vegetation biomass, as shown in Figure 1.
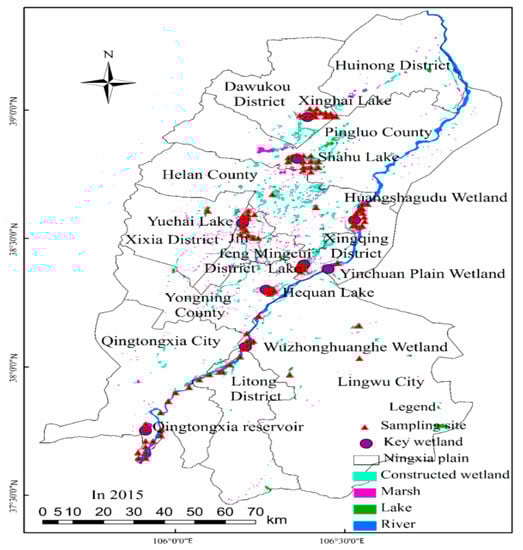
Figure 1.
Distribution of wetland sampling sites and wetland ecological restoration and conservation projects in the Ningxia Basin of the Yellow River.
Sample sites were located using the same GPS device. A selection of vegetation was harvested at each sample plot. The vegetation type, coverage, plant height, and the number of plants in the sample were recorded, and then the aerial parts of the plants were collected and immediately weighed to obtain the fresh weight. All sampled vegetation was put in polyethene bags, and were accordingly marked, sealed, and taken to the laboratory. They were then dried at 85 °C to reach a stable weight (accuracy of 0.01). The plant’s soil, and its salt, nutrient, and water conditions directly affect the distribution of plant species and their biomass.
Therefore, we chose three replicate sample spots for soil sampling based on gathered plant samples. Soil organic carbon (SOC), total nitrogen (TN), total phosphorus (TP), salinity, soil pH, soil bulk density, and soil water content were determined from the total of 273 soil samples taken in the field within the sampling quadrats. These were based on collected vegetation samples, which were according to the concentration of the distribution of fabric roots in the study area, as well as referring to the method of stratified sampling of wetlands in the arid area [25].
In each sample, soil columns of 0–40 cm were collected using a cylindrical metal sampler (3 m in length and 5 cm in diameter). Each soil column was divided into four layers (0–10, 10–20, 20–30, 30–40 cm) along the diagonal of the sample and drilled into the soil. After which, the same soil layers were evenly mixed, placed in a sealed and numbered sample bag, and sent back to the laboratory. Then, the samples were air-dried, passed through a 60-mesh sieve, sealed, and placed in a small refrigerator in the laboratory.
At the same time, the ring knife method was used to take another four-delamination cut soil column samples from each quadrat [30]. These samples were placed into sealed bags for soil bulk density (BD) analysis. Each soil sample was analyzed for SOC and soil total nitrogen (STN), which was determined using the Elementar Vario MACRO analyzer. The total soil phosphorus (STP) content was determined using a UV-visible spectrophotometer (UV-2450, Shimadzu, Japan). Soil samples were oven-dried at 105 °C at a constant weight so that the BD and water content could be determined from the mass change. Total salts were measured using a conductivity meter (DDS-307A, Rex Shanghai, China), and soil pH was measured using an acidity meter (PHB-5, Beijing Xin Yu Tengda Instrument Equipment Co. Ltd., Beijing, China) [30]. The detection methods were strictly carried out in accordance to the industry standards (organic matter, NY/T1121; nitrogen, LY/T1228-1999; phosphorus, HJ 632-2011; water-soluble salt, NY/T1121.16-2006; pH, NY/T 1377-2007; soil moisture content, NY/T 52-1987).
2.4. Data Processing Method
2.4.1. RS Image Preprocessing
The RS image data were geometrically corrected, cut out, mosaicked, merged, strengthened, radiated calibration, and corrected for atmosphere applying the ERDAS 8.0 software. The corrected error was 0.5 pixels. After pretreatment, Band 2, Band 3, and Band 4 of the OLI images and Band 3, Band 4, and Band 5 of the TM images were selected for use. The RS images were manually pictured for the study region using the ENVI 5.2 and ArcGIS 10.2 software packages to incorporate terrain, water, and locations of wetland projects in the Ningxia Basin of the Yellow River. Locations and ranges of wetland projects in 2000, 2005, 2010, and 2015 were determined from the longitude and latitude of GPS field investigation and from manually obtained geographic indicators, which is more precise than an automatic abstraction.
2.4.2. Characteristic Variables from Landsat-8
The extracted RS information consisted of band reflectivity, textural features, and vegetation indices. The Landsat-8 OLI RS image has 11 bands, of which Band 2, Band 3, and Band 4 were sensitive to wetland vegetation. In the Landsat TM image, Band 3, Band 4, and Band 5 were sensitive to vegetation. Landsat Band 4-3-2 combination and OLI-8 Band 5-4-3 combination images were close to the natural color, had rich information, good layering, less interference, and clear texture. Therefore, the contrast between vegetation and non-vegetation on the image was increased, which improves the accuracy of vegetation identification. Therefore, Band 2, Band 3, and Band 4 of the Landsat-8 OLI, and Band 3, Band 4, and Band 5 of Landsat TM were selected for the reflectance extraction of each sample.
According to the characteristics of the study area, seven vegetation indices of NDVI (normalized difference vegetation index), RVI (ratio vegetation index), DVI (difference vegetation index), MSVI (modified soil-adjusted vegetation index), OSAVI (optimized soil-adjusted vegetation index), SAVI (soil adjusted vegetation index), and RDVI (renormalized difference vegetation index), three principle component analyses of PC1, PC2, and PC3, and eight texture features of CON (contrast), COR (correlation), DI (dissimilarity), EN (entropy), HOM (homogeneity), ME(mean), ASM (angular second moment), and VAR (variance), were selected as indicators for constructing the inversion model.
2.4.3. Meteorological Data Collection and Calculation
Using data from 10 meteorological stations in the Ningxia Basin of the Yellow River, the Kriging space interpolation method was used to calculate the annual mean temperature and annual precipitation of each sampling point in ArcGIS 10.2 software. Differences in significance were analyzed using one-way ANOVA, and the correlation between environmental factors (climate, vegetation, and soil physical and chemical properties) and SOC density was studied using correlation analysis. The effects of environmental factors and human activities (tourism in tourist wetlands such as Shahu Lake, Mingcui Lake, and Yuehai Lake, which implement wetland management measures) on SOC density were studied using stepwise regression analysis. Tourism data were obtained from the wetland administration and tourism bureau.
Firstly, RS factors were extracted from RS images. Then, the correlation between each of the RS factors and environmental factors and SOC was analyzed. Finally, factors with high correlations were used as independent variables, and the SOC of the sample was used as the dependent variable. A stepwise regression method was used for constructing a remote sensing multivariate linear regression model (RS-MLRM) for soil organic carbon in the wetlands. The optimal model was selected based on the change of decision coefficient and the decision coefficient of adjustment. In order to analyze the impact of human activities on the soil carbon content of wetlands in the Yellow River and Ningxia Basin, this study introduces a tourism intensity index (the number of tourists per unit area), and uses a regression analysis method for a fitting analysis of tourism intensity index, and soil physical and chemical properties index [25,29]. The number of tourists data were obtained by collecting the number of tourists received in each wetland administration. RS images were processed and mapped in ArcGIS 10.2 and ENVI 5.2.
2.5. SOC Estimation RS-MLRM
2.5.1. Correlation Analysis between SOC and Environmental Factors
Pearson correlation coefficients were calculated between wetland SOC and extracted RS information, as well as between the SOC and environmental factors. The most relevant independent variables were then selected to provide a basis for further modeling. This process was designed to improve upon conventional methods, which continue to have large prediction errors. According to previous research [13,29], 18 independent variables were chosen to test for use in the model.
2.5.2. RS-MLRM Mathematical Model
MLRM (multiple linear regression model) was first proposed to solve economic problems. MLRM was to analyze an independent variable and the relationship between multiple dependent variables, and then the mathematical models would be figured out.
Let y be the dependent variable, and mean SOC; x1, x2, …, xn as independent variables, representing the remote sensing factor. When the independent variable is linear with the dependent variable, the MLRM mathematical model is [31]:
Equation (1) for the regression equation, where b0 was a constant term, b1, b2 …, bn for the regression coefficient, ε is a random error. b0 + b1×1 + b2×2 + … + bm×n + ε was provided with m group of samples, where xij was the observed value of xi in the first i. The mathematical model was expressed as:
The matrix form of the biomass MLRM was expressed as:
y was the SOC matrix, x was the remote sensing factor matrix for each sample point, b was the coefficient matrix, and ε is the random error.
The SOC density (g/m2) formula used is as follows:
where SOC is soil organic carbon content (g/kg), H is soil thickness (cm) of 40, SBD is soil bulk density (g/cm3).
SOC density = SOC × H × SBD
2.5.3. Accuracy Evaluation and Inspection of the Model
Based on the results of previous studies [32,33], we randomly selected 75% of the data from 271 field-observed soil plots to construct the SOC estimation model, and the remaining 25% of the data were used to evaluate the prediction accuracies of the RS-MLRM. For testing of the fitting accuracy and prediction ability of the RS-MLRM, we used the coefficient of determination (R2), the adjusted R2 (adj. R2), relative root mean square errors (RMSEs), precision system errors (SEs), relative errors (RE%), and actual SOC (SOMS) to evaluate the accuracy of each SOC RS-MLRM [31,33], using Equation (4) through (8), respectively:
where SOCi is the measured SOC value of the i sample, and SOCi’ is the predicted SOC value of the i sample, is the average SOC per unit area of the different types of wetland soil, and Si is the area of wetland soil.
2.5.4. SOC Estimation Mapping
We estimated the wetland SOC in 2000, 2005, 2010, and 2015 using the optimal RS-MLRM estimation model, i.e., the one with the highest R2 and lowest RMSE. Then, a SOC level distribution map was made in the Ningxia Basin of the Yellow River.
2.5.5. Integrated Process for Model Construction
The results of the SOC remote sensing estimation model of four types of wetland soil in rivers, lakes, swamps, and artificial wetlands are presented in Figure 2.
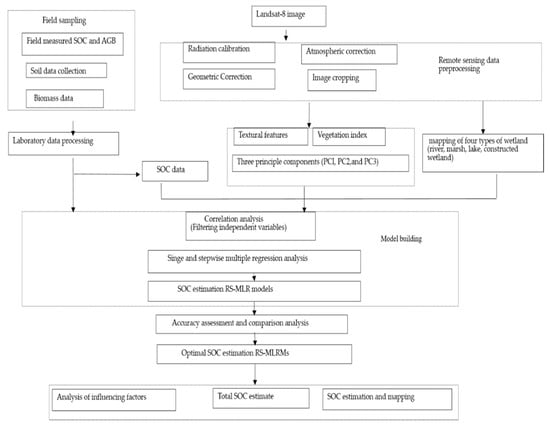
Figure 2.
Remote sensing-multivariate linear regression model (RS-MLRM) construction technology flow chart.
2.6. Soil Carbon Sink, Carbon Source, and Carbon Sink Control Area Delineation
According to the high-precision carbon sink measurement (known as the pool-difference approach), which is preferred by the Intergovernmental Panel on Climate Change National Greenhouse Gas Inventory, we used a two-year average annual change to represent the change of carbon sink (IPCC) (2014) [34]:
where ΔSCS is the annual soil carbon sink change ((g/m2) a−1), SCSt2 is the SOC density (g/m2) at time t2, and SCSt1 is the SOC density (g/m2) at time t1.
ΔSCS = (SCSt2 − SCSt1)/(t2 − t1)
When ΔSCS is positive, it indicates that the surface SOC density was growing in the past 15 years and is classified as a carbon sink area. When ΔSCS is negative, it indicates that the surface SOC density has been in a reduced state in the past 15 years and is classified as a carbon source area. When the ΔSCS value is zero, it indicates that the surface SOC density has been in a constant state for the past 15 years and is classified as a carbon balance area. The geochemical map of the SOC density at each spatial coordinate point can be used to visually express the spatial distribution of organic carbon in the study area. The statistical results are shown in Figure 3.
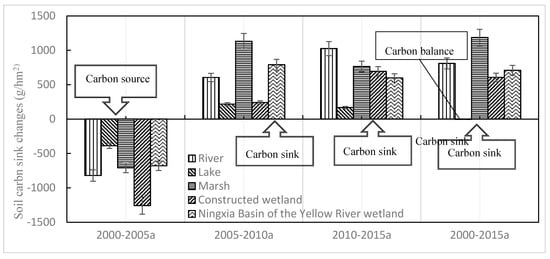
Figure 3.
Effects of wetland restoration and conservation projects on soil carbon sink in the Ningxia Basin of the Yellow River from 2000 to 2015.
Using the reclassification tool in ArcGIS 10.2 Spatial Analysis Module, the spatial distribution of the four types of wetlands’ SOC density were plotted from 2000 to 2015. Using the average soil carbon stock density (2669 g/m2) of the Ningxia Basin of the Yellow River wetland in the four years, and the average carbon density of the Yellow River irrigation area in Ningxia (2144 g/m2) [15], we referred to previous research results [11,13,19] and the spatial distribution of SOC density in the wetlands of the Ningxia Basin of the Yellow River from 2000 to 2015.
The soil carbon stock density was divided into five levels, namely the lower level (SOC density ≤ 1000.0 g/m2), low level (1000.0 g/m2 < SOC density ≤ 2000.0 g/m2), intermediate level (2000.0 g/m2 < SOC density ≤ 3000.0 g/m2), high level (3000.0 g/m2 < SOC density ≤ 4000.0 g/m2), and higher level (SOC density > 4000.0 g/m2). The SOC density distribution range, number of pixels, area, and percentage for each level were calculated. The carbon sink and carbon source area distribution maps were drawn. They were used to visually express and analyze the trend of soil carbon sinks in the past 15 years, and the spatial distribution characteristics of carbon sinks and carbon source areas and carbon balance areas. Referring to previous research [35], the lower level area was considered to be a low carbon sink, which was used as the carbon sink control area. The higher and high-level areas were high carbon sinks, which represented carbon sink conservation areas. The other level areas were the general carbon sinks.
3. Results
3.1. Model Implementation
3.1.1. Inversion Model Characteristic Variable Optimization
There were significant positive correlations between SOC and above ground biomass (AGB) and TN (p < 0.01), and the correlation coefficients were above 0.9. The correlation between SOC and seven vegetation indices was high and significant (p < 0.01). The correlation coefficient between SOC and ME((mean)) was 0.702, but the other seven texture features did not show strong correlations with SOC. There was a significant correlation between SOC and PC1 and PC2 (p < 0.01), as well as with Band 3 and Band 5 (p < 0.01). Correlation analysis showed that SOC and one of Band 3 and Band 5 had a number of significant correlations.
3.1.2. Optimal RS-MLRM of Wetland SOC
The best RS-MLRM for estimating SOC using the combination of texture features, spectral information, and vegetation index are shown in Table 1. Band 4 and AGB were used to construct the optimal RS-MLRM for the SOC of river wetlands, AGB was used to model the optimal SOC of lake wetlands, AGB and PC1 were used to model the optimal biomass of marsh wetlands, and AGB and MEAN were used to model the optimal SOC of constructed wetlands. The empirical formulas all had good R2 values and low standard errors, indicating a good fit between the model and the sample data. In addition, the lowest RMSEs derived from the LOOCV (Leave-One-Out-Cross-Validation) also indicated that the RS-MLRM had high prediction accuracy without over-fitting.

Table 1.
Soil organic carbon (SOC) estimation RS-MLRM and their related statistics for Landsat-8 OLI data and combined textural feature, vegetation index, and principal component analysis (PCA) (n = 273).
3.1.3. Accuracy of SOC Estimations
The SOC estimating model accuracy was tested, as shown in Table 1. The results showed that the RS-MLRM had a good predictive ability. The model significance test was highly significant (p ≤ 0.01), showing that it could estimate the wetland SOC in the study area. The results showed that RS factors and vegetation indices were the main parameters for the inversion of SOC in wetlands. The introduction of textural features helped improve the prediction accuracy, with a four-factor RS-MLRM (using AGB, ME, and PC1) providing the best estimate of SOC in all studied wetland types.
According to Equation (3), the RS-MLRM of SOC density was obtained in the Ningxia Basin of the Yellow River wetlands, as shown in Table 2.
Table 2.
RS-MLRM of SOC density in the Ningxia Basin of the Yellow River wetlands.
SOC density was obtained using the RS-MLRM and Band Math module in ENVI and wetland distribution in the Ningxia Basin of the Yellow River from 2000 to 2015.
3.2. Model Output Results
3.2.1. Effects of Wetland Restoration and Conservation Projects on Soil Carbon Sinks
From 2000 to 2015, the SOC density of four types of wetland decreased initially and then increased on the Ningxia Basin of the Yellow River, representing a carbon sink. The marsh increased the most (1186.27 g/m2), indicating that it was the most important carbon sink zone. The lake again remained mostly stable, indicating that the lake represented a carbon balance zone. From 2000 to 2005, the SOC density of four types of wetland decreased on the Ningxia Basin of the Yellow River, suggesting a carbon source. The decrease in the constructed wetland SOC density was the largest, with a decrease of 1258.05 g/m2, followed by the rivers with a decrease of 820.96 g/m2. Moreover, the smallest decrease was observed in the lakes with a decrease of 387.91 g/m2. From 2005 to 2015, the SOC density showed an upward trend, which was represented by a carbon sink. The marsh SOC density showed the highest with an increase of 1895.03 g/m2, indicating that it was the most important carbon sink, followed by the constructed wetland with a SOC density increase of 1864.23 g/m2, as shown in Figure 3.
3.2.2. Soil Carbon Sink Spatial Variation in Different Types of Wetland
Soil carbon sinks have undergone a process of development from low to high in the Ningxia Basin of the Yellow River wetland, as shown in Figure 4 and Table 3. From 2000 to 2005, the area of low carbon sinks showed an increasing trend, and the area of high carbon sinks showed a decreasing trend. This indicates that wetland carbon sink capacity had decreased. From 2005 to 2015, the area of low carbon sinks decreased, and the area of high carbon sinks increased. This indicates that carbon sink capacity had increased. In 2015, the area of high carbon sinks accounted for 47.69%, mainly distributed in Qingtongxia Reservoir Area and Helan County. Low carbon regions accounted for 1.12% and were mainly distributed in the Xixia District and Dawukou District. The general carbon sink regions accounted for 51.2% and were widely distributed.
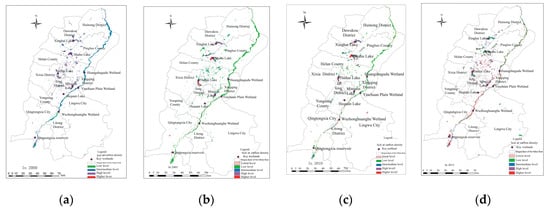
Figure 4.
SOC density spatial distribution of wetlands in the Ningxia Basin of the Yellow River from 2000 to 2015. Note: Figure (a) is SOC density spatial distribution of wetlands in the Ningxia Basin of the Yellow River in 2000; Figure (b) is SOC density spatial distribution of wetlands in the Ningxia Basin of the Yellow River in 2005; Figure (c) is SOC density spatial distribution of wetlands in the Ningxia Basin of the Yellow River in 2010; Figure (d) is SOC density spatial distribution of wetlands in the Ningxia Basin of the Yellow River in 2015.
Table 3.
SOC density level statistics of wetlands in the Ningxia Basin of the Yellow River.
Spatial distribution of soil carbon sinks varied widely in the Ningxia Basin of the Yellow River wetland. High carbon sinks were in Wuzhong Yellow River Wetland Park, Qingtongxia Reservoir Area Wetland Nature Reserve, and Huangsha Gudu National Wetland Park in the central and southwest regions. Low carbon sinks were mainly distributed in Huinong District and Dawukou District in the northeast. In comparison, the soil carbon sink was highest in the marsh, followed by constructed wetlands, lake, and lowest in the river. The soil carbon sink of wetlands along the Yellow River was high because of less human disturbance and sand intrusion. It was even higher in the ecological conservation areas and water conservation areas of key wetlands than that in the marginal areas. In conclusion, the soil carbon sinks in areas which were away from the shores of rivers and lakes, and areas with less human disturbance were higher than the other areas.
3.3. Wetland Restoration and Conservation Project-Induced Contribution to Carbon Sequestration
Seven wetland restoration and conservation projects have contributed to carbon sequestration in the past 15 years, as shown in Table 4 and Figure 5. During the study period, the wetland restoration and conservation project-induced contribution to carbon sequestration was 20.49 TC, with an annual sink of 1.37 TC, accounting for 54.06% of the total wetland ecosystem carbon sequestration in the Ningxia Basin of the Yellow River. This project demonstrated the significant success of the restoration and conservation projects regarding carbon sequestration. Among the seven projects, Qingtongxia Reservoir Wetland Nature Protected Area made the largest contribution in terms of project-induced carbon sequestration, with 7.53 TC, accounting for 36.74% of the total project-induced C sink, followed by Wuzhong Yellow River National Wetland Park (6.71 TC, 32.75%), Shahu Nature Reserve (2.57, 12.54%), and Yuehai National Wetland Park (2.18 TC, 10.64%).
Table 4.
Project-induced C sequestration in the key wetland ecological restoration and conservation projects. Unit: 104 t C.
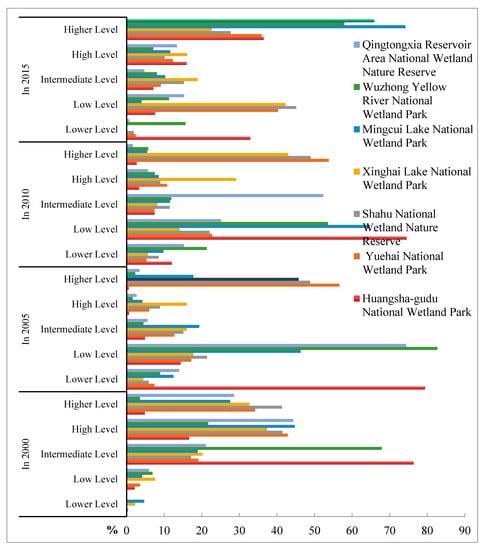
Figure 5.
Distribution of soil carbon density in the key wetland ecological restoration and conservation projects from 2000 to 2015.
From 2000 to 2015, the average SOC density caused by the seven wetland restoration and conservation projects increased by 1781.95 g/m2, and the average SOC density of the Ningxia Basin of the Yellow River wetland increased by 708.49 g/m2. The SOC density in the wetland restoration and conservation project implementation area was higher than the average of the Ningxia Basin of the Yellow River wetland by 1073.46 g/m2, as shown in Table 5. This indicates that the implementation of regional wetland ecological restoration and conservation projects could be a quantitatively important component of regional climate change mitigation strategies in arid areas. Thus, more attention should be paid to developing these projects.
Table 5.
Project-induced changes of SOC density in the wetland ecological restoration and conservation projects. Unit: g/m2.
3.4. Soil Carbon Density Spatial Distribution of Wetland Ecological Restoration and Conservation Projects
Using the RS-MLRM values of seven key wetland restoration and conservation projects in the Ningxia basin of the Yellow River, the distribution of soil carbon density RS estimation was obtained in the key wetland ecological restoration and conservation projects from 2000 to 2015. The spatial maps were produced in ArcGIS 10.2 using the Jenks method, and the percentage of soil carbon density in each grade was calculated, as shown in Figure 6.
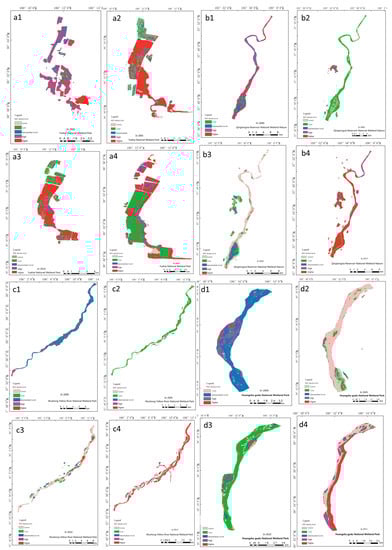
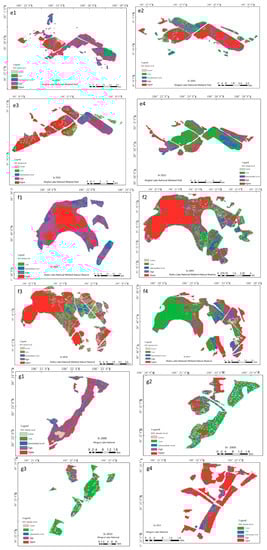
Figure 6.
Distribution of soil carbon density RS estimation of seven key wetland restoration and conservation projects. Note: Figure (a1–a4) is distribution of soil carbon density RS estimation of Yuehai National Wetland Park; Figure (b1–b4) is distribution of soil carbon density RS estimation of Qingtongxia Reservoir Area National Wetland Nature Reserve; Figure (c1–c4) is distribution of soil carbon density RS estimation of Wuzhong Yellow River National Wetland Park; Figure (d1–d4) is distribution of soil carbon density RS estimation of Huangsha Gudu National Wetland Park; Figure (e1–e4) is distribution of soil carbon density RS estimation of Xinghai Lake National Wetland Park; Figure (f1–f4) is distribution of soil carbon density RS estimation of Shahu National Wetland Nature Reserve; Figure (g1–g4) is distribution of soil carbon density RS estimation of Mingcui Lake National Wetland Park.
The spatial pattern of soil carbon storage density of seven key wetland projects in the Ningxia basin of the Yellow River presented four characteristics. Firstly, the density of soil carbon storage increased from 2000 to 2015, showing a phenomenon of carbon sequestration. Secondly, the area with high soil carbon storage density showed an increasing trend, which indicated that the soil carbon storage in wetland engineering areas was increasing. Thirdly, the distribution of soil carbon storage density in key wetland project areas developed from non-equilibrium to equilibrium, and the changes in Shahu Lake and Xinghai Lake were slightly different. Fourthly, in 2015, the patchy and striped patterns of soil carbon storage grades gradually weakened in seven key wetland projects, while the patch area with high carbon storage density increased.
3.5. Soil Carbon Sinks of the Main Control Factors
3.5.1. Correlation between Soil Carbon Sinks and Environmental Factors
Climate is an important factor affecting SOC density [36]. There was a significant negative correlation between wetland SOC density and temperature (p < 0.01). There was also a significant positive correlation with precipitation (p < 0.05), as shown in Table 6, however, the correlation coefficient was small. Correlation analysis of SOC density and environmental factors showed that there were significant positive correlations between soil SOC density, soil TN, and soil moisture (p < 0.01). It also showed a negative correlation between SOC density and soil C/N and C/P (p < 0.05). There were significant negative correlations between SOC density, soil bulk density, and pH (p < 0.05). Soil C/N and C/P had a greater impact on SOC density. The correlations between SOC density and salinity and TP were not significant.
Table 6.
Correlation coefficients of SOC density with climatic, topographic, and soil properties.
3.5.2. Impact of Environmental Factors and Human Activities on Soil Carbon Sinks
Among the factors of SOC density, as shown in Table 7 and Table 8, the soil bulk density could explain 41.18% of the variability in SOC density, and the independent interpretation ability was the strongest. This was followed by the water content of the soil (35.83%), human activities (tourism) (over 22.52%), and total biomass (TB) (above 21.83%). C/N, C/P, TP, temperature, and precipitation interpretation of SOC density variation were small (less than 20%), of which precipitation’s interpretation ability was the smallest (only 8.12%).
Table 7.
Contributions of each variable alone to the variability of SOC density (%).
Table 8.
Results of stepwise regression analysis of SOC density with influencing factors.
Of the various environmental factors and human activities that affect SOC density, as shown in Table 8, soil moisture had the greatest impact. This was followed by interference from human activities. Once again, vegetation biomass, soil pH, and TN had similar effects on SOC density. The effects of soil bulk density, salinity, TP, C/P, and C/N were quite similar. However, N/P, temperature, and precipitation had the least effect on SOC density, and none of them entered the equation in the stepwise regression. Twelve environmental factors jointly explained 64.3% of SOC density variability, and after adding the human disturbance factor into the regression analysis, the comprehensive explanation of SOC density variation reached 67.2%.
3.5.3. Soil Carbon Sink Master Factor
Under the influence of other factors, the ability of a certain factor to explain the variability of SOC density was lower than that of its independent interpretation ability. This indicates that there was a strong interaction between various influencing factors. Therefore, soil moisture, soil physical and chemical properties, vegetation, climate, and other factors had some impact on SOC density. If ΔR2 > 2% of the factors were the main impact factors, the main environmental factors affecting the SOC density of the Ningxia Basin of the Yellow River wetlands, in turn, were soil moisture, human disturbances, TB, TN, and soil pH.
4. Discussion
4.1. Replicability and Accuracy of RS-MLRM
It has been proposed that the RS-MLRM estimating SOC could be widely applied to a variety of ecosystems. The SOC assessment using the RS-MLRM was identical with the SOC of former studies [16,35], and our study in the Ningxia Basin of the Yellow River. The SOC and SOC density were assessed using RS-MLRM in 2000, 2010, and 2015. These results were similar to the second soil survey in China, which was studied by Dong, Yang, and Li [4,10,11,25,36,37]. It indicated that SOC and SOC density could be retrieved by RS-MLRM using a constructed RS factor and could be estimated by the SOC and SOC density of the historical year. In addition, the RS-MLRM, including textural factors, improves prediction accuracy.
4.2. High Soil Carbon Sink Function in the Ningxia Basin of the Yellow River Wetlands
In 2015, the average SOC density was higher in the Ningxia Basin of the Yellow River than in the wetland and inland arid regions of Northwest China [25]. It was more than the average SOC density of wetlands in China (7.89 tC/hm2) [38,39] (Table 9), as shown in Table 8, which indicated that the carbon sink effect of wetland soil was important in the Ningxia Basin of the Yellow River and that wetland restoration and protection projects have had a significant ecological effect. The results indicated that the wetland restoration and conservation projects were effective at changing carbon dynamics in inland arid regions in 2002. Our findings also show that the regional wetland restoration and conservation projects were the foremost factors in increasing carbon stocks in the project areas, especially in arid regions. Therefore, the sustained implementation of these wetland projects is critical for achieving the regional objective for carbon emission mitigation.
Table 9.
Carbon density of total soil in China.
Using the SOC and SOC density of the sampling points in 2000, 2005, 2010, and 2015 to make a significant analysis, the paired-test indicates that both SOC and SOC density in 2005 were lower than in 2000 (p = 0.002). However, their values turned out to be higher in 2010 and 2015 than in 2005 (p < 0.001), and there was a significant difference between 2000 and 2015 for both SOC and SOC density (p < 0.05).
4.3. Environmental Factors Affecting Wetland Soil Carbon Sinks
All of the environmental factors that form an ecosystem are related and affect changes in the organic carbon in a region [41,42]. The soil carbon sink is affected by many factors, such as human activities, soil moisture, soil physical and chemical properties, hydrological processes, vegetation, and climate [43]. The environmental factors, such as soil physical and chemical properties, vegetation, and climate, have jointly explained 63.6% of the soil carbon sink variability. These factors have also been considered in most previous studies [42,43,44]. Nevertheless, when human activity was included in the regression analysis, the integrated interpretation of the soil carbon sink variation by environmental factors and wetland types reached 67.6%. The influence of human activities on the soil carbon sink may far exceed the rate and extent of natural changes within a certain range [45]. However, there are only a few studies that consider the combination of environmental factors and human factors.
Human disturbance is also one of the main factors affecting soil carbon sinks. The constructed wetlands had higher SOC density than the rivers and lakes. The main reason for this is the implementation of a series of restoration and conservation projects in Ningxia in 2002. For example, one particular project involved linking the Aiyi River to the main lakes, while another involved creating a connection between the Daxi and Xiaoxi Lakes. The key wetland and other restoration projects have addressed the connectivity of smaller water systems. The projects have successfully countered wetland shrinkage in the region and brought substantial increases in SOC density since 2010. This indicates that wetland restoration and conservation projects can increase soil carbon sinks by increasing the soil carbon sequestration capacity through human interference [42].
Wetland soil C, N, and P content and ecological stoichiometry directly or indirectly affect the SOC in wetlands [14]. Most of the N in the soil exists in organic form, which is beneficial to the accumulation of SOC. Mineral N can reduce the mineralization rate of SOC. This is consistent with the findings of previous studies that SOC density increases with increasing soil moisture and decreases with soil bulk density and pH [2,31]. This indicates that the moister the soil, the slacker the structure, and the more delicate the texture, making it more conducive to the accumulation of organic carbon. In addition, one potential limiting factor for land carbon uptake is soil moisture, which can reduce gross primary production through ecosystem water stress, cause vegetation mortality, and further exacerbate climate extremes due to land–atmosphere feedbacks [1].
The change of wetland water level is often a key factor affecting material and energy conversion, element migration, and accumulation of the wetland ecosystem. There is a significant positive correlation between soil moisture and SOC density (p < 0.01), and it is an important factor affecting SOC density [18], as shown in Table 8. This conclusion is of great practical significance for soil carbon accumulation in this region. Due to the arid and semi-arid regions in northern China, the Ningxia Basin of the Yellow River suffers from aridity and scarcity of water resources. Throughout their history, the local population have planted a large amount of rice in the basin. When combined with suburbanization and industrial activities, this not only retains a large number of precious water resources but results in reduced wetland water. The large number of pesticides and fertilisers used also pose a hazard to water quality and safety.
Vegetation biomass plays a decisive role in surface SOC density [42], and SOC density has a strong and significant correlation with vegetation biomass (p < 0.05). Marshes displayed a higher SOC density than the other three types of wetland. The main reason for this is that reeds are the dominant vegetation in marshes with coverage of over 90% and have higher productivity. Reed marshes have high carbon input and low carbon output, which is conducive to soil carbon storage [11]. Moreover, the correlation between SOC density and climatic factors is weak. Therefore, it is difficult to predict the regional SOC density using climatic factors [44], which is consistent with the findings of Homann et al. [45].
5. Conclusions
- (1)
- In our study, we explored the models of combining texture features with a vegetation index for estimating SOC in four types of wetland (river, marsh, lake, and constructed wetland). To obtain the optimal predicted variable and SOC prediction model, all of the predicted variables derived from RS images were regressed against the measured SOC using single regression and stepwise multiple regression methods. The results showed that the optimal RS-MLRM was achieved using a combination of texture features and a vegetation index. The RS-MLRM of the four types of the wetland was evaluated using the LOOCV cross-validation method, and the results showed that the RS-MLRMs explored in this study had a strong estimation capability. Therefore, combining texture features with AGB can produce reliable SOC assessments for wetlands of the arid region in the Yellow River basin.
- (2)
- The wetland restoration and conservation project-induced contribution to carbon sequestration was a demonstration of the significant success of the restoration and conservation projects regarding carbon sequestration. Implementation of the wetland ecological restoration and conservation projects have significantly increased ecosystem carbon sequestration in the Ningxia Basin of the Yellow River. Increasing of soil carbon sinks was slower in the natural wetland than in the constructed wetland and restored wetland. The marshes increased in soil carbon sinks the most during the implementation of the wetland ecological restoration projects. The SOC density in the wetland restoration and conservation project implementation area was higher than the average of other wetlands in the past 15 years. Among the seven projects, Qingtongxia Reservoir Wetland Nature Protected Area made the largest contribution in terms of project-induced carbon sequestration. This indicates that the implementation of regional wetland ecological restoration and conservation projects could be a quantitatively important component of regional climate change mitigation strategies in arid areas. Thus, more attention should be paid to developing these projects.
- (3)
- The main factors affecting the soil carbon sink are human activities such as implementation of wetland restoration and conservation projects, ecological protection policies, sustainable management measures, soil moisture, soil physical and chemical properties, and soil pH. The restoration of wetland vegetation and hydrology will contribute to the accumulation of soil carbon in the future.
- (4)
- The wetland restoration and conservation projects will not only increase carbon sinks of wetlands and initiate the regeneration of soil carbon pools rapidly after restoration, but they also enhance climate conditions and natural landscapes of arid and semi-arid areas in the Ningxia Basin of the Yellow River. Therefore, encouraging reasonable human intervention can not only enhance the natural environment but can also further promote the construction and sustainable development of ecological civilization.
Author Contributions
Conceptualization, S.D. and W.M.; Data curation, X.B., S.D., and D.C.; Funding acquisition, X.B., S.D., D.C. and Y.F.; Investigation, X.B., W.M., Y.L., Y.F., and C.D.; Methodology, X.B. and D.C.; Writing—original draft, X.B. and D.C.; Writing—review and editing, Z.L. All authors have read and agreed to the published version of the manuscript.
Funding
This research was funded by Natural Science Foundation of Ningxia Province in China: 2019AAC03251; Chinese Academy of Sciences Class A Strategic Pilot Science and Technology Project: XDA20030203; the fund of China Postdoctoral Science Foundation: 2019M660341. Ningxia University Scientific Research Fund Project: ZR18016.
Conflicts of Interest
The authors declare no conflict of interest.
References
- Julia, K.G.; Sonia, I.S.; Alexis, M.B.; Kirsten, L.F.; Stefan, H.; David, M.L.; Pierre, G. Large influence of soil moisture on long-term terrestrial carbon uptake. Nature 2019, 565, 476–479. [Google Scholar] [CrossRef]
- Pretorius, M.L.; Van Huyssteen, C.W.; Brown, L.R. Soil colour indicates carbon and wetlands developing a colour-proxy for soil organic carbon and wetland boundaries on sandy coastal plains in South Africa. Environ. Monit. Assess. 2017, 189, 1–18. [Google Scholar] [CrossRef] [PubMed]
- Rogelj, J.; Den, E.M.; Hohne, N.; Fransen, T.; Fekete, H.; Winkler, H.; Schaeffer, R.; Sha, F.; Riahi, K.; Meinshausen, M. Paris Agreement climate proposals need a boost to keep warming well below 2 °C. Nature 2016, 534, 631–639. [Google Scholar] [CrossRef] [PubMed]
- Gibney, E. What to expect in 2018: Science in the new year. Nature 2018, 553, 12–13. [Google Scholar] [CrossRef]
- Hoffman, J.S.; Clark, P.U.; Parnell, A.C.; He, F. Regional and global sea-surface temperatures during the last interglaciation. Science 2017, 355, 276–279. [Google Scholar] [CrossRef]
- Bu, X.Y.; Dong, S.C.; Mi, W.B.; Li, F.J. Spatial-temporal change of carbon storage and sink of wetland ecosystem in arid regions, Ningxia Plain. Atmos. Environ. 2019, 204, 89–101. [Google Scholar]
- Mi, N.; Bu, X.Y.; Mi, W.B. Wetland ecosystem carbon storage function in Ningxia. J. Arid Land Resour. Environ. 2013, 27, 52–55. [Google Scholar]
- Sulman, B.; Desai, A.; Cook, B.; Saliendra, N.; Mackay, D. Contrasting carbon dioxide fluxes between a drying shrub wetland in Northern Wisconsin, USA, and nearby forests. Biogeosciences 2009, 6, 1115–1126. [Google Scholar] [CrossRef]
- Jin, F.; Yang, H.; Zhao, Q.G. Progress in the research on soil organic carbon storage and its influencing factors. Chin. J. Soils 2000, 32, 11–17. [Google Scholar]
- Lu, F.; Hu, H.F.; Sun, W.J.; Zhu, J.J.; Liu, J.B.; Zhou, W.M.; Zhang, Q.F.; Shi, P.L.; Liu, X.P.; Wu, X.; et al. Effects of national ecological restoration projects on carbon sequestration in China from 2001 to 2010. Proc. Natl. Acad. Sci. USA 2018, 115, 4039–4044. [Google Scholar] [CrossRef]
- Liu, Y.N.; Xi, M.; Zhang, X.L.; Yu, Z.D.; Kong, F.L. Carbon storage distribution characteristics of wetlands in China and its influencing factors. Chin. J. Appl. Ecol. 2019, 30, 2481–2489. [Google Scholar]
- Zhou, T.; Shi, P.J.; Luo, J.Y.; Shao, Z. Estimation of soil organic carbon based on Remote sensing and process model. J. Remote Sens. 2007, 11, 127–136. [Google Scholar] [CrossRef]
- Bernal, B.; Mitsch, W.J. A comparison of soil carbon pools and profiles in wetlands in Costa Rica and Ohio. Ecol. Eng. 2008, 34, 311–323. [Google Scholar] [CrossRef]
- Cao, S.; Cao, G.; Han, G.; Lin, Y.; Yuan, J.; Wu, F.; Cheng, S. Alpine wetland ecosystem carbon sink and its controls at the Qinghai Lake. Environ. Earth Sci. 2017, 76, 210. [Google Scholar] [CrossRef]
- Dong, L.L.; Yu, D.S.; Zhang, H.D.; Shi, X.Z. Temporal and spatial changes of soil organic carbon density in Ningxia Irrigation Zone from 1980 to 2009. Chin. J. Ecol. 2015, 34, 2245–2254. [Google Scholar]
- Wu, Y.; Wang, F.; Zhu, S. Vertical distribution characteristics of soil organic carbon content in Caohai wetland ecosystem of Guizhou plateau, China. J. For. Res. 2016, 27, 551–556. [Google Scholar] [CrossRef]
- Mitsch, W.; Bernal, B.; Nahlik, A.; Mander, Ü.; Zhang, L.; Anderson, C.; Jrgensen, S.; Brix, H. Wetlands, carbon, and climate change. Landsc. Ecol. 2013, 28, 583–597. [Google Scholar] [CrossRef]
- Zhang, L.; Guo, Z.H.; Li, Z.Y. Carbon storage and carbon sink of mangrove wetland: Research progress. Chin. J. Appl. Ecol. 2013, 24, 1153–1159. [Google Scholar]
- Ye, S.; Laws, E.A.; Yuknis, N.; Ding, X.; Yuan, H.; Zhao, G.; Wang, J.; Yu, X.; Pei, S.; DeLaune, R.D. Carbon sequestration and soil accretion in coastal wetland communities of the yellow river delta and Liaohe Delta, China. Estuaries Coasts 2015, 38, 1885–1897. [Google Scholar] [CrossRef]
- Bonan, G.B. Forests and climate change: Forcings, feedbacks, and the climate benefits of forests. Science 2008, 320, 1444–1449. [Google Scholar] [CrossRef]
- Xu, W.; Xiao, Y.; Zhang, J.; Yang, W.; Zhang, L.; Hull, V.; Wang, Z.; Zheng, H.; Liu, J.; Polasky, S.; et al. Strengthening protected areas for biodiversity and ecosystem services in China. Proc. Natl. Acad. Sci. USA 2017, 114, 1601–1606. [Google Scholar] [CrossRef] [PubMed]
- Zhao, R.F.; Zhang, L.H.; Zhao, H.L.; Jiang, P.H.; Wang, J.Z. Distribution of soil organic carbon of wetlands in the middle reaches of the Heihe river and its influencing factors. Sci. Geogr. Sin. 2013, 33, 363–370. [Google Scholar]
- Pan, G.X.; Xu, X.W.; Smith, P.; Pan, W.; Lal, R. An increase in topsoil SOC stock of China’s croplands between 1985 and 2006 reveal by soil monitoring. Agric. Ecosyst. Environ. 2010, 136, 133–138. [Google Scholar] [CrossRef]
- Yu, D.S.; Shi, X.Z.; Wang, H.J.; Sun, W.X.; Chen, J.M.; Liu, Q.H.; Zhao, Y.C. Regional patterns of soil organic carbon stocks in China. J. Environ. Manage. 2007, 85, 680–689. [Google Scholar] [CrossRef] [PubMed]
- Wang, Y.H.; Jiao, L. Characteristics and storage of soil organic carbon in the Ebinur lake wetland. Acta Ecol. Sin. 2016, 36, 5893–5901. [Google Scholar]
- Chen, J.M.; Black, T.A. Defining leaf-area index for non-flat leaves. Plant Cell Environ. 1992, 15, 421–429. [Google Scholar] [CrossRef]
- Bu, X.Y.; Mi, W.B.; Xu, N.; Zhang, X.; Mi, N.; Song, Y. Contents and ecological stoichiometry characteristics of soil carbon, nitrogen and phosphorus in wetlands of Ningxia plain. J. Zhejiang Univ. 2016, 42, 107–118. [Google Scholar]
- Bu, X.Y.; Mi, W.B.; Xu, H.; Dong, J. Estimating of ecological service value for different wetland types based on multi-source data fusion in Ningxia Plain. J. Zhejiang Univ. 2016, 42, 228–244. [Google Scholar]
- Deng, X.; Duan, Z.; Wang, Q.; Xia, G.; Zhao, Y. Research on growth characteristics of reed populations in Yinchuan Plain. J. Gansu Sci. 2014, 26, 1–5. [Google Scholar]
- Lv, X.G. Wetland Ecosystem Observations; Environmental Science Press: Beijing, China, 2005. [Google Scholar]
- Konen, M.E.; Burras, C.L.; Sandor, J.A. Organic carbon, texture, and quantitative colour measurement relationships for cultivated soils in North Central Iowa. Soil Sci. Soc. Am. J. 2003, 67, 1823–1830. [Google Scholar] [CrossRef]
- Leifeld, J.; Bassin, S.; Fuhrer, J. Carbon stocks in Swiss agricultural soils predicted by land-use, soil characteristics, and altitude. Agric. Ecosyst. Environ. 2005, 105, 255–266. [Google Scholar] [CrossRef]
- Charlotte, G.; Celia, R.; Celile, D.; Pierre, M.; Gudrun, B. Can soil organic carbon fractions be used as functional indicators of Wetlands. Wetlands 2017, 37, 1195–1205. [Google Scholar]
- Pachauri, R.K.; Allen, M.R.; Barros, V.R.; Broome, J.; Cramer, W.; Christ, R.; Church, J.A.; Clarke, L.; Dahe, Q.; Dasgupta, P.; et al. IPCC 2014 Climate Change: Synthesis Report Contribution of Working Groups I, II and III to the Fifth Assessment Report of the Intergovernmental Panel on Climate Change; Pachauri, R., Meyer, L., Eds.; IPCC: Geneva, Switzerland, 2014; p. 151.
- Li, S.; Zhang, Z.L.; Zhou, D.M. An estimation of above ground vegetation biomass in a national natural reserve using remote sensing. Geogr. Res. 2011, 32, 279–290. [Google Scholar]
- Yang, F.X.; Cao, G.C.; Yu, D.S.; Shi, X.Z.; Yu, Q.B.; Dong, L.L. Characteristics of different types of heavy fraction organic carbon in Ningxia Irrigation Zone. Bull. Soil Water Conserv. 2017, 37, 85–91. [Google Scholar]
- Li, X.X. Studies on the Soil Organic Carbon Sequestration and Its Influencing Factors in Farmlands on County Level of Northwest Arid Regions—A Case Study in Pingluo County, Ningxia Province. Master Thesis, The University of Chinese Academy of Sciences, Beijing, China, 2013. [Google Scholar]
- Yu, G.R.; He, N.P.; Wang, Q.F. Carbon Emissions and Carbon Sequestration Ecosystems in China: Theoretical Basis and Comprehensive Assessment; Science Press: Beijing, China, 2013; pp. 54–56. [Google Scholar]
- Zheng, Y.M.; Niu, Z.G.; Gong, P.; Dai, Y.J.; Shang, W. Preliminary estimation of the organic carbon pool in China’s wetlands. Chin. Sci. Bull. 2013, 58, 662–670. [Google Scholar] [CrossRef]
- Meng, W.Q.; Wu, Z.L.; Wang, Z.L. Control factors and critical conditions between carbon sinking and sourcing of wetland ecosystem. Ecol. Environ. Sci. 2011, 20, 1359–1366. [Google Scholar]
- Liu, Z.G. Carbon stock and GHG emission of wetland ecosystem. Sci. Geogr. Sin. 2004, 24, 634–639. [Google Scholar]
- Gao, J.Q.; Zhang, X.W.; Lei, G.C.; Wang, G.X. Soil organic carbon and its fractions in relation to degradation and restoration of wetlands on the Zoigê plateau, China. Wetlands 2014, 34, 235–241. [Google Scholar] [CrossRef]
- Homann, P.S.; Kapchinske, J.S.; Boyce, A. Relations of mineral-soil C and N to climate and texture: Regional differences within the conterminous USA. Biogeochemistry 2007, 85, 303–316. [Google Scholar] [CrossRef]
- Zhang, Y.; Shi, X.Z.; Zhao, Y.; Yu, D.S.; Wang, H.J.; Sun, W.X. Estimates and affecting factors of soil organic carbon storages in Yunnan-Guizhou-Guangxi region of China. Environ. Sci. 2008, 29, 2314–2319. [Google Scholar]
- Dong, L.L.; Yang, H.; Yu, D.S.; Zhang, H.D.; Liu, Y.; Shi, X.Z. Effect of irrigation with water diverted from the Yellow River on carbon sequestration in soils of different types in Ningxia irrigation zone. Acta Pedol. Sin. 2011, 48, 922–930. [Google Scholar]
Publisher’s Note: MDPI stays neutral with regard to jurisdictional claims in published maps and institutional affiliations. |
© 2020 by the authors. Licensee MDPI, Basel, Switzerland. This article is an open access article distributed under the terms and conditions of the Creative Commons Attribution (CC BY) license (http://creativecommons.org/licenses/by/4.0/).