Article

Thermodynamic Analysis and Comparison of Two Small-Scale Solar Electrical Power Generation Systems

MOE Key Laboratory of Enhanced Heat Transfer and Energy Conservation, Beijing Key Laboratory of Heat Transfer and Energy Conversion, College of Energy and Power Engineering, Beijing University of Technology, Beijing 100124, China
*
Author to whom correspondence should be addressed.
Sustainability 2020, 12(24), 10268; https://doi.org/10.3390/su122410268
Submission received: 3 November 2020 / Revised: 29 November 2020 / Accepted: 4 December 2020 / Published: 9 December 2020
(This article belongs to the Special Issue Energy Conversion Performance for Sustainable Development)

Abstract

:
In this study, two schemes of solar electrical power generation are designed and compared according to solar collection area minimization. The one comprises the parabolic trough collector, dual-tank of molten salt heat storage, and Organic Rankine cycle. The other consists of photovoltaic cell, polymer electrolyte membrane water electrolyzer, and polymer electrolyte membrane fuel cell. The effects of irradiation value, environmental temperature, and energy storage type on thermodynamic performance were investigated. The results indicated that the solar irradiation value had a more obvious effect on the PV (photovoltaic) cell performance than environmental temperature, and the PTC (parabolic trough concentrator) performance was improved with the increases of solar irradiation value and environmental temperature. The environmental temperature effect was negligible; however, the influence of irradiation value was obvious. Irradiation value had a positive effect on the former system, whereas it demonstrated the opposite for the latter. The latter system had much lower efficiency than the former, due to the low conversion efficiency between hydrogen energy and electrical energy in the polymer electrolyte membrane water electrolyzer and fuel cell. Stated thus, the latter system is appropriate for the power generation system with non-energy storage, and the former system is promising in the power generation system with energy storage.

1. Introduction

Solar energy, as a clean and sustainable energy resource, is receiving increasing attention. Low- and medium- temperature solar energy utilization still faces a great challenge and problem. Solar energy is intermittent and susceptible to the weather; the effective way to solve this problem is introducing energy storage, but the jury is out on which kind of energy storage method is the best. At the present time, the available energy storage methods consist of thermal energy storage, hydrogen energy storage, and electrical energy storage. The solar electrical power generation process separately using these three energy storage methods can be described as Figure 1. For the Figure 1a, the solar energy utilization system with thermal energy storage is also called a solar thermal power generation system, in which solar energy is converted into thermal energy of heat transfer fluid in order to drive the power generation cycle; in the meantime, the spare thermal energy is conserved into the heat storage fluid when the irradiation is abundant, the heat transfer fluid and heat storage working fluid can be the same medium (the system is called direct heat storage system), or the different working fluid (the system is called indirect heat storage system) [1]. The stored energy is discharged and converted into power with heat and power conversion system when the solar irradiation is weak. The common heat and power conversion systems are Rankine cycle system and Organic Rankine cycle (ORC), and the ORC system is commonly used in the low- and medium- temperature solar utilization system [2]. For the low- and medium- temperature solar energy utilization system with hydrogen energy storage, as shown in Figure 1b, it usually includes a PV (photovoltaic) array, a water electrolyzer, and a fuel cell [3], solar energy can be converted into electrical energy by PV effect, and the remaining electrical energy, except for meeting the load, can be converted into hydrogen energy by the water electrolyzer. When the electric energy that is generated by PV array is unable to meet the demand, the fuel cell can convert hydrogen energy into electrical energy. In this research, the solar energy utilization system with hydrogen energy storage is called a solar PV power system integrated with hydrogen energy storage. For the third one, as shown in the Figure 1c, the solar energy is also directly converted into electrical energy by the PV cell, while the spare electrical energy is converted into chemical energy and stored in the battery [4]. When considering that the manufacture and processing of the storage battery are unfriendly to the environment, and the storage battery has a relatively short lifetime, therefore, the third one is not considered, only the former two systems are investigated and compared in this paper.
Several research groups over the past several decades have explored low- and medium-temperature solar thermal power generation systems. ORC can work at a lower pressure and temperature than the conventional steam Rankine cycle, which makes its configuration simple and cost low [5]. Several experimental and theoretical studies have examined ORC driven solar thermal power generation systems. Ferrara et al. [6] investigated the effects of working fluid, expander configuration, operation parameters on the system electrical efficiency, and obtained the optimal working fluid and proper operation parameters. Rayegan et al. [7] investigated 115 Organic working fluids, and found that 11 working fluids were appropriate for low and medium temperature solar thermal power generation system from the perspective of the thermal/exergy efficiency, net power output, and expansion ratio. Wang et al. [8] carried out the off-design thermodynamic performance on a solar ORC system that was driven by a compound parabolic trough concentrator (CPC) and with thermal oil heat storage system in a whole day, and the effects of environmental temperature and thermal oil flow rates in the collector tube on power output and exergy efficiency were explored. Mcmahan and Andrew [9] applied the rapid-screening model and finite-time thermodynamic analysis in designing and optimizing the solar ORC system, and examined the control for heat storage systems and operational strategies. Quoilin et al. [10] designed a 3 kW solar ORC system with a parabolic trough collector system and optimized operation parameters of the system. From the viewpoint of maximum power output, CO2 emission and economic performance, Sonsaree et al. [11] analyzed low temperature solar energy utilization with the ORC system, and compared and evaluated the performance of four different configuration systems. Caldino-Herrera et al. [12] designed a small-scale low temperature ORC system coupled to parabolic trough concentrator, in which therminol 55 was regarded as the heat transfer and storage medium. The thermal efficiency and second law efficiency under a specific condition are 8.02% and 57.99%, respectively. Borunda et al. [13] proposed a direct feed-storage configuration that was applied in the solar thermal Organic Rankine cycle system, which can realize the instant start of ORC power generation system no matter how the solar irradiation is. The results show that the heat storage volume when adopting the feed-storage configuration is much less than the system with a conventional configuration, for the same heat storage hours. In this system, two auxiliary heaters are added in order to keep the inlet temperature of thermal oil 170 °C. Chacartegui et al. [1] comparatively investigated two heat storage layouts in a 50 MW parabolic trough plant that was integrated with Organic Rankine cycle. One is the direct heat storage system with Hitec XL, the other is indirect heat storage system with Hitec XL as heat storage fluid and thermal oil as heat transfer fluid. The results showed that the system with direct heat storage layout required a smaller 26% storage tank than the system with indirect heat storage layout. 61.90% of the concentrated solar thermal power generation system adopted dual-tank molten salt heat storage type by 2017 [14]. Noting that, researches on solar thermal ORC system focused on Organic working fluid selection, component configuration optimization, operation parameters analysis, and optimization.
Although a PV cell has a higher photoelectric conversion efficiency than solar thermal power generation system, a sole PV system is unable to realize the continuous power generation in a whole day. The solar PV power system integrated with hydrogen energy storage was originally proposed in order to solve the electricity storage for a PV cell by Rahman and Tam [15] in 1988. Lehman and Chamberlin [16] established a 9.2 kW solar PV power generation system, in which the electrical energy that was generated by the PV cell stacks was mainly employed to drive the air compressor, and the excess electrical energy was used as the power source of the bipolar alkaline electrolyzer to produce the hydrogen gas, and a proton exchange membrane fuel cell was a back up power when the electrical power by the PV cell stacks cannot afford the user load. Torres et al. [17] simulated a 1 kW solar PV power system that was integrated with hydrogen energy storage for different locations in Mexico. In this system, the battery was used for high irradiation periods (short-term storage), and the hydrogen energy storage was applied in order to solve the long-term storage for the winter. However, the model established processes are not given. El-Shater et al. [18] designed a 2.24 kW solar PV power system, which comprised a isolated PV system, an electrolyzer, a proton exchange membrane fuel cell stack, and a three-bar hydrogen gas storage tank. The change trends of the output power of a year round PV system and the voltage versus current density for fuel cell were simulated with Simulink. Arsalis et al. [19] established a PV based system with hydrogen storage for residential applications, and analyzed the effect of capacities on the system thermal performance and economic performance. Sensitivity analysis indicated the decrease of the PV and electrolyzer, the increase of the lifetime can make the system more competitive. Jia et al. [20] reported a system consisting of PEMWE (proton exchange membrane water electrolyzer) in series with solar PV, and the system 48 h average solar to hydrogen efficiency can reach 30%, so the PV/PEMWE system seems to be cost effective.
As far as the available literature is concerned, a low- and medium- temperature solar thermal power generation system and solar PV power generation system that are integrated with hydrogen energy storage are seldom compared. In this research, the solar thermal power generation system comprises a parabolic trough concentrator, molten salt heat storage, and ORC system [21]. The solar PV power generation system consists of a PV cell stack, a photon exchange membrane electrolyzer, a hydrogen storage tank, and a photon exchange membrane fuel cell. The models of both systems were built based upon the Matlab software, respectively. The solar irradiation value and ambient temperature effects on the performance of these two systems were obtained. For convenient reading, the former system is abbreviated for the STORC-MSHS (solar thermal Organic Rankine cycle with molten salt heat storage) system, and the latter system is short for SPV-PEMWE (solar photovoltaic cell with proton exchange membrane water electrolyzer) system.

2. System Description

In this section, a large collection of the symbols exit, so the nomenclature and subscripts are provided in Table 1 and Table 2.
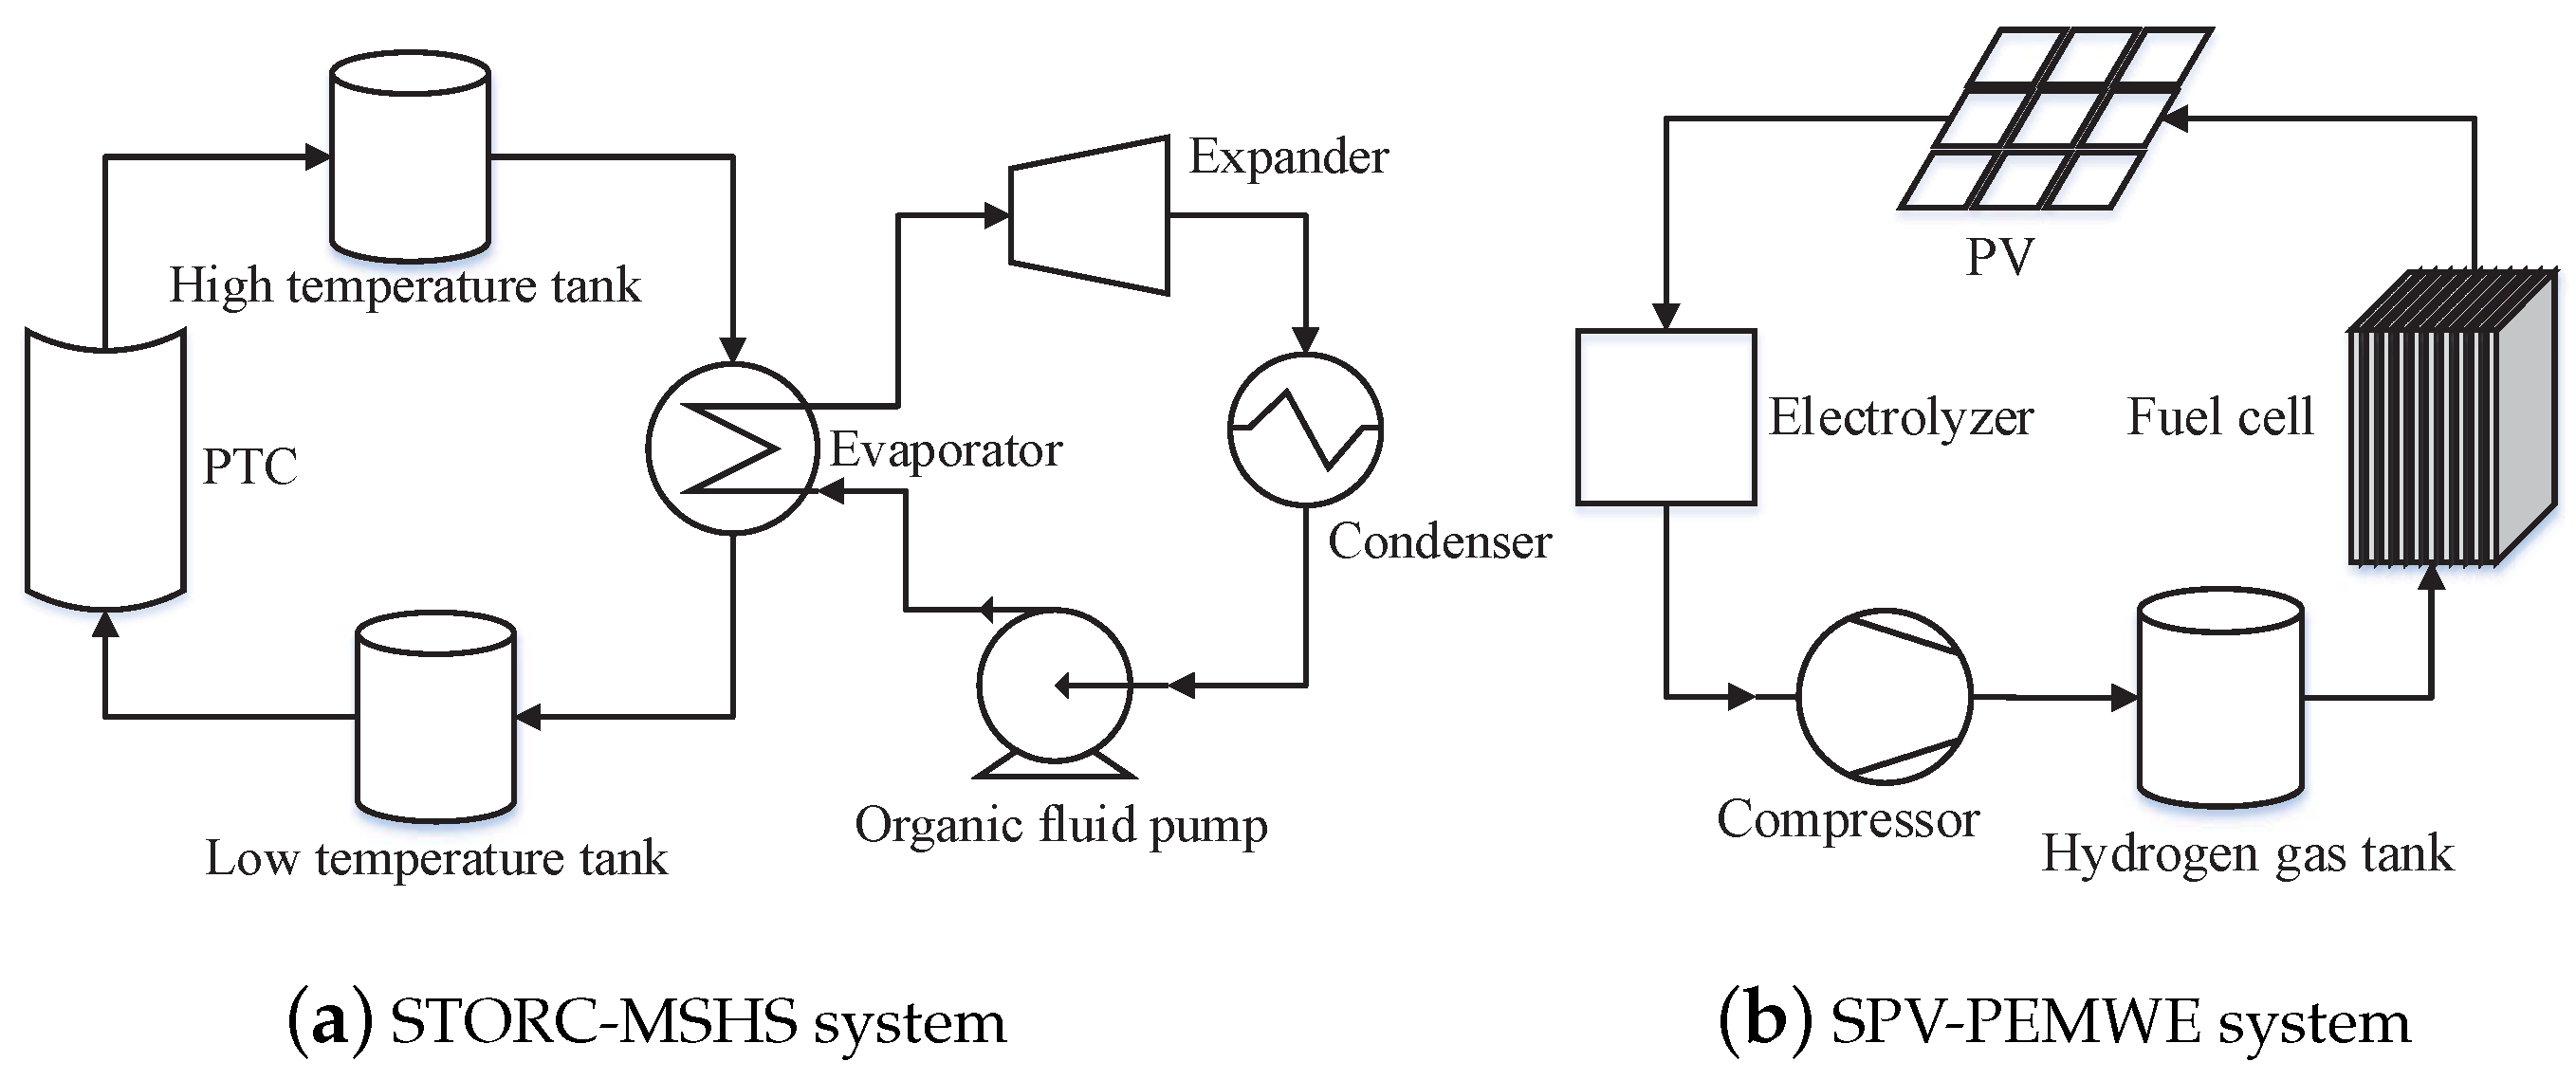
Figure 2 shows the schematic diagrams of these two solar utilization systems. For the STORC-MSHS system, firstly, solar energy was converted into internal energy of molten salt by the parabolic trough concentrator, and then molten salt exchanges heat with Organic fluid, finally the vaporized and pressured Organic fluid enters the expander, and power is generated. When solar irradiation was abundant, the residual energy was stored in the molten salt tank as thermal energy. When solar energy is not sufficient for driving ORC, the molten salt heat storage system can effectively ensure a continuous operation of the ORC system. For the SPV-PEMWE system, solar energy was converted into electrical energy by the means of PV effect, the spare electrical energy is used as the power input of the PEMWE, in which water is electrolyzed as hydrogen and oxygen gas, which realizes the conversion from the electrical energy to the hydrogen energy. When the PV cell was unable to satisfy the electricity requirement of the user load, the stored hydrogen gas is converted into electrical energy in the PEMFC (proton exchange membrane fuel cell) in order to keep the system operating continuously.
Two systems are compared when the power output is 5 kW. For the STORC-MSHS system, Table 3 shows the main parameters for PTC (parabolic trough concentrator) and ORC (Organic Rankine cycle).
For the SPV-PEMWE system, Table 4 shows the main parameters for the PV cell, PEMWE, and PEMFC.

3. Model Establishing

3.1. STORC-MSHS System Modelling

In the STORC-MSHS system, the model of the PTC, molten salt heat storage tanks, and ORC are built, respectively. Forristal [22] estalished a bidimensional model of PTC collector tube, which can predict the outlet temperature and heat loss of the collector tube. The heat transfer process from heat transfer fluid in the absorber to the air can be divided into five parts. They are forced convective heat transfer of the heat transfer fluid, conductive heat transfer of the absorber wall, natural convective heat transfer of the annulus, conductive heat transfer of the glass envelope wall, and convective and radiative heat transfer at the outer of the collector tube. The required collector tube length and heat loss can be obtained by modeling the PTC collector tube when the inlet temperature of the heat transfer liquid is known.
For dual molten salt tanks, the cold tank temperature is set as 200 °C. When the heat loss of pipe line between cold tank and the inlet of collector tube is negligible, the inlet temperature of collector tube can be considered to be the cold tank temperature. This hypothesis is applicable for the hot tank and outlet temperature of the collector tube. When appropriate insulation measurement is applied in dual molten salt heat tanks, the temperature drops of two tanks can be controlled below 40 °C in one month, which indicates the temperature drops for dual tanks in a specific day is lower than 1.5 °C, the heat loss of dual tanks can be compensated by the valley-time electricity energy.
The consumed electricity energy per day can be calculated, as follows:
Q e = c p H m H Δ T H + c p C m C Δ T C
where, m H is molten salt total mass in the hot tank, c p H is the specific heat capacity at a constant pressure of molten salt in the hot tank, Δ T H is the temperature drop of the hot tank in one day, m C is the total mass of molten salt in the cold tank, c p C is the specific heat capacity at a constant pressure for the cold tank, and Δ T C is the temperature drop for the cold tank in one day.
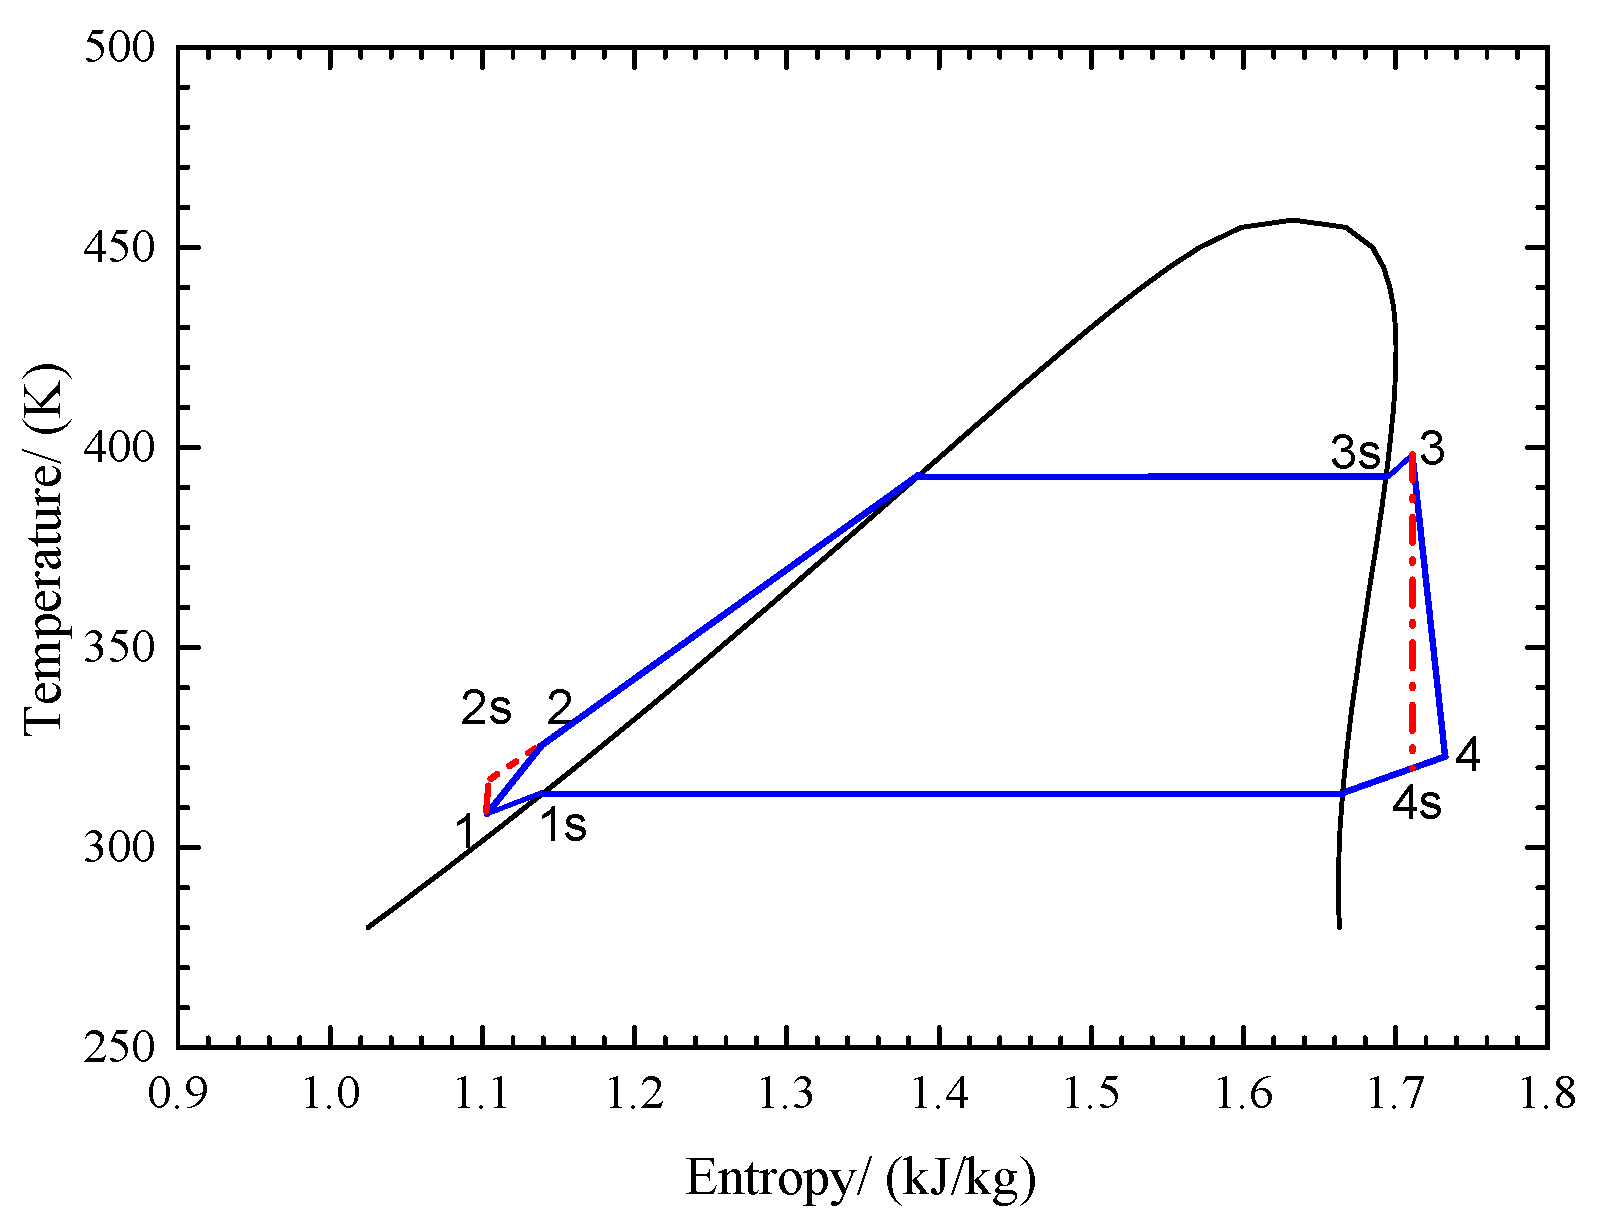
ORC system conventionally includes four main components: evaporator, expander, condenser, and Organic working fluid pump. It is difficult to establish each component model, but the energy flow can be obtained through the state point, like evaporation temperature, condensation temperature, and so on. In this part, the evaporation and condensation temperatures are 120 °C and 43 °C, respectively. Selecting an appropriate working fluid is vital for ORC system, R123 is chosen as the working fluid, because it has a stable and satisfactory performance at the setting temperature, and it is also much cheaper and more friendly to the environment than most of the Organic working fluids.
Figure 3 shows the T-s diagram of R123; it also exhibits four processes in ORC system: compression, heat absorption, expansion, and heat rejection processes. There are some assumptions when calculating the value of each state point: (1) pressure drops in the evaporator and condenser are negligible; (2) pressure drops of the pipelines are zero; and, (3) enthalpy drop in the expander is converted into the shaft work completely.
The outlet enthalpy value of the expander h 4 is calculated according to the following equation:
h 4 = h 3 η exp h 3 h 4 s
where, h 3 is the outlet enthalpy value of the evaporator, η exp is the isentropic efficiency of the expander, and h 4 s is the isentropic outlet enthalpy of the expander.
The outlet enthalpy value of the working fluid pump can be computed, as follows:
h 2 = h 1 + h 2 s h 1 η p u m p
where, h 1 is the inlet enthalpy value of the condenser, η p u m p is the isentropic efficiency of the working fluid pump, and h 2 s is the isentropic outlet enthalpy value of the working fluid pump.

3.2. SPV-PEMWE System Modeling

Table 4 shows the PV main parameters, and its V-I performance at real irradiation value and environmental temperature was obtained according to the reference [23], in which the V-I equation of the PV cell was simplified to the equation, as follows.
I = I s c 1 x 1 , r e f e V x 2 , r e f V o c 1
Two intermediate parameters, x 1 , r e f , x 2 , r e f are introduced in the above Equation (4), and they can be calculated as follows.
x 1 , r e f = V m , r e f V o c , r e f 1 1 ln 1 I m , r e f I s c , r e f
x 2 , r e f = 1 I m , r e f I s c , r e f e V m , r e f x 1 , r e f · V o c , r e f
The main performance parameters at standard operation condition were obtained from the PV cell supplier, including shortcut circuit current I s c , r e f , open circuit voltage V o c , r e f , and the corresponding current I m , r e f and voltage V m , r e f at the maximum power point.
The real temperature of PV cell can be calculated, as follows:
T P V = T a i r + 0.03 G P V
where, T a i r is the environmental temperature (°C) and G P V is the real irradiation value.
The real shortcut circuit current can be determined by the following equation:
I s c = G PV G r e f 1 + 0.0025 Δ T P V I sc , r e f
where, Δ T P V is the difference between the real PV cell temperature (°C) and the reference PV cell temperature. For the PV cell, the reference PV cell temperature is 25 °C, and the reference solar irradiation value G P V is set as 1000 W/m2.
The real open circuit voltage can be calculated, as follows:
V o c = 1 0.00288 Δ T P V 1 ln 1 + 0.5 Δ G P V V o c , r e f
where, Δ G P V is the difference between the real irradiation value and the reference irradiation value.
The maximum power output of a single PV cell can be obtained; in the meantime, the corresponding current and voltage at the maximum power output also can be calculated.
The current and voltage at the maximum power point and maximum power output of a single PV cell are calculated by the following equations, F P V is the filling factor.
I m = G P V G r e f 1 + 0.0025 Δ T P V I m , r e f
V m = V m , r e f · 1 0.00288 Δ T P V 1 ln 1 + 0.5 Δ G P V
P P V , m = I m V m F PV
When the maximum power output of a single PV cell is provided. The required PV cell area (cm 2 ) can also be determined by the following equation.
A P V = I s c I c m V o c V c e l l P o u t P P V , m a x
The photoelectric conversion efficiency of SPV-PEMWE system without a hydrogen energy storage system is defined, as follows.
η P V = 10 4 P o u t G P V A P V
PEMWE can be modeled according to the reference [24], and the reversible potential is calculated, as follows:
E 0 , r e v = 1.229 0.9 × 10 3 T w e 298.15
where T w e is the water electrolyzer temperature (K).
The electrical conductivity of polymer electrolyte membrane can be obtained, as follows:
σ m e m = 0.005139 λ m e m 0.00326 e 1268 · 1 303 1 T w e
where if α m e m < 1 , λ m e m is calculated as 0.043 + 17.81 α m e m 39.85 α m e m 2 + α m e m 3 , otherwise, λ m e m is calculated as 14 + 1.4 α m e m 1 .
PEMWE overpotential includes concentration overpotential, activation overpotential, and ohmic overpotential. They can be calculated, as follows, respectively.
Concentration overpotential is calculated, as follows.
V c o n = R T w e 2 F ln P H 2 P O 2 0.5 P s , H 2 O
Activation overpotential is calculated, as follows.
V a c t = V a c t , a n + V a c t , c a = R T w e 2 α a n F a sinh j w e 2 j o , a n + R T w e 2 α c a F a sinh j w e 2 j o , c a
Ohmic overpotential and total overpotential are calculated, as follows.
V o h m i c = 10 4 δ m e m j w e σ mem
E w e = E o , r e v + V c o n + V a c t + V o h m i c
The hydrogen gas generation rate of the PEMWE can be described as the following equation.
q H 2 = i w e 2 F
Additionally, the oxygen gas generation rate of the PEMWE is calculated, as follows.
q O 2 = 0.5 i w e 2 F .
The required deionized water per PEMWE cell is determined while using the following equation:
q H 2 O = q H 2 η we
where η w e is the utilization efficiency of PEMWE cell.
PEMFC is a device that can convert hydrogen gas into electrical energy, and the model in this paper is established according to experimental data [25].
Hydrogen partial pressure and oxygen partial pressure can be calculated, as follows.
P H 2 = 0.5 P o , H 2 e 1.653 i F C T F C 1.334 P s , H 2 O
P O 2 = P a i r e 4.192 i F C T F C 1.334 P s , H 2 O
For the PEMFC, the ohmic potential loss, the activation overpotential, the concentration potential loss, and the Nernst potential loss can be calculated, as follows:
V o h m i c = i r
V a c t = R T FC 2 α F ln i i o
where, r is the internal resistance, α is conversion factor, and i o = 10 6.192 . α 1 , k , i L are amplification constant, mass transport constant, and limiting current density, respectively. If 1 i / i L > 0 , V c o n can be calculated as α 1 i k ln 1 i / i L ; otherwise, V c o n is 0.
The output voltage of the PEMFC is the sum of the ohmic potential loss, the activation overpotential, the concentration potential loss, and the Nernst potential loss.
E o u t = E n e r n s t + V a c t + V o h m i c + V c o n
E n e r n s t = G i b l i q R T F C ln P s , H 2 O P H 2 P O 2 0.5 2 F
If the output power P o u t of 5 kW is completely generated by the PEMFC, then the hydrogen gas consumption rate per second can be calculated, as follows.
Q H 2 , F C = P o u t V o u t 2 F η H 2 , F C
The overall efficiency of the SPV-PEMWE system can be developed in the following equation, when the solar irradiation is not enough.
η h s = η P V q H 2 Q H 2 , F C

3.3. Model Validation

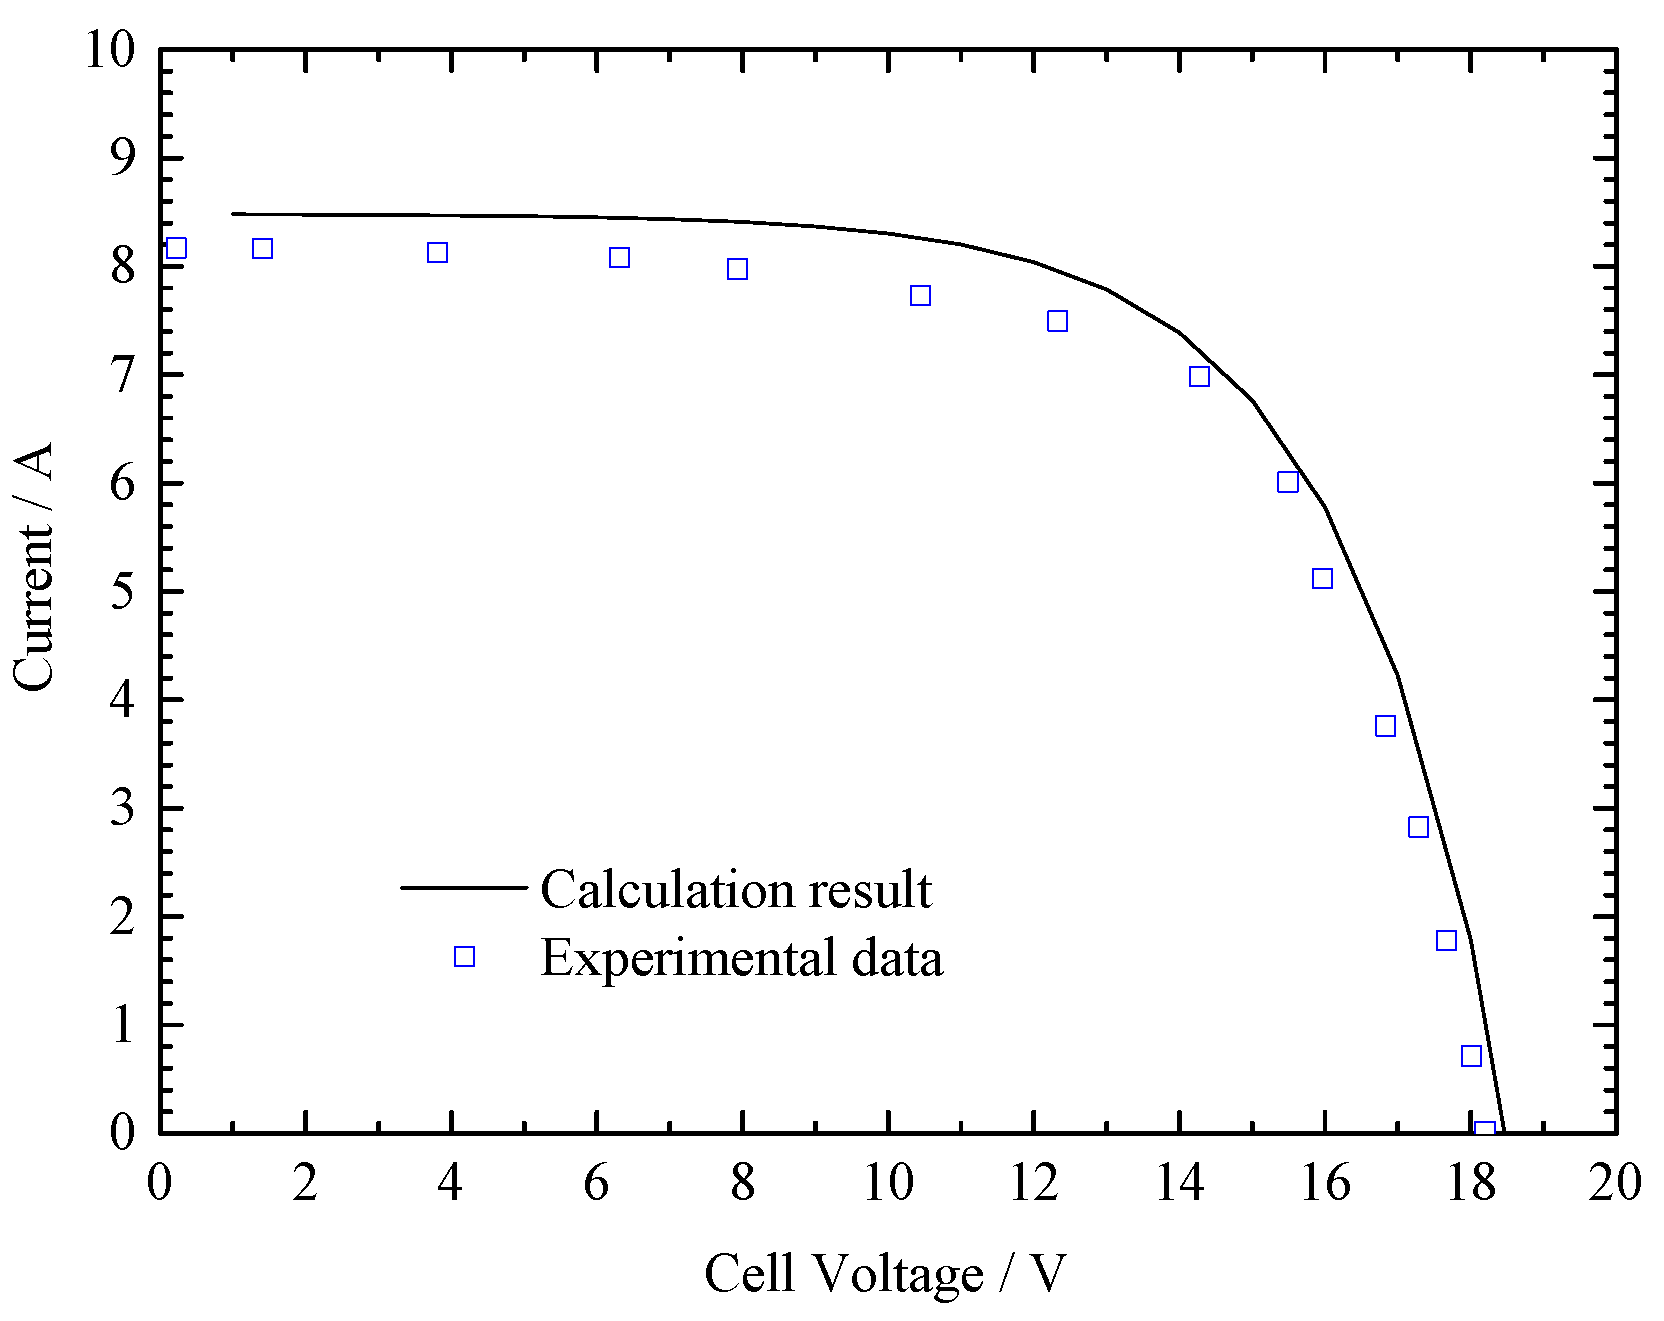
The model validation of STORC-MSHS system has been carried on in our previous paper [21]. Each component of the SPV-PEMWE system was validated, respectively. The PV model was built according to the reference [23]. The results of this model at different solar irradiation values and experimental temperatures were validated through the experimental data from the manufacturer, and they are within error permissibility. The agreement between the experimental data and calculation result is given as Figure 4, when the solar irradiation value is 800 W/m2 and environmental temperature is 25 °C.
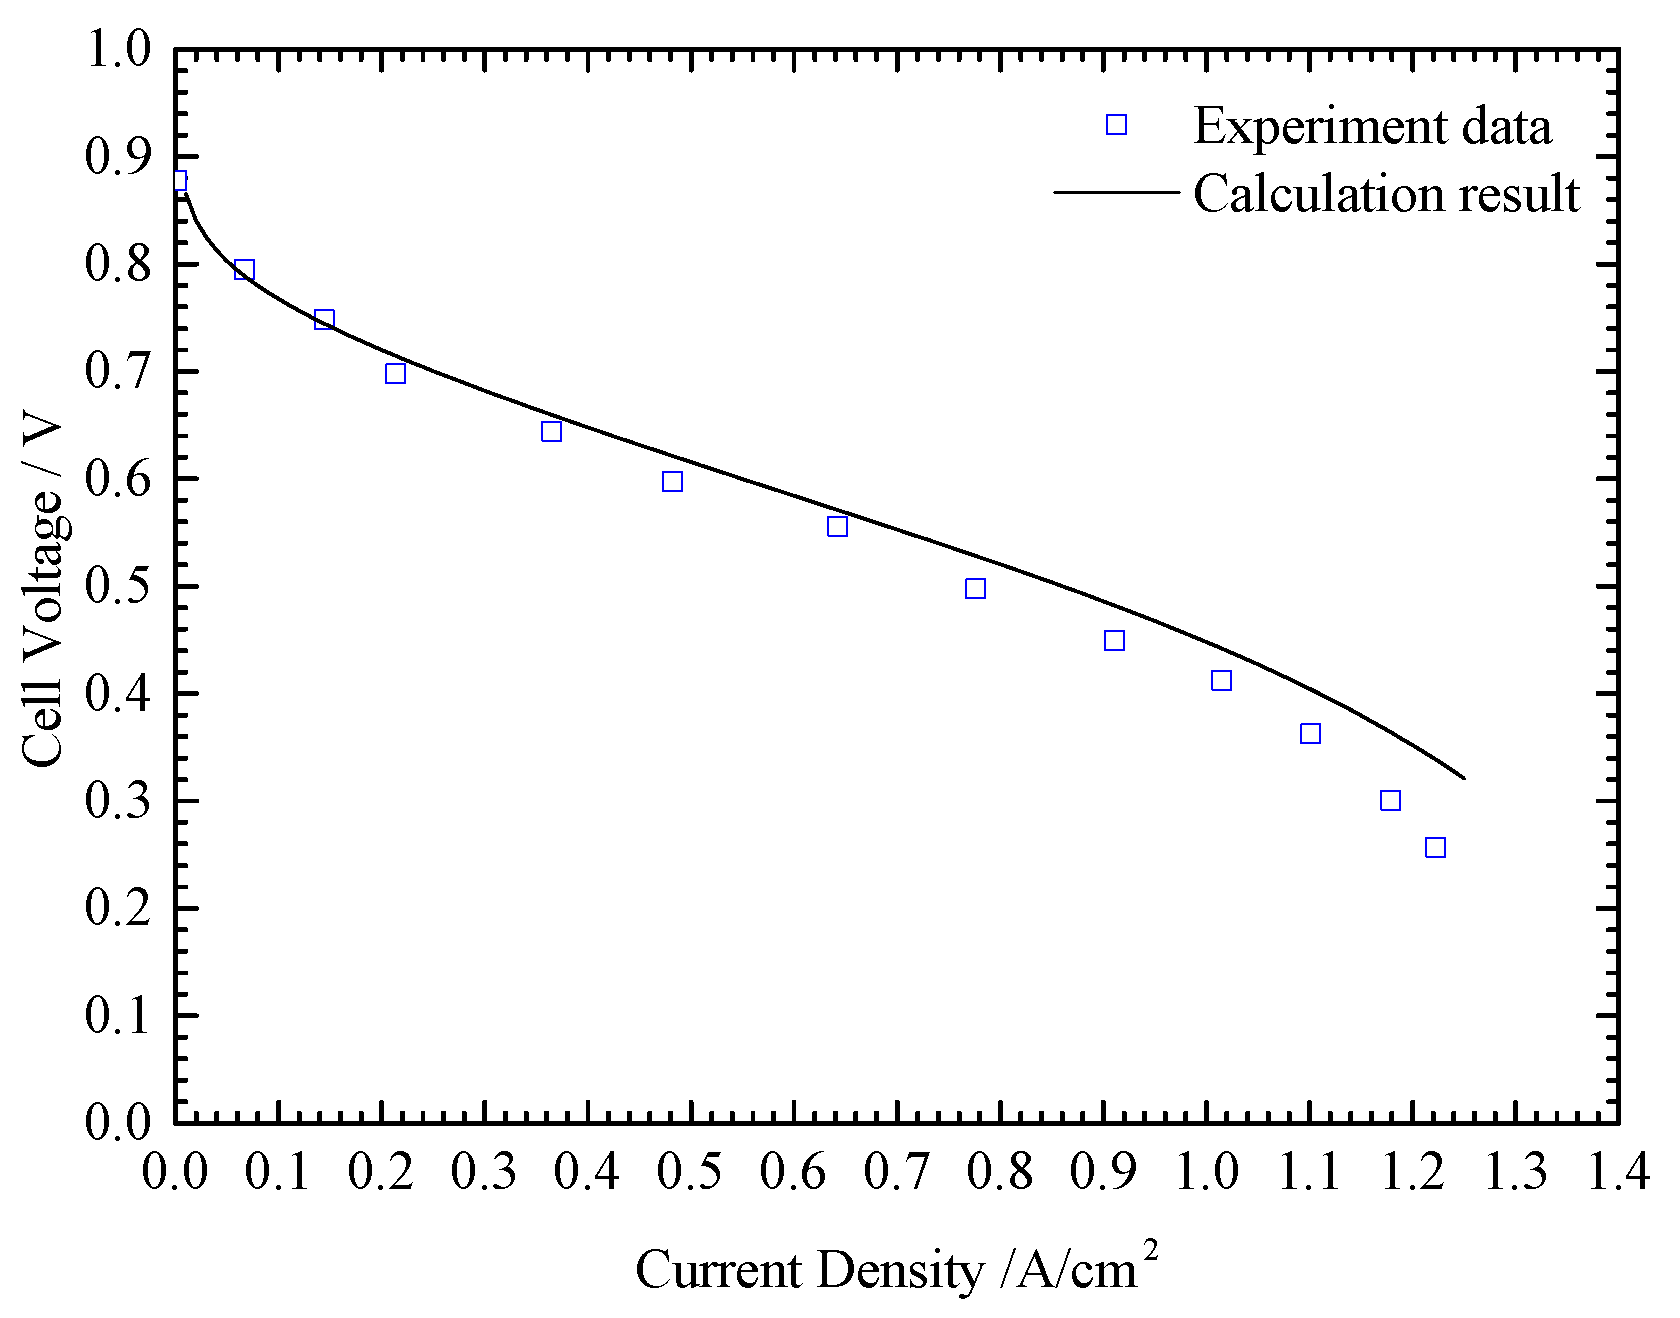
The PEMWE and PEMFC model were established based on the generally accepted equations, which have been adopted by many theoretical and numerical researches. Figure 5 shows the experimental data [26] and calculation result for the PEMWE system, depicting a good agreement between the calculation result and experimental result. The PEMFC verification result is shown in Figure 6, and the experimental data is from the reference [27]. The theoretical result can predict the PEMFC performance in the low- and medium- current density, and it has an acceptable bias between the calculation result and experimental data when the current density is high.

4. Results and Discussion

Environmental temperature and solar irradiation value are the two main factors influencing the system performance. It is necessary to investigate the impact of environmental temperature and irradiation value.

4.1. Irradiation Value and Environmental Temperature Effect on the PV Cell Performance

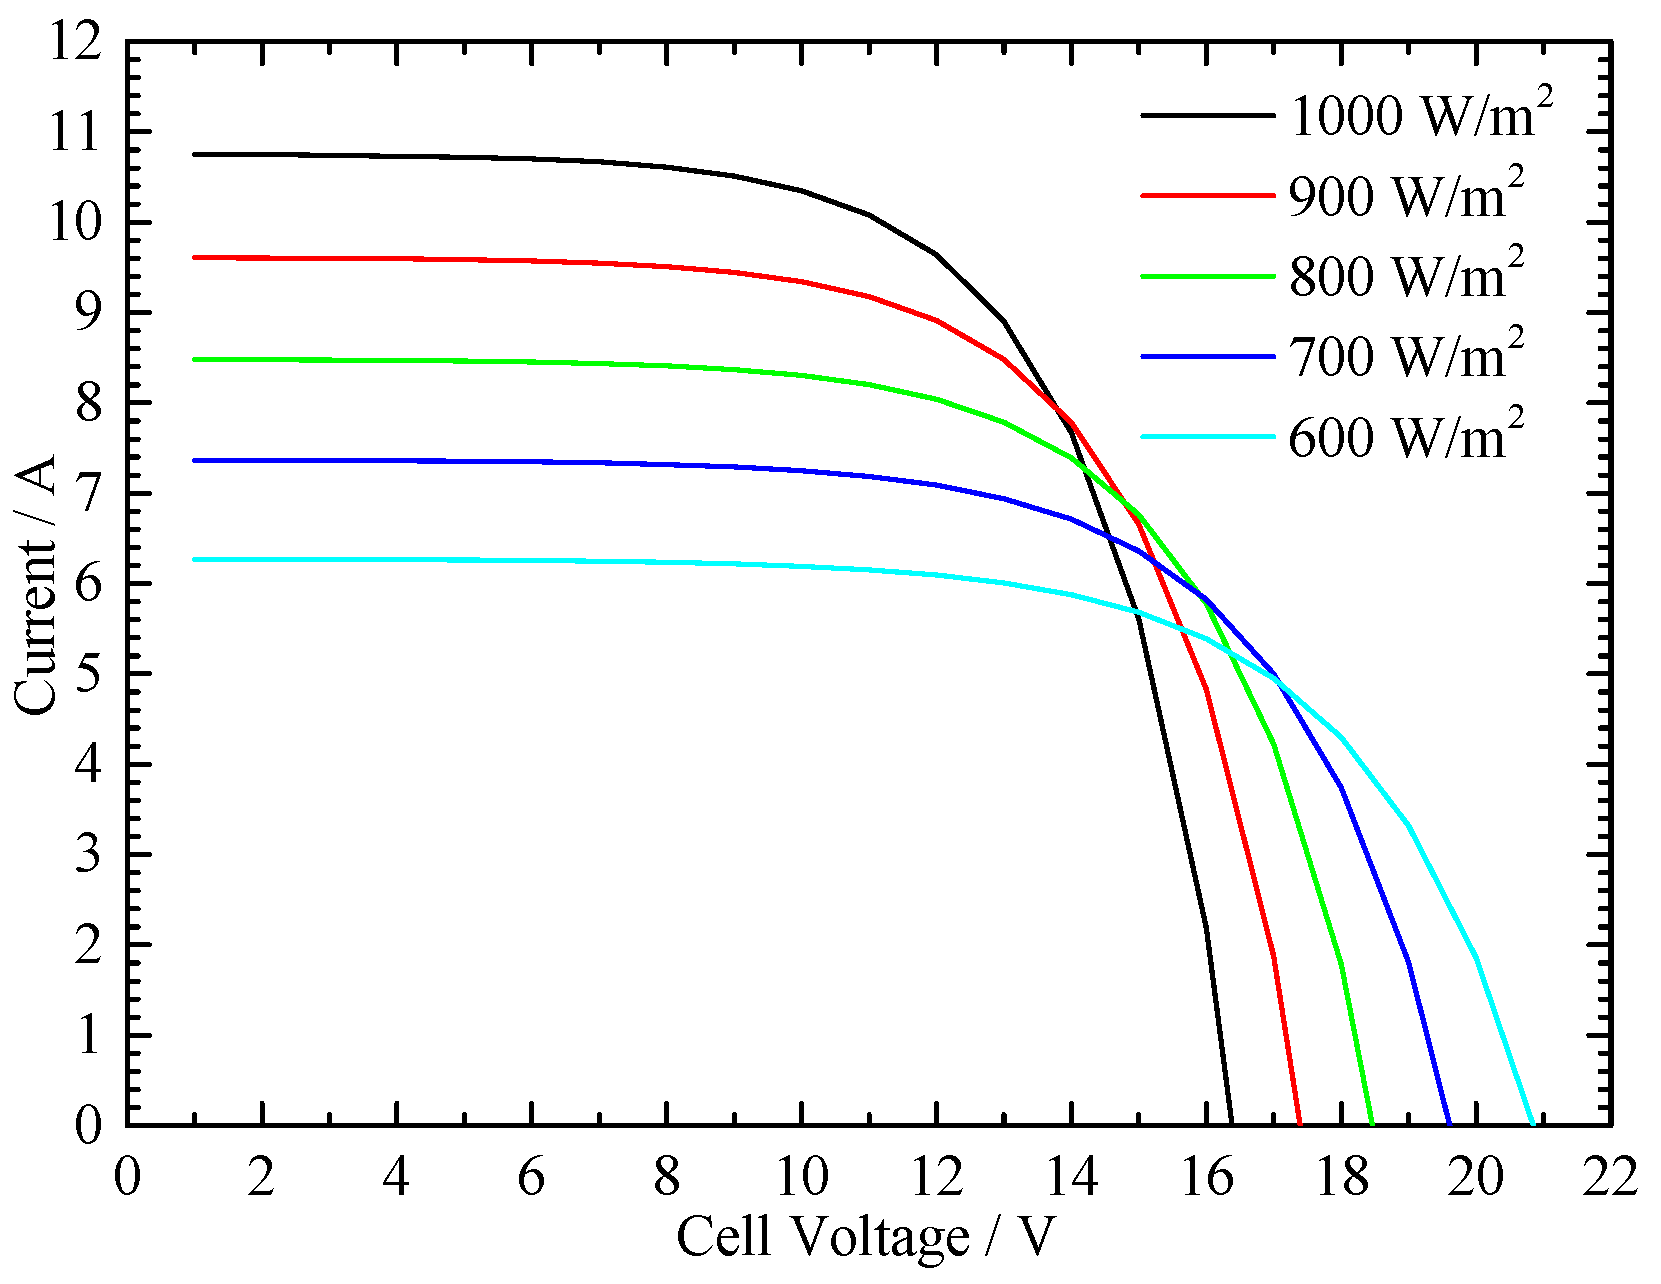
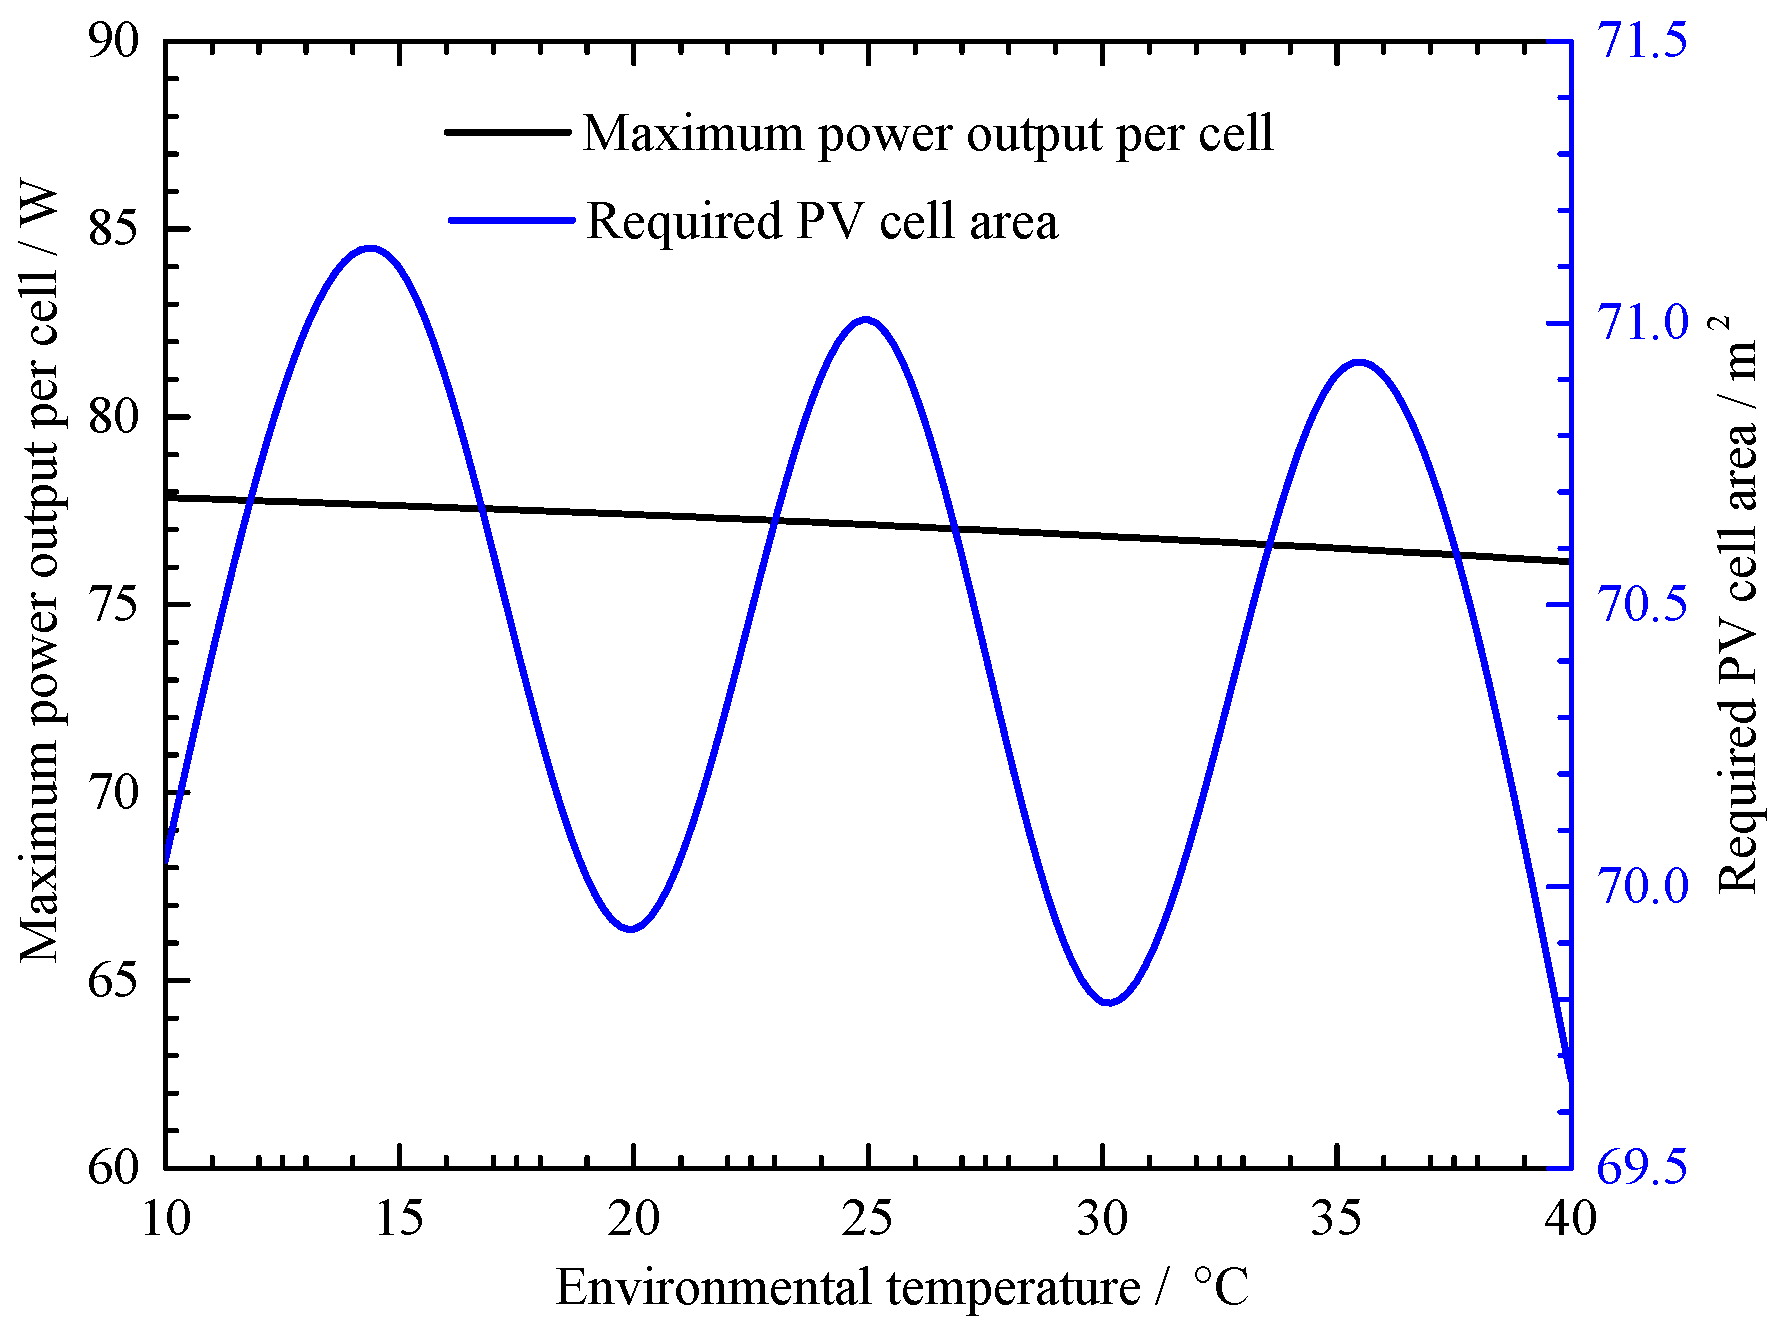
For the SPV-PEMWE system, environmental temperature and irradiation value primarily influence PV cell performance. Therefore, the impacts of environmental temperature and irradiation value on PV cell V-I performance, power output, and PV array area were investigated, and the results are shown in Figure 7, Figure 8, Figure 9 and Figure 10. Firstly, the cell voltage of PV cell decreases slowly, and then drops quickly with the cell current. The higher the irradiation value, the higher short circuit current. When comparing Figure 7 with Figure 8, it was easily found that irradiation had a more obvious impact on V-I performance of PV cell than environmental temperature, and the V-I performance was more sensitive to the change of the irradiation value. Figure 9 shows the maximum power output per PV cell and the required PV cell area change with irradiation value. The maximum power output per PV cell increased with the increase of irradiation value when the electrical power output was constant. The required PV cell numbers should decrease, thus the required PV cell area decreases. However, the required PV cell area increases slightly when the irradiation value is 700 W/m2, which is caused by the extreme increase of shortcut circuit current, and then the required PV cell area decreases with the irradiation value. Figure 10 shows the influence of environmental temperature on the maximum power output per PV cell and the required PV cell area; the maximum power output per PV cell is almost unchangeable, only a trivial decline. Environmental temperature increase led to the increase of the PV cell temperature, which was negative for the PV cell electrical power generation, and the maximum power output per PV cell decreased. The required PV cell area shows an interesting tendency when the environmental temperature increases. The required PV cell area decreases with the increase of environmental temperature. This phenomenon is formed by the interaction between the shortcut circuit current and open circuit voltage.

4.2. Irradiation and Environmental Temperature Effect on the PTC and MSHS Performance

For the STORC-MSHS system, the environmental temperature can both impact the PTC and MSHS performance. However, the irradiation value mainly impacts the PTC performance. If the ORC system adopts the air-cooling way to decrease the working fluid temperature, then environmental temperature also has an obvious influence on the ORC system performance. In this study, the water-cooling method was adopted, so the influence of environmental temperature on the ORC system can be ignored.

4.2.1. Solar Irradiation and Environmental Temperature Effect on the PTC Performance

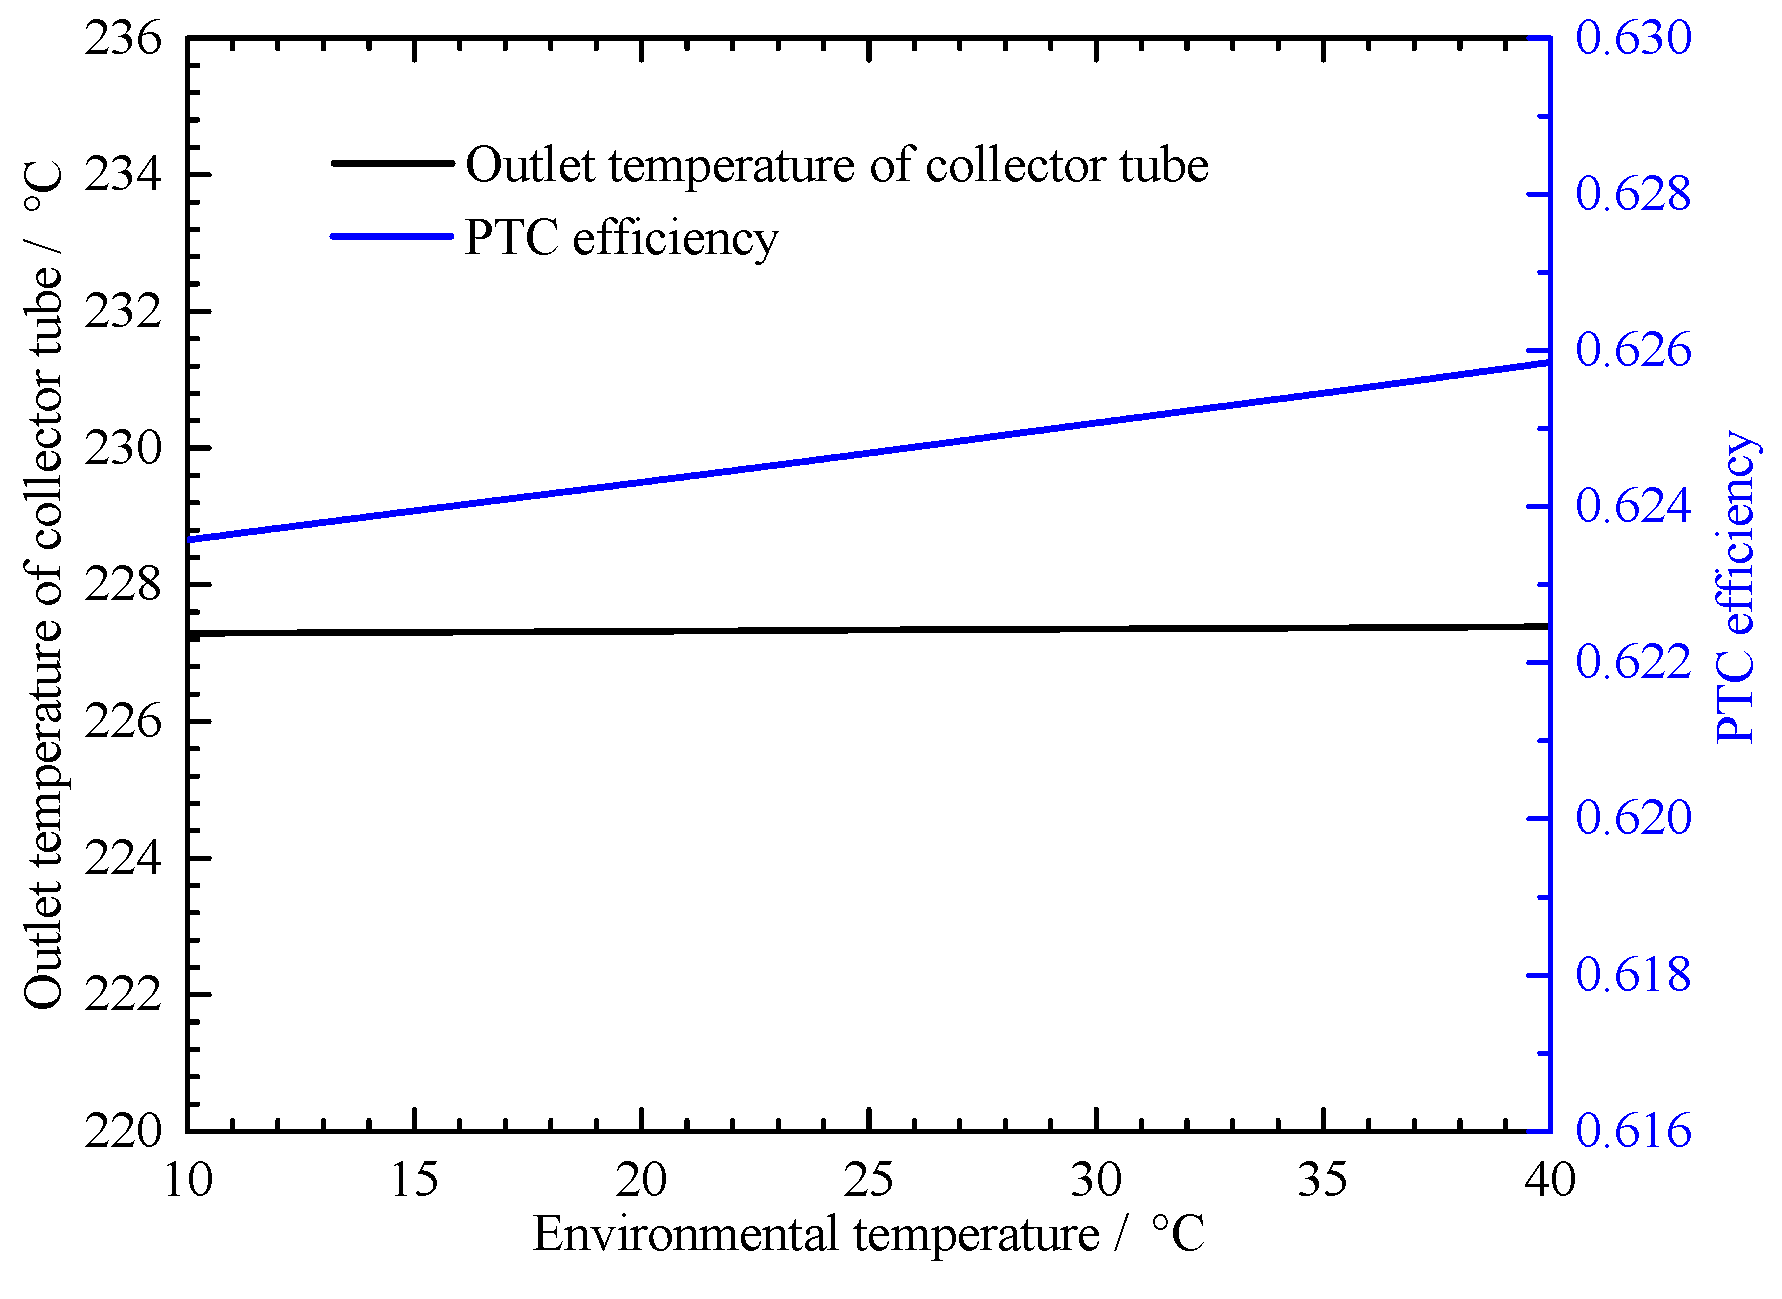
An important and intuitive indicator for PTC performance is the outlet temperature of PTC collector tube. The effects of irradiation value and environmental temperature on the outlet temperature were investigated when the molten salt mass flow rate was 2.0 kg/s and the inlet temperature of the collector tube was 200 °C. The required collector tube length is 23 m when the environmental temperature is 25 °C and irradiation value is 800 W/m2. Thus, the following results were obtained based on 23 m collector tube. Figure 11 shows the effects of irradiation value on the outlet temperature of PTC collector tube and PTC efficiency. With the increase of irradiation, the collector tube outlet temperature and PTC efficiency both increase. The outlet temperature of collector tube increases almost linearly, and the increase rate of PTC efficiency slows down. Figure 12 shows the environmental temperature effect on the outlet temperature of PTC collector tube and PTC efficiency. The environmental temperature effect was neglectable when compared with the irradiation effect. At the constant irradiation value, when environmental temperature varied from 10 °C to 40 °C, the outlet temperature change was less than 1 °C, and the PTC efficiency change was also weak. Therefore, the irradiation value played a more important role in the PTC performance than environmental temperature.

4.2.2. Environmental Temperature Effect on the MSHS Performance

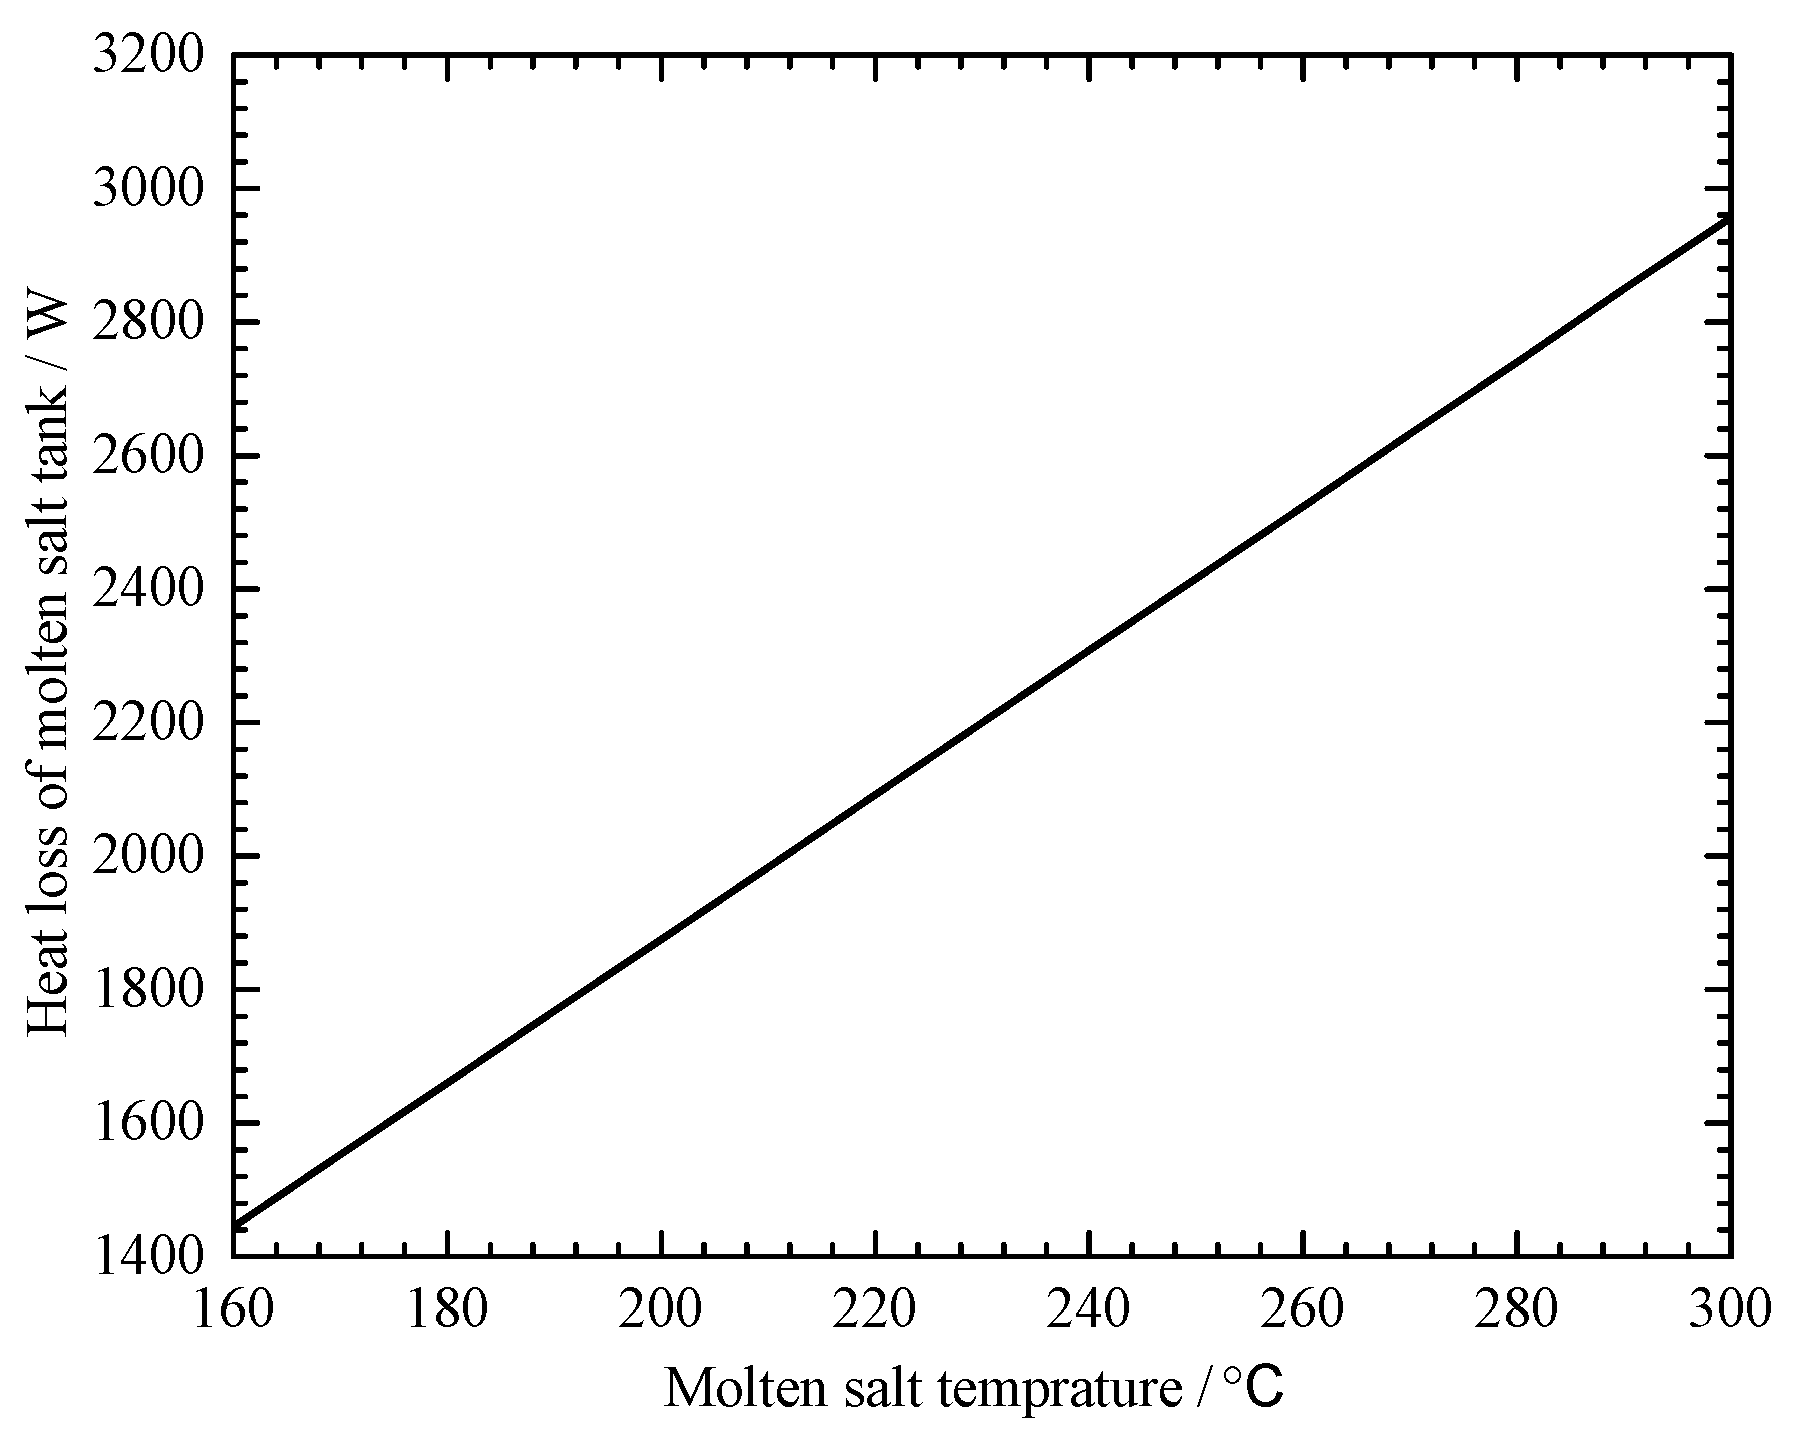
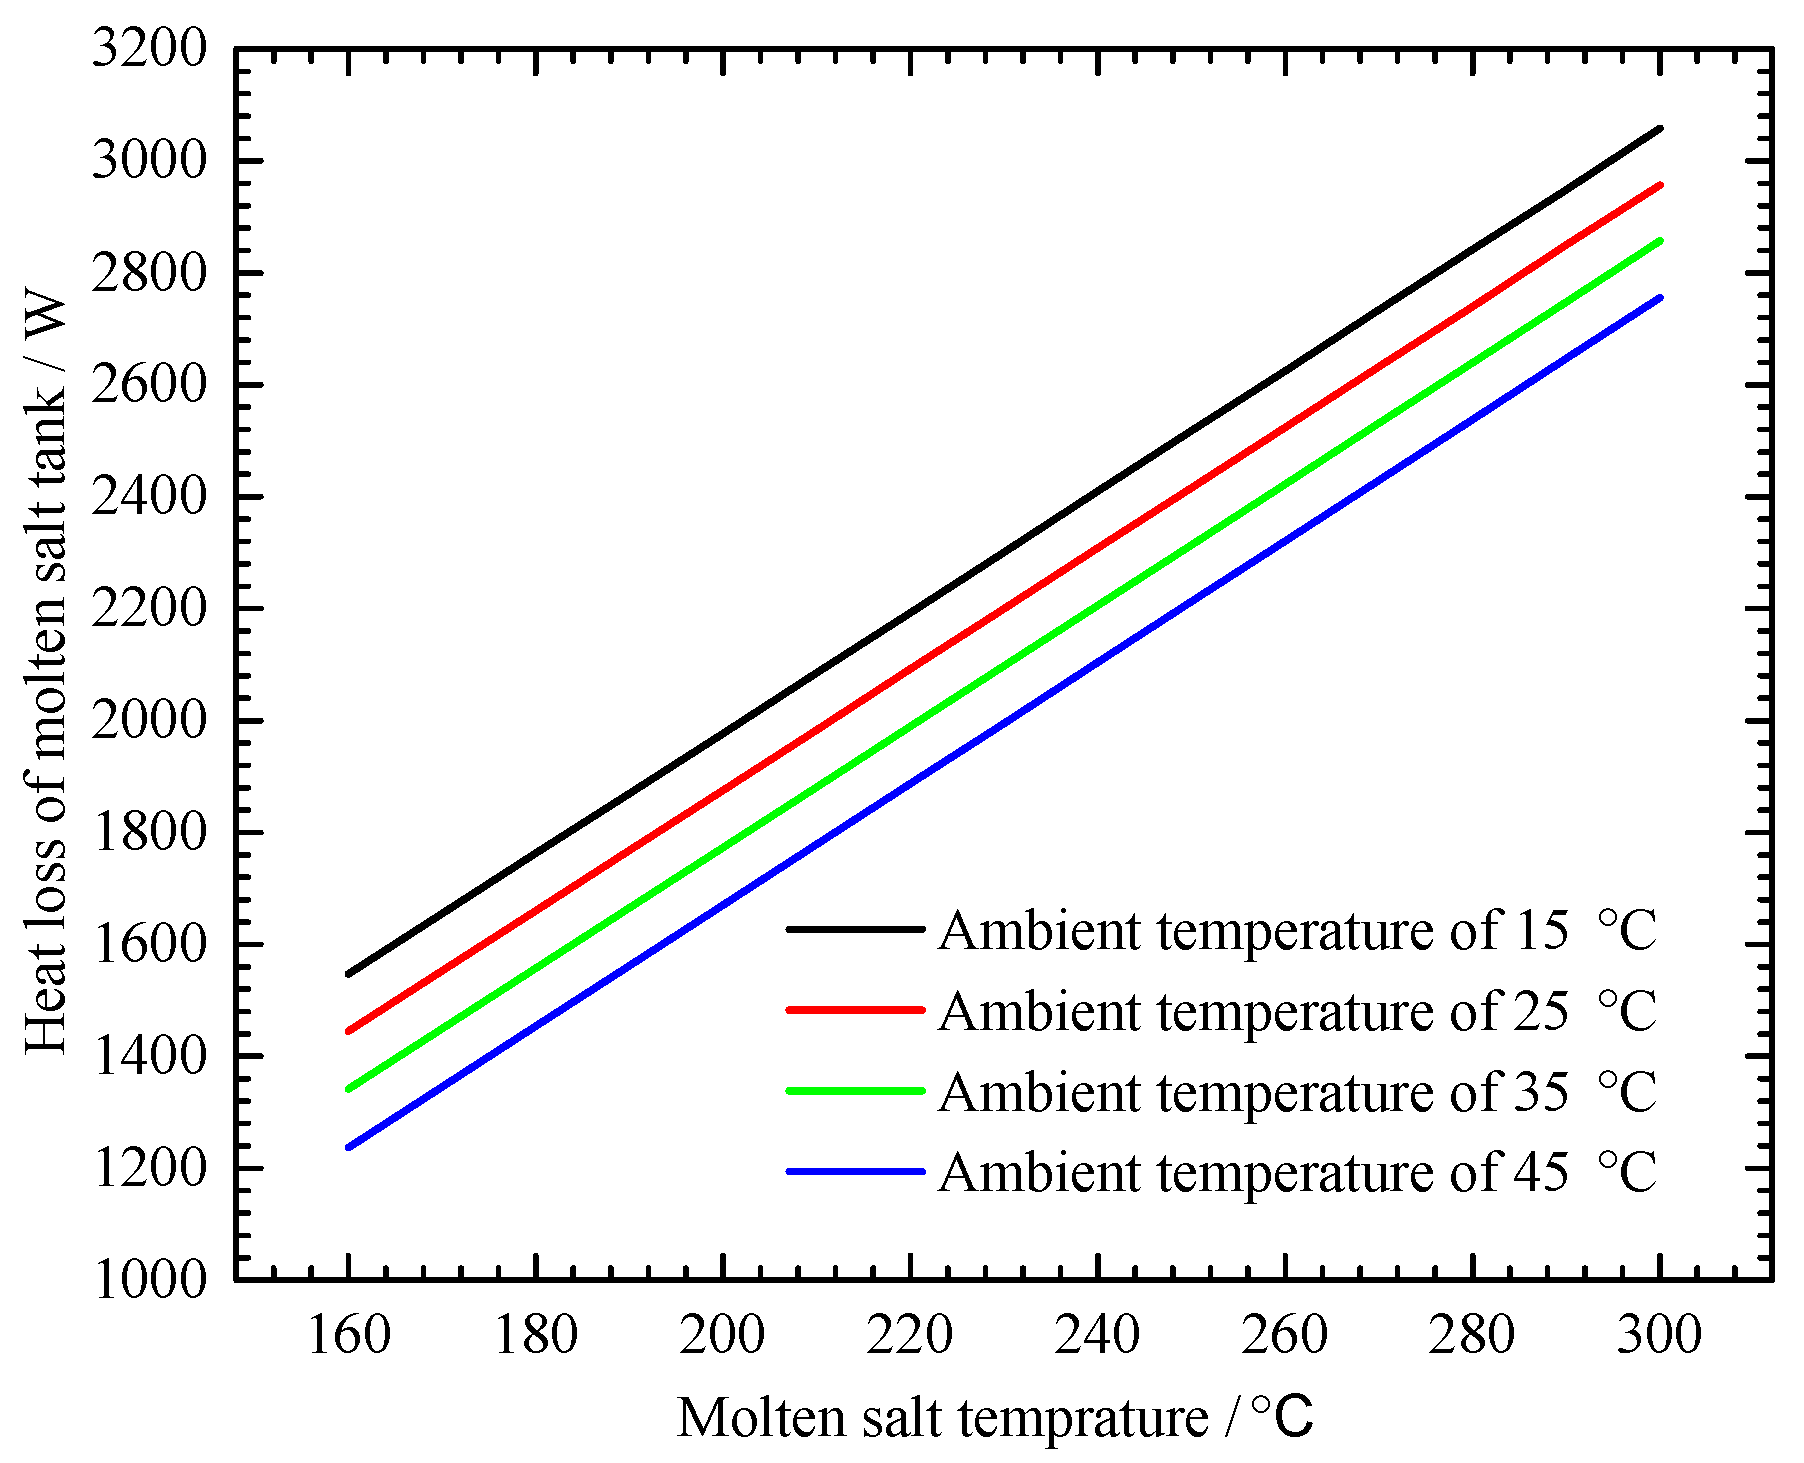
The heat losses of dual molten salt tanks also change when the environmental temperature changes. Table 5 provides the parameters of the molten salt tank and insulation layer. The heat losses of molten salt tank at different temperatures can be obtained with the variation of environmental temperature, results were presented in Figure 13. With the increase of molten salt temperature, the heat loss of molten salt tank increases linearly. The correlation between molten salt temperature and the heat loss of molten salt tank can be fitted with the calculation data, and the heat loss of molten salt tank is easily calculated according to molten salt temperature and the correlation (as Equation (32), where environmental temperature is 25 °C). The heat loss trend of molten salt is shown in Figure 14, when the environmental temperature increases from 15 °C to 45 °C. It is obvious that the heat loss of molten salt tank drops greatly when environmental temperature increases. The increase of environmental temperature reduced the temperature difference between the outer surface of molten salt tank and the atmosphere; therefore, the radiative heat transfer process was weakened and heat loss decreased.
Q l o s s = 10.8139 · T m s 287.3203

4.3. Energy Storage Type Effect on the System Performance

These two systems adopt two energy storage types: thermal and hydrogen energy storage. Thus, it is necessary to investigate energy storage type’s effect on the system’s performance. When nominal electrical power generations of two system were both 5 kW, the energy storage performances were compared. The baseline values of irradiation value and environmental temperature are 800 W/m2 and 25 °C, respectively. It should be noted that the irradiation value refers to the direct normal irradiation value for the STORC-MSHS system, and the irradiation value refers to the total irradiation value for the SPV-PEMWE system in the model establishing process.
For the STORC-MSHS system, the total heat loss rate of dual tanks of molten salt was 4.35 kW. The temperature of the hot tank declined almost 1 °C in two hours, which was unable to lead to the electrical power generation decrease. Thus, the system electricity generation efficiency using molten salt heat storage was mainly influenced by the ORC efficiency. ORC efficiency can reach 10.7%, according to the setting parameters of ORC system presented in Table 3.
For the SPV-PEMWE system, the solar irradiation value was set as 800 W/m2, and the environmental temperature was 25 °C. The hydrogen gas generation rate was 0.0036 mol/s, when all of the electricity generated by PV array was transferred into hydrogen energy. When the power output of the PEMFC system was set as 5 kW, the hydrogen gas consumption should be 0.0461 mol/s. Therefore, the system efficiency using hydrogen energy storage is 7.8%, which is 37.3% lower than the system with molten salt heat storage.
The system performance is investigated when the electricity generation completely depends on the heat storage system. Based on the results that are presented above, the irradiation value primarily affects the top cycle performance (PTC and PV array performance), and the environmental temperature has an obvious influence on the other systems. Figure 15 shows the effect of environmental temperature on the system electricity performance. The electrical efficiency of the system with molten salt heat storage is constant, and the efficiency of the system with hydrogen energy storage is much lower. The latter efficiency presents a downward and fluctuation trend in general. For the system with molten salt heat storage, the heat loss of the molten salt tanks changes little with the environmental temperature, and the ORC system efficiency keeps constant when environmental temperature increases, due to adopting a water cooling system. For the system with hydrogen energy storage, when environmental temperature increases, the current of per water electrolyzer cell increases, which leads to the increase of the hydrogen gas generation rate per cell. Environmental temperature increases also lead to the decrease of the parallel cell number, thus decreasing the hydrogen gas generation amount. Both reasons result in the fluctuant efficiency of the SPV-PEMWE system with hydrogen energy storage.

4.4. Solar Irradiation Impact on System Efficiency

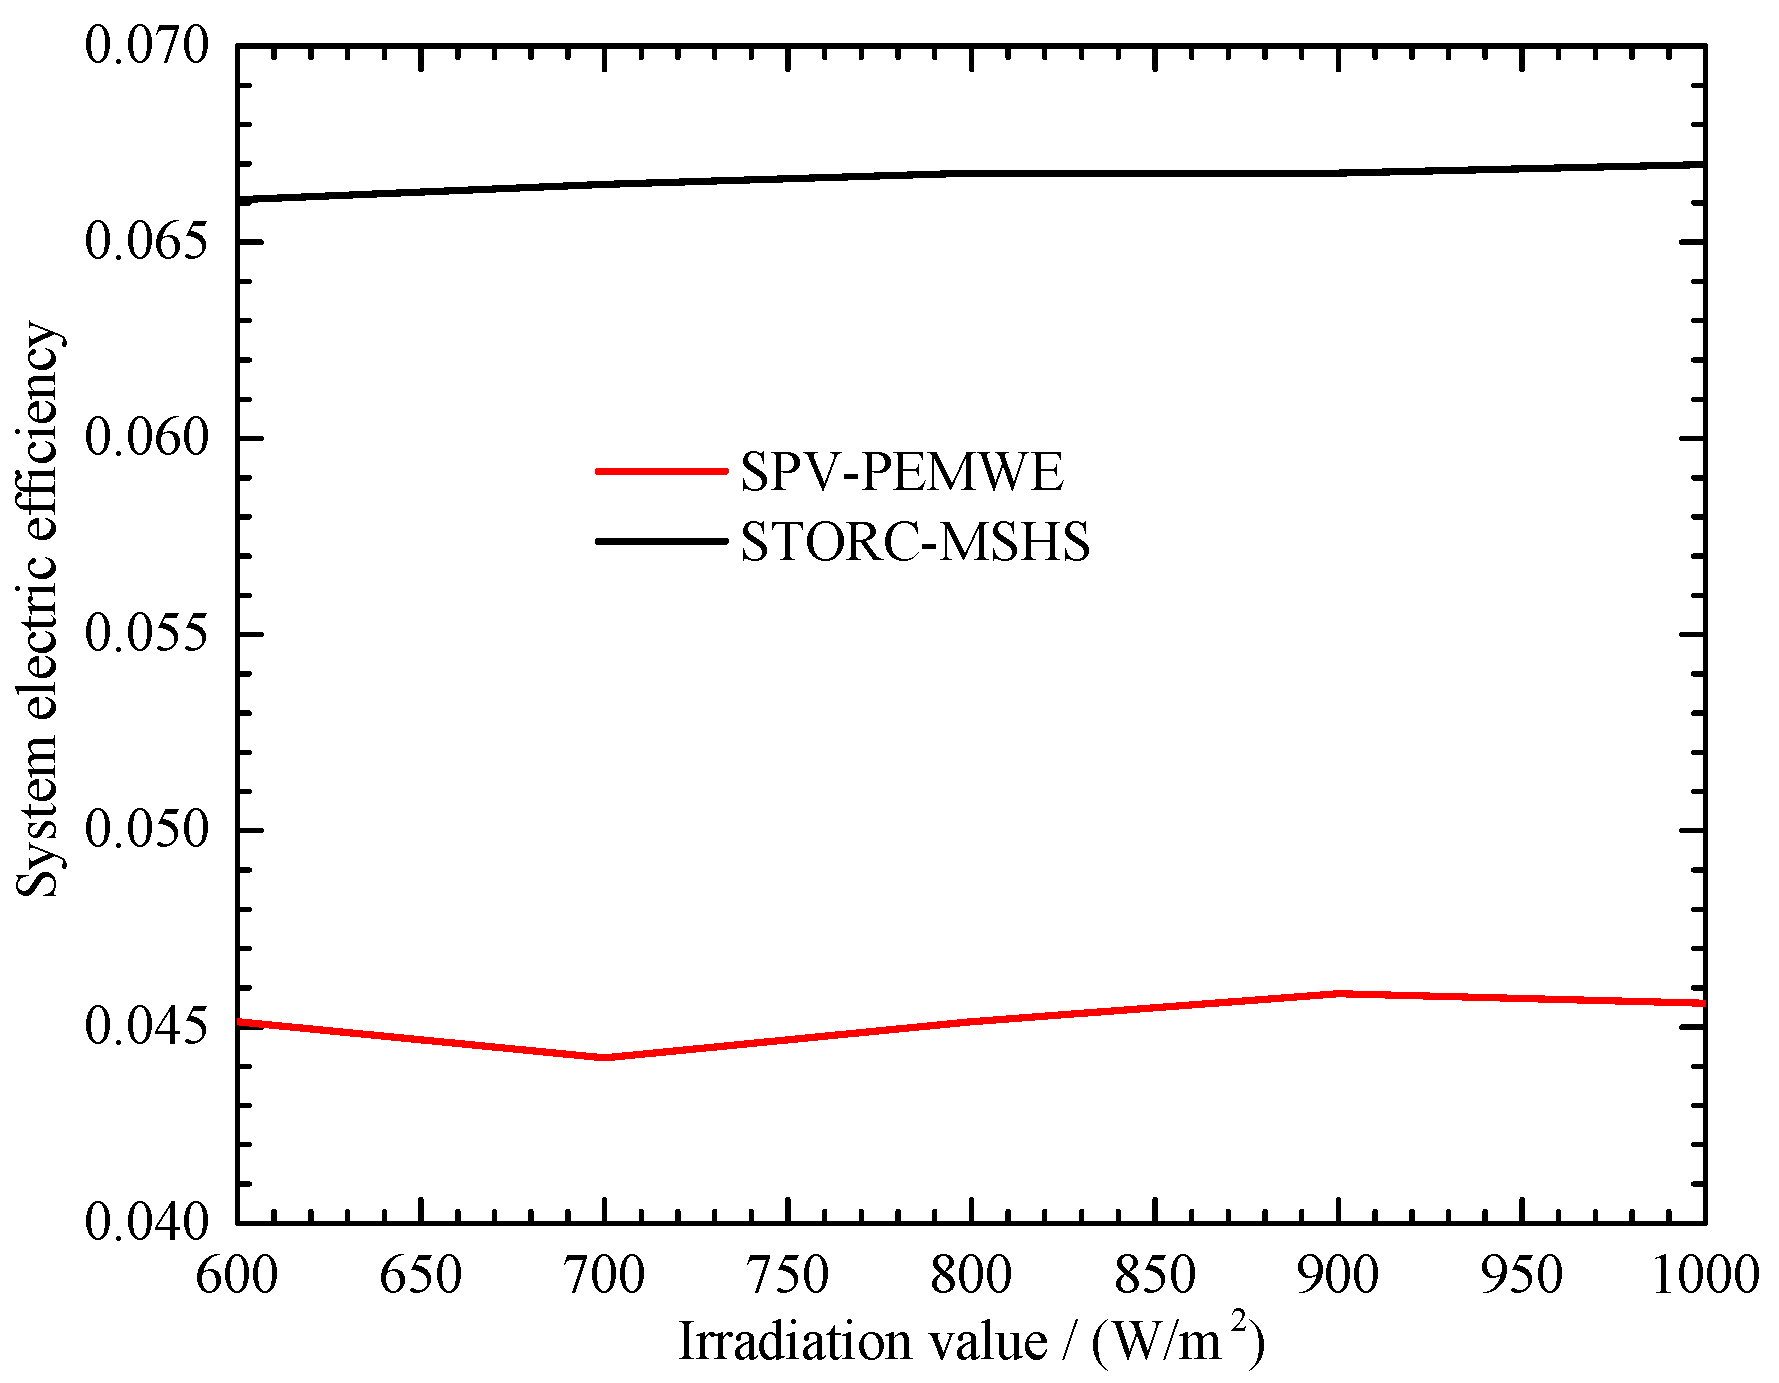
In Section 4.1 and Section 4.2, the results indicate that the solar irradiation value has an obvious effect on the top cycle (PV array and PTC) efficiency, thus in this part, only the solar irradiation value on the electrical efficiency of the whole system with an energy storage system was investigated. The variation tendency of electrical efficiency while using an energy storage system with irradiation value is shown in Figure 16. For the STORC-MSHS system, when the solar irradiation value increases, the PTC efficiency increases, and ORC system efficiency is immune to the irradiation value. Thus the system electrical efficiency increases with solar irradiation value increases. For the SPV-PEMWE system, when the solar irradiation value increases, the required PV cell area increases first and then decreases, and the maximum required PV cell area occurs when the solar irradiation value is 700 W/m2. Both solar irradiation value and the required PV cell area increases lead to SPV-PEMFC system electrical efficiency decreases. When the solar irradiation value continues to mount up, the required PV cell area decrease has a more obvious influence than the solar irradiation value increase on the system electrical efficiency, so the system electrical efficiency increases with the solar irradiation value. The overall electrical efficiencies of both systems increase with solar irradiation value, and the STORC-MSHS system has a much higher efficiency than the SPV-PEMWE system; the main cause is the low conversion efficiency between electrical energy and hydrogen energy.

5. Conclusions

The mathematic models of the 5 kW STORC-MSHS system and SPV-PEMWE system were established, while electric efficiencies with energy storage and without energy storage system were calculated and compared at different solar irradiation values and environmental temperatures. The effects of two energy storage types, thermal energy storage and hydrogen storage, on the system performance were investigated. The main conclusions from this work are presented, as follows:
(1). The study on irradiation value and environmental temperature impacts on the PV array performance states clearly that, with the increase of irradiation value, the PV array performance as well as maximum power output per cell increases, while the required PV array area declines. As the environmental temperature increases, the required PV array area is almost unchangeable.
(2). The augmentations of environmental temperature and irradiation value are beneficial for the PTC performance. When the irradiation value boosts up, the heat absorption of molten salt in the collector tube increases, as well as the outlet temperature increases. When environmental temperature increases, the heat loss of the collector tube decreases, and, thereby, the outlet temperature increases.
(3). For the given condition, the relationship between the molten salt temperature of heat storage tank and heat loss of the tank at different environmental temperatures is obtained. The result shows that theheat loss of the tank increases linearly with the increase of molten salt temperature. The higher the environmental temperature, the less the tank heat loss.
(4). Even though the solar PV power generation system has a higher power generation efficiency in comparison with the STORC-MSHS system, the solar PV power generation system is unable for realizing the continuous operation. If the hydrogen energy storage is introduced into the solar PV power generation system, then the problem can be solved. The SPV-PEMWE system has a much lower power generation efficiency than the STORC-MSHS system due to the low conversion efficiency between hydrogen energy and electric energy.

Author Contributions

Conceptualization and methodology, H.G.; formal analysis, data curation and writing, J.L. and Q.M.; supervision and project administration, C.M.; founding acquisition, H.G., Y.W. and F.Y. All authors have read and agreed to the published version of the manuscript.

Funding

This work was supported by the National Key R&D Program of China under Grant number 2016YFE0124900.

Acknowledgments

Thanks Yitong Li for the typewriting and grammer check of the original draft.

Conflicts of Interest

The authors declare that they have no known competing financial interests or personal relationships that could have appeared to influence the work reported in this paper.

References

  1. Chacartegui, R.; Vigna, L.; Becerra, J.A.; Verda, V. Analysis of two heat storage integrations for an Organic Rankine Cycle parabolic trough solar power plant. Energy Convers. Manag. 2016, 125, 353–367. [Google Scholar] [CrossRef]
  2. Bufi, E.A.; Camporeale, S.M.; Fornarelli, F.; Fortunato, B.; Pantaleo, A.M.; Sorrentino, A.; Torresi, M. Parametric multi-objective optimization of an Organic Rankine Cycle with thermal energy storage for distributed generation. Energy Procedia 2017, 126, 429–436. [Google Scholar] [CrossRef]
  3. Barbir, F. PEM electrolysis for production of hydrogen from renewable energy sources. Solar Energy 2005, 78, 661–669. [Google Scholar] [CrossRef]
  4. Nyholm, E.; Goop, J.; Odenberger, M.; Johnsson, F. Solar photovoltaic-battery systems in Swedish households—Self-consumption and self-sufficiency. Appl. Energy 2016, 183, 148–159. [Google Scholar] [CrossRef] [Green Version]
  5. Ashouri, M.; Astaraei, F.R.; Ghasempour, R.; Ahmadi, M.H.; Feidt, M. Thermodynamic and economic evaluation of a small-scale organic Rankine cycle integrated with a concentrating solar collector. Int. J. Low-Carbon Technol. 2015, 12, 54–65. [Google Scholar] [CrossRef] [Green Version]
  6. Ferrara, F.; Gimelli, A.; Luongo, A. Small-scale concentrated solar power (CSP) plant: ORCs comparison for different Organic fluids. Energy Procedia 2014, 45, 217–226. [Google Scholar] [CrossRef] [Green Version]
  7. Rayegan, R.; Tao, Y.X. A procedure to select working fluids for Solar Organic Rankine Cycles (ORCs). Renew. Energy 2011, 36, 659–670. [Google Scholar] [CrossRef]
  8. Wang, J.; Yan, Z.; Zhao, P.; Dai, Y. Off-design performance analysis of a solar-powered Organic Rankine Cycle. Energy Convers. Manag. 2014, 80, 150–157. [Google Scholar] [CrossRef]
  9. Mcmahan, A.C. Design and Optimization of Organic Rankine Cycle Solar-Thermal Power Plants. Master’s Thesis, University of Wisconsin, Madison, WI, USA, 2006. Available online: https://minds.wisconsin.edu/handle/1793/7889 (accessed on 8 December 2020).
  10. Quoilin, S.; Orosz, M.; Hemond, H.F.; Lemort, V. Performance and design optimization of a low-cost solar Organic Rankine Cycle for remote power generation. Solar Energy 2011, 85, 955–966. [Google Scholar] [CrossRef] [Green Version]
  11. Sonsaree, S.; Asaoka, T.; Jiajitsawat, S.; Aguirre, H.; Tanaka, K. A small-scale solar Organic Rankine Cycle power plant in Thailand: Three types of non-concentrating solar collectors. Solar Energy 2018, 162, 541–560. [Google Scholar] [CrossRef]
  12. Caldino-Herrera, U.; Castro, L.; Jaramillo, O.A.; Garcia, J.C.; Urquiza, G.; Flores, F. Small Organic Rankine Cycle coupled to parabolic trough solar concentrator. Energy Procedia 2017, 129, 700–707. [Google Scholar] [CrossRef]
  13. Borunda, M.; Jaramillo, O.A.; Dorantes, R.; Reyes, A. Organic Rankine Cycle coupling with a parabolic trough solar power plant for cogeneration and industrial processes. Renew. Energy 2016, 86, 651–663. [Google Scholar] [CrossRef]
  14. Wan, Z.; Wei, J.; Qaisrani, M.A.; Fang, J.; Tu, N. Evaluation on thermal and mechanical performance of the hot tank in the two-tank molten salt heat storage system. Appl. Therm. Eng. 2020, 167, 114775. [Google Scholar] [CrossRef]
  15. Rahman, S.; Tam, K. A feasibility study of photovoltaic-fuel cell hybrid energy system. IEEE Trans. Energy Convers. 1988, 3, 50–55. [Google Scholar] [CrossRef]
  16. Lehman, P.A.; Chamberlin, C.E. Design of a photovoltaic-hydrogen-fuel cell energy system. Int. J. Hydrog. Energy 1991, 16, 349–352. [Google Scholar] [CrossRef]
  17. Torres, L.A.; RODRíGUEZ, F.; Sebastian, P.J. Simulation of a solar-hydrogen-fuel cell system: Results for different locations in Mexico. Int. J. Hydrog. Energy 1998, 23, 1005–1009. [Google Scholar] [CrossRef]
  18. El-Shatter, T.F.; Eskandar, M.N.; El-Hagry, M.T. Hybrid PV/fuel cell system design and simulation. Renew. Energy 2002, 27, 479–485. [Google Scholar] [CrossRef]
  19. Arsalis, A.; Alexandrou, A.N.; Georghiou, G.E. Thermoeconomic modeling of a completely autonomous, zero-emission photovoltaic system with hydrogen storage for residential applications. Renew. Energy 2018, 126, 354–369. [Google Scholar] [CrossRef]
  20. Jia, J.; Seitz, L.C.; Benck, J.D.; Huo, Y.; Chen, Y.; Ng, J.W.D.; Bilir, T.; Harris, J.S.; Jaramillo, T.F. Solar water splitting by photovoltaic-electrolysis with a solar-to-hydrogen efficiency over 30%. Nat. Commun. 2016, 7, 13237. [Google Scholar] [CrossRef]
  21. Li, J.; Hang, G.; Qingpeng, M.; Yuting, W.; Fang, Y.; Chongfang, M. Thermoeconomic analysis on a molten salt parabolic trough-based concentrated solar Organic Rankine Cycle system. Int. J. Energy Res. 2020, 44, 3395–3411. [Google Scholar] [CrossRef]
  22. Forristall, R. Heat Transfer Analysis and Modeling of a Parabolic Trough Solar Receiver Implemented in Engineering Equation Solver. Technical Report. 2003. Available online: https://pdfs.semanticscholar.org/950c/d9393159ced22726a89ea9e905ffe5f089d3.pdf?_ga=2.149750006.1708398994.1607399928-807880032.1607399928 (accessed on 8 December 2020).
  23. Su, J.; Yu, S.; Zhao, W.; Wu, M.; Shen, Y.; He, H. Investigation on engineering analytical model of silicon solar cells. Acta Energiae Solaris Sinca 2001, 022, 409–412. [Google Scholar]
  24. Zhang, H.; Lin, G.; Chen, J. Evaluation and calculation on the efficiency of a water electrolysis system for hydrogen production. Int. J. Hydrog. Energy 2010, 35, 10851–10858. [Google Scholar] [CrossRef]
  25. Spiegel, C. PEM fuel cell modeling and simulation using Matlab. J. Am. Chem. Soc. 2008, 110, 567–571. [Google Scholar]
  26. Millet, P.; Ngameni, R.; Grigoriev, S.A.; Fateev, V.N. Scientific and engineering issues related to PEM technology: Water electrolysers, fuel cells and unitized regenerative systems. Int. J. Hydrog. Energy 2011, 36, 4156–41633. [Google Scholar] [CrossRef]
  27. Siegel, N.P.; Ellis, M.W.; Nelson, D.J.; Spakovsky, M.R.V. A two-dimensional computational model of a PEMFC with liquid water transport. J. Power Sources 2004, 128, 173–184. [Google Scholar] [CrossRef]
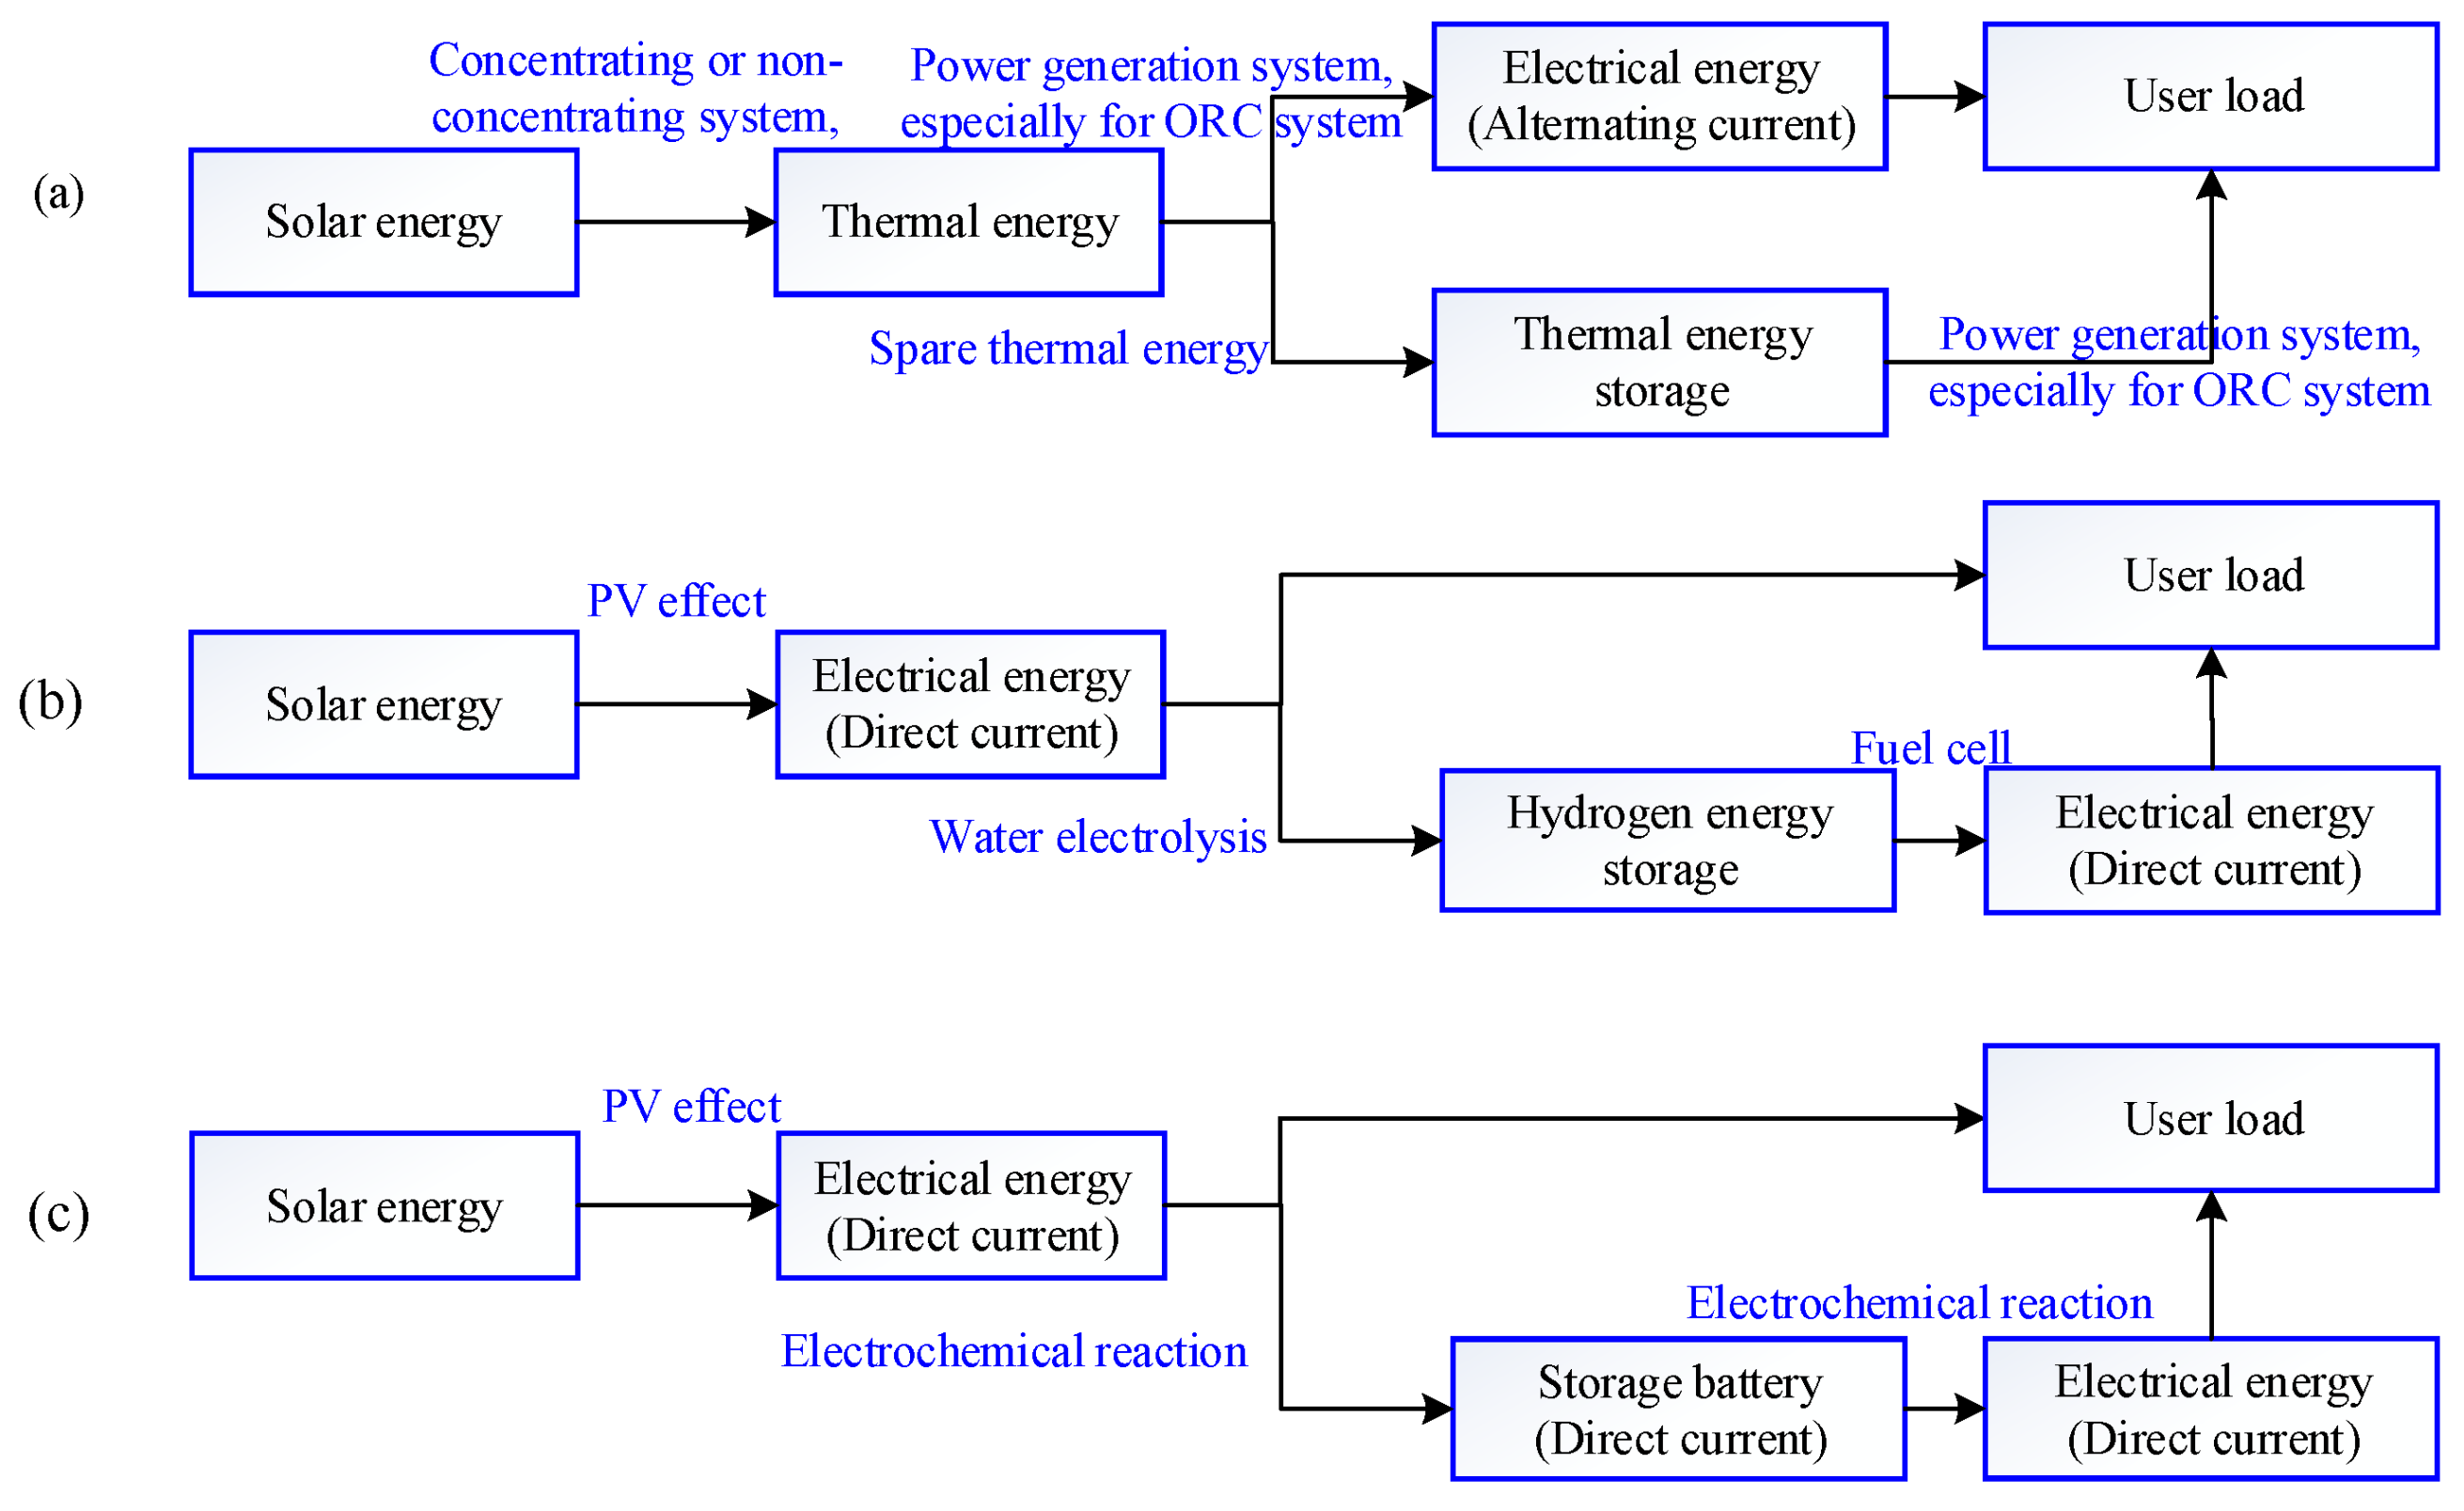
Figure 1. Technical routine of solar electrical energy generation system with three different energy storage technology. (a) shows thermal energy storage; (b) shows hydrogen energy storage; (c) shows storage battery.
Sustainability 12 10268 g001
Figure 2. Diagram of two kinds of solar electrical power generation systems.
Sustainability 12 10268 g002
Figure 3. T-s diagram of R123.
Sustainability 12 10268 g003
Figure 4. Verification result for PV cell.
Sustainability 12 10268 g004
Figure 5. Verification result for PEMWE system.
Sustainability 12 10268 g005
Figure 6. Verification result for PEMFC system.
Sustainability 12 10268 g006
Figure 7. Irradiation effect on V-I performance of PV cell when environmental temperature is 25 °C.
Sustainability 12 10268 g007
Figure 8. Environmental temperature effect on V-I performance of PV cell when irradiation value is 800 W/m2.
Sustainability 12 10268 g008
Figure 9. Solar irradiation effect on maximum power output per cell and required PV cell area when environmental temperature is 25 °C.
Sustainability 12 10268 g009
Figure 10. Environmental temperature effect on maximum power output per cell and required PV cell area when irradiation value is 800 W/m2.
Sustainability 12 10268 g010
Figure 11. Irradiation value effect on outlet temperature and PTC efficiency.
Sustainability 12 10268 g011
Figure 12. Environmental temperature effect on the outlet temperature and PTC efficiency.
Sustainability 12 10268 g012
Figure 13. Heat loss of molten salt tank changes with molten salt temperature as environmental temperature is 25 °C.
Sustainability 12 10268 g013
Figure 14. Effect of environmental temperature on heat loss of molten salt tank when solar irradiation is 800 W/m2.
Sustainability 12 10268 g014
Figure 15. Effect of environmental temperature on electrical efficiency with energy storage.
Sustainability 12 10268 g015
Figure 16. System electric efficiency comparison of two systems at different irradiation values.
Sustainability 12 10268 g016
Table 1. Nomenclature.
VariableDescriptionUnit
Q e Required electricity energy per dayJ/day
c p Specific heat of molten salt at constant pressureJ·kg−1K−1
mTotal masskg
TTemperatureK
sEntropyJ·kg−1K−1
hEnthalpyJ·kg−1
η Isentropic efficiency-
xParameter-
ICurrentA
VVoltageV
GIrradiation valueW/m2
Δ T Temperature differencel°C
Δ G Solar irradiation value differenceW/m 2
AAream 2
EPotentialV
σ Electrical conductivityS/m
λ Thermal conductivityJ·m 1 K 1
α Activity-
RUniversal gas constant-
PPartial pressurePa
jCurrent densityA/cm 2
δ Thicknessm
qGas generation ratemol/s
FFaraday constant-
rInternal resistance Ω
G i b Gibbs free energyJ·mol 1
Table 2. Subscripts.
SymbolDescriptionSymbolDescription
HHot tankCCold tank
refReferencemMolten salt
ocOpen circuitscShortcut circuit
airAmbient airPVPV array
cmPer square centimetercellPer cell
outOutputrevReversible
memMembraneweWater electrolysis
sSaturationactActivity
anAnode sidecaCathode side
conConcentrationohmicOhmic
FCFuel cellliqLiquid state
Table 3. Main parameters of the STORC-MSHS system.
PTCORC
Aperture length (m)5.77Evaporation pressure (MPa)1.2
Focal distance (m)1.71Superheating degree (K)5
Absorber inner diameter (mm)64Condensation temperature (K)316.15
Absorber outer diameter (mm)70Sub-cooling degree (K)3
Glass envelop inner diameter (mm)120Expander isentropic efficiency (%)70
Glass envelop outer diameter (mm)125Isentropic efficiency of the pump (%)90
Pressure in annular space (Pa)<133.2Mechanical efficiency (%)90
--Generator efficiency (%)95
Table 4. Main parameters of the SPV-PEMWE system.
PV CellPEMWEPEMFC
Standard shortcut current density (A)10Cell temperature (K)353.15Cell temperature (K)333.15
Standard open circuit voltage (V)18Anode exchange current density (A/cm 2 ) 10 7 Hydrogen pressure (atm)3
Maximum power density (W)8.3Cathode exchange current density (A/cm 2 ) 10 3 Air pressure (atm)3
Maximum voltage (V)14.2Activation area (cm 2 )25Standard ambient pressure (kPa)101.325
Filling factor0.75General gas constant8.314Cell area (cm 2 )25
Current density per square centimeter (A/cm 2 )0.24Faraday constant96,485Internal resistant ( Ω )0.19
Open circuit voltage (V)0.6Anode charge transfer coefficient0.5Conversion efficiency (%)0.5
Standard temperature (K)298.15Cathode charge transfer coefficient0.5Amplification constant0.085
--Anode partial pressure (Pa)101,325Exchange current density (A/cm 2 ) 10 6.912
--Cathode partial pressure (Pa)101,325Limiting current density (A/cm 2 )1.4
--Membrane activity1Gibbs free energy (kJ/mol)228.17
--Membrane thickness (mm) 1.78 × 10 4 Mass transport constant1.1
--Electrolyzer utilization efficiency0.85Hydrogen utilization coefficient0.85
Table 5. Configuration parameters of molten salt tank and insulation layer parameters.
Tank height (m)1.9Thickness of insulation layer (m)0. 35
Inner diameter (m)2.8Thermal conductivity (W·m 1 ·k 1 )0.2116
Outer diameter (m)2.816Emissivity of insulation layer0.95
Publisher’s Note: MDPI stays neutral with regard to jurisdictional claims in published maps and institutional affiliations.