A Multitier Approach to Estimating the Energy Efficiency of Urban Passenger Mobility

 , ,
, , 
Abstract
1. Introduction
2. Literature Review
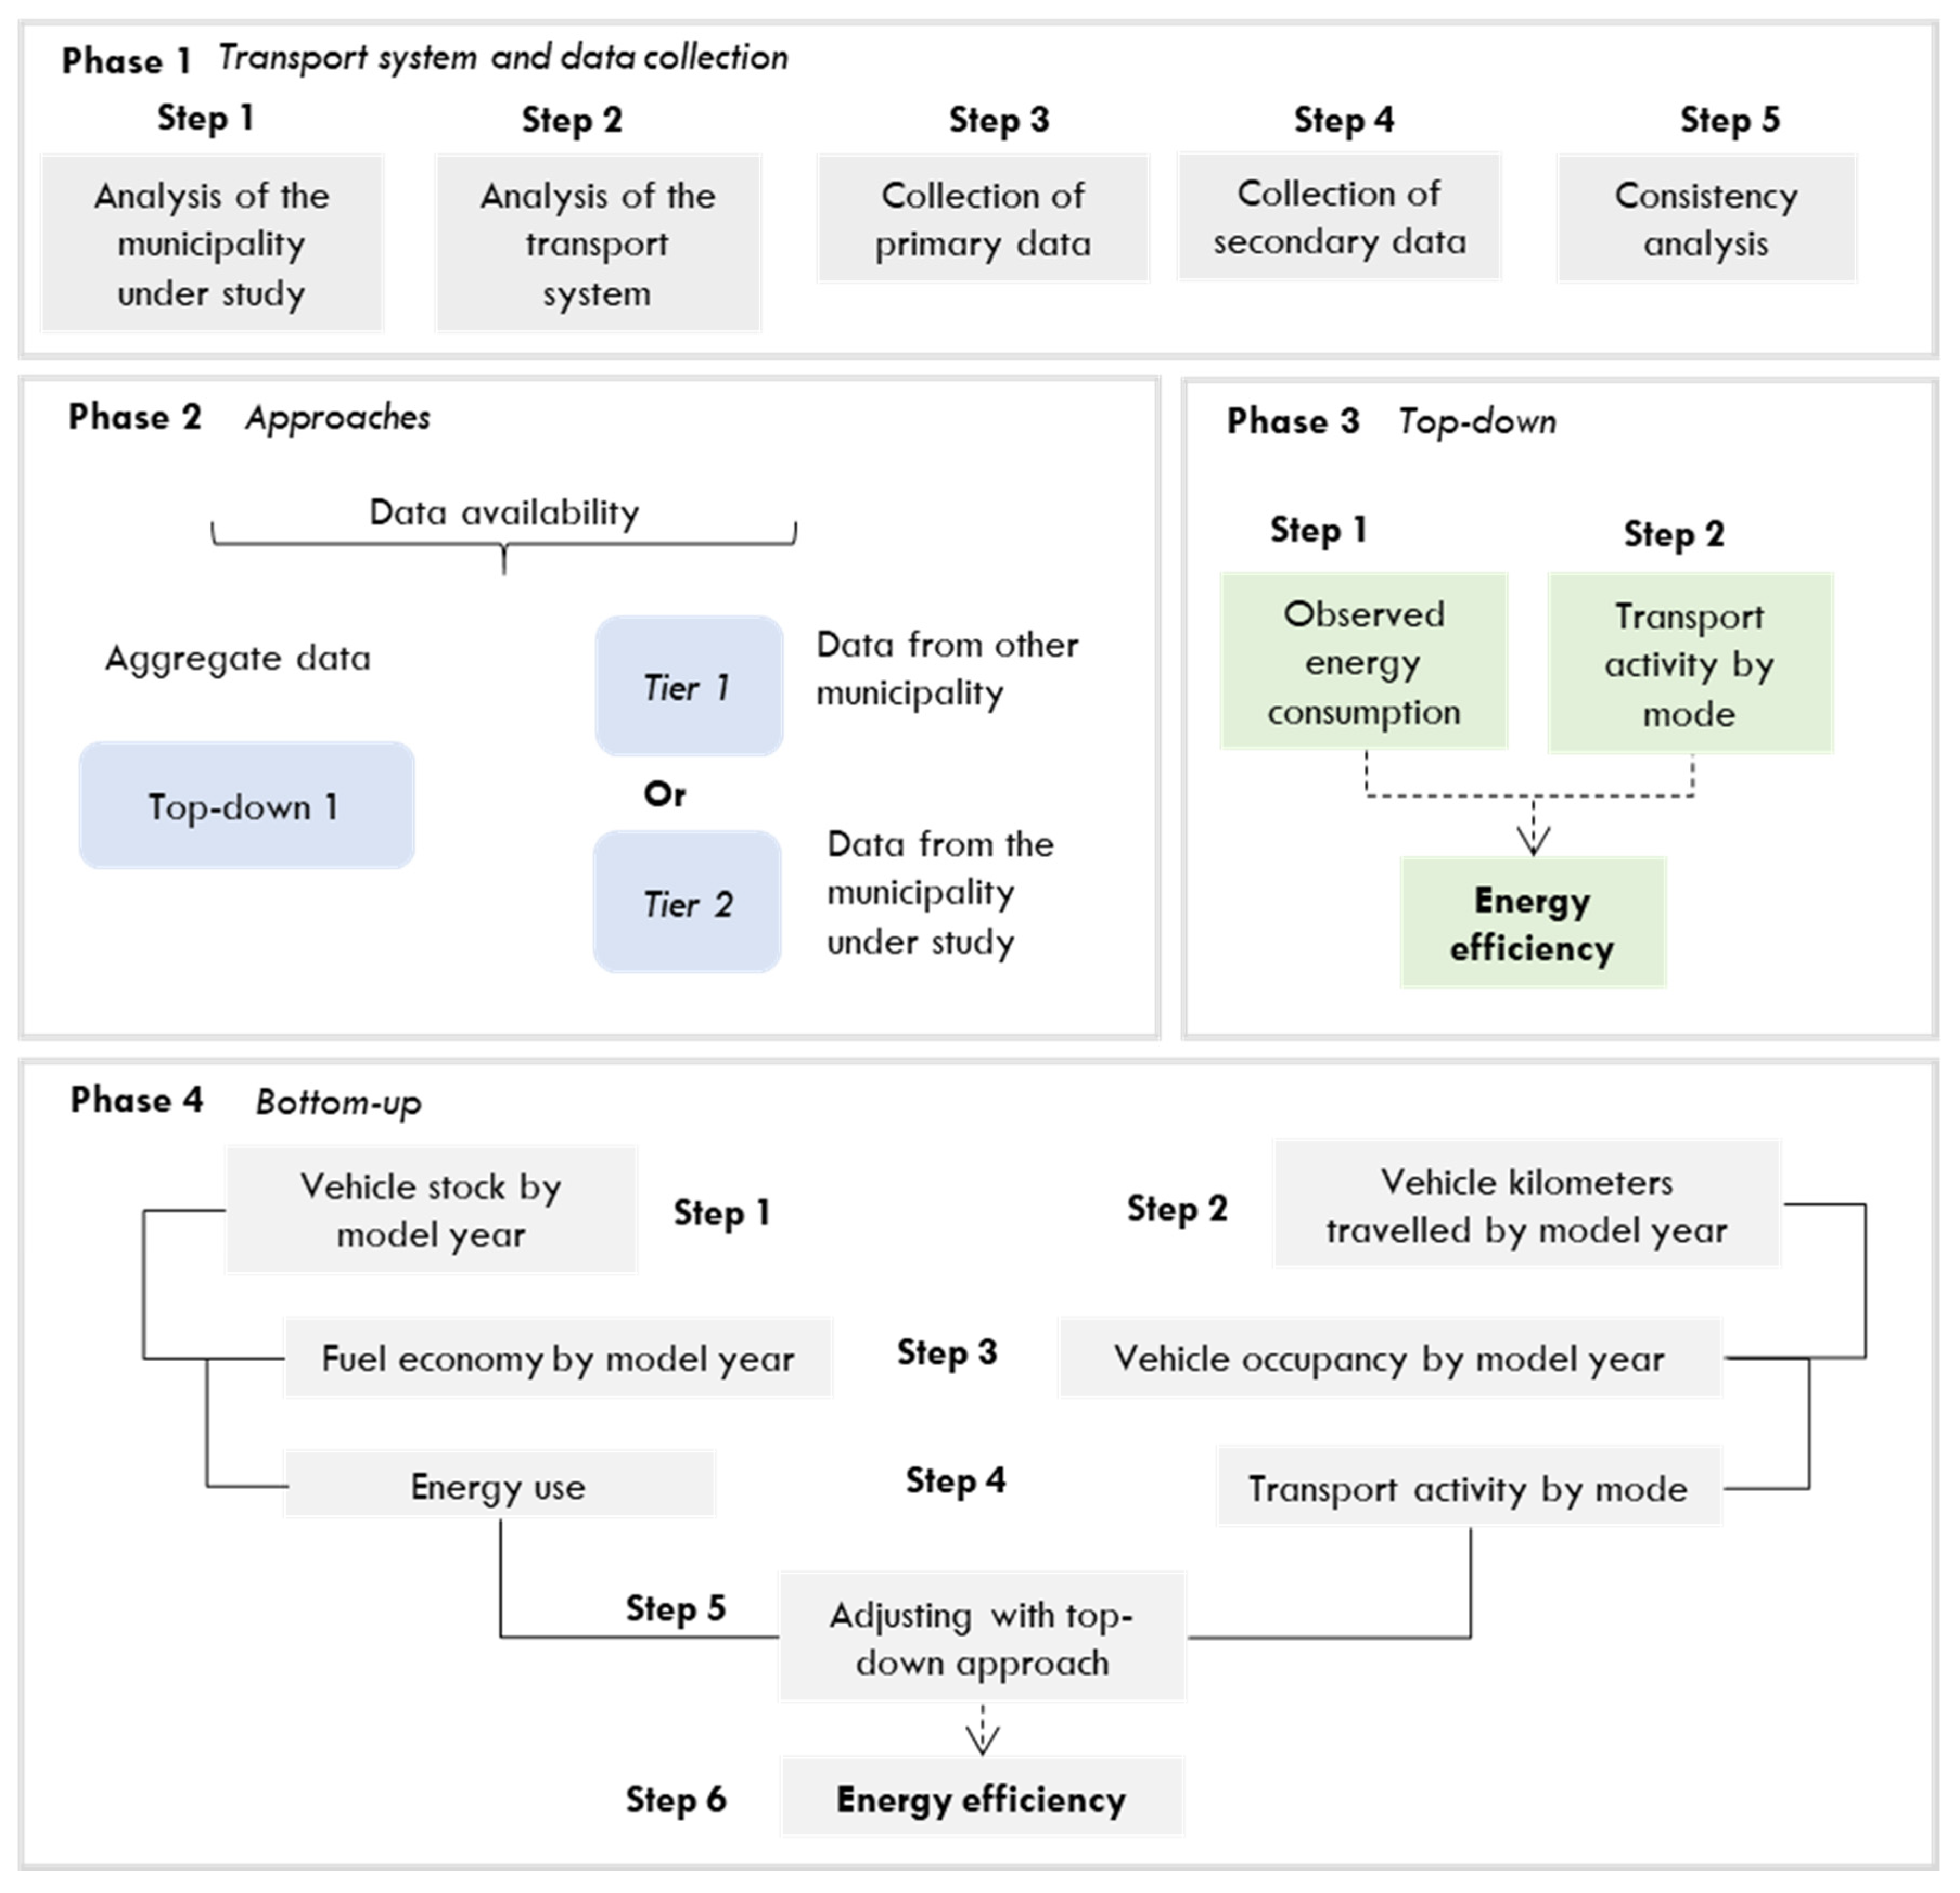
3. Energy Efficiency Model
3.1. Data Requirements
3.2. Top-Down Approach
3.3. Bottom-Up Approach
4. Energy Efficiency in Urban Mobility
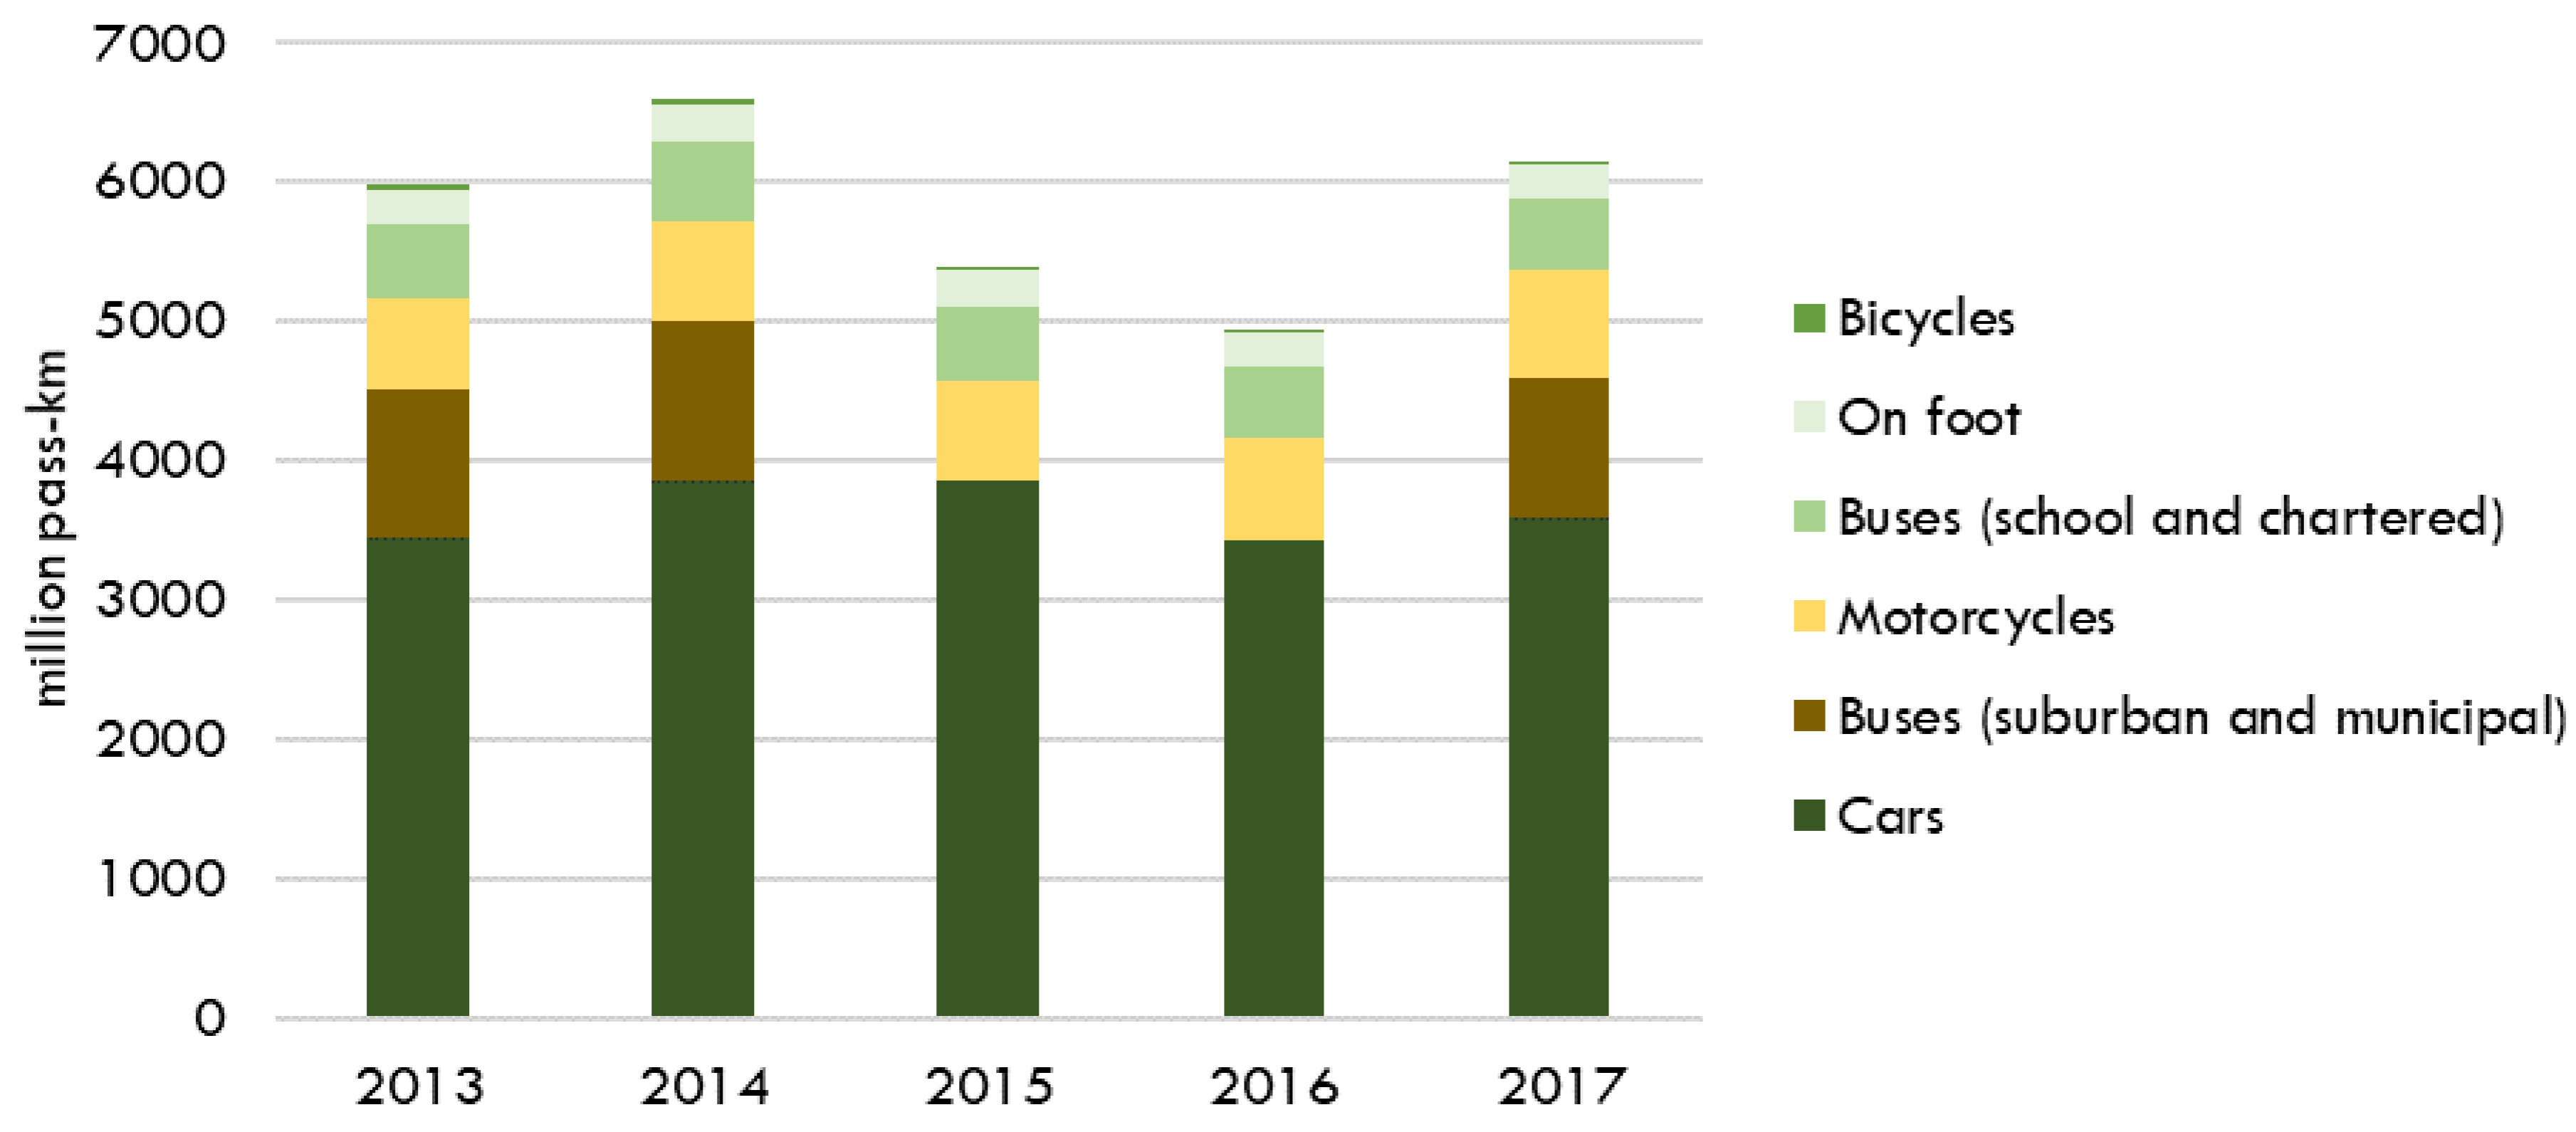
4.1. Aggregate Results
4.2. Disaggregate Results
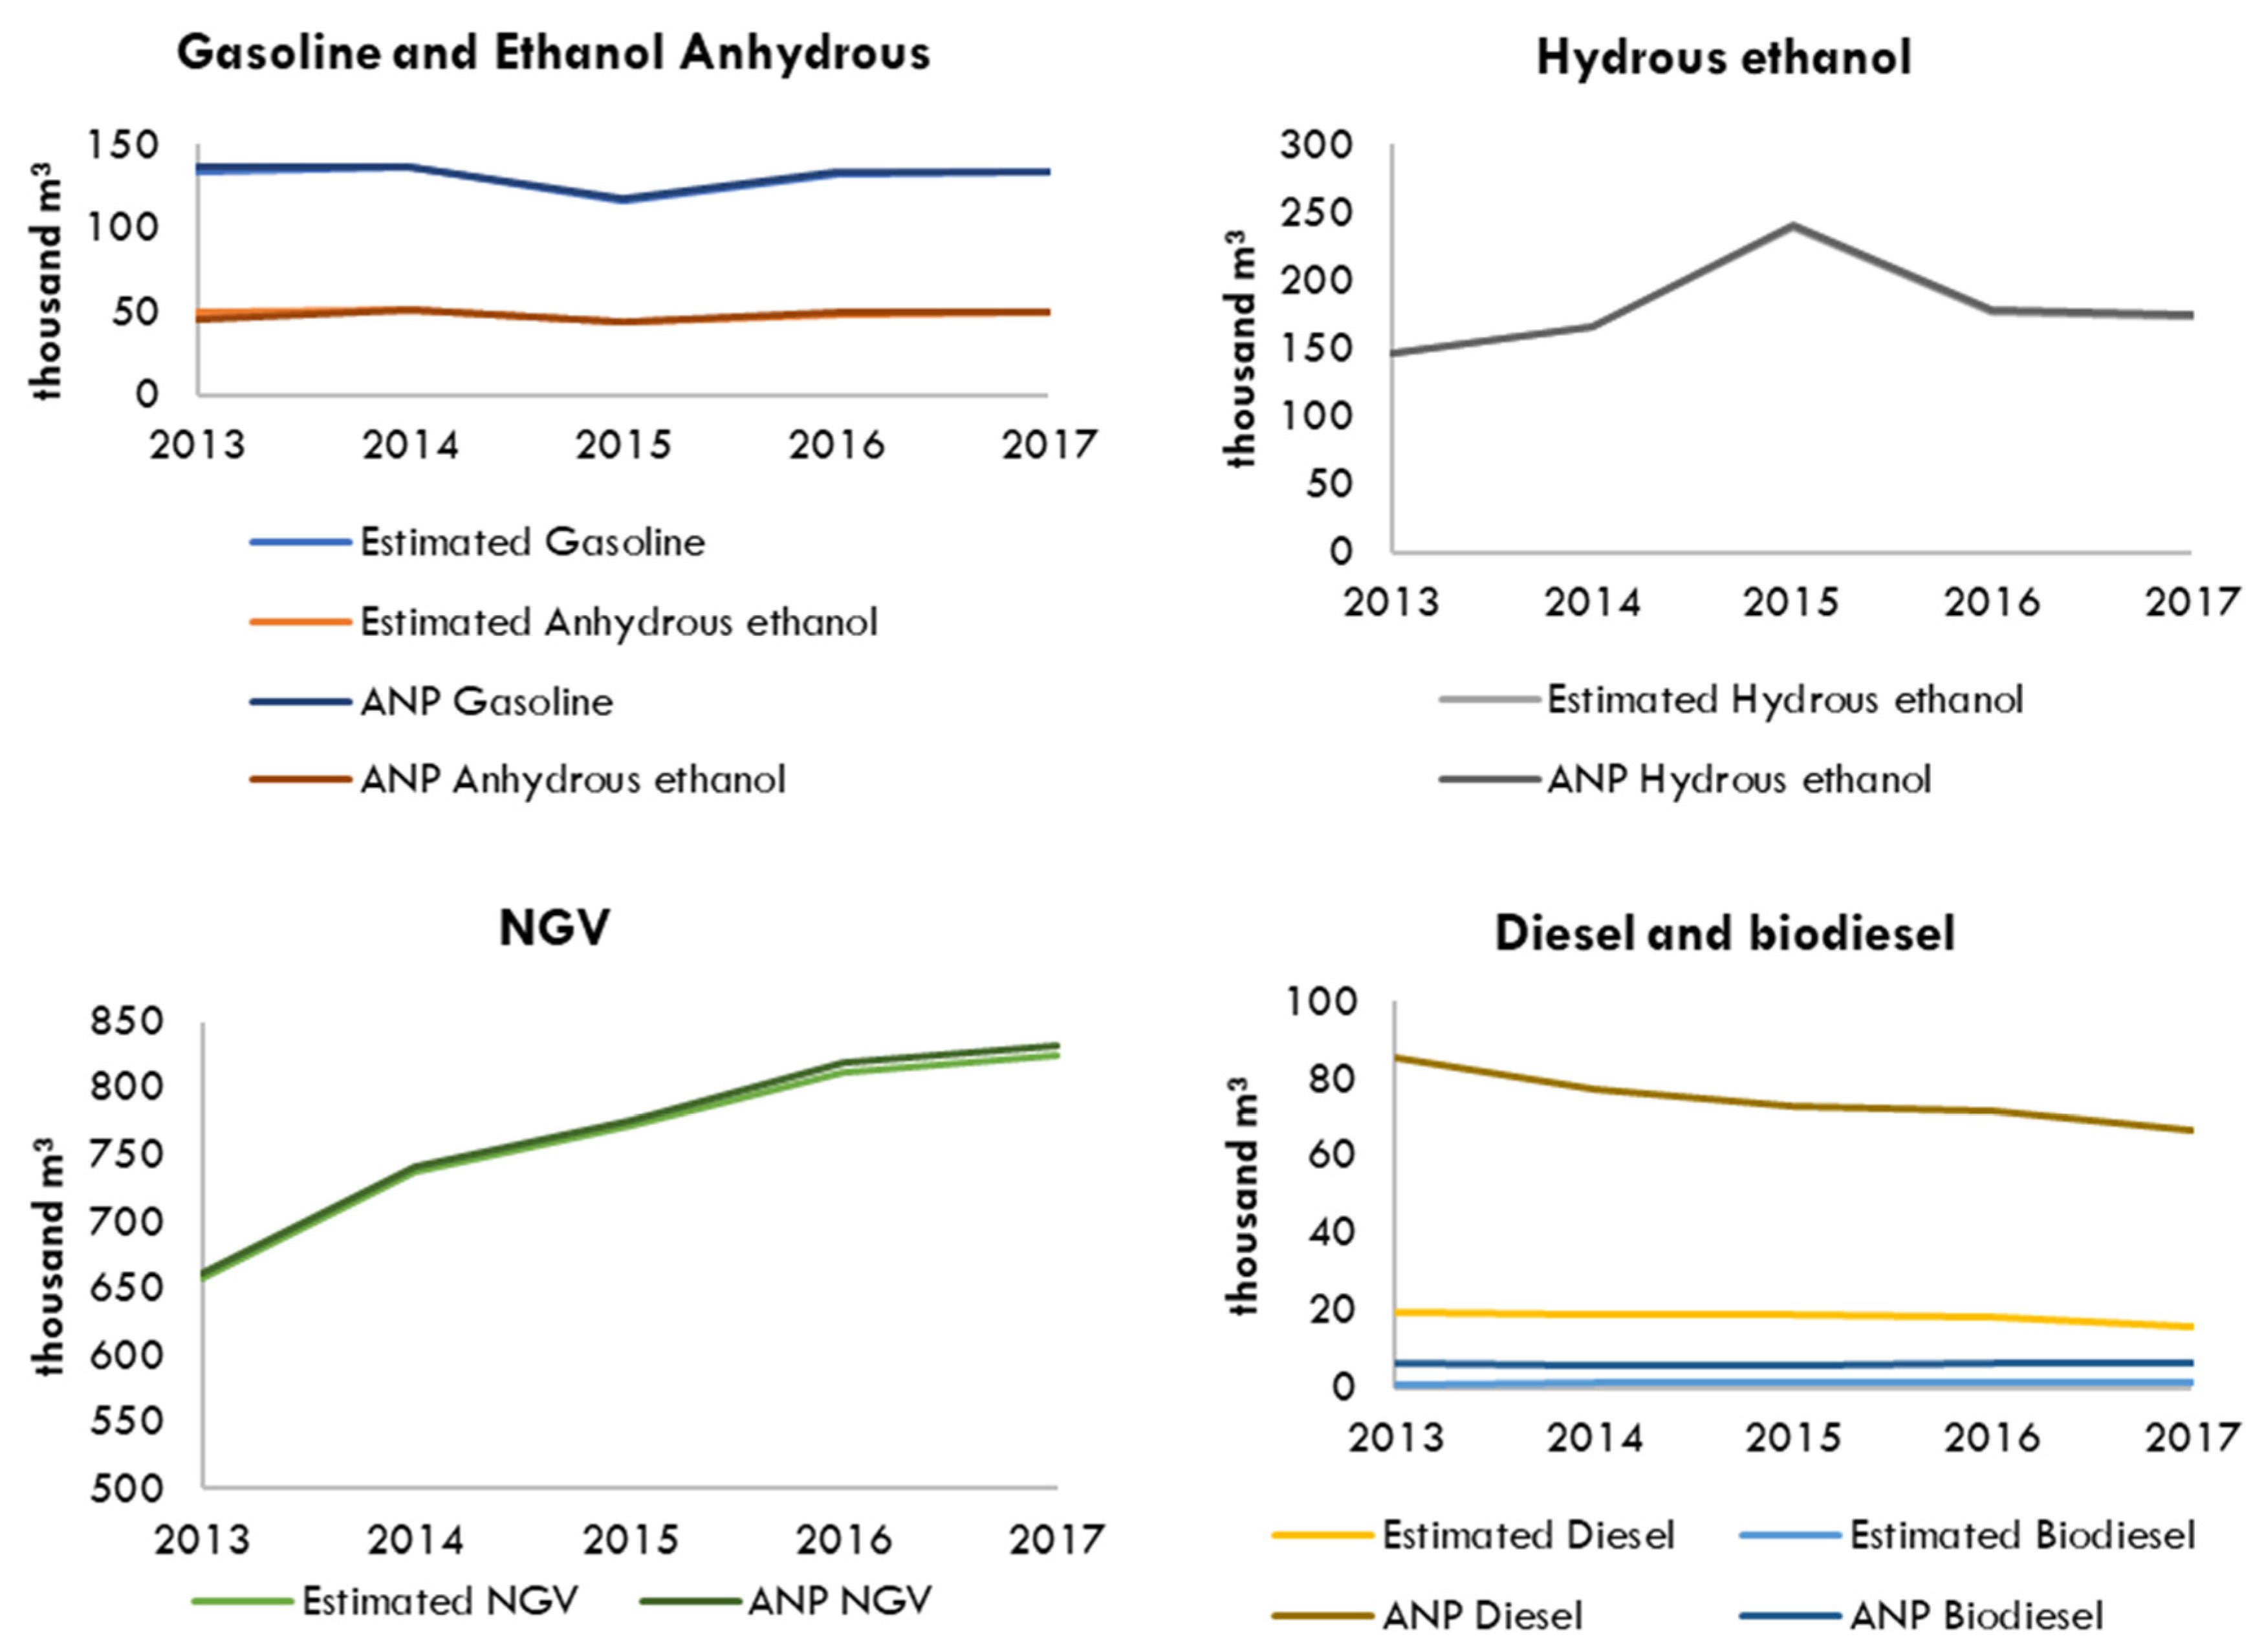
4.2.1. Energy Use by Source
4.2.2. Energy Efficiency
5. Conclusions and Policy Implications
Author Contributions
Funding
Conflicts of Interest
References
- World Bank. GINI Index (World Bank Estimate). Available online: https://data.worldbank.org/indicator/SI.POV.GINI?locations=DE-NO-IT (accessed on 19 November 2019).
- WHO. Health in the Green Economy: Health Co-Benefits of Climate Change Mitigation—Transport Sector; World Health Organization: Geneva, Switzerland, 2011. [Google Scholar]
- United Nations. 2018 Revision of World Urbanization Prospects. Available online: https://www.un.org/development/desa/publications/2018-revision-of-world-urbanization-prospects.html#:~:text=Today%2C55%25oftheworld’s,increaseto68%25by2050 (accessed on 19 July 2020).
- Allen, J.; Browne, M. Sustainability strategies for city logistics. In Green Logistics, Improving the Environmental Sustainability of Logistics; McKinnon, A., Browne, M., Whiteing, A., Piecyk, M., Eds.; Kogan Page Limited: London, UK, 2010; pp. 282–305. ISBN 9780749456788. [Google Scholar]
- United States Census Bureau. 2010 Census Urban and Rural Classification and Urban Area Criteria. Available online: https://www.census.gov/programs-surveys/geography/guidance/geo-areas/urban-rural/2010-urban-rural.html#:~:text=2010CensusUrbanandRuralClassificationandUrbanAreaCriteria,-ComponentID%3A%23ti129393947&text=TheCensusBureauidentifiestwo,andles (accessed on 17 July 2020).
- Council, W.E. World Energy Scenarios; WEC: London, UK, 2016. [Google Scholar]
- Millar, D.; Tonolo, G.; Ziebinska, U. Energy Efficiency Indicators: Highlights; IEA: Paris, France, 2016. [Google Scholar]
- IEA. Cities Are at the Frontline of the Energy Transition. Available online: https://www.iea.org/news/cities-are-at-the-frontline-of-the-energy-transition (accessed on 16 August 2020).
- Tørnblad, S.H.; Kallbekken, S.; Korneliussen, K.; Mideksa, T.K. Using mobility management to reduce private car use: Results from a natural field experiment in Norway. Transp. Policy 2014, 32, 9–15. [Google Scholar] [CrossRef]
- EEA. Energy Efficiency and Energy Consumption in the Household Sector 2011; EEA: Copenhagen, Denmark, 2012. [Google Scholar]
- Mundoli, S.; Unnikrishnan, H.; Nagendra, H. The “Sustainable” in smart cities: Ignoring the importance of urban ecosystems. Decision 2017, 44, 103–120. [Google Scholar] [CrossRef]
- Mongeon, P.; Paul-Hus, A. The journal coverage of Web of Science and Scopus: A comparative analysis. Scientometrics 2016, 106, 213–228. [Google Scholar] [CrossRef]
- Szász, P.Á. Eficiência energética do transporte na cidade. Revista dos Transportes Públicos, n. 15. 1982. Available online: http://files-server.antp.org.br/_5dotSystem/download/dcmDocument/2014/08/05/2E97F29A-64FE-4F37-8667-92BE464775E5.pdf (accessed on 31 October 2020).
- Saujot, M.; Lefèvre, B. The next generation of urban MACCs. Reassessing the cost-effectiveness of urban mitigation options by integrating a systemic approach and social costs. Energy Policy 2016, 92, 124–138. [Google Scholar] [CrossRef]
- He, D.; Meng, F.; Wang, M.; He, K. Impacts of Urban Transportation Mode Split on CO2 Emissions in Jinan, China. Energies 2011, 4, 685–699. [Google Scholar] [CrossRef]
- Menezes, E.; Gori-Maia, A.; De Carvalho, C.S. Effectiveness of low-carbon development strategies: Evaluation of policy scenarios for the urban transport sector in a Brazilian megacity. Technol. Forecast. Soc. Chang. 2017, 114, 226–241. [Google Scholar] [CrossRef]
- Pissourios, I.A. Top-Down and Bottom-Up Urban and Regional Planning: Towards a Framework for The Use of Planning Standards. Eur. Spat. Res. Policy 2014, 21, 83–99. [Google Scholar] [CrossRef]
- IPCC. Climate Change 2001: The Scientific Basis; IPCC: Cambridge, UK; New York, NY, USA,, 2001. [Google Scholar]
- Jacobsen, H.K. Integrating the bottom-up and top-down approach to energy–economy modelling: The case of Denmark. Energy Econ. 1998, 20, 443–461. [Google Scholar] [CrossRef]
- Espinosa, S.I.A. Air Pollution Modeling in São Paulo Using Bottom-Up Vehicular Emissions Inventories; Universidade de São Paulo: São Paulo, Brazil, 2017. [Google Scholar]
- Bose, R.K.; Srinivasachary, V. Policies to reduce energy use and environmental emissions in the transport sector. Energy Policy 1997, 25, 1137–1150. [Google Scholar] [CrossRef]
- Tartakovsky, L.; Gutman, M.; Popescu, D.; Shapiro, M. Energy and Environmental Impacts of Urban Buses and Passenger Cars–Comparative Analysis of Sensitivity to Driving Conditions. Environ. Pollut. 2013, 2, 81. [Google Scholar] [CrossRef]
- Gerboni, R.; Grosso, D.; Carpignano, A.; Chiara, B.D. Linking energy and transport models to support policy making. Energy Policy 2017, 111, 336–345. [Google Scholar] [CrossRef]
- Hillman, T.; Ramaswami, A. Greenhouse Gas Emission Footprints and Energy Use Benchmarks for Eight U.S. Cities. Environ. Sci. Technol. 2010, 44, 1902–1910. [Google Scholar] [CrossRef]
- Jiang, Y.; Zegras, P.C.; He, D.; Mao, Q. Does energy follow form? The case of household travel in Jinan, China. Mitig. Adapt. Strat. Glob. Chang. 2014, 20, 701–718. [Google Scholar] [CrossRef]
- Giordano, P.; Caputo, P.; Vancheri, A. Fuzzy evaluation of heterogeneous quantities: Measuring urban ecological efficiency. Ecol. Model. 2014, 288, 112–126. [Google Scholar] [CrossRef]
- Aggarwal, P.; Jain, S. Energy demand and CO2 emissions from urban on-road transport in Delhi: Current and future projections under various policy measures. J. Clean. Prod. 2016, 128, 48–61. [Google Scholar] [CrossRef]
- Guimarães, V.D.A.; Junior, I.C.L. Performance assessment and evaluation method for passenger transportation: A step toward sustainability. J. Clean. Prod. 2017, 142, 297–307. [Google Scholar] [CrossRef]
- Yang, Y.; Wang, C.; Liu, W.; Zhou, P. Microsimulation of low carbon urban transport policies in Beijing. Energy Policy 2017, 107, 561–572. [Google Scholar] [CrossRef]
- Alonso, A.; Monzon, A.; Wang, Y. Modelling Land Use and Transport Policies to Measure Their Contribution to Urban Challenges: The Case of Madrid. Sustainability 2017, 9, 378. [Google Scholar] [CrossRef]
- Intergovernmental Panel on Climate Change. 2006 IPCC Guidelines for National Greenhouse Gas Inventories; Institute for Global Environmental Strategies: Kanagawa, Japan, 2006. [Google Scholar]
- Marcio de Almeida, D.A. Transportation, Energy Use and Environmental Impacts, 1st ed.; Elsevier: Amsterdam, The Netherlands, 2019; ISBN 978-00120813454-2. [Google Scholar]
- Brazil Indicadores de Efetividade da Política Nacional de Mobilidade Urbana. Available online: https://www.mdr.gov.br/component/content/article?id=4965 (accessed on 19 July 2020).
- URBES. Planilhas de Remuneração do Transporte Público. Available online: https://www.urbes.com.br/planilhas-remuneracao (accessed on 19 January 2018).
- URBES. Plano Diretor de Transporte Urbano e Mobilidade; URBES: Sorocaba, São Paulo, Brazil, 2014. [Google Scholar]
- URBES. Faixas Exclusivas. Available online: https://www.urbes.com.br/faixas-exclusivas-g/1 (accessed on 19 January 2018).
- Sorocaba Secretariat of the Environment Inventário de Gases de Efeito Estufa do Município de Sorocaba (2002–2012)—Relatório Final; Sorocaba, Brazil. 2014. Available online: http://sams.iclei.org/novidades/noticias/arquivo-de-noticias/2014/inventario-prefeitura-de-sorocaba.html (accessed on 30 October 2020).
- ANP RenovaBio. Available online: http://www.anp.gov.br/biocombustiveis/renovabio (accessed on 15 July 2019).
- Gonçalves, D.N.S.; Goes, G.V.; D’Agosto, M.D.A.; Bandeira, R.A.D.M. Energy use and emissions scenarios for transport to gauge progress toward national commitments. Energy Policy 2019, 135, 110997. [Google Scholar] [CrossRef]
- Goes, G.V.; Gonçalves, D.N.S.; D’Agosto, M.D.A.; La Rovere, E.L.; Bandeira, R.A.D.M. MRV framework and prospective scenarios to monitor and ratchet up Brazilian transport mitigation targets. Clim. Chang. 2020, 162, 2197–2217. [Google Scholar] [CrossRef]
- CETESB. Curvas de Intensidade de Uso Por Tipo de Veículo Automotor da Frota da Cidade de São Paulo; CETESB: São Paulo, Brazil, 2013. [Google Scholar]
- CETESB. Emissões Veiculares no Estado de São Paulo; CETESB: São Paulo, Brazil, 2017. [Google Scholar]
- DENATRAN. Frota Nacional de Veículos por Município e Tipo. Departamento Nacional de Trânsito. Available online: http://www.denatran.gov.br/estatistica/610-frota-2017 (accessed on 19 July 2020).
- Gonçalves, D.N.S.; de A. D’Agosto, M. Future Prospective Scenarios for the Use of Energy in Transportation in Brazil and Carbon Emissions Business as Usual (BAU) Scenario—2050; Instituto Brasileiro de Transporte Sustentáve: Rio de Janeiro, Brazil, 2017. [Google Scholar]
- URBES. Evolução da Taxa de Ocupação Veicular na Última Década. Available online: https://www.urbes.com.br/estatistica-apresentacao (accessed on 19 January 2018).
- EPE Plano Decenal de Expansão de Energia 2029. 2019. Available online: https://www.epe.gov.br/pt/publicacoes-dados-abertos/publicacoes/plano-decenal-de-expansao-de-energia-2029 (accessed on 30 October 2020).
- Hughes, P. A Framework for Addressing Transport and Climate Change. Planning Reduced Carbon Dioxide Emissions from Transport Sources. Transp. Plan. Syst. 1994, 2, 29–39. [Google Scholar]


| Author | Activity | Modes | Approach | Data Base | Case Study | Input | Output |
|---|---|---|---|---|---|---|---|
| Szász (1982) [13] | Passenger | Road | Bottom-up | - | Hypothetical | Energy consumption: distance traveled; consumption coefficient by kilometer and round hour; average speed and average vehicle occupancy | Energy consumption |
| Bose and Srinivasachary (1997) [21] | Passenger | Road and Rail | Top-down and Bottom-up | Database (National) | New Delhi (India) | Transport activity by mode; vehicle occupancy; total energy demand by mode of transport and type of energy; energy efficiency by type of vehicle and emission factors | Energy consumption, atmospheric pollutant |
| Hillman and Rawaswami (2010) [24] | Passenger and freight | Road and Air | Top-down | Origin–destination (OD) matrices, Database (National) | Denver, Portland,
Seattle, Minneapolis and Austin (USA) | Regional travel volume per year | Energy consumption, CO2e |
| He et al. (2011) [15] | Passenger | Road | Bottom-up | OD matrices (Company), Database (Municipal) | Jinan (China) | Modal split; travel distance by mode; vehicle occupancy; EE by mode and emission factor | Energy consumption, CO2e |
| Tartakovsky et al. (2013) [22] | Passenger | Road | Bottom-up | Survey (Company) | Hypothetical | Fleet; number of passengers; distance and vehicle occupancy | EE, atmospheric pollutant |
| Giordano et al. (2014) [26] | Passenger | Road | Top-down | Database (Continental) | Barcelona (Spain) and Lugano (Switzerland) | Petrol consumption; distance; % of the mileage traveled on urban roads | Energy consumption, CO2, and atmospheric pollutant |
| Aggarwal and Jain (2014) [27] | Passenger | Road | Bottom-up | Survey, Database (State) | New Delhi (India) | Travel demand; modal split; distance traveled per vehicle; per mode and per fuel CO2 emission factors | Energy consumption, CO2e |
| Jiang et al. (2014) [25] | Passenger | Road | Top-down | Database (National) | Barcelona (Spain), Amsterdam (Netherlands), London (UK) | Energy consumption; travel frequency; distance per trip; vehicle occupancy; energy intensity factor; consumption coefficient and energy factor by fuel | EE |
| Guimarães and Leal Junior (2016) [28] | Passenger | Road and Water | Bottom-up | Research (Company) | Rio de Janeiro (Brazil) | Total passengers transported; distance and EE | Energy consumption, CO2, and atmospheric pollutant |
| Saujot and Lefèvre (2016) [14] | Passenger | Road and Rail | Top-down | Database (National) and Survey | Grenoble (France) | Transport activity by mode; Energy by source, mode, and emission factor | Energy consumption, CO2e |
| Yang et al. (2017) [29] | Passenger | Road and Rail | Bottom-up | Survey, Database (National and Municipal) | Beijing (China) | Daily displacement data (time; reason) and attributes of each mode (distance; speed; time) | Transport activity, energy consumption, and CO2 |
| Alonso et al. (2017) [30] | Passenger | Road | Bottom-up | (OD) matrices, Database (Municipal) | Madrid (Spain) | Travel distance; speed and travel time; automotive operating costs and vehicle occupancy. | Energy consumption, CO2, and atmospheric pollutant |
| Menezes et al. (2017) [16] | Passenger and freight | Road and Rail | Bottom-up | Database (Municipal, State and Federal) | São Paulo (Brazil) | Fleet inventory by type of vehicle and fuel; new registered vehicles; vehicle kilometers traveled; age; fuel economy; average number of passengers, tons transported per mode; fuel prices and taxes; GHG emission factors by type of fuel | Transport activity, energy consumption, CO2e |
| Gerboni et al. (2017) [23] | Passenger and freight | Road, Rail, Air, and Water | Bottom-up | Database (National forecasting or Regional) | Unspecified city (Italy) | Mobility demand and energy by source and mode | Energy consumption, CO2 |
| Input | Total | Bottom-Up | Top-Down |
|---|---|---|---|
| Number of passengers transported | 11 | 7 | 4 |
| Modal split (%) | 8 | 5 | 3 |
| Distance traveled (km) | 9 | 6 | 3 |
| Energy source | 8 | 8 | 0 |
| Category of vehicles | 7 | 7 | 0 |
| Number of trips by mode | 6 | 6 | 0 |
| Fuel economy (km/L) | 5 | 5 | 0 |
| Transport activity passenger-kilometers (pass-km) | 5 | 1 | 4 |
| Vehicle occupancy (pass/vehicle) | 5 | 5 | 0 |
| Inputs | Top-Down | Bottom-Up | |
|---|---|---|---|
| Tier 1 | Tier 2 | ||
| Energy use by source | • | • | • |
| Modal split | • | • | • |
| Average trip distance | • | • | • |
| Fuel economy 1 | • | ||
| Vehicle stock | • | • | |
| Vehicle kilometers traveled (VKT) 1 | • | ||
| Average occupancy 1 | • | ||
| Vehicle | Technology | Stock | Average Age |
|---|---|---|---|
| Cars | Ethanol | 1377 | 15 |
| NGV | 1352 | 12 | |
| Flexible-fueled 1 | 150,976 | 7 | |
| Gasoline | 42,084 | 14 | |
| Hybrid | 172 | 1.4 | |
| Light commercials | Flexible-fueled | 21,889 | 7 |
| Diesel | 623 | 7 | |
| Gasoline | 8314 | 10 | |
| Motorcycles | Flexible-fueled | 13,117 | 5 |
| Gasoline | 39,872 | 9 | |
| Micro buses | Diesel | 709 | 6 |
| Buses | Diesel | 793 | 7 |
| Vehicle | Technology | Annual VKT |
|---|---|---|
| Cars | Alcohol | 13,595 |
| Natural Gas Vehicle | 13,595 | |
| Flexible-fueled | 15,208 | |
| Gasoline | 14,309 | |
| Hybrid | 15,227 | |
| Light commercials | Flexible-fueled | 18,255 |
| Diesel | 24,142 | |
| Gasoline | 14,624 | |
| Motorcycles | Flexible-fueled | 13,293 |
| Gasoline | 12,781 | |
| Micro buses | Diesel | 61,215 |
| Buses | 124,735 | |
| Buses (school and chartered) | 76,880 | |
| Articulated buses | 42,977 |
| Type of Vehicle | Type of Energy | Fuel Economy (km/L) |
|---|---|---|
| Cars | Alcohol | 10.9 |
| Natural Gas Vehicle | 12.0 | |
| Flexible-fueled | 8.3/12.2 | |
| Gasoline | 11.3 | |
| Hybrid | 16.5 | |
| Light commercials | Flexible-fueled | 6.2/8.6 |
| Diesel | 9.5 | |
| Gasoline | 11.3 | |
| Motorcycles | Flexible-fueled | 29.3/43.2 |
| Gasoline | 37.3 | |
| Micro buses | Diesel | 4.3 |
| Buses | 2.9 | |
| Buses (school and chartered) | 2.6 | |
| Articulated buses | 1.7 |
| Type of Vehicle | Average Occupancy 1 |
|---|---|
| Car | 1.3 |
| Light commercial | 1.0 |
| Motorcycle | 1.0 |
| Micro bus | 14.5 |
| Basic city bus | 32.6 |
| Special and standard buses | 44.9 |
| Articulated bus | 41.8 |
| Mode of Transport | 2013 | 2014 | 2015 | 2016 | 2017 |
|---|---|---|---|---|---|
| On foot | 4.81 | 4.81 | 4.81 | 4.81 | 4.81 |
| Bicycles | 8.93 | 8.93 | 8.93 | 8.93 | 8.93 |
| Motorcycles | 1.41 | 1.37 | 1.28 | 1.36 | 1.45 |
| Cars | 0.43 | 0.48 | 0.42 | 0.42 | 0.44 |
| Buses | 2.32 | 2.32 | 2.63 | 2.68 | 2.89 |
| Bus (suburban and municipal) | 2.31 | 2.39 | 2.35 | 2.42 | 2.54 |
| Total | 2013 | 2014 | 2015 | 2016 | 2017 |
| EE (pass-km/MJ) | 0.67 | 0.72 | 0.65 | 0.66 | 0.70 |
| Energy intensity (kJ/pass-km) | 1499 | 1398 | 1544 | 151 | 1429 |
Publisher’s Note: MDPI stays neutral with regard to jurisdictional claims in published maps and institutional affiliations. |
© 2020 by the authors. Licensee MDPI, Basel, Switzerland. This article is an open access article distributed under the terms and conditions of the Creative Commons Attribution (CC BY) license (http://creativecommons.org/licenses/by/4.0/).
Share and Cite
Gonçalves, D.N.S.; Bandeira, R.A.d.M.; Costa, M.G.d.; Goes, G.V.; Assis, T.F.d.; D’Agosto, M.d.A.; Almeida, I.R.P.L.d.; Freitas, R.R.d. A Multitier Approach to Estimating the Energy Efficiency of Urban Passenger Mobility. Sustainability 2020, 12, 10263. https://doi.org/10.3390/su122410263
Gonçalves DNS, Bandeira RAdM, Costa MGd, Goes GV, Assis TFd, D’Agosto MdA, Almeida IRPLd, Freitas RRd. A Multitier Approach to Estimating the Energy Efficiency of Urban Passenger Mobility. Sustainability. 2020; 12(24):10263. https://doi.org/10.3390/su122410263
Chicago/Turabian StyleGonçalves, Daniel Neves Schmitz, Renata Albergaria de Mello Bandeira, Mariane Gonzalez da Costa, George Vasconcelos Goes, Tássia Faria de Assis, Márcio de Almeida D’Agosto, Isabela Rocha Pombo Lessi de Almeida, and Rodrigo Rodrigues de Freitas. 2020. "A Multitier Approach to Estimating the Energy Efficiency of Urban Passenger Mobility" Sustainability 12, no. 24: 10263. https://doi.org/10.3390/su122410263
APA StyleGonçalves, D. N. S., Bandeira, R. A. d. M., Costa, M. G. d., Goes, G. V., Assis, T. F. d., D’Agosto, M. d. A., Almeida, I. R. P. L. d., & Freitas, R. R. d. (2020). A Multitier Approach to Estimating the Energy Efficiency of Urban Passenger Mobility. Sustainability, 12(24), 10263. https://doi.org/10.3390/su122410263