Article

Subcentres as Destinations: Job Decentralization, Polycentricity, and the Sustainability of Commuting Patterns in Canadian Metropolitan Areas, 1996–2016

Centre Urbanisation Culture Société, Institut National de la Recherche Scientifique (INRS), Montréal, QC H2X 1E3, Canada
*
Author to whom correspondence should be addressed.
Sustainability 2020, 12(23), 9966; https://doi.org/10.3390/su12239966
Submission received: 1 October 2020 / Revised: 23 November 2020 / Accepted: 26 November 2020 / Published: 28 November 2020

Abstract

:
Adopting more sustainable modes of transportation and shorter daily commutes remains a fundamental challenge in the struggle for the sustainable transition of cities. While past studies on the sustainability of commuting behaviours partly focused on the place of residence and how the characteristics of commuters or residential neighbourhoods impact sustainable travel, other studies looked at the place of employment to analyze these dynamics. In this study, we investigate the extent to which the recent phase of the rise of peripheral employment has promoted more sustainable travel behaviour, based on the hypothesis that polycentricity has recently favoured a better job–housing balance and co-location. We develop a general typology of employment centres, using Census microdata at fine spatial scale over the 1996–2016 period to observe commuting modes and distances by subcentre types for six major Canadian cities. Our results show that despite recent developments in planning practices—transit-oriented development, transport infrastructure, and changing travel behaviour, the emergence of peripheral subcentres promoted less sustainable commuting patterns in most Canadian metropolitan areas over the period. However, we find sustainable commuting emerging in subcentres where large public transport infrastructure investments have been made, such as in the case of Vancouver’s Millennium and Canada lines. Our study also shows that central business districts (CBDs) and downtown subcentres are becoming relatively more sustainable over the period, which confirms the positive effect of the back-to-the-city movement and changing behaviour toward active transportation in these locations.

1. Introduction

As one of the fastest growing sources of global emissions, transportation—and most notably that of individuals—has become one of the principal challenges in the struggle for a sustainability-focused transition [1]. Daily commutes between the place of residence and the place of work is critical in this endeavour, which has made it the object of intense scrutiny since the 1990s. On the one hand, the literature on the sustainability of commuting behaviours has focused on the place of residence (place of origin) as a point of departure. Past studies have investigated how the built environment of residential neighbourhoods (density, mix of functions, public transport services, etc.) or the socioeconomic characteristics of commuters (income, family status, age, etc.) [2,3,4,5,6] impact commuting behaviours. While such studies aim at providing insights on the role of planning policies in fostering urban sustainability, they have been criticized for raising issues of residential self-selection [7,8,9,10], complicating the generalization of these results. On the other hand, other studies have taken destinations or the place of employment (employment centres) as the starting point of the analysis. Past research has shown how commuting is structured by both centralized (e.g., central business districts or CBD) and diffuse work destinations (e.g., edge cities). The trend described in both the US and Canada between the 1990s and early 2000s is that of a relative decline of downtown areas in daily commutes and the rise of suburban and diffuse work locations as new work destinations. However, new important changes have occurred that have not been the object of recent investigations, at least in Canada. The rise of transit oriented development (TOD) areas, the development of peripheral transport infrastructure, as well as new travel behaviour (e.g., commute by bicycle or active mobility options) have emerged over the past decade, complexifying both the structures of metropolitan employment and commuting dynamics.
While a number of studies exist on commuting dynamics in employment centres in Canadian metropolitan areas, most of the previous works have been limited in the number of modes of transport studied, while empirical analyses rely on rather dated or aggregated data which do not adequately allow the identification of emerging spatial structures, polynuclear or scatteration in particular [3,11,12,13,14,15]. Furthermore, aside from France [16] and other parts of Europe [17], there is a lack of comparative studies that could shed light on the types of employment centres that emerge as promoting sustainable travel behaviours in the long run across cities. To our knowledge, no study has systematically identified the types of employment centres of Canadian metropolitan areas, while comparing commuting dynamics across Canadian cities over a recent and long enough period to analyze those emerging dynamics. With the aim of filling these knowledge gaps, this study contributes to the literature on urban mobility and sustainability by examining and comparing commuting trends within the subcentres of six major Canadian cities between 1996 and 2016. The study develops a general typology of employment centres as its analytical framework to capture recent polycentric dynamics and the evolution of commuting modes of transportation and travel distances in Canadian metropolitan areas. This framework is empirically applied using Census microdata, which provides fine grained and detailed information on the place of work, place of residence, and travel modes of workers over the period studied. While the results presented in this study provide further evidence of ongoing trends previously described in the literature, they also offer a valuable assessment of the impact of recent developments within metropolitan areas while revealing new trends that have been the subject of a limited number of previous studies. Before presenting the results, the following sections first propose a review of past and recent studies on subcentres and commuting dynamics. The paper then describes the analytical framework developed, followed by the data and methods used. Results, discussions, and a general conclusion follow.

2. Literature Review

Since the Second World War, the spatial structure of employment in major North American cities has shifted from predominantly monocentric compositions, with single city centres, to new polycentric arrangements involving a growing number of subcentres in the metropolitan periphery. Scholars recognize three to four waves of suburbanization [18,19,20,21]. The first wave, which started as early as 1945, involved the massive decentralization of residential developments and households. From the 1960s, a second wave saw shopping centres and industrial parks emerge on the outskirts of metropolitan areas. A third wave occurred in the following decade, in which a growing number of back-office jobs decentralized toward the metropolitan periphery. A last wave took place during the 1980s, during which jobs in the upper tertiary sector (front offices) started to concentrate in newly established suburban towns. This led to new conceptualizations of metropolitan employment structures—scholars describing the rise of “suburban downtowns,” [18], “magnet areas” [22] or “edge cities” [20]. However, polycentric urban growth is not uniquely North American. Numerous studies have observed that African [23], European [24,25], Asian [26] and South American [27] cities are becoming more and more polycentric. In Canada, it has been shown that cities are becoming more polycentric [28], but to a lesser extent than in the United States, where urban sprawl and dependence on cars is more evident [29,30]. Large Canadian cities also differ by their CBD, which remains strong in attracting employment [31,32] while facing less competition from suburban municipalities [33]. However, we can see that commuting dynamics are currently facing major disruptions in major Canadian cities.
This general decentralization of employment in metropolitan areas has had important impacts on commuting dynamics, with an increasing dislocation of traditional commuting flows toward the city centre. In addition to being major generators of daily travel, employment subcentres are usually located near major highways [34] and are often not easily accessible by public transport. Consequently, personal vehicles are often the favoured mode of transport for commuting toward these areas. Case studies in Montreal [11,13,35], Toronto [4], New York [36], Portland [37], Atlanta [38] or in the San Francisco Bay area [39] are unanimous in affirming that the automobile remains the dominant mode of transport in employment subcentres. This may seem evident to many. On the one hand, public transport networks traditionally converge toward the city centre and, on the other hand, employment subcentres are traditionally located in fewer densified areas that are more accessible by automobile. This inevitably reinforces the unsustainable character of these subcentres.
Nonetheless, several studies have argued that in the long run, polycentric metropolitan areas should induce more sustainable commuting flows, as employment subcentres get closer to the workforce established in the suburbs [2,11,40,41,42]. The influx of new jobs in exurban territory has the potential to create a new balance between the number of jobs and the quantity of labour—similar to the ideas of jobs–housing balance [43] and co-location [44,45,46]—and therefore limit travel distances.
Furthermore, suburban areas have also seen some major investments in public transport. Since the mid-1990s, investments have been made, in particular, by setting up neighbourhoods geared toward public transport. Under the name of transit oriented development (TOD) and resulting from the movement of New Urbanism [47], these districts aim at a mix of housing, services and jobs, friendliness of the built and pedestrian environment, development of sites that are vacant or to be redeveloped, and preservation of the natural environment [48].
Yet, in many cases, TOD neighbourhoods located in suburban areas appear to be mono functional residential neighbourhoods with a population that specifically works in the city centre. At least, this is the case for the Montreal metropolitan area and its commuter train network [49]. If so, TOD districts may offer a sustainable mode of transport that is limited to providing access to the place of origin (the place of residence). Hence, many have argued that monocentric cities induce more sustainable commuting flows in the long run, since city centres are easily accessible by public transport, with compact residential areas and a high density of public and active transport infrastructure [13,39,46,50,51,52]. Many have noted that outside the CBD, downtown or inner-city areas with access to public transport networks, very few train stations, metro stations, or bus terminals are located close to commuting destinations (place of work)—whether it is being in shopping centres, industrial parks, or in edge city developments. Hence, despite residing close to public transport networks, individuals residing in TOD may be forced to rely on their car if they work in areas poorly served in public transport infrastructure, despite the fact that a large number of TOD residents work in the city centre [5].
At the same time, employment subcentres do not form a homogeneous block and can vary according to their relative location within metropolitan areas, their relative size, growth or maturity. They can also differ in terms of economic activities [53,54], which can cause, among other things, competitiveness or complementarity between subcentres [55]. In fact, several types of employment subcentres have been described in the literature. In Canada, Shearmur, Coffey, Dubé and Barbonne [53] proposed an intrametropolitan typology of subcentres for the three largest Canadian cities (Toronto, Montreal and Vancouver) by distinguishing between subcentres according to the number of jobs. In Germany, Krehl and Siedentop [56] have developed a typology of subcentres according to socioeconomic variables, built environment, and land use for four metropolitan regions. Similarly, McMillen and McDonald [57] identified six types of subcentres in the Chicago metropolitan area associated in particular with temporality (old satellite cities, new industrial/retail suburbs).
In light of what has been said, is the rise of peripheral employment centres promoting more sustainable mobility of workers to their workplace? What types of subcentres evolve toward more sustainable travel modes and commuting distances? Recent developments within metropolitan areas—whether new planning practices (e.g., TOD), the development of peripheral transport infrastructure, or changing travel behaviour—suggest that polycentricity may lean toward more sustainable commuting flows through co-location and a better job-housing balance. This study aims at empirically confronting this hypothesis with the opposite thesis that subcentres rather generally promote motorized travel modes and longer commuting distances. Besides, it is expected that suburban employment centres that have most recently emerged should promote more sustainable travel dynamics, following better planning practices and recent investments in infrastructure. However, before presenting the empirical analyses, data and methods, the article develops the analytical framework on which our analysis is based.

Analytical Framework

This study builds a typology of employment subcentres to explore the evolution of commuting modes and travel distances in Canadian metropolitan areas between 1996 and 2016. This typology is designed to capture the variety of employment subcentres described in the literature and adapted to the Canadian context. This classification further relies on five key indicators and variables previously used in the literature—distance from the CBD, number of jobs, job density, residential density, and employment growth—as discussed in the methods sections below.
These five variables seem to us sufficient to distinguish the employment clusters in our typology. They faithfully represent the characteristics associated in the literature with urban form, such as employment and residential density [58], employment growth [53,59], number of jobs [53], and distance from the CBD [60,61]. On the other hand, the addition of new variables, such as industry types or occupational classifications, would have altered the number of subcentre types and moved away from the representation of urban form.
The CBD area represents the central business district of a metropolitan region, which is the area containing the “peak land value intersection” [62,63]. CBD areas are not large and cover between 0.48 km2 (in Toronto) and 4.83 km2 (in Calgary) of land. The analytical framework and definitions of employment centres used in the results sections are presented in Figure 1.
The CBD area (1) represents the central business district of a metropolitan region, or in other words, the area containing the “peak land value intersection” [62,63] and the downtown area (2) corresponds to the vicinity of the CBD area.
Inner city subcentres (3) correspond to the concentration of jobs in central neighbourhoods with medium to high residential density [64]. Relatively close to the city centre, the territories associated with the inner city are generally equipped with public transport and have witnessed a demographic and economic resurgence in recent decades. The work of Michael Porter [65] has also underlined the competitive nature of these areas.
Small subcentres (5) and Primary subcentres and Airports (4) refer to the hierarchical property between subcentres (in numerical terms) and which has been widely used in the urban form literature in the United States [66,67], Europe [24,25] and Canada [28,68]. Moreover, the geographical location of the international airport is generally correlated with the main employment centres [69]. Indeed, it has been pointed out that export-oriented firms may be attracted by the proximity of airport infrastructure [70].
Non-distant subcentres with medium-to-high density (6) and Distant subcentres with low density (7) are primarily based on variables associated with density (residential and jobs) and distance from the CBD.
Finally, in terms of economic (de)growth and temporality, Boom centres (8) and Declining subcentres (9) are part of the typology. The first type refers to the work of Sultana and Weber [59] on the rapid growth of employment areas and may be somewhat similar to Joel Garreau’s [20] concept of edge cities in terms of temporality—edge cities are notably cities that were created after 1960. However, in Canada, there is no edge city in Montreal [32] and very few in other large cities of the country [71]. The second type refers to the shrinking subcentres that can sometimes be found in inner suburbs with an industrialized past before World War II [57].
The methodology for identifying subcentres and the development of the typology are detailed in the methodological section. These types of subcentres will also be analyzed in the results section.

3. Data and Methods

3.1. Data

This study relies on Statistics Canada’s confidential microdata extracted from the 1996, 2006, and 2016 long-form questionnaire (2b)—from the Census of Population. The long form provides a sample of about 20% of the Canadian population, although Statistics Canada provides sampling weights allowing to accurately estimate the overall population. This study is limited to the active population that declared a usual workplace address as their place of work status. From the Census of Population, we are able to locate both the workplace of each individual and their place of residence, which are used to estimate the length of the commuting trip. The Census of Population further provides individual travel modes and socioeconomic characteristics.
In this study, six Canadian census metropolitan areas (CMA) are analyzed: the three largest cities—Toronto, Montreal, and Vancouver—and Calgary, Quebec City, and Winnipeg, which rank as medium-to-large-sized cities. Table 1 details a socioeconomic overview of these cities.
In other words, the territories of the three largest CMAs (Toronto, Montreal and Vancouver) are analyzed, as well as two cities that have been the subject of exponential urban development (Calgary and Quebec), and a city with a deficient public transport system (Winnipeg). In the work on commuting in major Canadian cities, the literature review showed that Montreal and Toronto have been extensively studied. This is not the case for Vancouver or Quebec City, and even less for Calgary and Winnipeg.
In terms of demographics and mobility, in 2016, the Toronto CMA had a population of nearly six million [72] and was equipped with a network of subways, trains, and streetcars. In comparison, Montreal CMA had a population of over four million and was equipped with a metro and commuter train network. The Vancouver CMA had a population of 2.5 million and had an automated subway system (SkyTrain), trolleybuses and commuter trains. For its part, the Calgary CMA had a population of nearly 1.4 million, but had only two commuter train lines as well as buses as a transit offering. The Quebec City and Winnipeg CMAs, for their part, had 800,000 and 778,000 inhabitants, respectively, and had only a bus network as their transit system.

3.2. Subcentres Identification

In the literature, various identification strategies have been proposed to delineate subcentre localization, including methods based on density peaks [67,73], residuals [74,75], trip generations [13,14,40,76], or, the most popular method which combines a ratio and a threshold [27,58,77]. The least arbitrary threshold to identify subcentres within metropolitan areas is the one-percent ratio [32,78,79] (e.g., Census tracts must contain at least 1% of all jobs in the CMA to be considered subcentres), which is the approach retained in this article to identify subcentres in Canada’s two largest CMAs (Toronto and Montreal). For the remaining second-tier CMAs, a threshold of 10,000 jobs is used, given that the one percent ratio yields a huge number of subcentres in these locations. Taking the example of the Winnipeg CMA in 2016, a census tract (defined by Statistics Canada as an area that encompasses 2500 to 8000 inhabitants) with more than 2885 jobs would be considered a job centre. On the other hand, a threshold of 10,000 jobs would bring out too many subcentres in the case of large CMAs such as Toronto and Montreal.

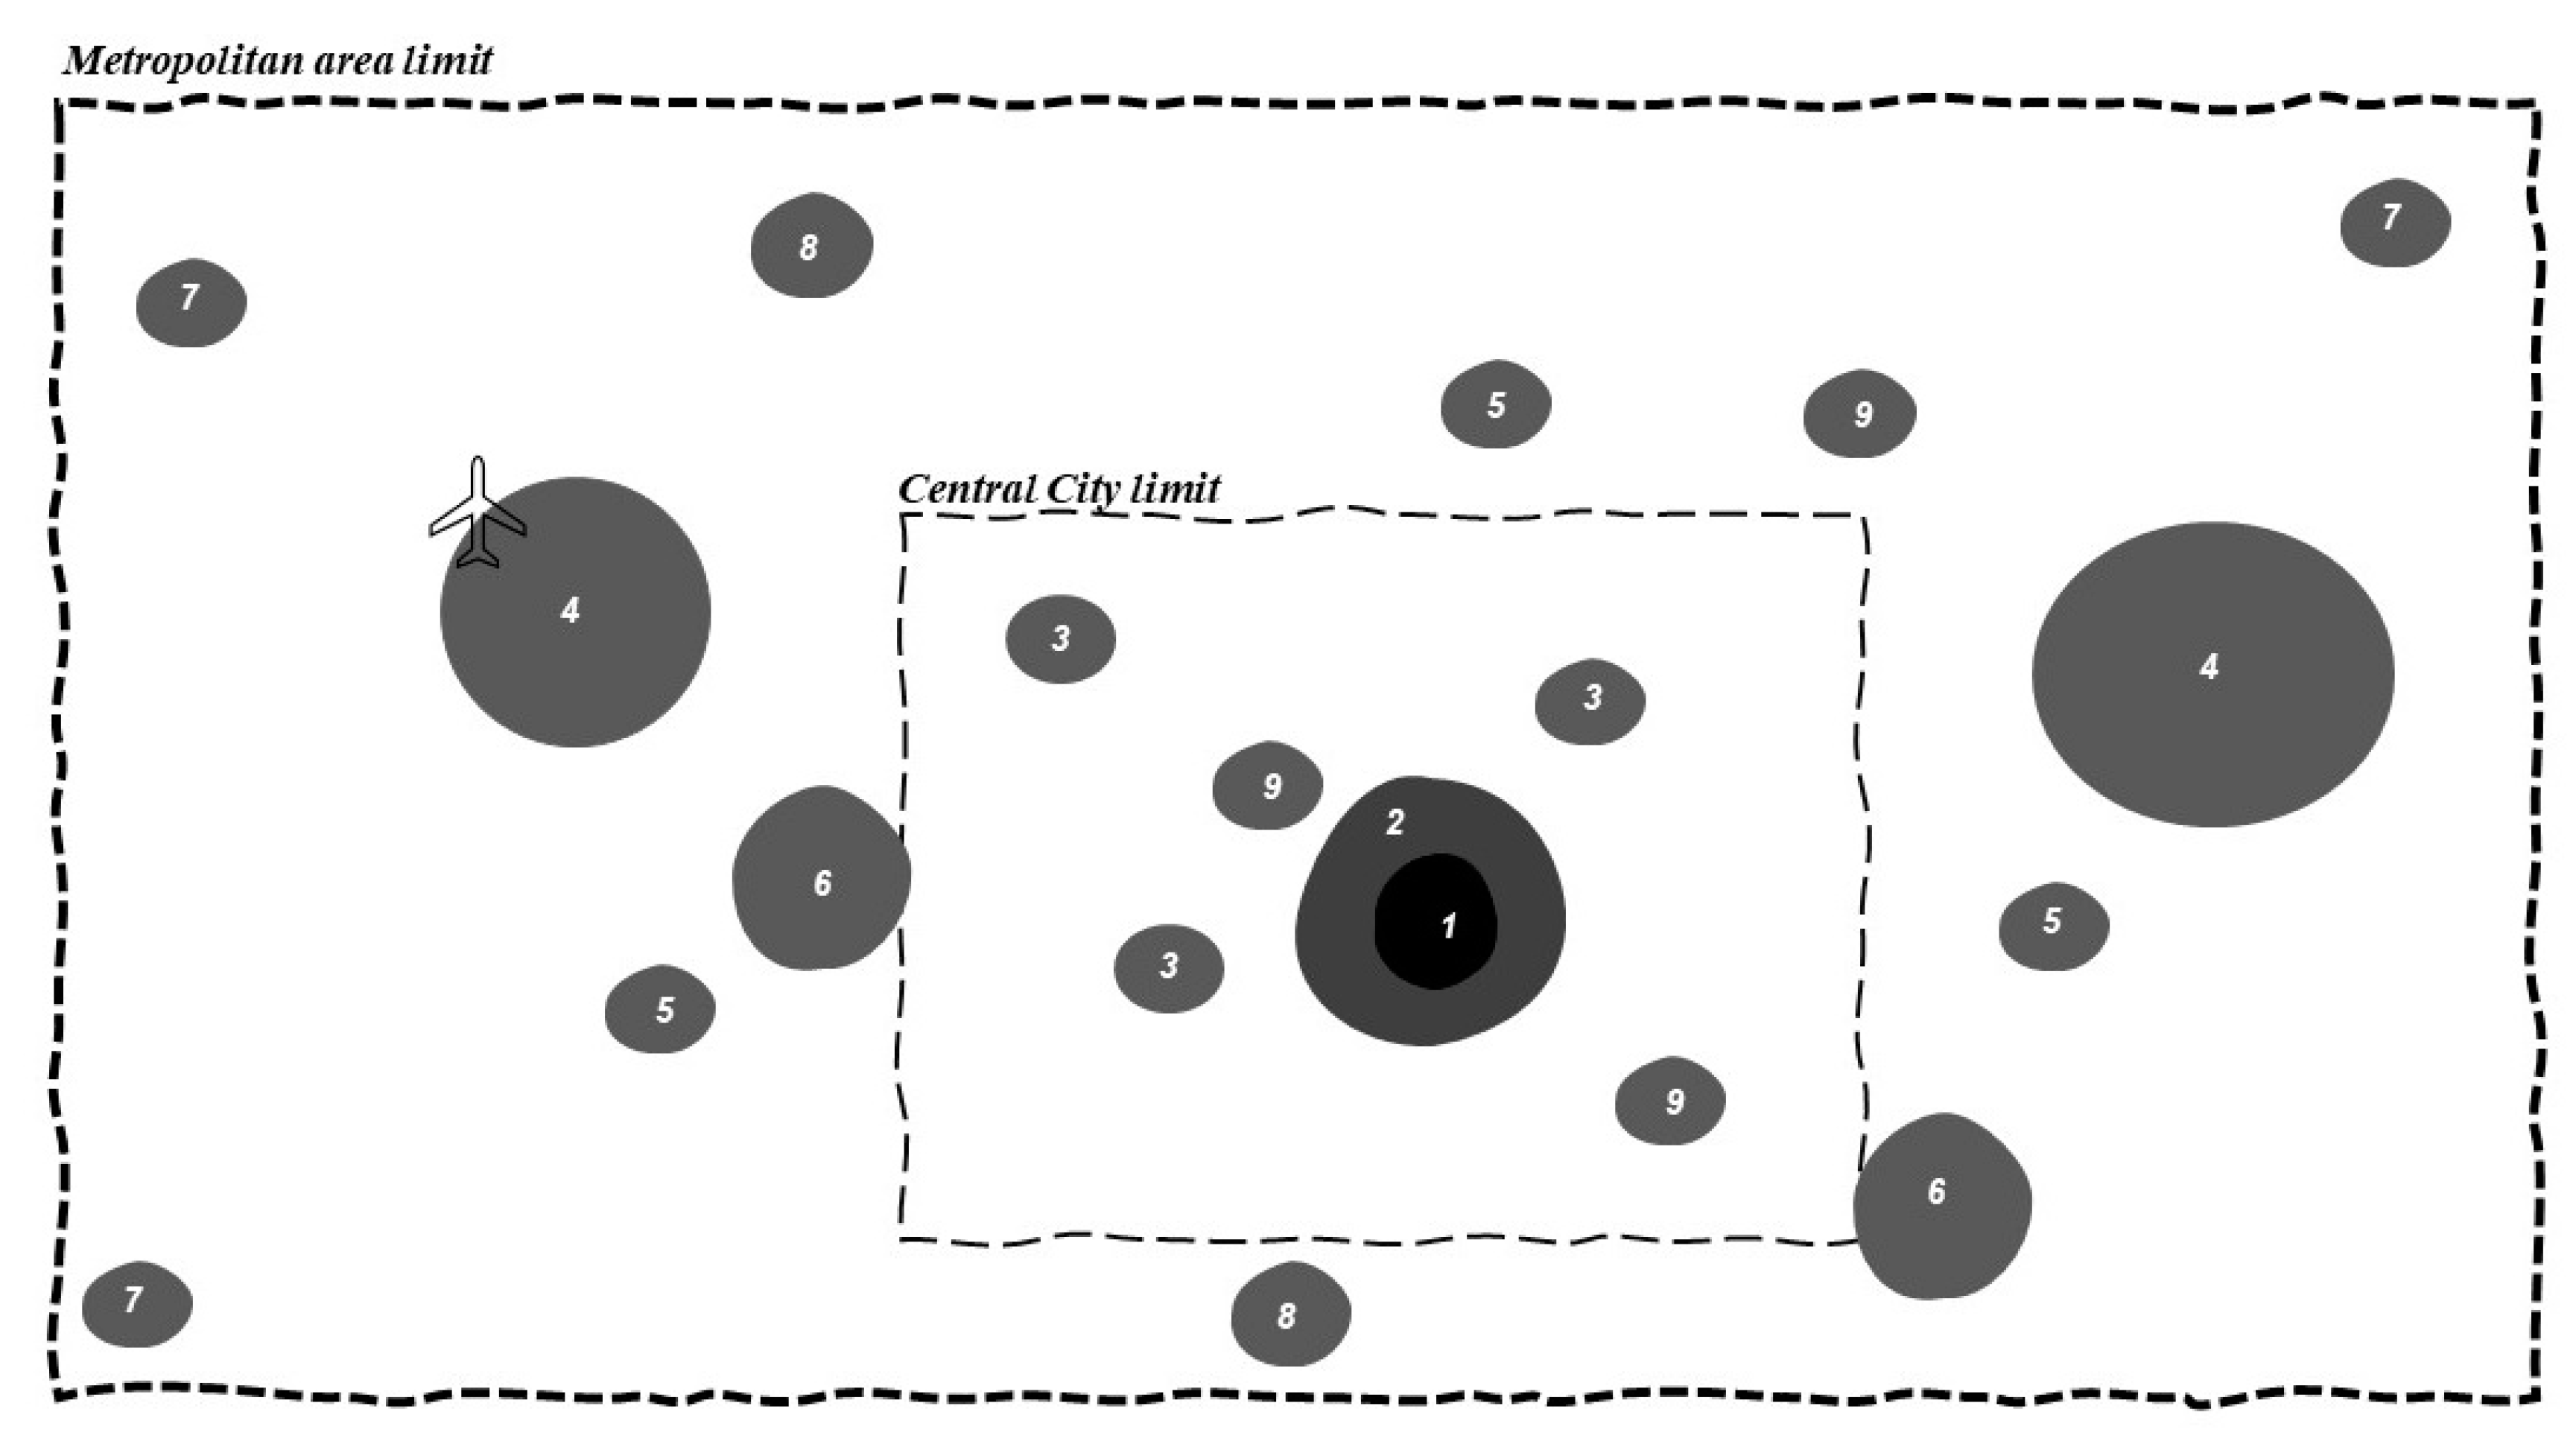
3.3. Types of Subcentres and Their Attributes

The literature highlights a variety of employment subcentres. These mainly vary according to their relative location within the metropolitan realm, their relative size, growth, or maturity. In order to distinguish between types of subcentres, this study retained five criteria: (1) the number of jobs in 2016; (2) the job density in 2016 in km2; (3) the residential density in a 5 km buffer of the subcentre centroid, which includes only people working full-time; (4) the employment growth between 1996 and 2016; and (5) the distance from the CBD, calculated as the network distance between the CBD and subcentre centroids. This distance is calculated on the road networks of Canadian cities in 1996 and 2016 using data from Statistics Canada’s National Geographic Database (NGD). Distances are calculated as the shortest physical distance in metres (Dijkstra’s algorithm). The 5 km threshold corresponds to a distance favourable to active travel and has been used in other articles [80,81]. Average distances are calculated using Statistics Canada Census sampling weights.
The downtown area corresponds to the vicinity of the CBD area. Downtown contains between one area (the Beltline neighbourhood of Calgary) and seven areas (in Toronto). Usually, downtown neighbourhoods include the old city district, the old revitalized harbour, or the newly trendy old-warehouse district such as Yaletown (Vancouver) or Griffintown (Montreal). Like the CBDs, downtown areas are not necessarily huge, varying between 2.57 km2 (in Quebec City) and 13.56 km2 (in Vancouver), and their furthest distance from the CBD’s centroid is 2.75 km.
Based on k-means clustering, eight groups have been identified for the three largest cities (Toronto, Montreal, and Vancouver) and seven groups for the medium-to-large-sized cities (Calgary, Quebec City, and Winnipeg). Two groups were distinguished from other CMAs because of the different city sizes. Putting together all CMAs affected the k-means results. Table 2 presents the typology attributes.

3.4. Commuting Pattern: Travel Modes and Distances

Two variables are used in this study: travel modes and the travel distance. The travel mode variable is composed of car use (as driver and passenger), public transit use, bike use, and walking. This study retained the last three modes as sustainable modes. Part-time workers and teleworkers were removed from the analysis as our study focuses on subcentres and daily commuting. The travel distance variable is calculated as the network distance between the census track’s centroid of workplace and place of residence for each individual working in a subcentre. Network distance is more effective and precise than the Euclidian distance [82,83], especially in cities where there are mountains (Vancouver), rivers (Calgary and Winnipeg), and larger rivers (Montreal and Quebec City)—physical geography substantially increases commuting distances.

4. Results

In this section, three sets of results will be shown: employment dynamics of subcentres, patterns of commuting trends, and the evolution of travelling distances. For each city, a distinction will be drawn between the CBD and subcentres.

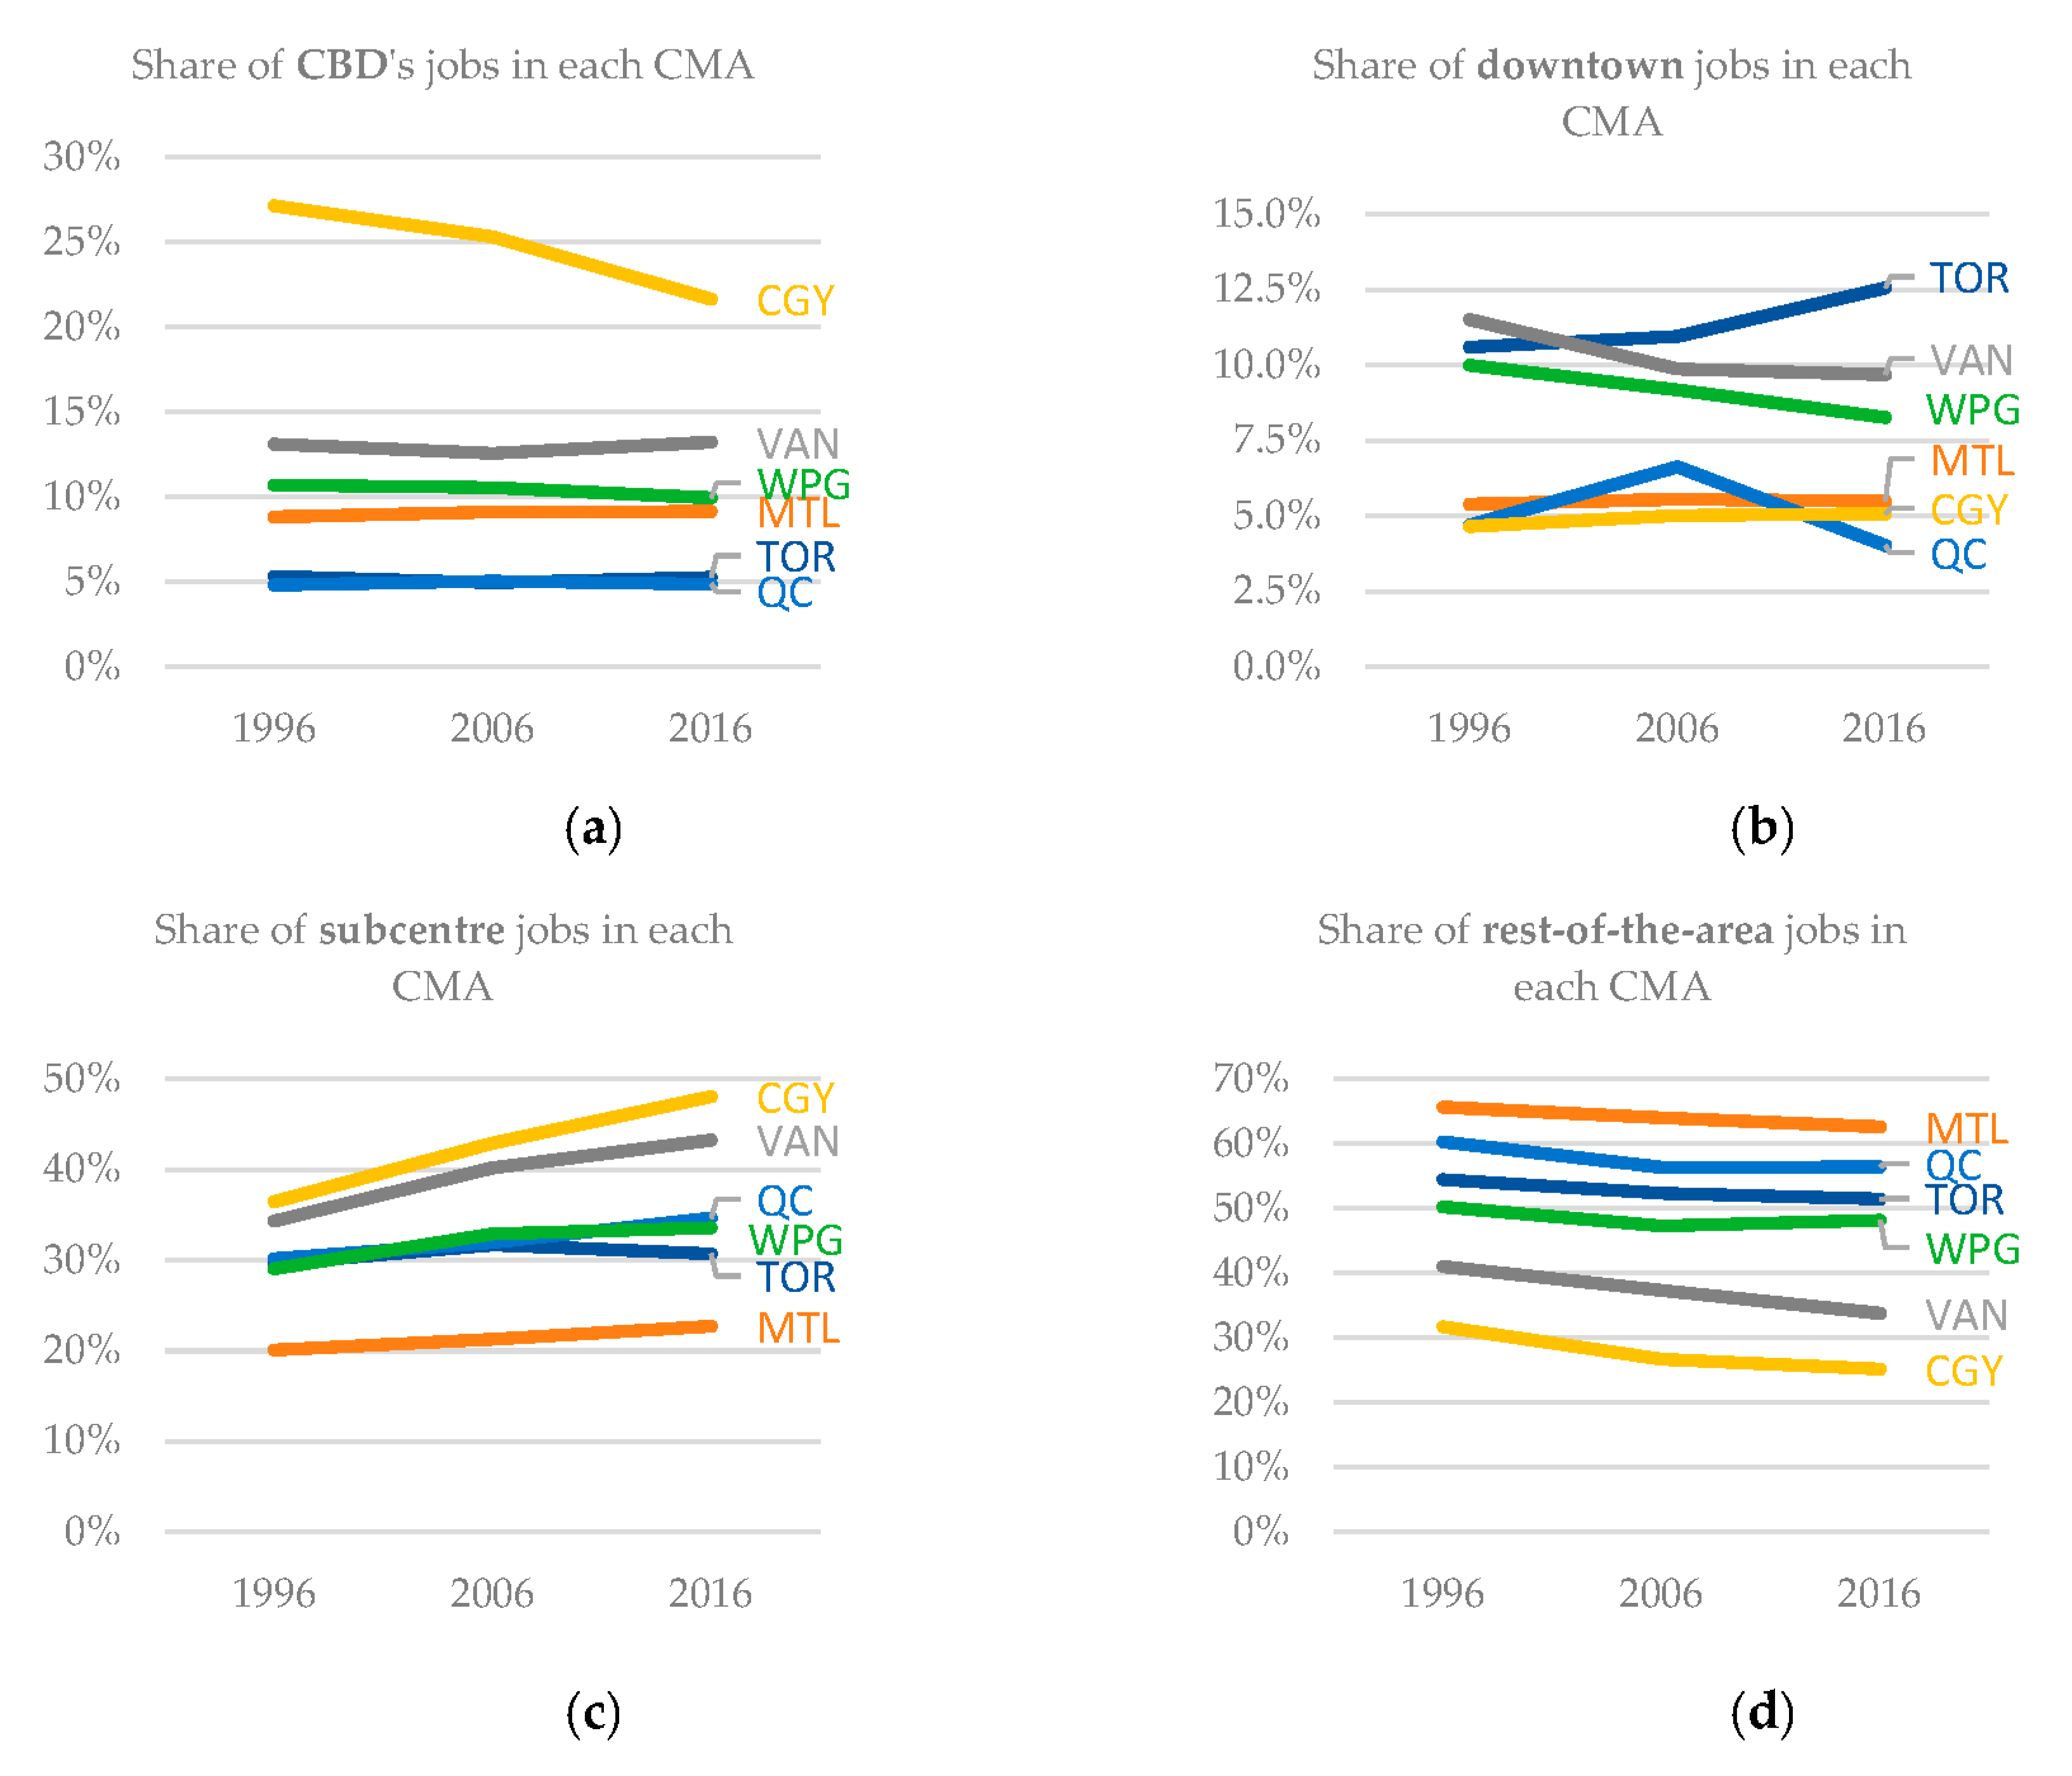
4.1. Polycentricity of Metropolitan Areas

The first results show the evolution of subcentres in six Canadian CMAs between 1996 and 2016. Associated with urban form, four types of zones are shown in Figure 2: the CBD (Figure 2a), the downtown area (Figure 2b), subcentres (Figure 2c), and the rest of the area (Figure 2d).
Figure 2 shows that Calgary’s CBD (CGY) has the largest share of jobs among CMAs, but its relative importance declined over the period to the benefit of subcentres—a trend similar to Vancouver (VAN) where the share of jobs in subcentres increased substantially within the CMA.
While in absolute numbers, Calgary’s CBD jobs increased from 86,760 to 113,390 between 1996 and 2006, these stagnated up to 113,620 jobs until 2016. This is possibly due to the oil sands’ shock in 2015—many headquarters in the oil sector clustering in Calgary’s CBD. In the case of the smallest CMAs, the relative importance of subcentres in Quebec City (QC) and Winnipeg (WPG) increased, but to a lesser proportion. In the case of Toronto (TOR) and Montreal (MTL), employment shares of subcentres increased slightly. In sum, the size of these Canadian CMA subcentres increased at different levels. Finally, the percentage of the rest-of-the-area jobs is declining in every CMA, meaning that jobs in general are clustering. However, the gap is wide between CMAs: in Montreal, 62.6% of jobs are not within its CBD, downtown or subcentres, whereas this proportion is only 25.2% in Calgary.
In brief, these four figures show that, in relative terms, employment in Canada’s largest cities has concentrated in subcentres since 1996, which reflects the increasingly polycentric nature of these metropolitan areas. One exception is the Toronto CMA, where the share of jobs in the inner city increased, followed by a slight decline in employment in the subcentres.

4.2. Evolution of Employment by Subcentres

Table 3 shows that the number of subcentres (1% or ≥10,000) and small subcentres (0.5% or ≥5000) increased in all CMAs, except for Toronto where one subcentre and one small subcentre disappeared, although the total number of jobs kept increasing in the remaining subcentres (159,980 new jobs in subcentres and 20,820 in small subcentres). Numerous subcentres appeared in Calgary and Vancouver, and a lot of new small subcentres emerged in the Montreal CMA.
The following figures offer a geographic perspective on where employment growth and new subcentres emerged within the six CMAs.
Figure 3 shows that in the Toronto CMA, employment growth was highest in the north western area, especially in the Brampton East boomburb, in Vaughan, and in the Mississauga-Airport sector. In itself, this last subcentre attracted 154,480 jobs in 1996, and 241,410 in 2016, representing double the CBD’s jobs and making it the biggest subcentre in Canada. To put things into perspective, Mississauga-Airport has more jobs than the Montreal downtown, including its CBD. However, the proportion of jobs decreased in the eastern zone while in contrast, Harbourfront downtown district employment doubled. For Montreal, Figure 4 shows an increase in the number of small subcentres between 1996 and 2016, mainly on the north shore of the CMA along Autoroute 640. In the downtown area, jobs in the “Quartier de l’Innovation” (which is part of Griffintown) increased from 10,205 in 1996 to 23,485 jobs in 2016, fuelled by the emergence of a large number of start-ups in this area. Yet, the CBD remains the biggest jobs centre in the Montreal CMA (with 137,685 in 2016), followed by Saint-Laurent (with 73,310 jobs in 2016). In the Vancouver CMA, jobs grew in the eastern part of the CMA, in suburbs such as Surrey and Langley (Figure 5) and decreased in the East Downtown (−1475 jobs). The CBD is also the biggest centre (111,125 jobs in 2016), followed by Burnaby Centre with 38,270 jobs.
For a medium-to-large-sized city such as Calgary (Figure 6), jobs increased in all subcentres. While it was almost an agricultural field in 1996, the northern municipality of Airdrie became a subcentre in 2016, gathering 12,105 jobs. New small subcentres emerged along the southern part of the Macleod Trail. The Calgary CBD is still the most attractive centre, but subcentres such as Northeast-Airport and Shepard Industrial grew tremendously. In the case of Quebec City (Figure 7), growth was less swift than the two previous CMAs: a few changes have been observed, namely Lévis and Saint-Augustin. Unlike the other CMAs, with 15,625 jobs in 2016, Quebec City’s CBD is the fourth-biggest centre of the metropolitan region, following Zone industrielle 440-73-740 (29,930 jobs in 2016), Vanier-Lebourgneuf (24,975), and Sainte-Foy-les-Ponts (20,655). Unlike other CMAs, Quebec City’s CBD can hardly be described as a “real” central business district. The area is defined by the vicinity of the provincial parliament and by the concentration of a few tall buildings, mostly hotels and government buildings, with an absence of financial or business corporations, which mainly concentrate in the Montreal CBD. Figure 8 shows that job development in Winnipeg mainly took place in the south west part of the CMA, especially in the Winnipeg South-West subcentre, where jobs nearly doubled from 8920 in 1996 to 17,365 jobs twenty years later. Its CBD remains the biggest centre of the CMA.
In sum, for all six CMAs, steady job growth between 1996 and 2016 shows that subcentres strengthened their attractiveness and relative position within each of the CMAs. As such, they also inevitably changed the dynamics of journey-to-work as destination points, to which we now turn.

4.3. Commuting Trends in CMAs Employment Zones

Table 4 shows the results of commuting proportions (car, public transit, cycling, and walking) for three different zones (CBD, downtown area, and subcentres) of the six CMAs.
Between 1996 and 2016, car use dropped dramatically in CBD and downtown areas of every CMA, except for Winnipeg where car use remained stable. In subcentres, the proportion of car use increased in Toronto, Montreal, Quebec City, and especially Winnipeg. In Calgary subcentres, car use dropped between 1996 and 2006 and increased over the next ten years. For Vancouver, car use levels dropped from 82.7% in 1996 to 77.3% in 2016, namely the lowest percentage of all CMAs.
Results show that there is a direct relationship between the share of car use and transit use. Transit use increased in CBD and downtown areas, especially in Montreal, but peaked in the Toronto CBD and decreased slightly in Winnipeg. In subcentres, transit use modestly declined in Montreal and Winnipeg, came to a standstill in Toronto, increased marginally in Quebec City and Calgary, but increased markedly in Vancouver (from 7.2% to 13.3%, which is the largest share of Canadian CMAs).
Not surprisingly, cycling use and walking are less widespread than car and transit use. Nevertheless, bicycle use is growing among CBD and downtown workers, especially in Vancouver. However, less than 2% of subcentres’ workers use their bicycle to go to work and, since 1996, cycling use stagnated. A lack of cycling infrastructure, large distances to travel, and the proximity of highways in subcentres can be reasons to shun bicycles. Walking increased in CBD and downtown Vancouver and Toronto probably because of a residential densification of these areas. Montreal downtown also densified, but our results do not show a correlation. Walking share declined in Quebec City’s CBD and downtown. In subcentres, walking dropped for all CMAs, except for Vancouver and Montreal. Walking in subcentres is still marginal, with scores hovering between 0.7% and 3.5%.
In brief, CBDs and downtown sectors strengthened their use of sustainable transport modes, while car use remains dominant in subcentres. This is probably due to the lack of transit infrastructure. The case of Vancouver subcentres is interesting insofar as shares of transit use increased. This is not surprising, since two new metro lines have been built since 1996: the Millennium Line in 2002, which passes through the Burnaby subcentre, and the Canada Line in 2009, which was built for the 2010 Winter Olympics and passes through subcentres such as Yaletown, Airport, and Richmond Centre.
Figure 9 shows detailed results by types of subcentres. Looking at the results, what can be seen at first glance is that car use decreased not only in CBD and downtown areas, but also in inner cities—possibly due to the residential densification and gentrification of inner neighbourhoods—and in non-distant subcentres with medium-to-high density where there is the presence of universities (UBC and Simon Fraser University in Vancouver). Farther subcentres continue to attract car commuters, especially in Boom centres, which is reminiscent of the works of Sultana and Weber [59].
The pattern of solo commuting appears to be similar for medium-to-high size cities (Figure 10). Commuting toward CBDs and city centres is increasingly sustainable, but to a lesser extent. Surprisingly, in contrast to the three largest Canadian cities, commuting to inner city subcentres has become motorized.

4.4. Evolution of Travel Distances

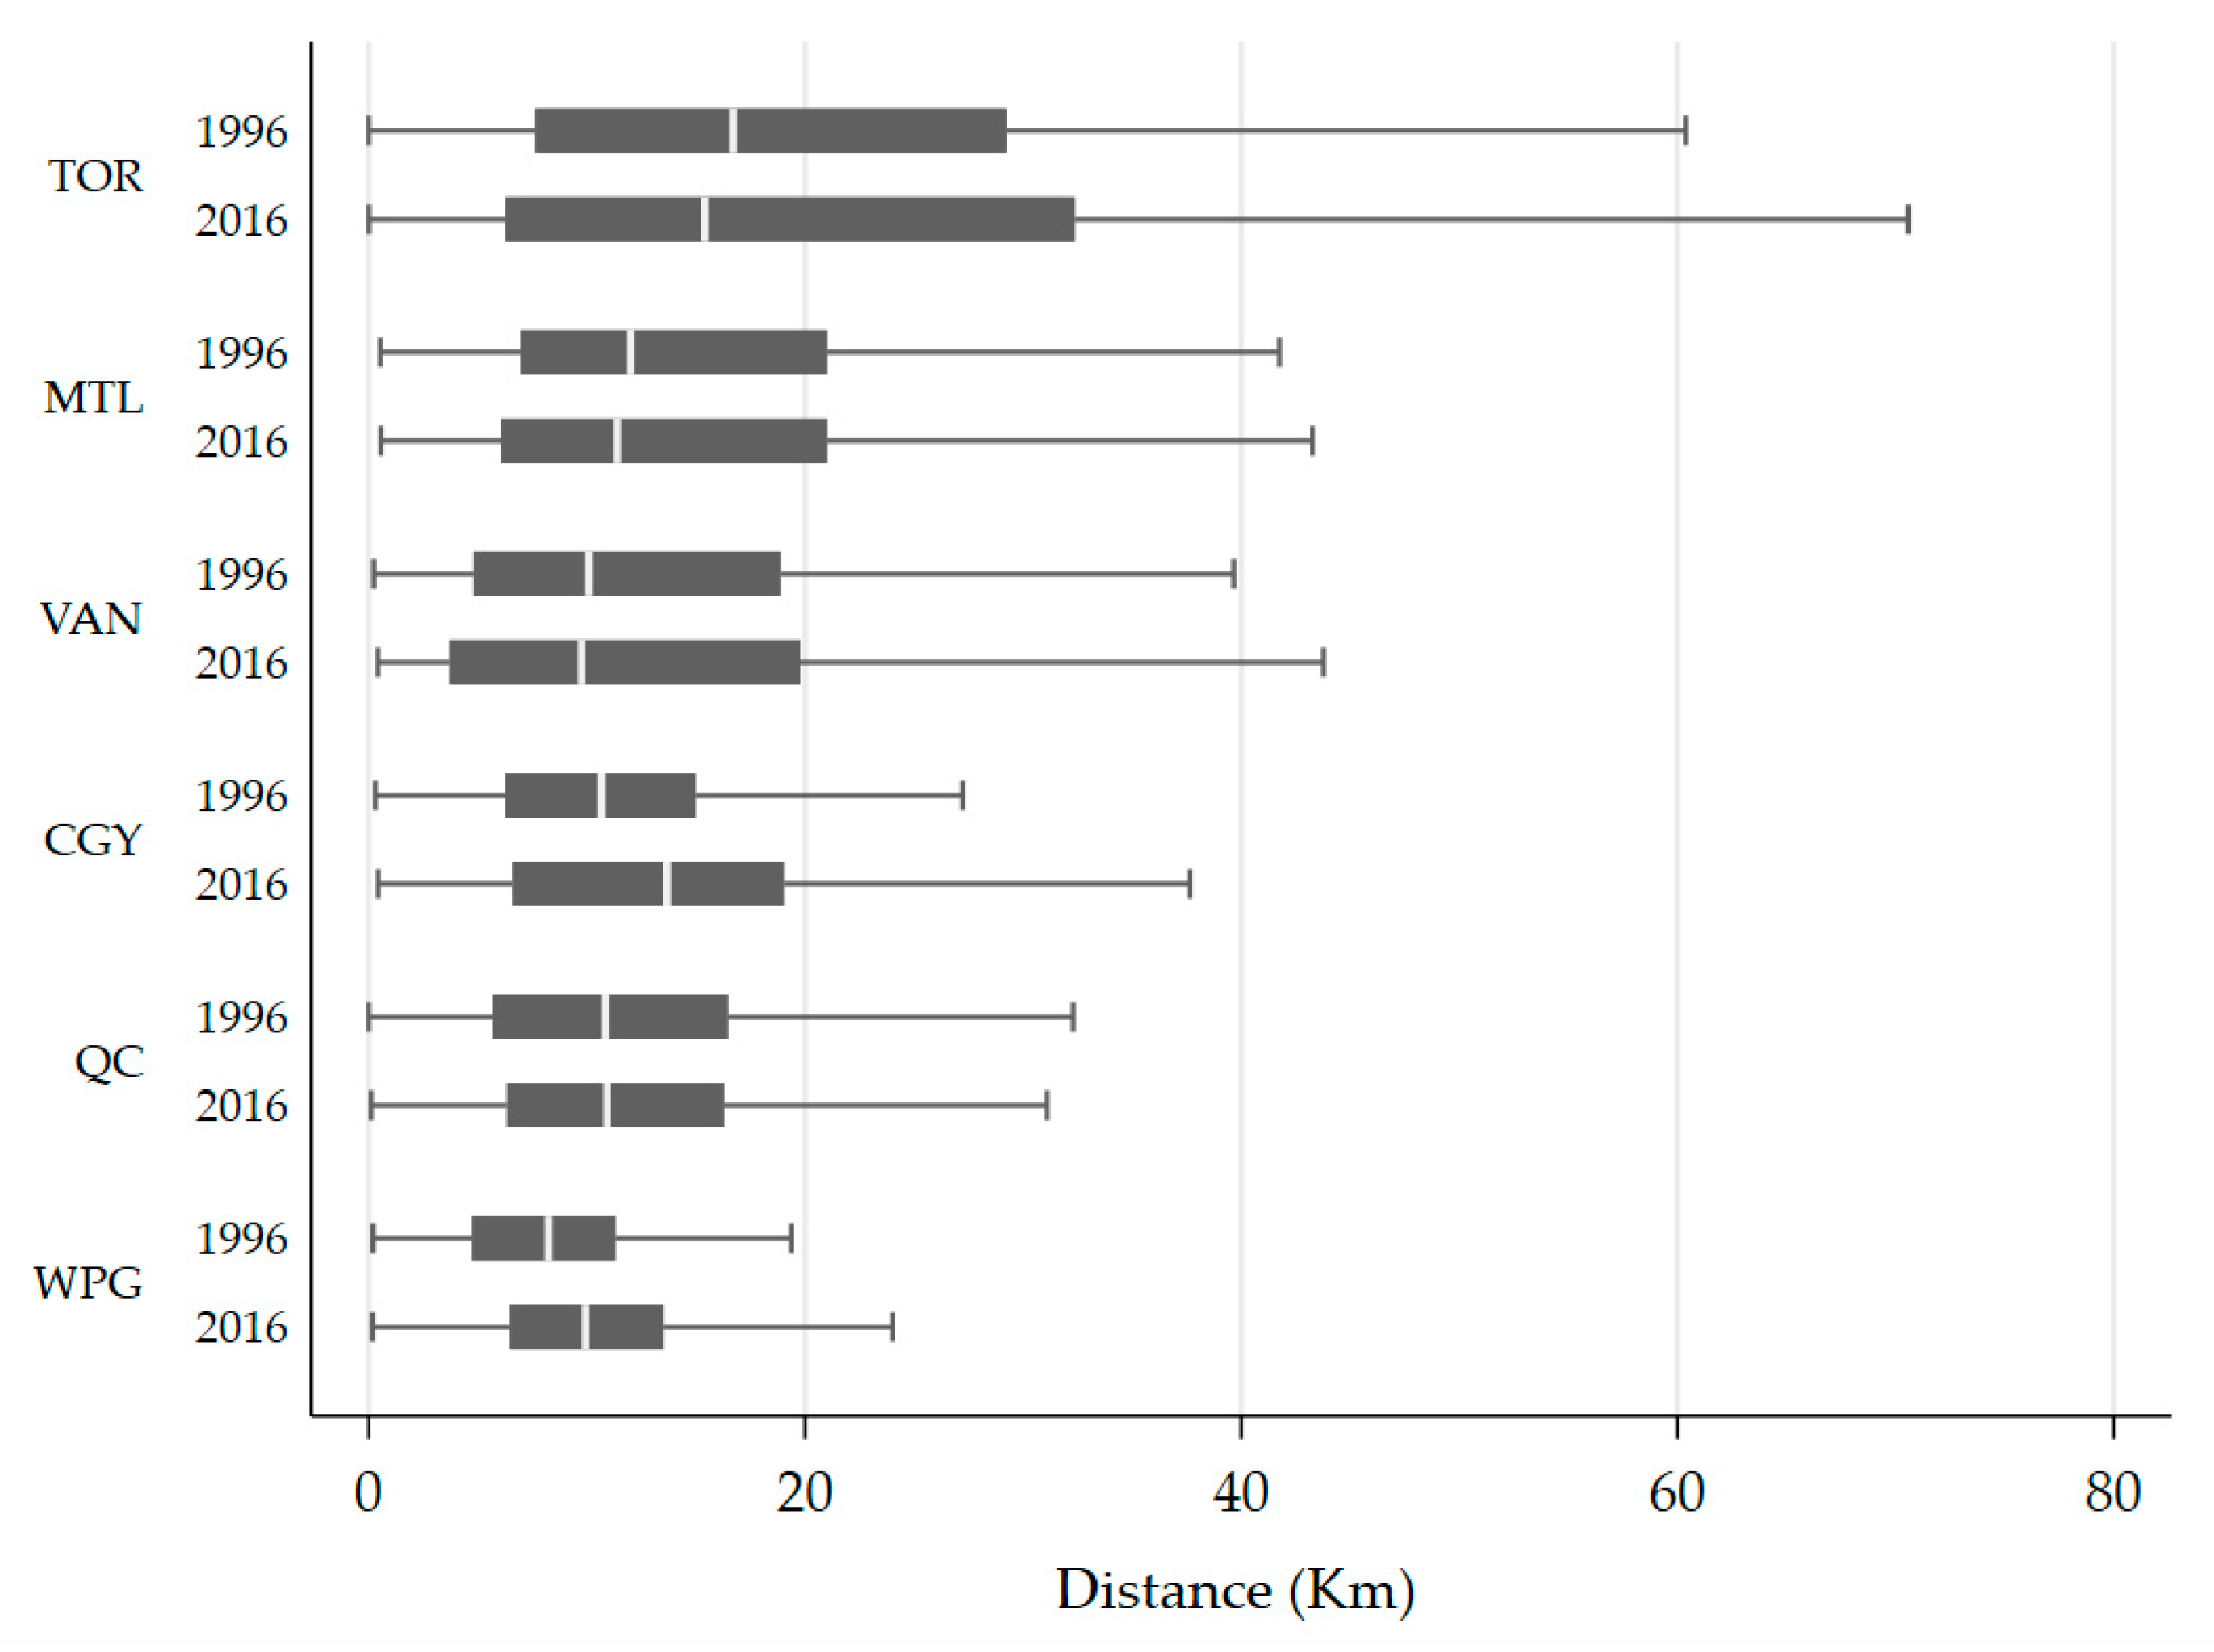
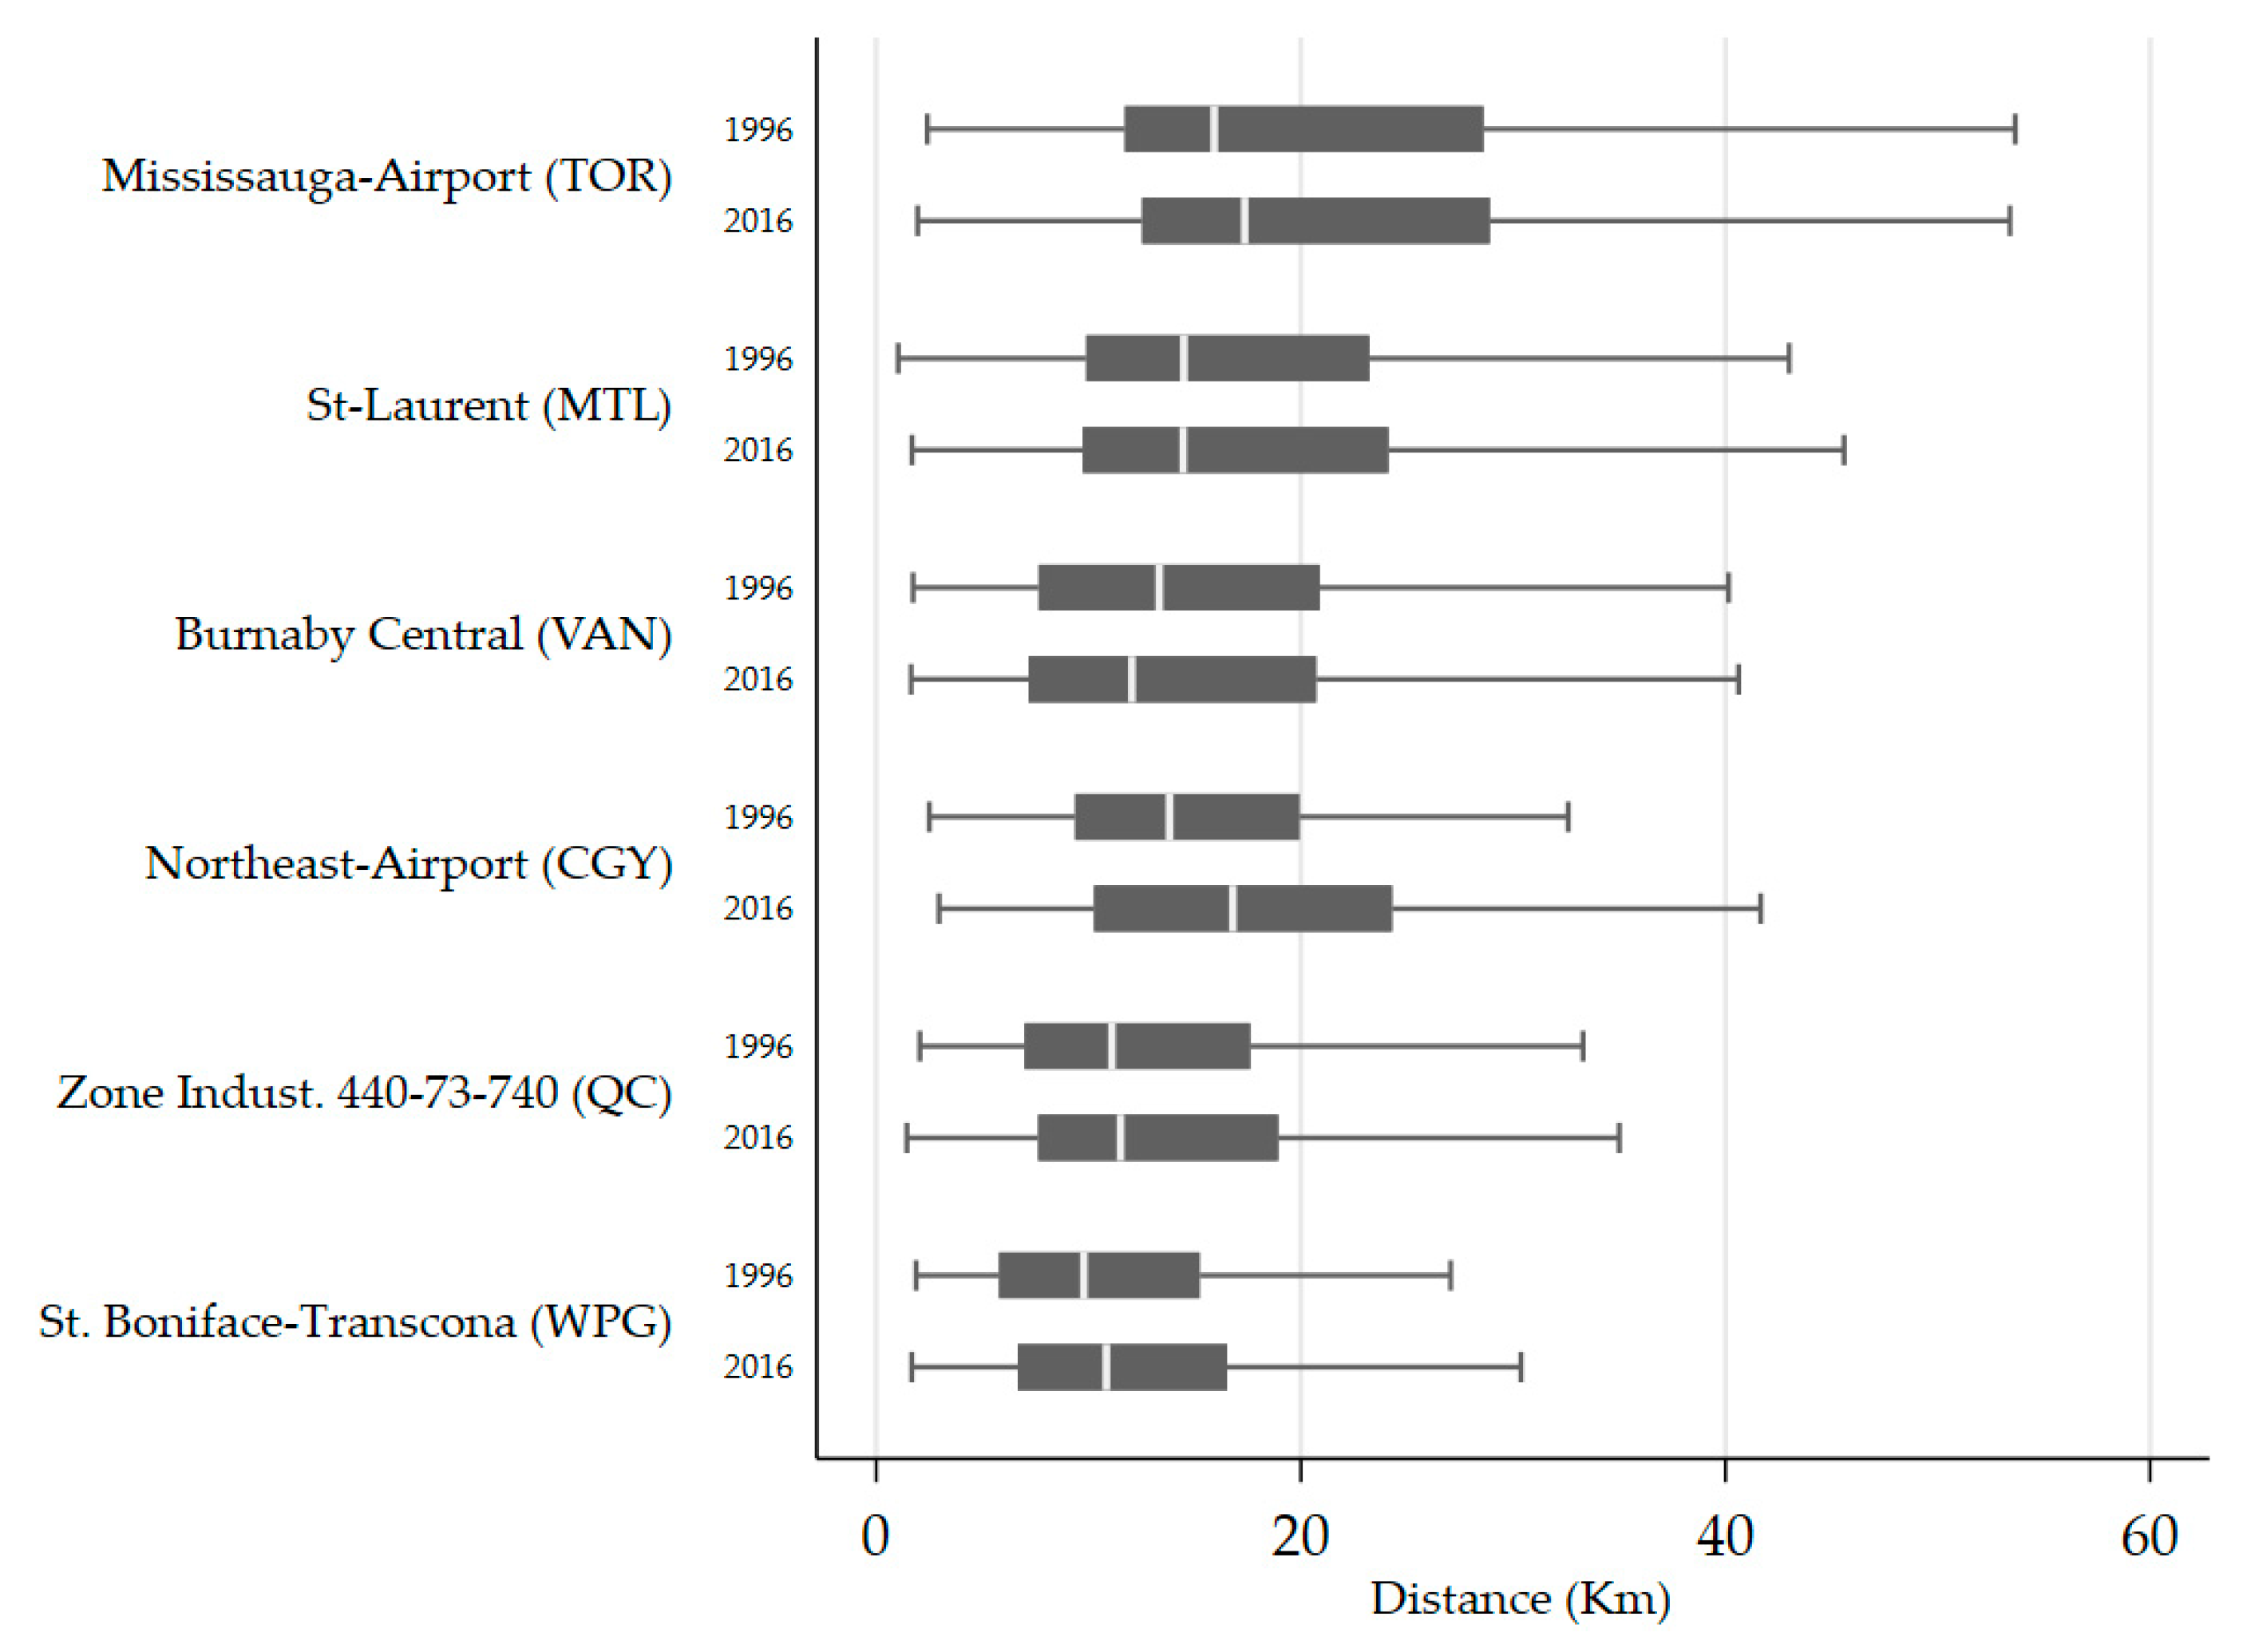
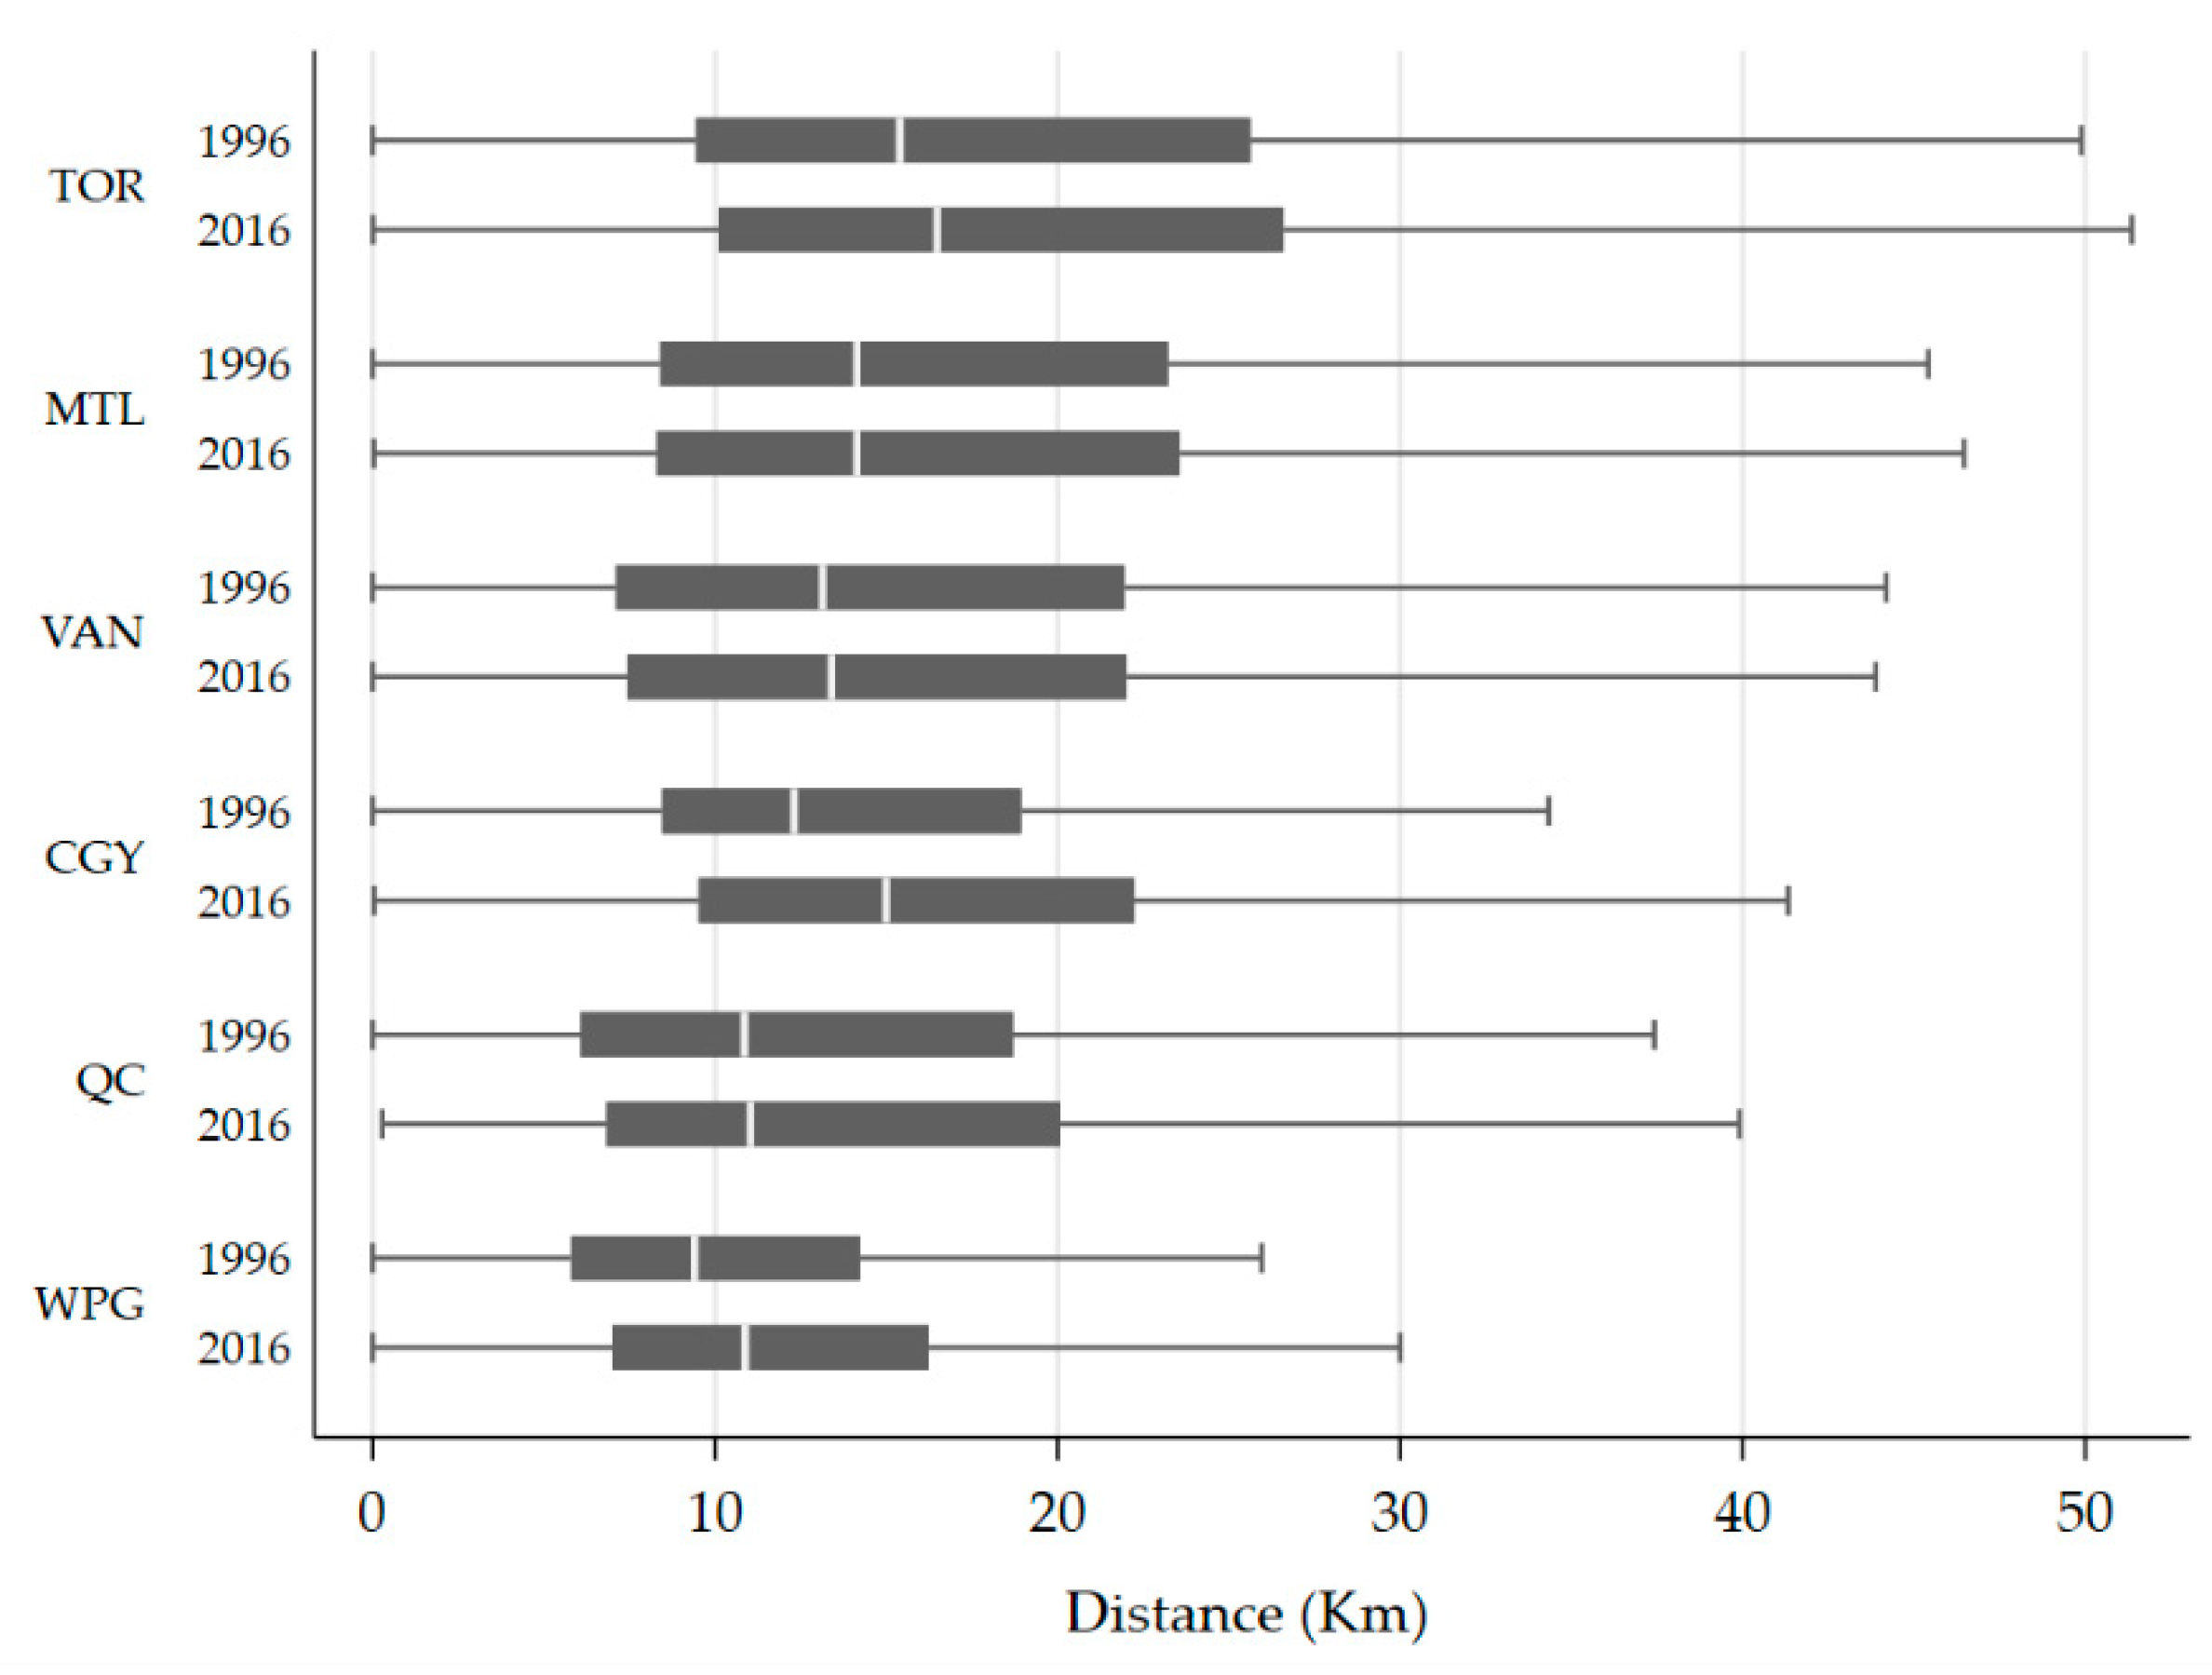
4.4.1. Toward the CBDs and Subcentres

This section analyzes the evolution of travel distances for CBDs and subcentres. An initial observation is the heterogeneity of commuting dynamics within and across CBDs. Given their dominant position and attractiveness within the metropolitan realm, these areas offer a particular case. On the one hand, workers living away from and even beyond the limits of the CMAs may daily commute to the CBD. On the other hand, several other workers live in inner-city areas and gentrified neighbourhoods, near to the CBD. Recently, numerous condominium projects were developed inside CBD and downtown areas. According to Figure 11, between 1996 and 2016, average distances decreased toward the CBDs of Montreal, Vancouver, and Toronto, although this decrease is only significant for Montreal at the 0.1 confidence level (Table 5). Yet, when compared to other types of subcentres where a significant increase in travel distances is observed, this stagnation stands out as a possible manifestation of the back-to-the-city movement limiting the growth of commuting distances in these areas [83]. In the cases of Winnipeg and Calgary, average distances significantly increased between 1996 and 2016 by more than two kilometres (Figure 11; Table 5), which can be explained by (sub)urban sprawl and, unlike other CMAs, a lack of a back-to-the-city movement.
In contrast to CBDs, subcentres show the longest travel distances. Although this is not the case for the Quebec City CMA, the largest subcentres are on average located further away from the residential location of their workforce than that of the CBD (Figure 12). Journey-to-work distances also significantly increased in these locations between 1996 and 2016 (Table 5), with the notable exception of Burnaby Central (Vancouver). In this case, residential densification appears to be a possible factor of the significant decline in average distances observed. For other subcentres, longer commuting distances can possibly be explained by the fact that many are located in outlying industrial districts (St-Bonif-Transcona, 440-73-740) or near an airport (North-East-Airport and Mississauga-Airport), where urban density is low and where long distances need to be travelled. Yet, this increase is not significant in all cases (Table 5), with Montreal’s St-Laurent subcentre distance remaining stable over the period.
Looking at distances of subcentres in each CMA, which include the largest subcentres but exclude CBDs, Downtown areas, and Inner city subcentres, we observe that distances travelled to Montreal and Vancouver subcentres are still larger than distances travelled to their CBDs (Figure 13). Compared with CBDs, more than two kilometres must be travelled to reach those subcentres, while no CMA has longer commuting distances than CBDs. Note, however, that for all CMAs, distances to subcentres increased between 1996 and 2016 (the case of the CMA is not statistically significant).

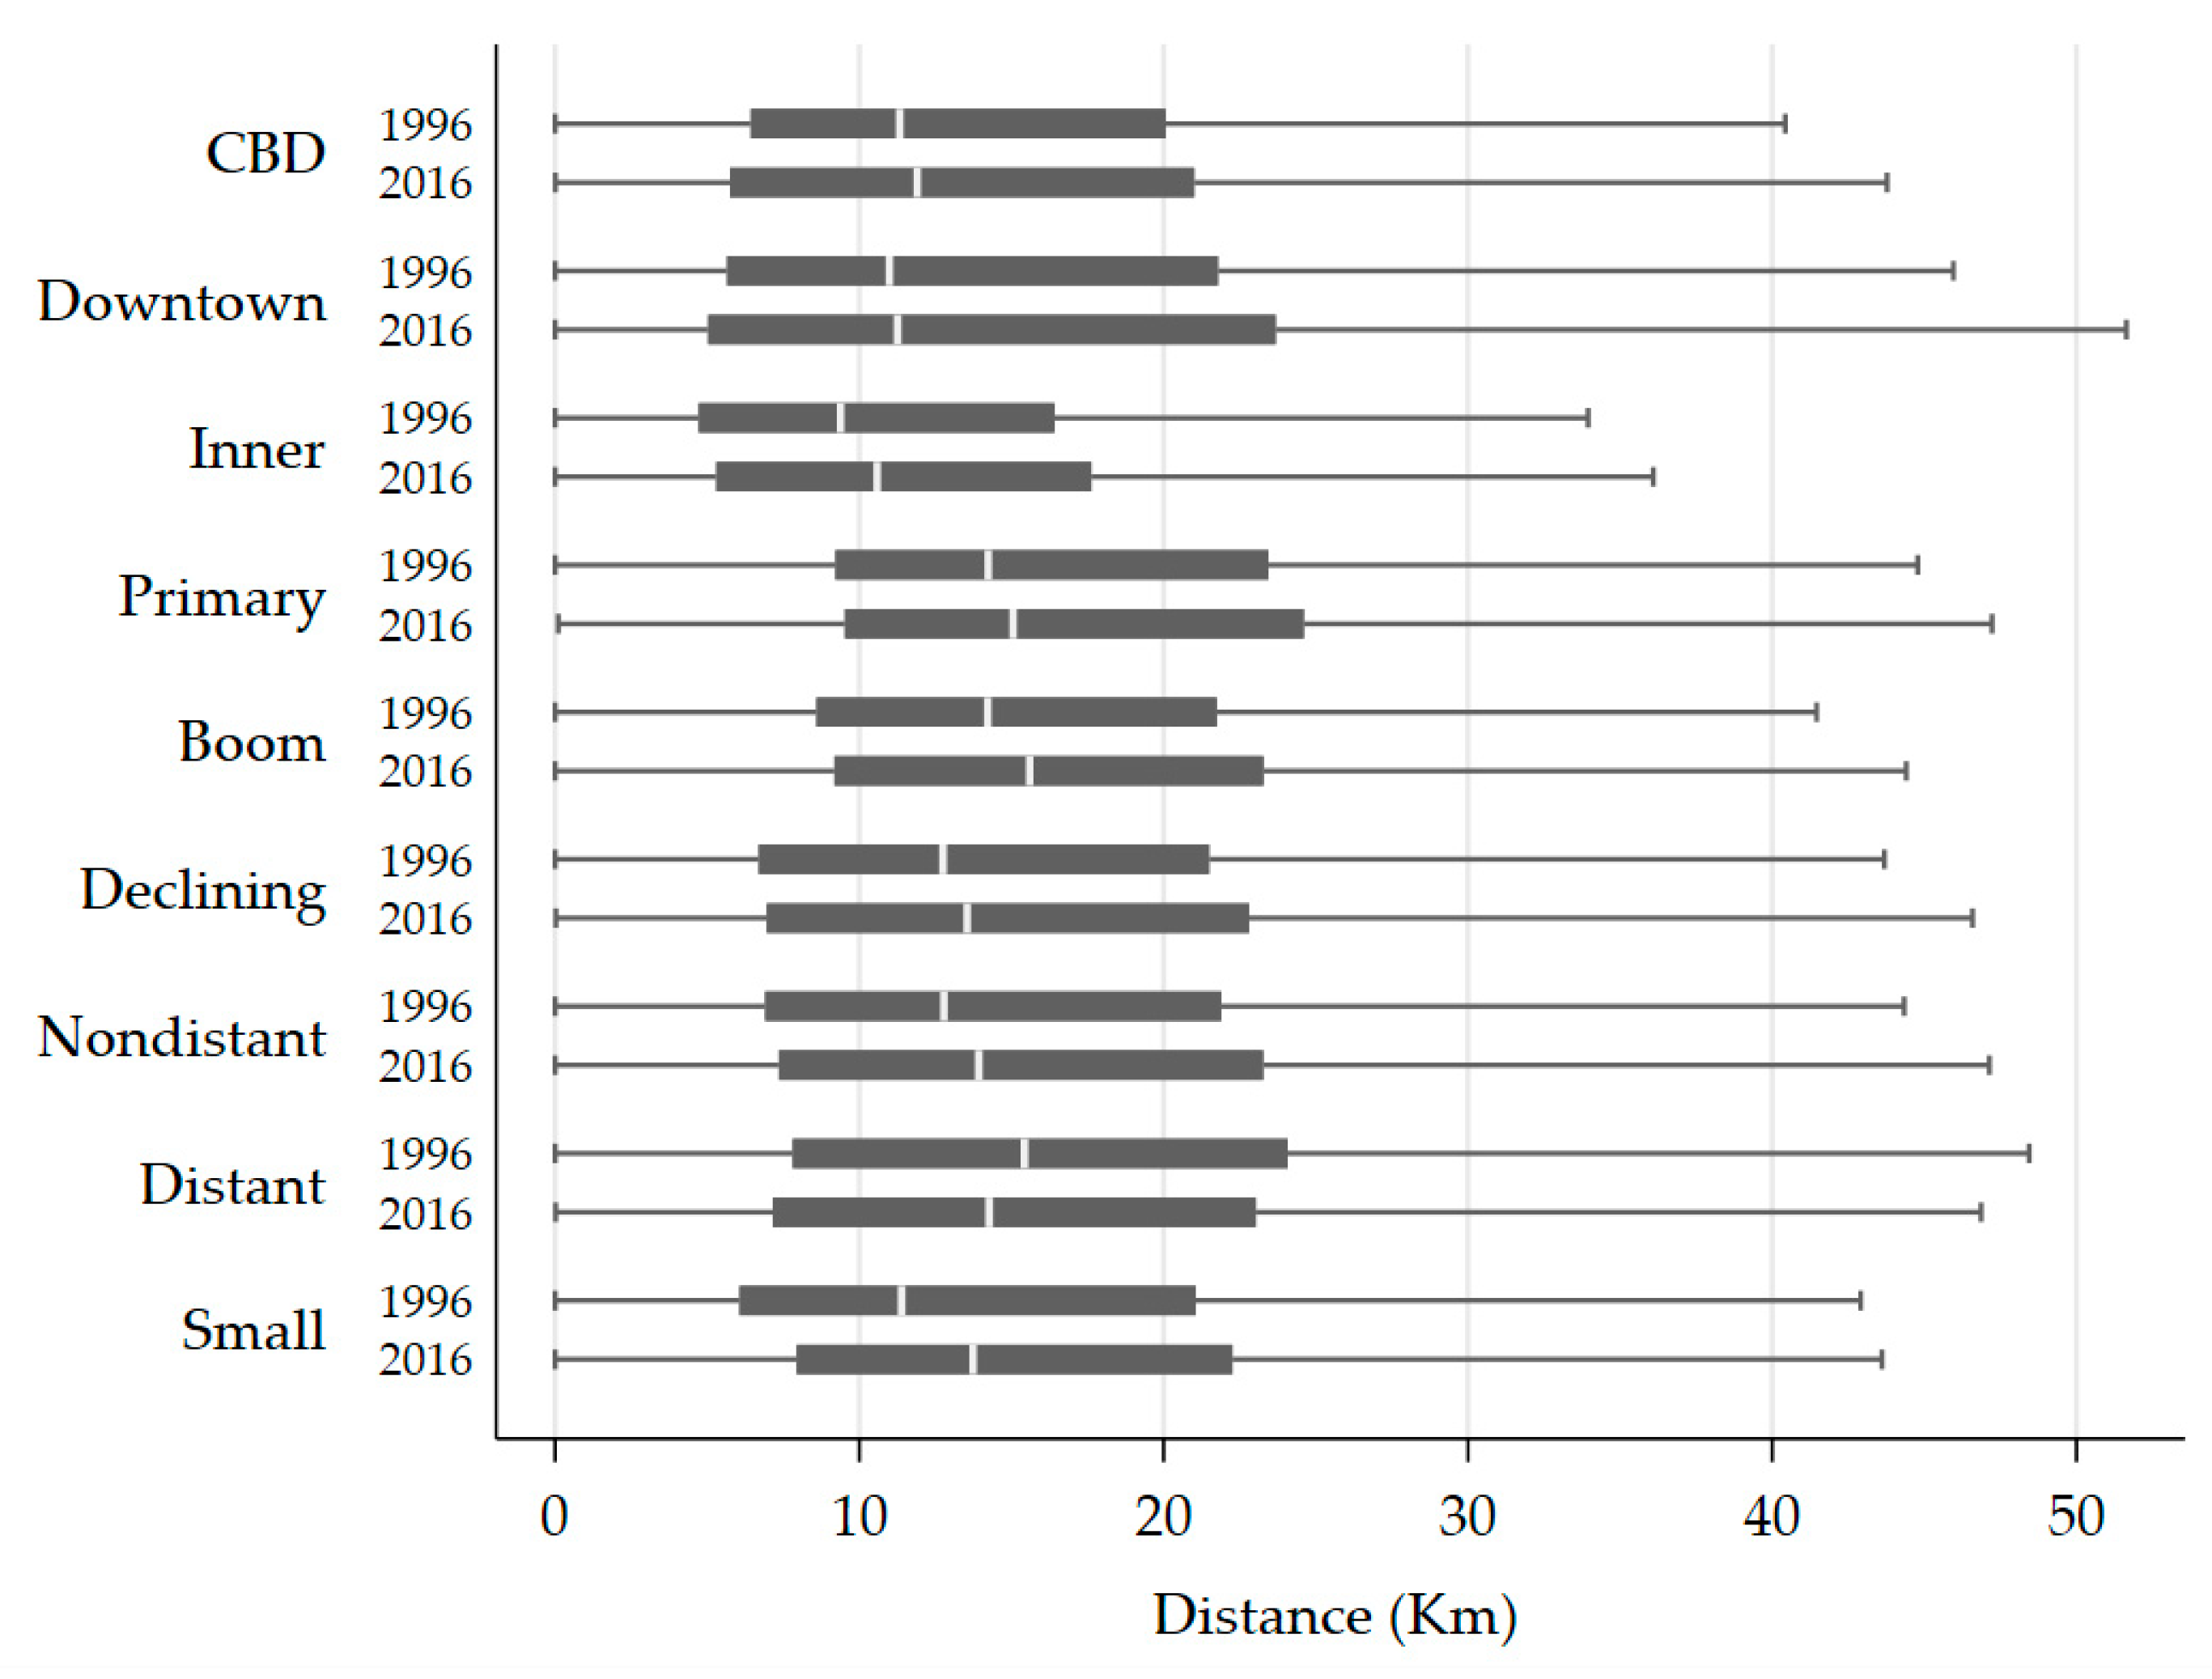
4.4.2. Distance Travelled by Types of Subcentres

Figure 14 shows the average distances travelled by subcentre types. We see that the longest commuting distances are found in peripheral subcentres, particularly in Boom centres (“Boom” in the figure) and Primary subcentres and Airports (“Primary”). Despite a significant decrease over the period (Table 6), commuting distances to Distant subcentres with low density (“Distant”) remain high, while this significant decrease is only found in Vancouver (Table 7). Finally, it should be noted that the overall increase in commuting distances between 1996 and 2016 for CBDs is explained by the significant increase in distances in the Calgary and Winnipeg CMAs. In fact, in the other CMAs, commuting distances stagnated or decreased (Figure 11; Table 5).

5. Discussion and Conclusions

In this study, we investigated the extent to which the recent phase of the rise of peripheral employment promoted more sustainable travel behaviour. We also analyzed the types of subcentres recently evolving toward more sustainable travel modes and commuting distances. Our point of departure was that recent developments within metropolitan areas—new planning practices (e.g., TOD), the development of peripheral transport infrastructure, or changing travel behaviour—tend to provide a rationale for the hypothesis that polycentricity may lean toward more sustainable commuting flows through co-location and a better job-housing balance. By the same token, we expected to find sustainable travel dynamics within emerging subcentres because of better planning practices. We confronted this hypothesis with the opposite view that subcentres rather generally promote motorized travel modes and longer commuting distances. Empirically, our analysis relied on a general typology of employment centres, using Census microdata on fine spatial scale over the 1996–2016 period to observe commuting modes and distances by subcentre types.
In answer to our general question, we found that despite recent developments in planning practices, transport infrastructure and changing travel behaviour, the argument that justifies the physical proximity of subcentres and residential places [2,11,40,41,42] (except for the distant subcentres with low density) does not seem to hold true, at least for Canadian cities. On the contrary, the rise of subcentres does not promote more sustainable mobility of workers to their workplace and seems to attract a workforce that resides in rather remote neighbourhoods and cities. This suggests that a growing proportion of individuals living in municipalities and villages outside the metropolitan region (exurban areas) [84] work in these subcentres.
Our results have shown that it is in the CBD that commuting distances have stagnated or decreased in Toronto, Quebec City, Montreal, and Vancouver. Population growth in central neighbourhoods and the rise of condominiums in the downtown areas of Toronto, Montreal and Vancouver [83,85] seem to play a positive role in limiting the growth of commuting distances. Instead of moving to a larger house in the suburbs, these workers choose to reside close to their place of employment. There is indeed growing evidence that bicycle trips by residents of gentrified neighbourhoods have increased significantly over the past decade [86]. Similarly, our study reveals that it is no longer the CBD that encourages the longest distances—as is often mentioned in the literature [11,14]—but rather in the largest subcentres and Boom centres (Figure 12 and Figure 14). This reveals important new trends that have been the subject of a limited number of previous studies.
Results also confirmed the significant gap between subcentres and downtown areas. Indeed, while the number of cars heading for city centres has drastically decreased (in relative and absolute terms), subcentres have continued to attract large numbers of motorists, particularly in Boom centres (Figure 9 and Figure 10). This may be explained by a lack of public transport infrastructure in these areas. In fact, Vancouver is the only CMA that has seen an increase in the share of transit in its subcentres. It is also the only CMA to have implemented heavy transit infrastructure between 1996 and 2016, which provides important insights for future urban development policies and research.
Finally, this study reminds us that Canadian cities are becoming increasingly polycentric. Indeed, despite the fact that CBDs and downtown cores of major Canadian cities remain strong, with the number of jobs continuing to increase in absolute terms, but decreasing in relative terms, job growth is particularly noticeable in the subcentres, especially in the Calgary and Vancouver metropolitan areas. It is interesting to note that the strengthening of polycentrism can occur at the same time as an expansion in sustainable travel behaviour: the example of the Vancouver CMA shows that the city is increasingly polycentric, but that its subcentres are becoming more sustainable in terms of travel distances and modes. Polycentric city planning can be undertaken in conjunction with the development of public transport. For example, in Amsterdam, the national ABC policy of the 1990s aimed to plan the establishment of employment centres essentially accessible by public transport and was ultimately “[…] intended to promote the installation of ‘good [economic activity] at a good place’ […]” [87]. However, the ABC policy ultimately failed to reach its goal, since most of the new jobs were located outside employment centres, in areas mainly accessible by automobile [88]. Could free access to the car ultimately be the key to the prosperity of a job centre? This study has shown that large cities and their suburbs must jointly consider the importance of planning the city on a metropolitan scale and of integrating sustainable transport into it.
For future studies, it is worth noting that this study is part of a pre-COVID-19 context and that the share of teleworking was rather minimal in large Canadian cities [89]. Whether the impact of the pandemic will have long-term repercussions on employment centres remains an open question. This study has some other limitations, which may open future research avenues. To best correspond to the notion of commuting between home and work, this study relied on the commuting of full-time workers to the place of employment. It therefore does not consider trips associated with shopping or studying, or even trips made by part-time workers. One should remember that daily displacements are not mathematically linear. Indeed, triangular movements, between the place of employment, other places (e.g., daycare, school, grocery store, store, etc.), and the place of residence are often carried out in many households [90]. Although these trips are more difficult to measure at the metropolitan level, at least from census data, they represent an important aspect of mobility behaviour, which could benefit future studies. In conclusion, our results suggest that public transit infrastructure investments may play a significant role in making subcentres more sustainable, as is the case in Vancouver. Future research could evaluate the degree to which this improvement results from the infrastructure itself or from simultaneous factors, such as the arrival of a class of workers (young, educated and childless) who are generally less inclined to use the automobile for commuting.

Author Contributions

Conceptualization, B.D. and C.B.; methodology, B.D. and C.B.; software, B.D.; validation, C.B.; formal analysis, B.D. and C.B.; investigation, B.D.; resources, C.B.; data curation, B.D.; writing—original draft preparation, B.D.; writing—review and editing, C.B.; visualization, B.D.; supervision, C.B.; project administration, C.B..; funding acquisition, C.B. All authors have read and agreed to the published version of the manuscript.

Funding

This research was funded in part by the Fonds de recherche du Quebec—Société et culture (FRQSC).

Acknowledgments

The analysis presented in this paper was conducted at the Quebec Interuniversity Centre for Social Statistics, which is part of the Canadian Research Data Centre Network (CRDCN). The services and activities provided by the QICSS are made possible by the financial or in-kind support of the Social Sciences and Humanities Research Council (SSHRC), the Canadian Institutes of Health Research (CIHR), the Canada Foundation for Innovation (CFI), Statistics Canada, the Fonds de recherche du Quebec—Société et culture (FRQSC), the Fonds de recherche du Québec—Santé (FRQS) and the Quebec universities. The views expressed in this paper are those of the authors, and not necessarily those of the CRDCN or its partners.

Conflicts of Interest

The authors declare no conflict of interest.

References

  1. Sims, R.; Schaeffer, R.; Creutzig, F.; Cruz-Núñez, X.; D’Agosto, M.; Dimitriu, D.; Figueroa Meza, M.J.; Fulton, L.; Kobayashi, S.; Lah, O.; et al. Transport. In Climate Change 2014: Mitigation of Climate Change. Contribution of Working Group III to the Fifth Assessment Report of the Intergovern-mental Panel on Climate Change; Edenhofer, O., Pichs-Madruga, R., Sokona, Y., Farahani, E., Kadner, S., Seyboth, K., Adler, A., Baum, I., Brunner, S., Eickemeier, P., et al., Eds.; Cambridge University Press: Cambridge, UK; New York, NY, USA, 2014. [Google Scholar]
  2. García-Palomares, J.C. Urban sprawl and travel to work: The case of the metropolitan area of Madrid. J. Transp. Geogr. 2010, 18, 197–213. [Google Scholar] [CrossRef]
  3. Manaugh, K.; Miranda-Moreno, L.; El-Geneidy, A. The effect of neighbourhood characteristics, accessibility, home-work location, and demographics on commuting distances. Transportation 2010, 37, 627–646. [Google Scholar] [CrossRef]
  4. Abulibdeh, A.; Zaidan, E.; Abuelgasim, A. Urban Form and Travel Behavior as Tools to Assess Sustainable Transportation in the Greater Toronto Area. J. Urban Plan. Dev. 2015, 141, 05014020. [Google Scholar] [CrossRef]
  5. Kamruzzaman, M.; Shatu, F.M.; Hine, J.; Turrell, G. Commuting mode choice in transit oriented development: Disentangling the effects of competitive neighbourhoods, travel attitudes, and self-selection. Transp. Policy 2015, 42, 187–196. [Google Scholar] [CrossRef] [Green Version]
  6. Hu, L.; Schneider, R. Different ways to get to the same workplace: How does workplace location relate to commuting by different income groups? Transp. Policy 2017, 59, 106–115. [Google Scholar] [CrossRef]
  7. Handy, S.; Cao, X.; Mokhtarian, P. Correlation or causality between the built environment and travel behavior? Evidence from Northern California. Transp. Res. Part D Transp. Environ. 2005, 10, 427–444. [Google Scholar] [CrossRef] [Green Version]
  8. Handy, S.; Cao, X.; Mokhtarian, P. Self-Selection in the Relationship between the Built Environment and Walking: Empirical Evidence from Northern California. J. Am. Plan. Assoc. 2006, 72, 55–74. [Google Scholar] [CrossRef]
  9. Schwanen, T.; Mokhtarian, P. What affects commute mode choice: Neighborhood physical structure or preferences toward neighborhoods ? J. Transp. Geogr. 2005, 13, 83–99. [Google Scholar] [CrossRef] [Green Version]
  10. Cao, X.; Mokhtarian, P.; Handy, S. Examining the Impacts of Residential Self-Selection on Travel Behaviour: A Focus on Empirical Findings. Transp. Rev. 2009, 29, 359–395. [Google Scholar] [CrossRef]
  11. Sénécal, G.; Haf, R.; Hamel, P.J.; Poitras, C.; Vachon, N. La forme de l’agglomération montréalaise et la réduction du gaz à effet de serre: La polycentricité est-elle durable? Rev. Can. Sci. Régionales 2002, 25, 135–152. [Google Scholar]
  12. Shearmur, R. Travel from Home: An Economic Geography of Commuting Distances in Montreal. Urban Geogr. 2006, 27, 330–359. [Google Scholar] [CrossRef]
  13. Barbonne, R.; Shearmur, R.; Coffey, W. Les nouvelles dynamiques intra-métropolitaines de l’emploi favorisent-elles des migrations pendulaires plus «durables» ? le cas de la région métropolitaine de Montréal, 1998–2003. Géographie Économie Société 2008, 10, 103–120. [Google Scholar] [CrossRef] [Green Version]
  14. Thomas-Maret, I.; Lewis, P.; Laforest, A.; Métivier, D.L. Localisation des activités métropolitaines: Quels impacts sur le navettage à Montréal? Environ. Urbain Urban Environ. 2011, 5, 38–51. [Google Scholar]
  15. Arbour, S.; Monrency, É. Les espaces économiques industriels spécialisés: Les patrons de mobilité des travailleurs et l’accessibilité en transport en commun. VertigO 2012, 11. [Google Scholar] [CrossRef]
  16. Aguiléra, A.; Mignot, D. Urban Sprawl, Polycentrism and Commuting. A Comparison of Seven French Urban Areas. Urban Public Econ. Rev. 2004, 1, 93–113. [Google Scholar]
  17. Helminen, V.; Rita, H.; Ristimäki, M.; Kontio, P. Commuting to the Centre in Different Urban Structures. Environ. Plan. B Plan. Des. 2012, 39, 247–261. [Google Scholar] [CrossRef]
  18. Hartshorn, T.A.; Muller, P. Suburban Downtowns and the Transformation of Metropolitan Atlanta’s Business Landscape. Urban Geogr. 1989, 10, 375–395. [Google Scholar] [CrossRef]
  19. Cervero, R. America’s Suburban Centers: The Land Use-Transportation Link; Routledge: London, UK, 1989. [Google Scholar]
  20. Garreau, J. Edge City: Life on the New Frontier; Anchor: New York, NY, USA, 1991; p. 576. [Google Scholar]
  21. Coffey, W.; Drolet, R. Le Secteur Tertiaire et les Sièges Sociaux dans la Région Métropolitaine de Montréal; Étude Préparée pour le Bureau Fédéral de Développement Régional (Québec), Ed.; INRS-Urbanisation: Montréal, QC, Canada, 1994. [Google Scholar]
  22. Stanback, T.M. The New Suburbanization: Challenge to the Central City; Westview Press: Boulder, CO, USA, 1991. [Google Scholar]
  23. Agyemang, F.S.K.; Silva, E.; Poku-Boansi, M. Understanding the urban spatial structure of Sub-Saharan African cities using the case of urban development patterns of a Ghanaian city-region. Habitat Int. 2019, 85, 21–33. [Google Scholar] [CrossRef]
  24. Muñiz, I.; Garcia-López, M.À.; Galindo, A. The Effect of Employment Sub-centres on Population Density in Barcelona. Urban Stud. 2008, 45, 627–649. [Google Scholar] [CrossRef]
  25. Berroir, S.; Mathian, H.; Sanders, L.; Saint-Julien, T. Les pôles de l’activité métropolitaine. In La Métropole Parisienne: Centralités, Inégalités, Proximités; Saint-Julien, T., Le Goix, R., Eds.; Belin: Paris, France, 2007; pp. 11–38. [Google Scholar]
  26. Yudhistira, M.H.; Indriyani, W.; Pratama, A.P.; Sofiyandi, Y.; Kurniawan, Y.R. Transportation network and changes in urban structure: Evidence from the Jakarta Metropolitan Area. Res. Transp. Econ. 2019, 74, 52–63. [Google Scholar] [CrossRef]
  27. Fernández-Maldonado, A.M.; Romein, A.; Verkoren, O.; Parente Paula Pessoa, R. Polycentric Structures in Latin American Metropolitan Areas: Identifying Employment Sub-centres. Reg. Stud. 2014, 48, 1954–1971. [Google Scholar] [CrossRef]
  28. Sweet, M.; Bullivant, B.; Kanaroglou, P. Are major canadian city-regions monocentric, polycentric, or dispersed? Urban Geogr. 2017, 38, 445–471. [Google Scholar] [CrossRef]
  29. McIntosh, J.; Trubka, R.; Kenworthy, J.; Newman, P. The role of urban form and transit in city car dependence: Analysis of 26 global cities from 1960 to 2000. Transp. Res. Part D Transp. Environ. 2014, 33, 95–110. [Google Scholar] [CrossRef]
  30. Arribas-Bel, D.; Sanz-Gracia, F. The validity of the monocentric city model in a polycentric age: US metropolitan areas in 1990, 2000 and 2010. Urban Geogr. 2014, 35, 980–997. [Google Scholar] [CrossRef] [Green Version]
  31. Duvivier, C.; Polèse, M. The great urban techno shift: Are central neighbourhoods the next silicon valleys? Evidence from three Canadian metropolitan areas. Pap. Reg. Sci. 2018, 97, 1083–1111. [Google Scholar] [CrossRef]
  32. Duquet, B. Le centre-ville de Montréal est-il en perte de vitesse? Analyse de la localisation des services supérieurs 1996–2011. Can. Geogr. Le Géographe Can. 2018, 62, 505–521. [Google Scholar] [CrossRef]
  33. Ghorra-Gobin, C. De la ville à l’urban sprawl: La question métropolitaine aux États-Unis. Cercles 2005, 13, 123–138. [Google Scholar]
  34. Terral, L.; Shearmur, R. Vers une nouvelle forme urbaine ? Desserrement et diffusion de l’emploi dans la région métropolitaine de Montréal. L’Espace Géographique 2008, 37, 16–31. [Google Scholar] [CrossRef]
  35. Poulin, P.-O.; Shearmur, R. Quartiers durables et pôles d’emploi: Vers des navettes plus courtes et moins polluantes? Une analyse de Montréal, 1998–2008. Cah. Géographie Québec 2014, 58, 59–91. [Google Scholar] [CrossRef] [Green Version]
  36. Salon, D. Neighborhoods, cars, and commuting in New York City: A discrete choice approach. Transp. Res. Part A Policy Pract. 2009, 43, 180–196. [Google Scholar] [CrossRef] [Green Version]
  37. Weber, J. Individual accessibility and distance from major employment centers: An examination using space-time measures. J. Geogr. Syst. 2003, 5, 51–70. [Google Scholar] [CrossRef]
  38. Yang, J. Commuting Impacts of Spatial Decentralization: A Comparison of Atlanta and Boston. J. Reg. Anal. Policy 2005, 35, 69–78. [Google Scholar]
  39. Cervero, R.; Wu, K.-L. Sub-centring and Commuting: Evidence from the San Francisco Bay Area, 1980–1990. Urban Stud. 1998, 35, 1059–1076. [Google Scholar] [CrossRef]
  40. Gordon, P.; Richardson, H.W. Beyond Polycentricity: The Dispersed Metropolis, Los Angeles, 1970–1990. J. Am. Plan. Assoc. 1996, 62, 289–295. [Google Scholar] [CrossRef]
  41. Levinson, D. Accessibility and the journey to work. J. Transp. Geogr. 1998, 6, 11–21. [Google Scholar] [CrossRef] [Green Version]
  42. Schwanen, T.; Dieleman, F.; Dijst, M. Travel behaviour in Dutch monocentric and policentric urban systems. J. Transp. Geogr. 2001, 9, 173–186. [Google Scholar] [CrossRef]
  43. Cervero, R. Jobs-Housing Balancing and Regional Mobility. J. Am. Plan. Assoc. 1989, 55, 136–150. [Google Scholar] [CrossRef]
  44. Gordon, P.; Kumar, A.; Richardson, H. The Influence of Metropolitan Spatial Structure on Commuting Time. J. Urban Econ. 1989, 26, 138–151. [Google Scholar] [CrossRef]
  45. Gordon, P.; Richardson, H.W.; Jun, M. The Commuting Paradox Evidence from the Top Twenty. J. Am. Plan. Assoc. 1991, 57, 416–420. [Google Scholar] [CrossRef]
  46. Kim, C.; Choi, C. Towards Sustainable Urban Spatial Structure: Does Decentralization Reduce Commuting Times? Sustainability 2019, 11, 1012. [Google Scholar] [CrossRef] [Green Version]
  47. Katz, P.; Scully, V.J.; Bressi, T.W. The New Urbanism: Toward an Architecture of Community; McGraw-Hill: New York, NY, USA, 1994. [Google Scholar]
  48. Calthorpe, P. The Next American Metropolis: Ecology, Community, and the American Dream; Princeton Architectural Press: New York, NY, USA, 1993. [Google Scholar]
  49. Roy-Baillargeon, O. Le TOD contre la ville durable? Utiliser le transport collectif pour perpétuer le suburbanisme dispersé dans le Grand Montréal. Environ. Urbain Urban Environ. 2017, 12, 1–24. [Google Scholar] [CrossRef]
  50. Ewing, R. Is Los Angeles-Style Sprawl Desirable? J. Am. Plan. Assoc. 1997, 63, 107–126. [Google Scholar] [CrossRef]
  51. Schwanen, T.; Dieleman, F.; Dijst, M. The Impact of Metropolitan Structure on Commute Behavior in the Netherlands: A Multilevel Approach. Growth Chang. 2004, 35, 304–333. [Google Scholar] [CrossRef]
  52. Næss, P. Urban form and travel behavior. Experience from a Nordic context. J. Transp. Land Use 2012, 5, 21–45. [Google Scholar] [CrossRef]
  53. Shearmur, R.; Coffey, W.; Dube, C.; Barbonne, R. Intrametropolitan Employment Structure: Polycentricity, Scatteration, Dispersal and Chaos in Toronto, Montreal and Vancouver, 1996–2001. Urban Stud. 2007, 44, 1713–1738. [Google Scholar] [CrossRef]
  54. Ban, J.; Arnott, R.; Macdonald, J. Identifying Employment Subcenters: The Method of Exponentially Declining Cutoffs. Land 2017, 6, 17. [Google Scholar] [CrossRef] [Green Version]
  55. Jun, M.-J. The effects of polycentric evolution on commute times in a polycentric compact city: A case of the Seoul Metropolitan Area. Cities 2020, 98, 102587. [Google Scholar] [CrossRef]
  56. Krehl, A.; Siedentop, S. Towards a typology of urban centers and subcenters-evidence from German city regions. Urban Geogr. 2019, 40, 58–82. [Google Scholar] [CrossRef] [Green Version]
  57. McMillen, D.P.; McDonald, J.F. Suburban Subcenters and Employment Density in Metropolitan Chicago. J. Urban Econ. 1998, 43, 157–180. [Google Scholar] [CrossRef] [Green Version]
  58. Giuliano, G.; Small, K. Subcenters in the Los Angeles Region. Reg. Sci. Urban Econ. 1991, 21, 163–182. [Google Scholar] [CrossRef] [Green Version]
  59. Sultana, S.; Weber, J. The Nature of Urban Growth and the Commuting Transition: Endless Sprawl or a Growth Wave? Urban Stud. 2014, 51, 544–576. [Google Scholar] [CrossRef]
  60. McDonald, J.F.; Prather, P.J. Suburban Employment Centres: The Case of Chicago. Urban Stud. 1994, 31, 201–218. [Google Scholar] [CrossRef]
  61. Craig, S.G.; Ng, P.T. Using Quantile Smoothing Splines to Identify Employment Subcenters in a Multicentric urban Area. J. Urban Econ. 2001, 49, 100–120. [Google Scholar] [CrossRef] [Green Version]
  62. Murphy, R.E.; Vance, J.E. Delimiting the CBD. Econ. Geogr. 1954, 30, 189–222. [Google Scholar] [CrossRef]
  63. Hartshorn, T.A. Interpreting the City: An Urban Geography, 2nd ed.; J. Wiley: New York, NY, USA, 1991. [Google Scholar]
  64. Hartley, D.; Kaza, N.; Lester, W. Are America’s Inner Cities Competitive? Evidence From the 2000s. Econ. Dev. Q. 2016, 30, 137–158. [Google Scholar] [CrossRef]
  65. Porter, M. New Strategies for Inner-City Economic Development. Econ. Dev. Q. 1997, 11, 11–27. [Google Scholar] [CrossRef]
  66. McMillen, D.P.; Smith, S.C. The number of subcenters in large urban areas. J. Urban Econ. 2003, 53, 321–338. [Google Scholar] [CrossRef]
  67. Leslie, T. Identification and Differentiation of Urban Centers in Phoenix Through a Multi-Criteria Kernel-Density Approach. Int. Reg. Sci. Rev. 2010, 33, 205–235. [Google Scholar] [CrossRef]
  68. Shearmur, R.; Coffey, W. A tale of four cities: Intrametropolitan employment distribution in Toronto, Montreal, Vancouver, and Ottawa-Hull, 1981–1996. Environ. Plan. A 2002, 34, 575–598. [Google Scholar] [CrossRef]
  69. Appold, S. The Impact of Airports on US Urban Employment Distribution. Environ. Plan. A Econ. Space 2015, 47, 412–429. [Google Scholar] [CrossRef]
  70. Lang, R.; Knox, P. The New Metropolis: Rethinking Megalopolis. Reg. Stud. 2009, 43, 789–802. [Google Scholar] [CrossRef]
  71. Coffey, W.; Shearmur, R. Agglomeration and Dispersion of High-order Service Employment in the Montreal Metropolitan Region, 1981–1996. Urban Stud. 2002, 39, 359–378. [Google Scholar] [CrossRef]
  72. Statistics Canada. Population des Régions Métropolitaines de Recensement. Government of Canada. Available online: http://www.statcan.gc.ca/tables-tableaux/sum-som/l02/cst01/demo05a-fra.htm (accessed on 10 May 2017).
  73. McMillen, D.P.; Lester, T.W. Evolving subcenters: Employment and population densities in Chicago, 1970–2020. J. Hous. Econ. 2003, 12, 60–81. [Google Scholar] [CrossRef]
  74. McMillen, D.P. Nonparametric employment subcenter identification. J. Urban Econ. 2001, 50, 448–473. [Google Scholar] [CrossRef]
  75. Redfearn, C. The Topography of Metropolitan Employment: Identifying Centers of Employment in a Polycentric Urban Area. J. Urban Econ. 2007, 61, 519–541. [Google Scholar] [CrossRef]
  76. Pfister, N.; Freestone, R.; Murphy, P. Polycentricity or dispersion?: Changes in center employment in metropolitan Sydney, 1981 to 1996. Urban Geogr. 2000, 21, 428–442. [Google Scholar] [CrossRef]
  77. Bogart, W.T.; Ferry, W.C. Employment Centres in Greater Cleveland: Evidence of Evolution in a Formerly Monocentric City. Urban Stud. 1999, 36, 2099–2110. [Google Scholar] [CrossRef]
  78. Fujii, T.; Hartshorn, T.A. The Changing Metropolitan Structure of Atlanta, Georgia: Locations of Functions and Regional Structure in a Multinucleated Urban Area. Urban Geogr. 1995, 16, 680–707. [Google Scholar] [CrossRef]
  79. Muñiz, I.; Garcia-López, M.-À. The Polycentric Knowledge Economy in Barcelona. Urban Geogr. 2010, 31, 774–799. [Google Scholar] [CrossRef]
  80. Heinen, E.; Maat, K.; Wee, B.v. The role of attitudes toward characteristics of bicycle commuting on the choice to cycle to work over various distances. Transp. Res. Part D Transp. Environ. 2011, 16, 102–109. [Google Scholar] [CrossRef]
  81. Piatkowski, D.; Krizek, K.; Handy, S. Accounting for the short term substitution effects of walking and cycling in sustainable transportation. Travel Behav. Soc. 2015, 2, 32–41. [Google Scholar] [CrossRef] [Green Version]
  82. Charron, M.; Shearmur, R. Distances, interactions et analyse spatiale de la ville: Le cas de Montréal. Revue d’Économie Régionale Urbaine 2005, 163–192. [Google Scholar] [CrossRef]
  83. Naud, D.; Apparicio, P.; Shearmur, R. Cogentrification sociale et économique: A colocalisation de la main-d’oeuvre et des emplois de services aux entreprises à Montréal, 1996–2001. Cah. Géographie Québec 2009, 53, 197. [Google Scholar] [CrossRef] [Green Version]
  84. Axisa, J.; Scott, D.; Newbold, B. Factors influencing commute distance: A case study of Toronto’s commuter shed. J. Transp. Geogr. 2012, 24, 123–129. [Google Scholar] [CrossRef]
  85. Filion, P.; Bunting, T.; Pavlic, D.; Langlois, P. Intensification and Sprawl: Residential Density Trajectories in Canada’s Largest Metropolitan Regions. Urban Geogr. 2010, 31, 541–569. [Google Scholar] [CrossRef]
  86. Bereitschaft, B. Gentrification and the evolution of commuting behavior within America’s urban cores, 2000–2015. J. Transp. Geogr. 2020, 82, 102559. [Google Scholar] [CrossRef]
  87. Pomonti, V. Politiques urbaines et mobilité durable: Analyse comparée d’Athènes et Amsterdam. Ecol. Polit. 2004, 29, 53. [Google Scholar] [CrossRef]
  88. Schwanen, T.; Dijst, M.; Dieleman, F.M. Policies for Urban Form and their Impact on Travel: The Netherlands Experience. Urban Stud. 2004, 41, 579–603. [Google Scholar] [CrossRef] [Green Version]
  89. Statistics Canada. Canadian Survey on Business Conditions: Impact of COVID-19 on Businesses in Canada, May 2020; The Daily: Ottawa, Canada, 2020.
  90. Merlin, P. La demande de transport: Analyse de la mobilité. In Les Transports à Paris et en Ile-de-France; Merlin, P., Ed.; La Documentation Française: Paris, France, 1982; pp. 41–130. [Google Scholar]
Figure 1. Polycentric metropolitan area framework.
Sustainability 12 09966 g001
Figure 2. Share of jobs according to the type of zone in each CMA.
Sustainability 12 09966 g002
Figure 3. Map of Toronto urban form between 1996 and 2016.
Sustainability 12 09966 g003
Figure 4. Map of Montreal urban form between 1996 and 2016.
Sustainability 12 09966 g004
Figure 5. Map of Vancouver urban form between 1996 and 2016.
Sustainability 12 09966 g005
Figure 6. Map of Calgary urban form between 1996 and 2016.
Sustainability 12 09966 g006
Figure 7. Map of Quebec City urban form between 1996 and 2016.
Sustainability 12 09966 g007
Figure 8. Map of Winnipeg urban form between 1996 and 2016.
Sustainability 12 09966 g008
Figure 9. Percentage of car use by types of subcentres for the largest three CMAs (Toronto, Montreal and Vancouver).
Sustainability 12 09966 g009
Figure 10. Percentage of car use by types of subcentres for medium-to-high size CMA (Calgary, Quebec City and Winnipeg).
Sustainability 12 09966 g010
Figure 11. Distribution of weighted distances between residential locations and CBD (in kilometres).
Sustainability 12 09966 g011
Figure 12. Distribution of weighted distances between residential location and the largest subcentre (in kilometres).
Sustainability 12 09966 g012
Figure 13. Distribution of weighted distances between residential location and subcentres (in kilometres).
Sustainability 12 09966 g013
Figure 14. Distribution of weighted distances between residential location and types of subcentres (in kilometres).
Sustainability 12 09966 g014
Table 1. Population and jobs characteristics of Canadian census metropolitan areas (CMAs) 1996–2016 1.
CMAPopulationJobs
19962016%∆ 1996–201619962016%∆ 1996–2016
Toronto, ON4,263,7575,928,04039.0%1,714,0102,241,58030.8%
Montreal, QC3,349,7424,098,92722.4%1,252,9201,503,33520.0%
Vancouver, BC1,831,6652,463,43134.5%646,125839,37529.9%
Calgary, AB822,2211,392,60969.4%319,620524,84564.2%
Quebec City, QC679,036800,29617.9%248,790320,07028.7%
Winnipeg, MA672,109778,48915.8%246,250288,50017.2%
1 Source: Statistics Canada. 2017. Focus on Geography Series, 2016 Census. Statistics Canada Catalogue no. 98-404-X2016001. Ottawa, Ontario. Data products, 2016 Census.
Table 2. Subcentres typology
#Type of SubcentresAttributes for Toronto, Montreal, and VancouverAttributes for Calgary, Quebec City, and WinnipegPredominant Variable(s)
Downtown1CBD areaIdentified as CBDIdentified as CBDDistance from the CBD
2Downtown area (without CBD)Vicinity of the CBDVicinity of the CBDDistance from the CBD
Subcentres3Inner city subcentresSubcentres near to the CBD (between 3.4 km to 6.3 km 1) within a medium-to-high residential and job densitySubcentres near to the CBD (between 1.9 km to 6.3 km 2)Distance from the CBD and Residential density
4Primary subcentres and AirportsAirport area and large growing subcentres (between 26 k and 241 k jobs) with medium-to-high job densityAirport area and large growing subcentres (between 20 k and 82 k jobs)Number of jobs
5Small subcentres-Less large growing subcentres (above 12 k jobs)Number of jobs
6Non-distant subcentres with medium-to-high densityLess large growing subcentres (8 k to 19 k jobs) not so far from the CBD (8.9 km to 23 km)-Job and Residential density, and Distance from the CBD
7Distant subcentres with low densityFar subcentres (more than 18 km), within low residential and jobs density-Distance from the CBD and Job density
8Boom centresSubcentres that have doubled their number of jobs between 1996 and 2016Subcentres that have doubled their number of jobs between 1996 and 2016Employment growth
9Declining subcentresSubcentres that have lost jobsSubcentres that have lost jobsEmployment growth
1 3.4 km for the MileEnd subcentre (Montreal) and 6.3 km for the Renfrew subcentre (Vancouver). 2 1.9 km for the Central St. Boniface subcentre (Winnipeg) and 6.3 km for the Mt Royal University subcentre (Calgary). CBD: central business district.
Table 3. Number of subcentres and small subcentres in CMAs.
19962016∆ 1996–2016
CMASubcentresSmall SubcentresTotalSubcentresSmall SubcentresTotal
Toronto910198917−2
Montreal8198816+7
Vancouver7121916723+4
Calgary4045510+6
Quebec City426527+1
Winnipeg257358+1
Table 4. Commuting trends in each type of zone.
Sustainability 12 09966 i001
Table 5. Weighted mean differences and t-tests between 1996 and 2016: commuting distances for CBD, subcentres, and largest subcentres by CMA.
CBDSubcentresLargest Subcentres
Δ 1996–2016p-ValueΔ 1996–2016p-ValueΔ 1996–2016p-Value
TOR0.798+0.000+0.000
MTL0.063+0.011+0.064
VAN0.494+0.3000.000
CGY+0.000+0.000+0.000
QC0.821+0.000+0.000
WPG+0.000+0.000+0.000
Note: +/− indicate increasing or decreasing mean distance.
Table 6. Weighted mean differences and t-tests between 1996 and 2016: commuting distances by subcentre types for all CMAs.
Subcentres TypeMean Differences and t-Tests
Δ 1996–2016p-Value
CBD+0.000
Downtown area+0.000
Inner city subcentres+0.000
Primary subcentres and Airports+0.000
Boom centres+0.000
Declining subcentres+0.000
Non-distant subcentres with medium-to-high density+0.000
Distant subcentres with low density0.000
Small subcentres+0.000
Note: +/− indicate increasing or decreasing mean distance.
Table 7. Weighted mean differences and t-tests between 1996 and 2016: commuting distances for inner and distant subcentres by CMAs.
Inner City SubcentresDistant Subcentres with Low Density
Δ 1996–2016p-ValueΔ 1996–2016p-Value
TOR0.629+0.122
MTL0.332+0.175
VAN+0.0000.000
CGY+0.000n/an/a
QC+0.000n/an/a
WPG+0.000n/an/a
Note: +/− indicate increasing or decreasing mean distance.
Publisher’s Note: MDPI stays neutral with regard to jurisdictional claims in published maps and institutional affiliations.

