Categorizing Quality Determinants in Mining User-Generated Contents


Abstract
1. Introduction
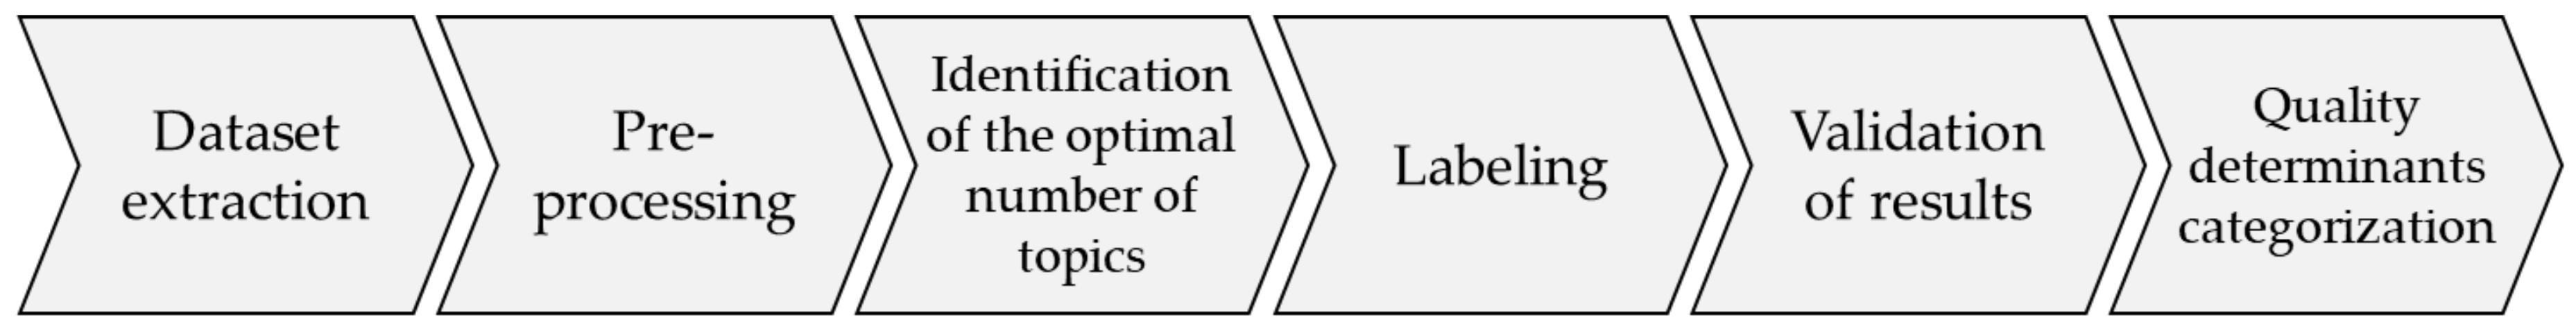
2. Methodology
2.1. Application Case Description
- one-way, when members are allowed to begin and end their trip at different locations, through free-floating zones or station-based models with designated parking locations;
- roundtrip, when members are required to begin and end their trip at the same location;
- peer-to-peer, when the vehicles are typically privately owned or leased with the sharing system operated by a third-party;
- fractional, allows the users to co-own a vehicle and share its costs and use.
2.2. Dataset Extraction
2.3. Pre-Processing
- the text was converted to lowercase in order to eliminate ambiguity with uppercase words;
- punctuation and numbers were removed since they were adding little topical content;
- English stop words (e.g., “the”, “and”, “when”, “is”, “at”, “which”, “on”, etc.) were removed;
- words shorter than 2 characters or longer than 15 were removed;
- words with an extremely low frequency (less than 15 occurrences in the whole text corpus) were excluded from the text corpus since their inclusion would confound results or would not be representative of any specific topics;
- the text was normalized using Porter stemmer (or ‘Porter stemming’) to reduce similar words to a unique term. Stemming removes the commoner morphological and inflectional endings from words in English [33]. For example, the words “likes”, “liked”, “likely” and “liking” were reduced to the stem “like”;
- words generally not related to topical content (such as: “another”, “mean”, “etc.”, “problem”, “review”, “made”) were removed;
- all the n-grams, i.e., contiguous sequences of n items from a given sequence of text were replaced by a single term. For example, the n-grams of “customer service” were replaced by the term “customerservice”.
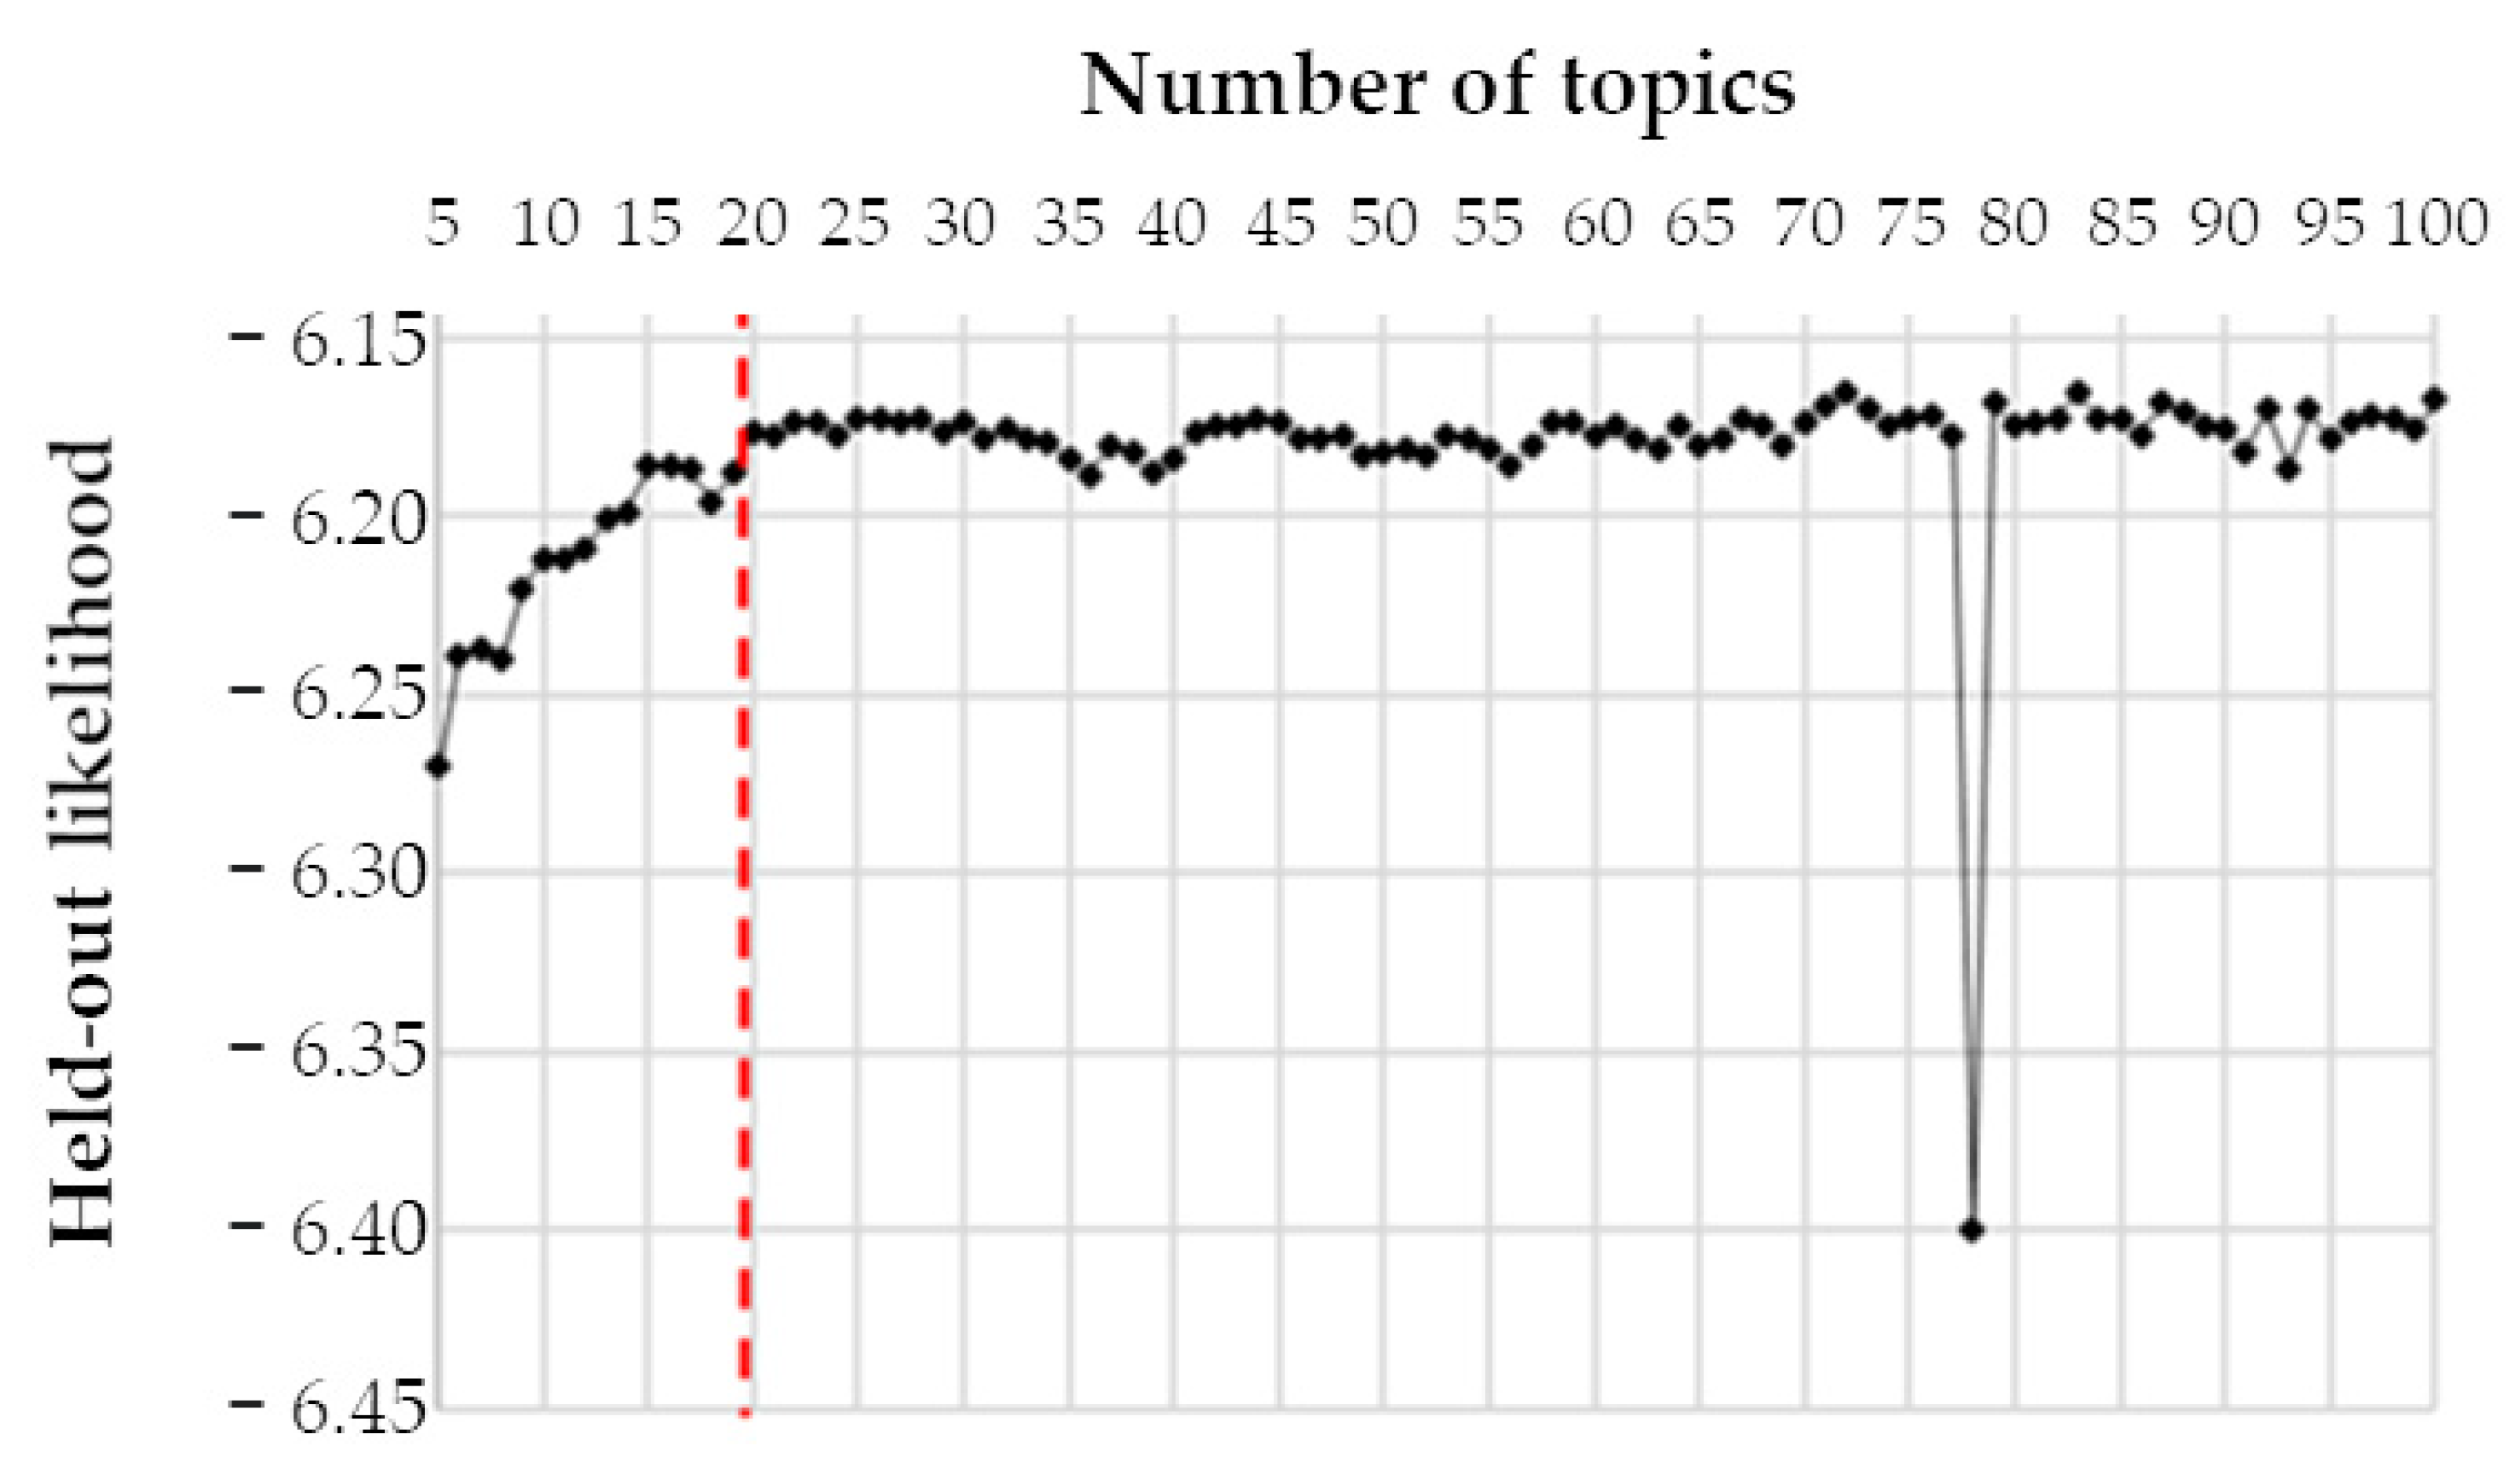
2.4. Identification of the Optimal Number of Topics
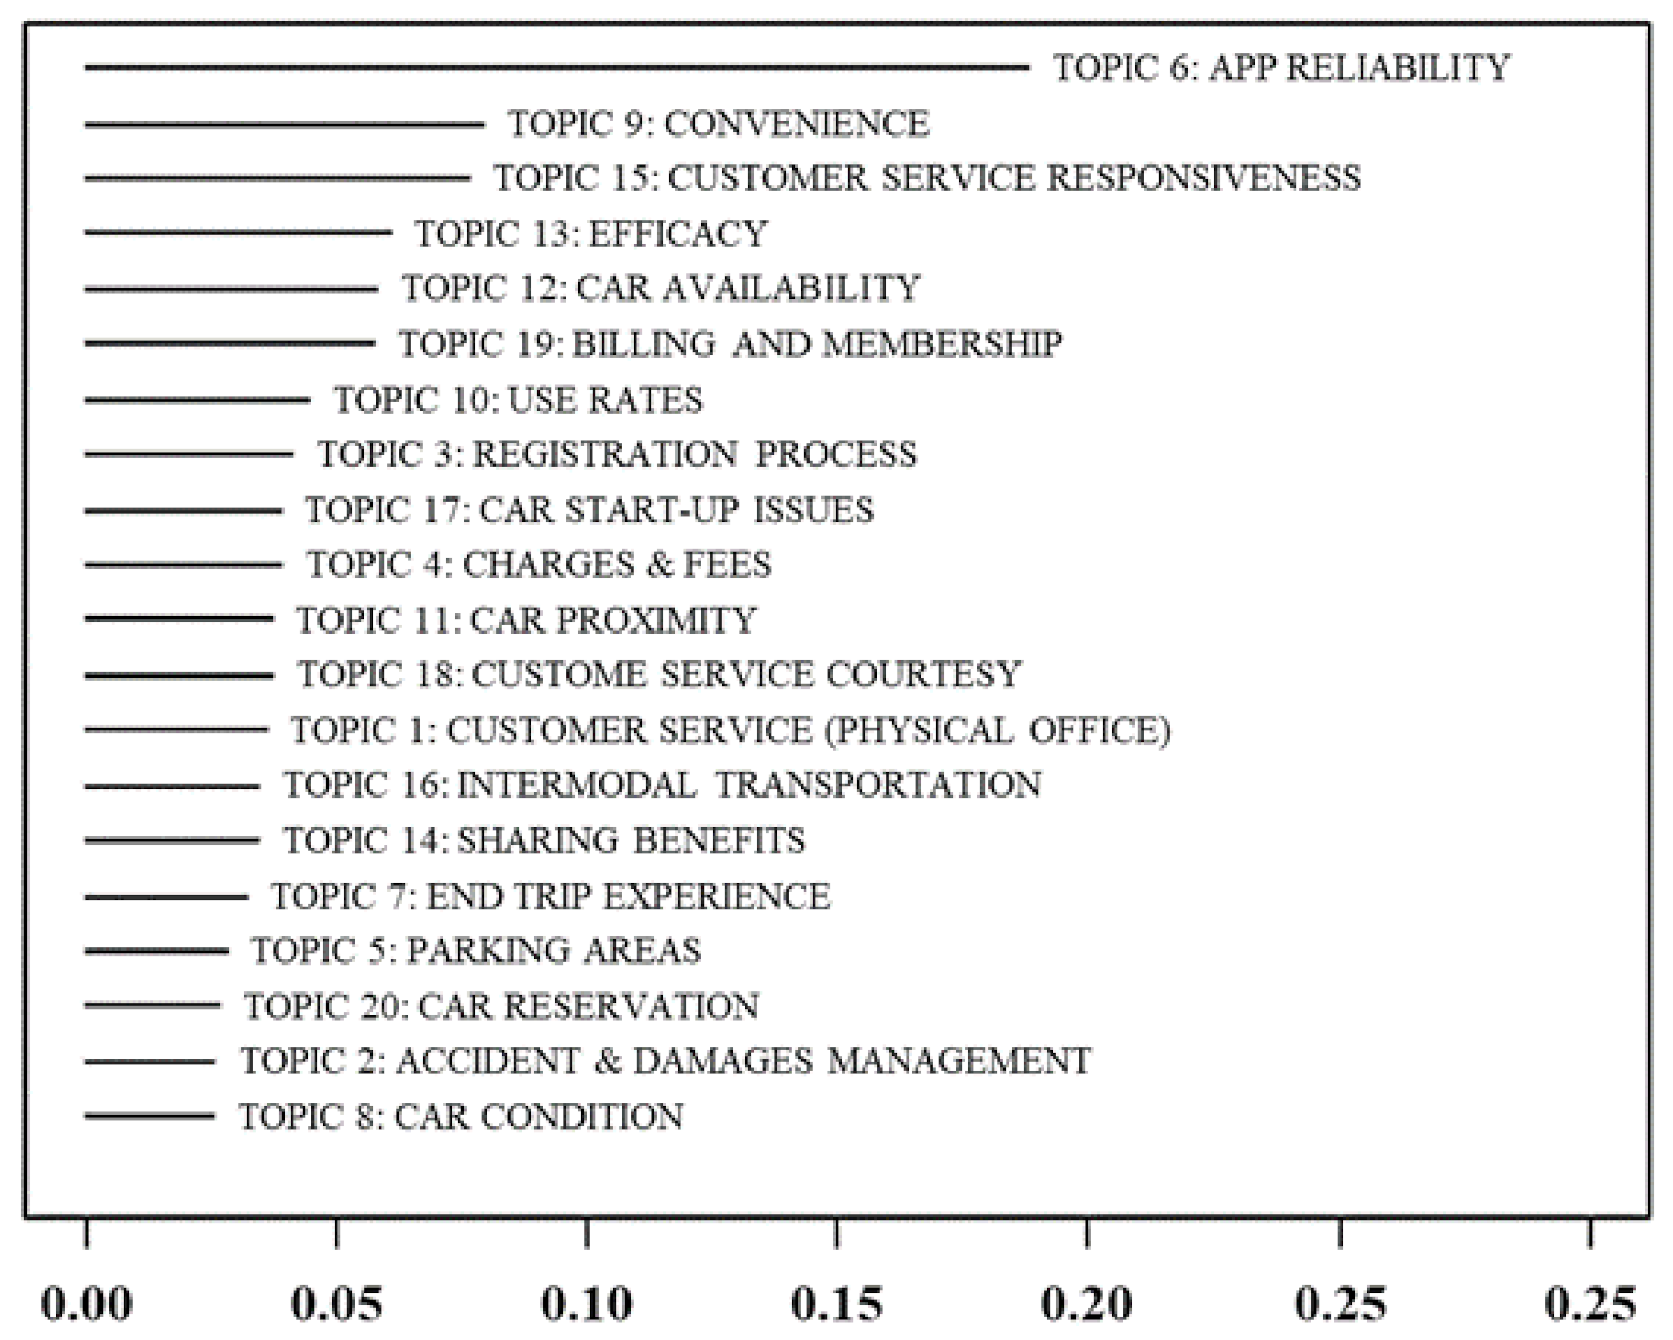
2.5. Labeling
2.6. Data Verification
- True positive (tp), i.e., agreement between authors and algorithm in the assignment of a review to a topic.
- True negative (tn), i.e., agreement between authors and algorithm not to assign a review to a topic.
- False positive (fp), i.e., misalignment between the assignment of the review to a topic by STM and the non-assignment by the authors (type I error).
- False negative (fn): i.e., misalignment between the assignment of the review to a topic by the authors and the non-assignment by STM (type II error).
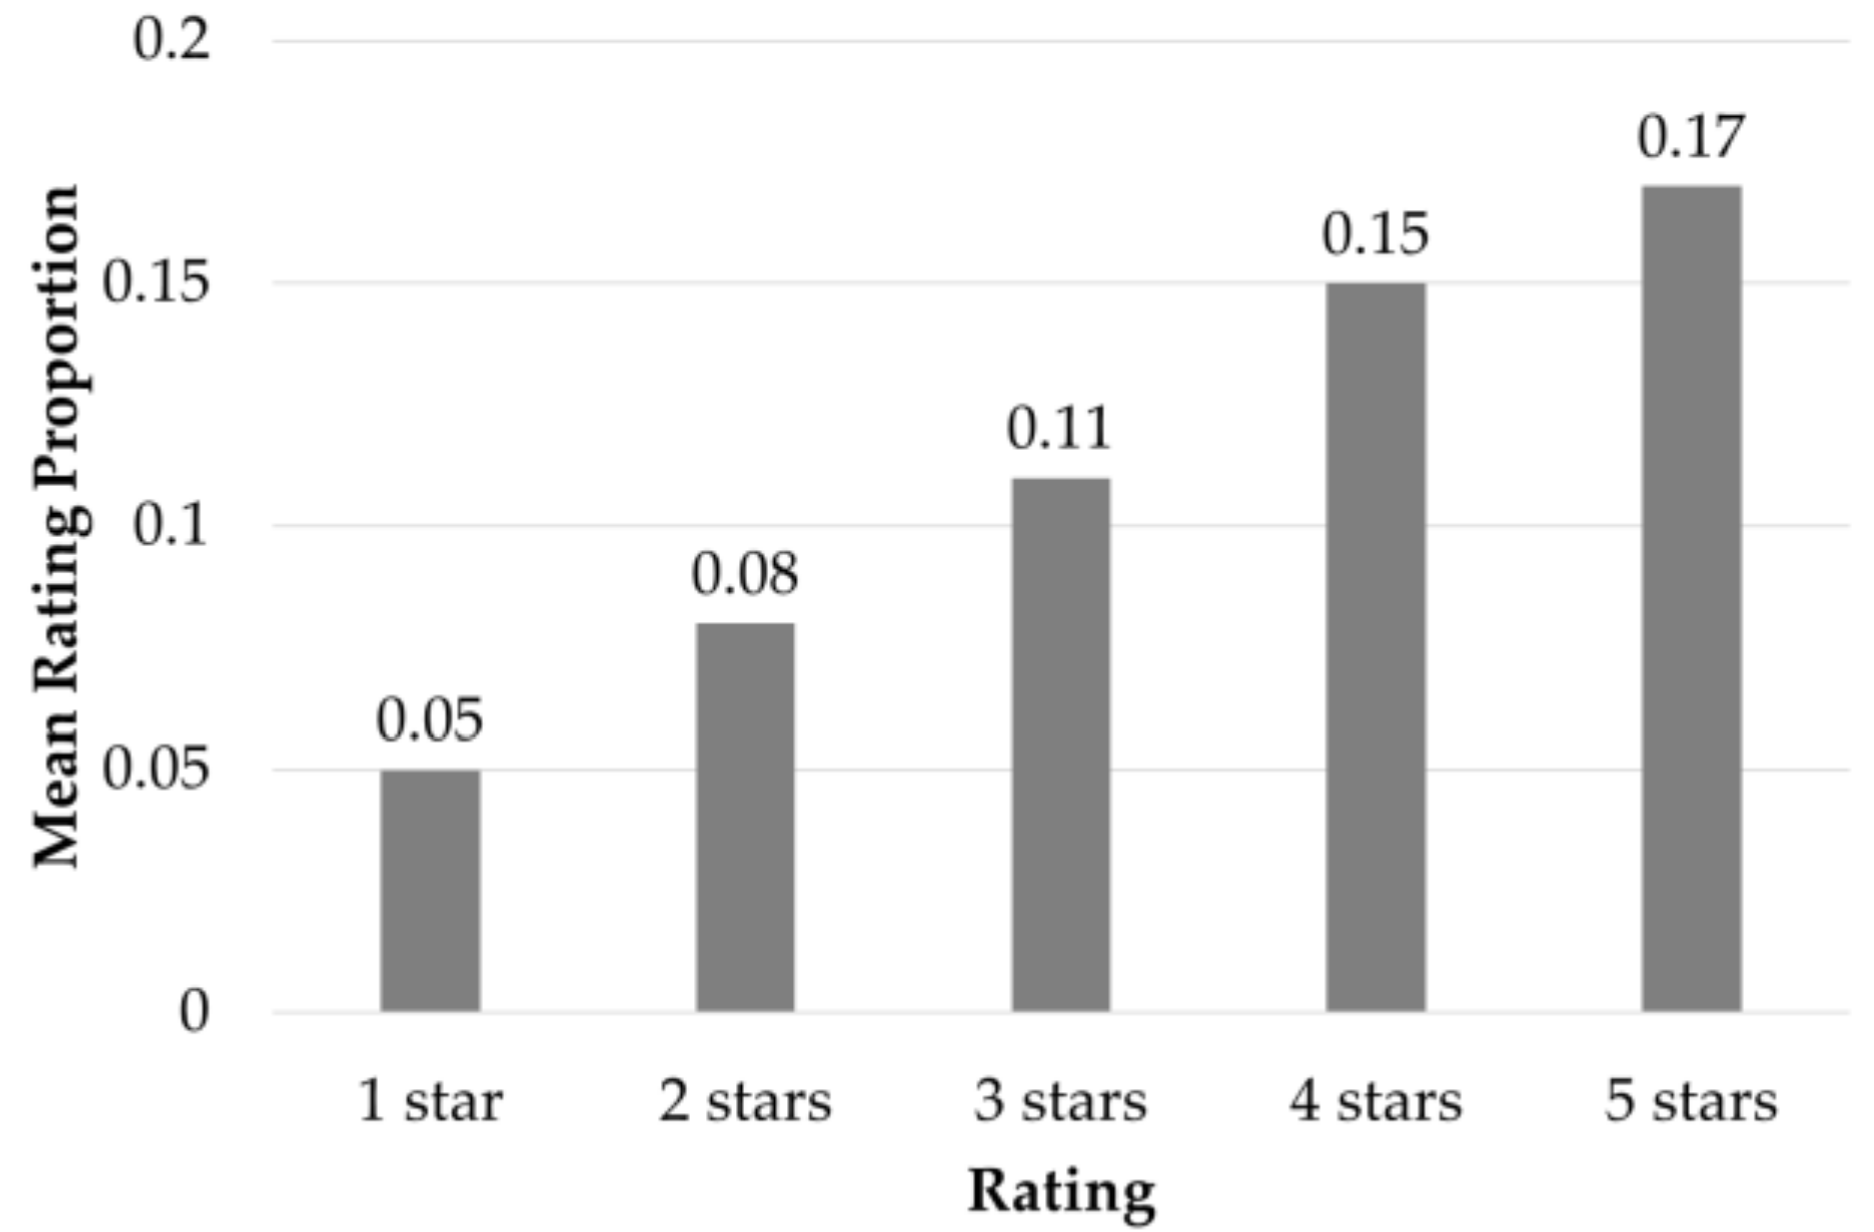
2.7. Categorization of the Quality Determinants
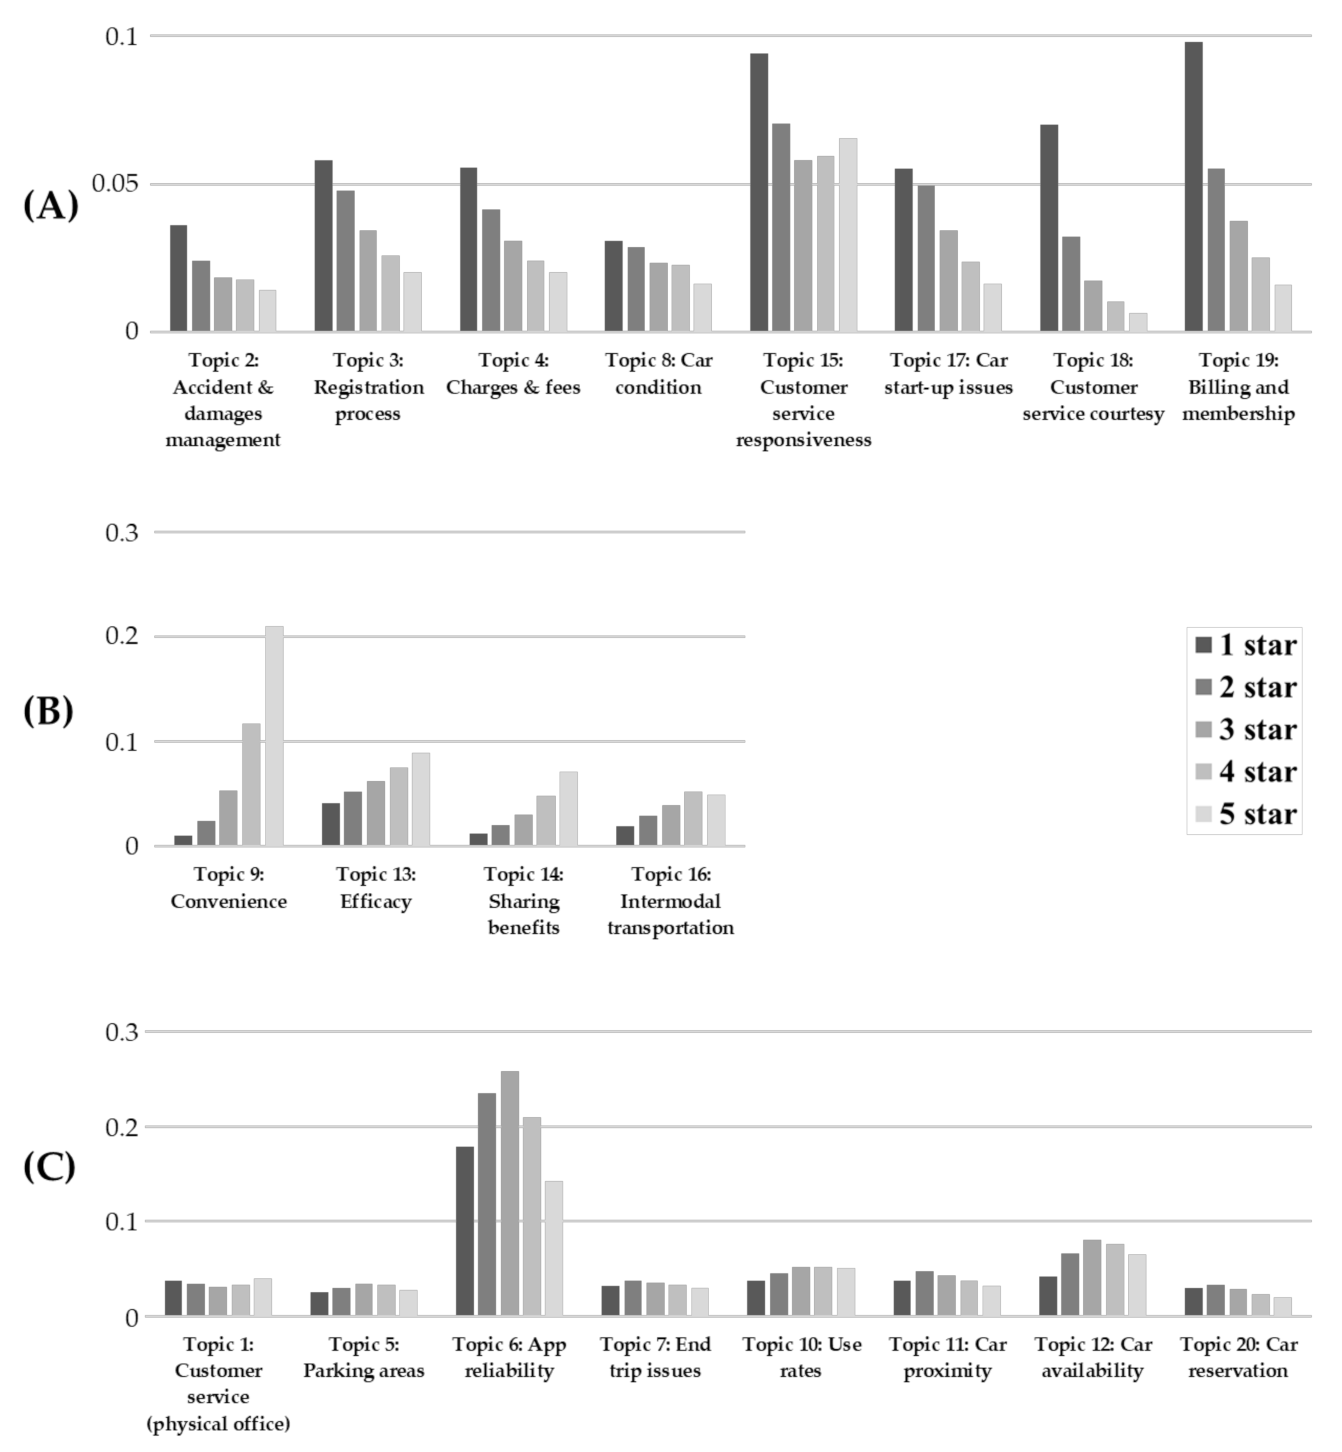
- Negative quality determinants, i.e., those determinants more discussed by reviews characterized by a negative rating (see Figure 5A). Accident and damages management, registration process, charges and fees, car condition, customer service responsiveness, car start-up issues, customer service courtesy, and billing and membership fall into this category.
- Positive quality determinants, i.e., those determinants which are more discussed by reviews with a positive rating (see Figure 5B). Convenience, efficacy, sharing benefits and intermodal transportation fall into this category.
- Neutral quality determinants, i.e., those determinants where the MRP does not appear to be affected by the review rating. Neutral quality determinants have a flat or (approximatively) symmetric profile centered on the intermediate rating (see Figure 5C). Customer service (physical office), parking areas, app reliability, end trip issues, use rates, car proximity, car availability and car reservation fall into this category.
3. Discussion and Implications
- Negative quality determinants represent those aspects that generate dissatisfaction in the user. When users discuss them, it is mainly in a negative connotation. It is essential to analyze the reasons behind dissatisfaction to implement strategies for improving quality or at least for mitigating the adverse effects.
- On the contrary, positive quality determinants can be seen as those elements that can generate greater satisfaction and delight. Consequently, positive quality determinants represent the key advantages of the object under analysis. These features need to be developed and enhanced in order to attract and better satisfy customers.
- Finally, the role of the neutral quality determinants should not be underestimated. At a first analysis, it might seem that these elements do not influence satisfaction and therefore are not critical in the value offering. However, these elements may be important for the quality perception of the object under analysis since discussed by users. The fact that these determinants may both generate satisfaction and dissatisfaction in the users determines a symmetric MRP distribution. Understanding the reasons is the winning key for their correct management and continuous improvement.
4. Conclusions
Author Contributions
Funding
Conflicts of Interest
References
- Zonnenshain, A.; Kenett, R.S. Quality 4.0—The challenging future of quality engineering. Qual. Eng. 2020, 32, 614–626. [Google Scholar] [CrossRef]
- Chiarini, A. Industry 4.0, quality management and TQM world. A systematic literature review and a proposed agenda for further research. TQM J. 2020, 32, 603–616. [Google Scholar] [CrossRef]
- Mastrogiacomo, L.; Barravecchia, F.; Franceschini, F.; Marimon, F. Mining quality determinants of Product-Service Systems from User-Generated Contents. Qual. Eng. 2020. (Under Review). [Google Scholar]
- Wang, L.; Youn, B.D.; Azarm, S.; Kannan, P.K. Customer-driven product design selection using web based user-generated content. In Proceedings of the International Design Engineering Technical Conferences and Computers and Information in Engineering Conference, Washington, DC, USA, 28–31 August 2011; Volume 54822, pp. 405–419. [Google Scholar]
- Chen, D.; Zhang, D.; Liu, A. Intelligent Kano classification of product features based on customer reviews. CIRP Ann. 2019, 68, 149–152. [Google Scholar] [CrossRef]
- Ireland, R.; Liu, A. Application of data analytics for product design: Sentiment analysis of online product reviews. CIRP J. Manuf. Sci. Technol. 2018, 23, 128–144. [Google Scholar] [CrossRef]
- Aggarwal, C.C.; Zhai, C. Mining Text Data; Springer: New York, NY, USA, 2012; ISBN 1461432235. [Google Scholar]
- Müller, O.; Junglas, I.; Brocke, J.V.; Debortoli, S. Utilizing big data analytics for information systems research: Challenges, promises and guidelines. Eur. J. Inf. Syst. 2016, 25, 289–302. [Google Scholar] [CrossRef]
- Blei, D.M.; Ng, A.Y.; Jordan, M.I. Latent dirichlet allocation. J. Mach. Learn. Res. 2003, 3, 993–1022. [Google Scholar]
- Goedkoop, M.J.; van Halen, C.J.G.; te Riele, H.R.M.; Rommens, P.J.M. Product Service Systems, Ecological and Economic Basics. 1999. Available online: https://www.researchgate.net/publication/293825611_Product_Service_systems_Ecological_and_Economic_Basics (accessed on 25 November 2020).
- Barravecchia, F.; Mastrogiacomo, L.; Franceschini, F. The Player-Interface method: An approach to support Product-Service Systems concept generation and prioritization. J. Eng. Des. 2020, 31, 331–348. [Google Scholar] [CrossRef]
- Neri, A.; Cagno, E.; Di Sebastiano, G.; Trianni, A. Industrial sustainability: Modelling drivers and mechanisms with barriers. J. Clean. Prod. 2018, 194, 452–472. [Google Scholar] [CrossRef]
- Dyllick, T.; Rost, Z. Towards true product sustainability. J. Clean. Prod. 2017, 162, 346–360. [Google Scholar] [CrossRef]
- Mastrogiacomo, L.; Barravecchia, F.; Franceschini, F. Enabling factors of manufacturing servitization: Empirical analysis and implications for strategic positioning. Proc. Inst. Mech. Eng. Part B J. Eng. Manuf. 2020, 234, 1258–1270. [Google Scholar] [CrossRef]
- Mastrogiacomo, L.; Barravecchia, F.; Franceschini, F. Definition of a conceptual scale of servitization: Proposal and preliminary results. CIRP J. Manuf. Sci. Technol. 2020, 29, 141–156. [Google Scholar] [CrossRef]
- Mastrogiacomo, L.; Barravecchia, F.; Franceschini, F. A worldwide survey on manufacturing servitization. Int. J. Adv. Manuf. Technol. 2019, 103, 3927–3942. [Google Scholar] [CrossRef]
- García-Sánchez, I.-M.; Aibar-Guzmán, B.; Aibar-Guzmán, C.; Rodríguez-Ariza, L. “Sell” recommendations by analysts in response to business communication strategies concerning the Sustainable Development Goals and the SDG compass. J. Clean. Prod. 2020, 255, 120194. [Google Scholar] [CrossRef]
- Calabrese, A.; Castaldi, C.; Forte, G.; Levialdi, N.G. Sustainability-oriented service innovation: An emerging research field. J. Clean. Prod. 2018, 193, 533–548. [Google Scholar] [CrossRef]
- Palacios-Argüello, L.; Gondran, N.; Nouira, I.; Girard, M.-A.; Gonzalez-Feliu, J. Which is the relationship between the product’s environmental criteria and the product demand? Evidence from the French food sector. J. Clean. Prod. 2020, 244, 118588. [Google Scholar] [CrossRef]
- Cronin, J.J., Jr.; Taylor, S.A. SERVPERF versus SERVQUAL: Reconciling performance-based and perceptions-minus-expectations measurement of service quality. J. Mark. 1994, 58, 125–131. [Google Scholar] [CrossRef]
- Parasuraman, A.; Zeithaml, V.A.; Berry, L.L. Servqual: A multiple-item scale for measuring consumer perceptions of service quality. J. Retail. 1988, 64, 12. [Google Scholar]
- Blei, D.M.; Lafferty, J.D. A correlated topic model of Science. Ann. Appl. Stat. 2007, 1, 17–35. [Google Scholar] [CrossRef]
- Roberts, M.E.; Stewart, B.M.; Tingley, D.; Lucas, C.; Leder-Luis, J.; Gadarian, S.K.; Albertson, B.; Rand, D.G. Structural Topic Models for Open-Ended Survey Responses. Am. J. Pol. Sci. 2014, 58, 1064–1082. [Google Scholar] [CrossRef]
- Roberts, M.E.; Stewart, B.M.; Tingley, D. stm: An R Package for Structural Topic Models. J. Stat. Softw. 2019, 91, 1–40. [Google Scholar] [CrossRef]
- Barravecchia, F.; Mastrogiacomo, L.; Franceschini, F. Identifying car-sharing quality determinants: A data-driven approach to improve engineering design. In Proceedings of the International Conference on Quality Engineering and Management, Braga, Portugal, 15–17 July 2020; pp. 125–140. [Google Scholar]
- Shaheen, S.A.; Cohen, A.P. Growth in worldwide carsharing: An international comparison. Transp. Res. Rec. 2007, 1992, 81–89. [Google Scholar] [CrossRef]
- Shaheen, S.A.; Cohen, A.P. Carsharing and Personal Vehicle Services: Worldwide Market Developments and Emerging Trends. Int. J. Sustain. Transp. 2013, 7, 5–34. [Google Scholar] [CrossRef]
- Frost & Sullivan. Future of Carsharing Market to 2025. 2016. Available online: https://www.researchandmarkets.com/reports/3976017/future-of-carsharing-market-to-2025 (accessed on 25 November 2020).
- Prescient & Strategic Intelligence. Carsharing Market by Car, by Fuel Type, by Business Model, by Application, by Geography Global Market Size, Share, Development, Growth, and Demand Forecast, 2014–2025. 2019. Available online: https://www.researchandmarkets.com/reports/4770554/carsharing-market-by-car-by-fuel-type-by (accessed on 25 November 2020).
- Boyacı, B.; Zografos, K.G.; Geroliminis, N. An optimization framework for the development of efficient one-way car-sharing systems. Eur. J. Oper. Res. 2015, 240, 718–733. [Google Scholar] [CrossRef]
- Feinerer, I.; Hornik, K.; Meyer, D. Text Mining Infrastructure inR. J. Stat. Softw. 2008, 25, 1–54. [Google Scholar] [CrossRef]
- Guo, Y.; Barnes, S.J.; Jia, Q. Mining meaning from online ratings and reviews: Tourist satisfaction analysis using latent dirichlet allocation. Tour. Manag. 2017, 59, 467–483. [Google Scholar] [CrossRef]
- Jivani, A.G. A comparative study of stemming algorithms. Int. J. Comput. Appl. Technol. 2011, 2, 1930–1938. [Google Scholar]
- Wallach, H.M.; Mimno, D.M.; McCallum, A. Rethinking LDA: Why priors matter. Adv. Neural Inf. Process. Syst. 2009, 23, 1973–1981. [Google Scholar]
- Scott, J.; Baldridge, J. A recursive estimate for the predictive likelihood in a topic model. J. Mach. Learn. Res. 2013, 31, 527–535. [Google Scholar]
- Blei, D.M. Probabilistic topic models. Commun. ACM 2012, 55, 77–84. [Google Scholar] [CrossRef]
- Costa, E.; Lorena, A.; Carvalho, A.; Freitas, A. A review of performance evaluation measures for hierarchical classifiers. In Proceedings of the Evaluation Methods for Machine Learning II: Papers from the AAAI-2007 Workshop, Vancouver, BC, Canada, 22–23 July 2007; pp. 1–6. [Google Scholar]
- Nassirtoussi, A.K.; Aghabozorgi, S.; Wah, T.Y.; Ngo, D.C.L. Text mining for market prediction: A systematic review. Expert Syst. Appl. 2014, 41, 7653–7670. [Google Scholar] [CrossRef]
- Zaki, M.; McColl-Kennedy, J.R. Text mining analysis roadmap (TMAR) for service research. J. Serv. Mark. 2020, 34, 30–47. [Google Scholar] [CrossRef]
- Chua, A.Y.K.; Banerjee, S. Understanding review helpfulness as a function of reviewer reputation, review rating, and review depth. J. Assoc. Inf. Sci. Technol. 2014, 66, 354–362. [Google Scholar] [CrossRef]
- Chevalier, J.A.; Mayzlin, D. The Effect of Word of Mouth on Sales: Online Book Reviews. J. Mark. Res. 2006, 43, 345–354. [Google Scholar] [CrossRef]


| Number of Topic | Keywords (Highest Probability) | Topic Label |
|---|---|---|
| 1 | help, phone, call, person, office, answer, number | Customer service (physical office) |
| 2 | damage, report, accident, fault, member, enterprise, claim | Accident and damages management |
| 3 | sign, process, website, license, drive, driver, registration | Registration process |
| 4 | charge, fee, late, return, time, pay, hour | Charges and fees |
| 5 | park, lot, spot, find, ticket, street, space | Parking areas |
| 6 | app, work, update, book, map, reserve, time | App reliability |
| 7 | trip, end, time, make, actual, take, system | End trip issues |
| 8 | gas, dirty, rent, clean, tank, card, tire | Car condition |
| 9 | need, convenient, quick, recommend, awesome, clean, perfect | Convenience |
| 10 | hour, price, rate, cost, expense, mile, cheaper | Use rates |
| 11 | minute, reservation, walk, wait, home, time, away | Car proximity |
| 12 | car, available, location, vehicle, area, change, time | Car availability |
| 13 | use, time, now, far, user, review, star | Efficacy |
| 14 | city, year, insurance, member, gas, need, month | Sharing benefits |
| 15 | service, custom, issue, company, terrible, problem, experience | Customer service responsiveness |
| 16 | way, drive, little, take, get, town, bus | Intermodal transportation |
| 17 | time, start, location, turn, lock, pick, key | Car start-up issues |
| 18 | call, member, cancel, ask, rep, refund, manage | Customer service courtesy |
| 19 | account, card, email, credit, month, day, membership, | Billing and membership |
| 20 | reservation, plan, time, need, book, cancel, advance | Car reservation |
| STM Topic Assignment | Manual Topic Assignment | True Positive | True Negative | False Positive | False Negative | |
|---|---|---|---|---|---|---|
| Review 1 | 20-11 | 20-4 | 1 | 17 | 1 | 1 |
| Review 2 | 7 | 7 | 1 | 19 | 0 | 0 |
| Review 3 | 5-8-7 | 5-8 | 2 | 17 | 1 | 0 |
| Review 4 | 14-16 | 11-14-16 | 2 | 17 | 0 | 1 |
| Indicator | Definition | Value |
|---|---|---|
| Accuracy | 0.94 | |
| Recall | 0.73 | |
| Precision | 0.65 |
Publisher’s Note: MDPI stays neutral with regard to jurisdictional claims in published maps and institutional affiliations. |
© 2020 by the authors. Licensee MDPI, Basel, Switzerland. This article is an open access article distributed under the terms and conditions of the Creative Commons Attribution (CC BY) license (http://creativecommons.org/licenses/by/4.0/).
Share and Cite
Barravecchia, F.; Mastrogiacomo, L.; Franceschini, F. Categorizing Quality Determinants in Mining User-Generated Contents. Sustainability 2020, 12, 9944. https://doi.org/10.3390/su12239944
Barravecchia F, Mastrogiacomo L, Franceschini F. Categorizing Quality Determinants in Mining User-Generated Contents. Sustainability. 2020; 12(23):9944. https://doi.org/10.3390/su12239944
Chicago/Turabian StyleBarravecchia, Federico, Luca Mastrogiacomo, and Fiorenzo Franceschini. 2020. "Categorizing Quality Determinants in Mining User-Generated Contents" Sustainability 12, no. 23: 9944. https://doi.org/10.3390/su12239944
APA StyleBarravecchia, F., Mastrogiacomo, L., & Franceschini, F. (2020). Categorizing Quality Determinants in Mining User-Generated Contents. Sustainability, 12(23), 9944. https://doi.org/10.3390/su12239944