1. Introduction
Science and society face unprecedented times as the social impact of science has evolved into a key point in the debates in all scientific disciplines, which face the challenge of measuring how new discoveries and scientific advancements ultimately benefit society [
1]. The current COVID-19 pandemic has made the need for science to address major health, economic, and social problems even more evident—problems that are especially affecting the most vulnerable sectors of population [
2]. Whereas this crisis presents a major challenge for science and society, it may also represent a new opportunity to create and enhance efficient and sustainable solutions, so as to improve people’s lives. Among the major scourges in modern-day society is air pollution, due to its impact on public and individual health which has reported an increase in morbidity and mortality [
3]. Indeed, many pollutants are major causes of disease in humans, but of even greater concern is that a recent systematic review has demonstrated that air pollution is not only detrimental to people’s physiological health, but also their psychological health [
4]. Beyond its widely studied physiological and environmental effects, Lu [
4] pointed out devastating psychological consequences (affective, cognitive, behavioral), and economic and social effects of air pollution. Tackling this issue would seem to be a pressing need in order to advance towards Sustainable Development Goals. Indeed, according to the WHO, efforts to combat air pollution will contribute to SDG 3: Good health and well-being, and to some of the targets under SDG 7: Affordable and clean energy; SDG 11: Sustainable cities and communities; and SDG 13: Climate action [
5].
The widespread concern about air pollution and its harmful consequences for individuals has increased potential demand for sensor technology geared to reducing people’s exposure to it [
6]. Along this lines, interdisciplinary research between engineers and social scientists has been conducted to develop, test, and deploy air-quality sensors [
6], although less research has focused on measuring the social impact of these tools. This article aims to fill this gap by examining the social impact reported by the HealthyAIR tool for real-time detection of pollution risks, especially geared to people with cardiorespiratory diseases who have been directly affected by the COVID-19 crisis. Thus, the COVID-19 situation constitutes a new scenario in which social impact has to be taken into consideration. In the pandemic context, it is also crucial to have evidence-based information that reports benefits to society. Indeed, researchers have already shown that, besides fighting the pandemic, the current situation has also increased the need to fight against the ‘infodemic’ as one of the biggest threats [
7]. At the same time, conversely, there has begun to be an increasingly shared general awareness that people’s lives depend more and more on science.
The social impact of science is at the heart of the scientific and social debate. The growing concern among researchers, funding agencies, universities, policy makers, stakeholders, and the general public regarding how science may lead to specific improvements in society and help to establish research impact agendas in all scientific disciplines [
8]. In a review of literature on the evaluation of scientific, social, and political impact [
1], the conceptualization of the social impact of research has been analyzed in depth as part of an ongoing effort. Even more crucial has been the assessment of social impact. Flecha’s contributions [
9] have been fundamental in clarifying the distinction between dissemination, transferability, and social impact. First, the dissemination of research results does not imply social impact. Dissemination refers to the moment in which research results are released, when they are published in scientific journals, or just disclosed to other scholars, policy makers, stakeholders, and any other members of the public, through social networks, media, etc. Second, social impact is not knowledge transfer. Transferability occurs when those published and disseminated results are considered as a basis for social policies and actions; but there is still no evidence as to whether they have been shown to achieve any social improvements. Thus, the social impact of research is considered at the point where those disseminated research results, which have also been transferred later, lead to an improvement in any aspect related to some people or community regarding the needs already agreed for the term under consideration [
9]. Furthermore, undertaking the research via dialogue with other researchers, stakeholders, and the public proves to be an effective pathway to ensure that the research itself will address the societal needs of the participants [
1].
To this end, it seems essential to improve the mechanisms to assess and evaluate the impact that scientific research is already having, in order to promote effective strategies to ensure social impact, so that it may then inform evidence-based policies and the actions of citizens, professionals, and organizations. Along these lines, with a view to providing a permanent system of indicators for impact evaluation and contributing towards ensuring the social impact of research, the European Commission selected the FP7 EU Project IMPACT-EV ‘Evaluating the impact and outcomes of EU SSH research’ (2014–2017). The project designed the first global open-access repository on science social impact called SIOR (Social Impact Open Repository), launched by the European Commission in 2016. Building on these advances and drawing on an extensive and in-depth literature review of contributions for the measurement of social impact, Flecha [
10] elaborated a set of indicators, sources, and methodologies to measure social impact in the short, medium, and long term for each of the Key Impact Pathways. The four Key Impact Pathways introduced by the European Commission were (a) addressing global challenges, (b) achieving R&I missions, (c) engaging EU citizens, and (d) supporting policy-making [
10]. Advancing towards achieving and assessing social impact requires, among other things, including the voices of citizens and stakeholders, besides the scientific community. Moreover, indicators used to evaluate such impact should be quantitative and qualitative, and information provided should come from different sources [
10]. Accordingly, our paper makes an original contribution to the field by examining quantitatively and qualitatively the social impact of a tool—HealthyAIR—that measures real-time pollution risks. The original approach of our work relies on going beyond testing the effectiveness of the tool itself operating with people with cardiorespiratory diseases who have been directly affected by the COVID-19 crisis, as reported below. Moreover, this article draws on a multidisciplinary approach to explore the social impact achieved by the implementation of the tool including the engineers and the healthcare professionals in co-creating knowledge on the benefits reported by the HealthyAIR tool. This aligns with the current global demands to make science with and for society that contributes to achieve the Sustainable Development Goals (SDGs).
1.1. HealthyAIR Technological Solution Description
There are several systems offering services related measurements of air pollution [
11,
12,
13,
14]. However, the presented system includes the feature of not only multisensors data acquisition but also the inclusion of artificial intelligence for air pollution prediction.
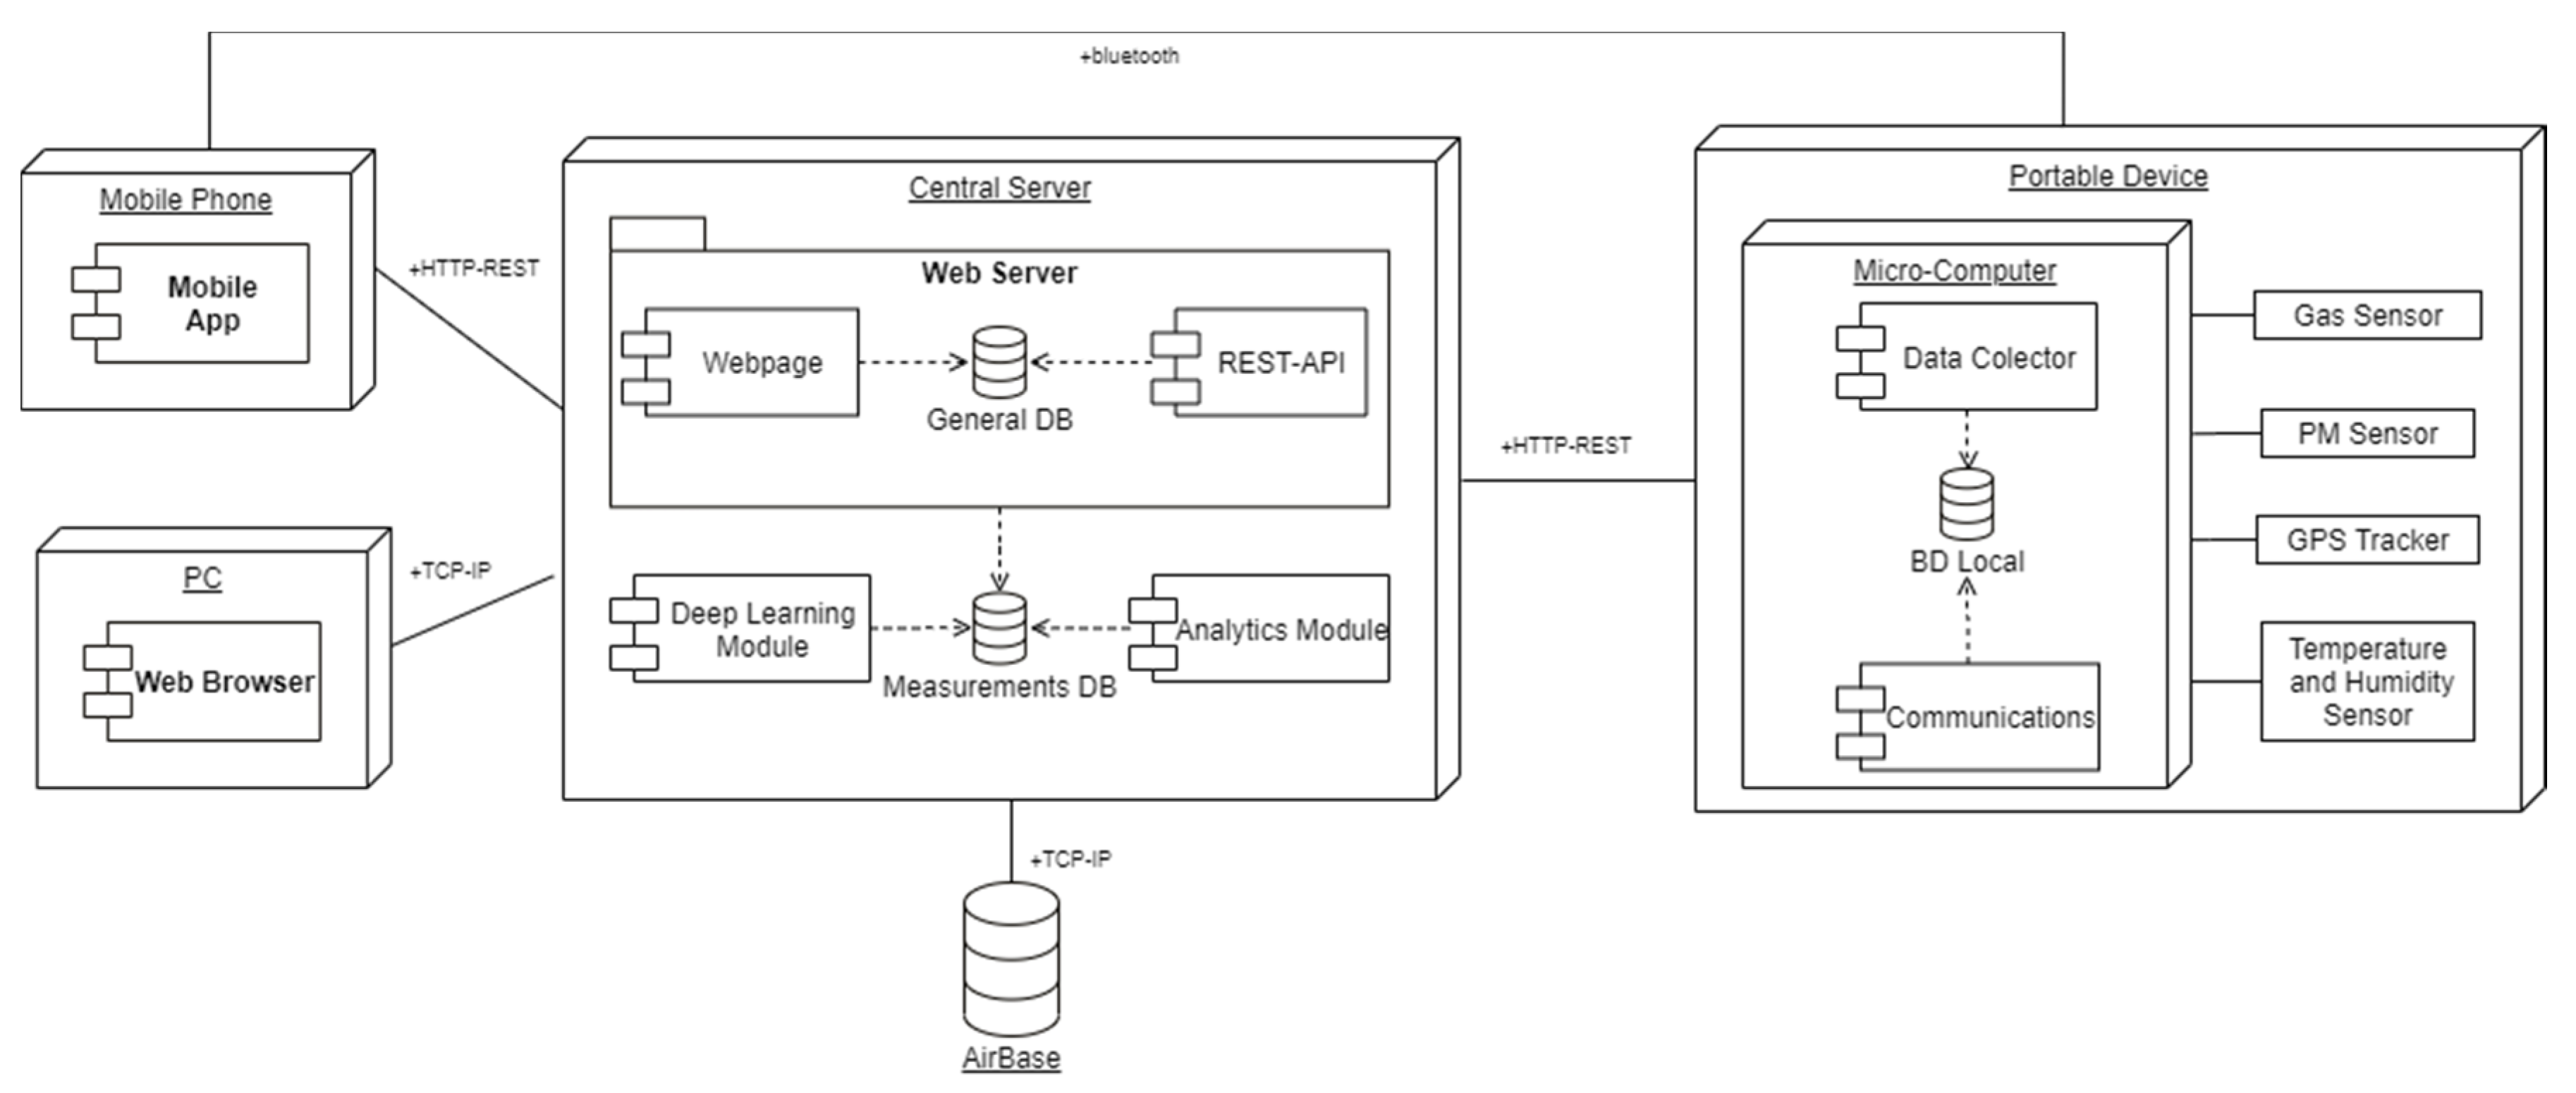
Below is the block diagram (
Figure 1) that represents how the HealthyAIR technological solution operates.
The project comprises three main parts: several hardware devices where data are collected and processed from different sensors, a central server in charge of long-term data storage and analytics, and, lastly, two interfaces in the form of a mobile app and a website.
1.1.1. Portable Device: The Portable Device Comprises a Suite of Sensors and a Microcomputer with the Following Software Modules
Data Collector: this module oversees retrieving measurements for the sensors, applying any preprocessing necessary, and storing them in the local database.
Local DB: this database is tasked with storing all time-sensitive data collected by the device such as pollutant measurements or environmental conditions.
Communications Module: lastly, this module is tasked with synchronizing the local database with the central server and with communicating via Bluetooth with the mobile app.
1.1.2. Central Server: This Central Server Acts as the Central Node in the Network and Houses the Following Software Modules
Web Server: a web server will be at the center of the central server, in charge of communication with both the users and the different portable devices in the network, and will consist of the following components:
- -
REST-API: this will serve as the main communication method between the central server and the different portable devices and mobile apps.
- -
General DB: a general-purpose database will be used to store all non-measurement information.
- -
Webpage: this webpage will act as the main interface for the standard user, displaying measurements through different graphs and GIS services.
Measurements DB: a time-series database will be installed in order store the measurements collected by the network. As we previously mentioned, time-sensitive data presents a couple of specific problems, which the choice of a purpose-made database with features like tailored compression algorithms and data summarization will mitigate, and to support the data collected by the network, the central server also stores data from Airbase (the European air quality DB).
Analytical Module: an analytical module will provide the more advanced user with a sandbox where they can create customized data displays to obtain more detailed reports or perform in-depth analysis based on the data collected by the network.
Deep Learning Module: lastly, a deep learning module will allow an advanced user to create predictive models for pollutants based on historical data collected by the network.
1.1.3. Mobile App
This mobile app serves two purposes, the first acting as a local interface for the portable devices, connecting to them via Bluetooth and retrieving the last measurements, and the second notifying the users if the pollution level for certain nodes in the network reaches a certain level.
1.2. Quantitative Assessment of HealthyAIR Technological Solutions before, during and after COVID-19
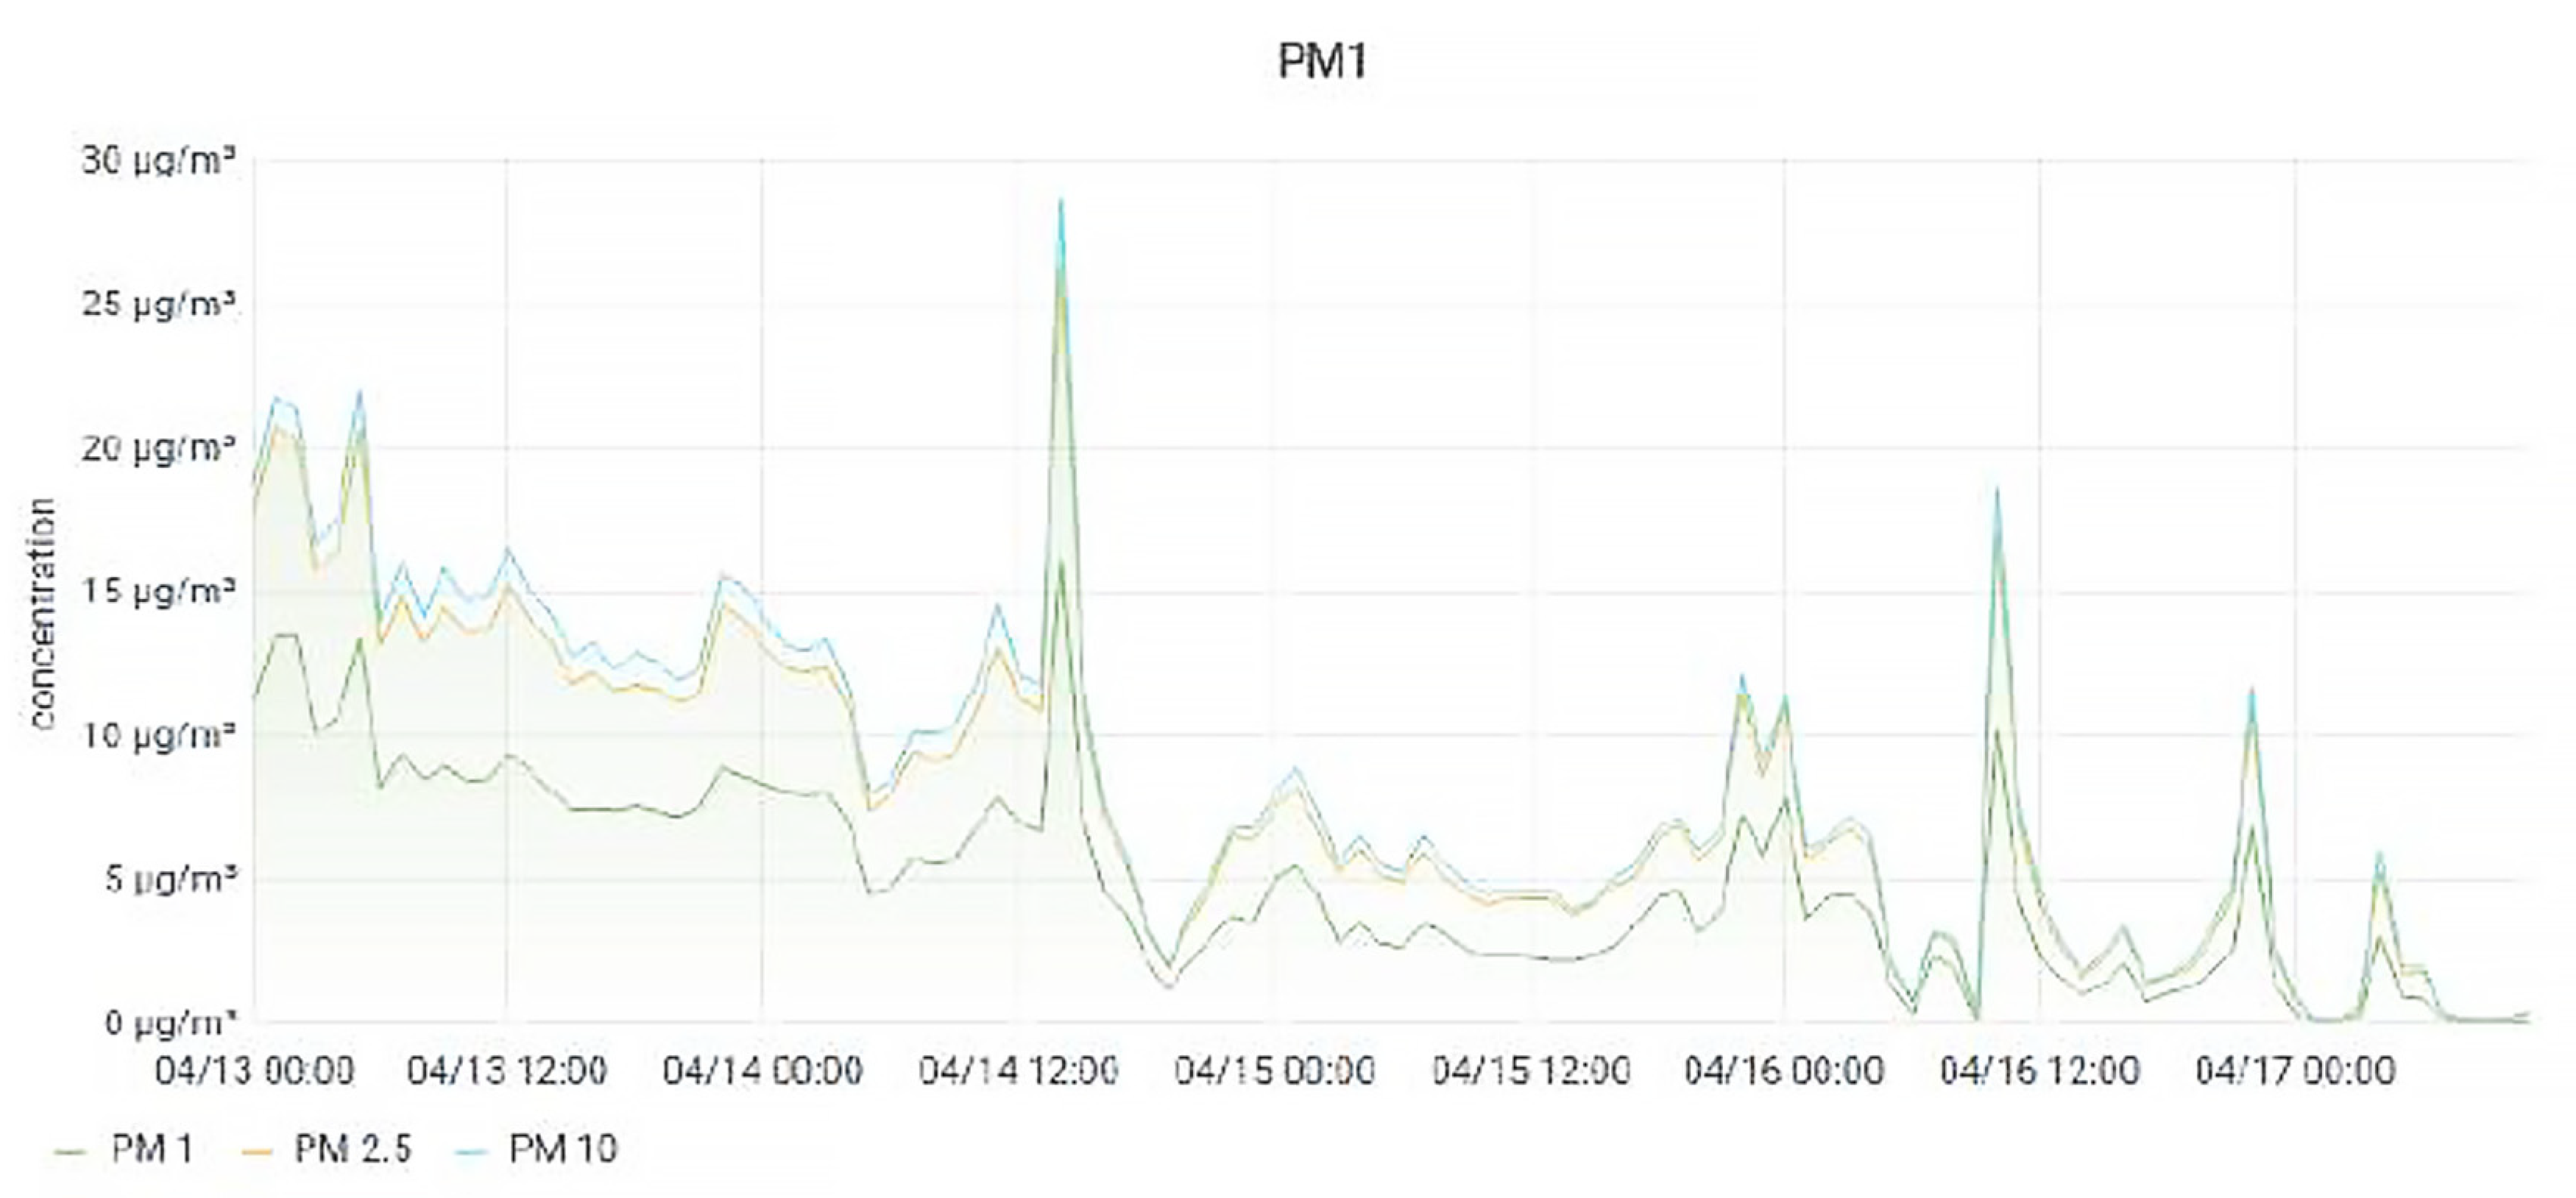
In the course of this project we detected an improvement in air quality, most likely due to the quarantine imposed by the government as a result of the COVID-19 pandemic. The following graphs (
Figure 2) show the sharp decrease in particulate matter coinciding with 30th May, the day the Spanish Government suspended all non-essential work.
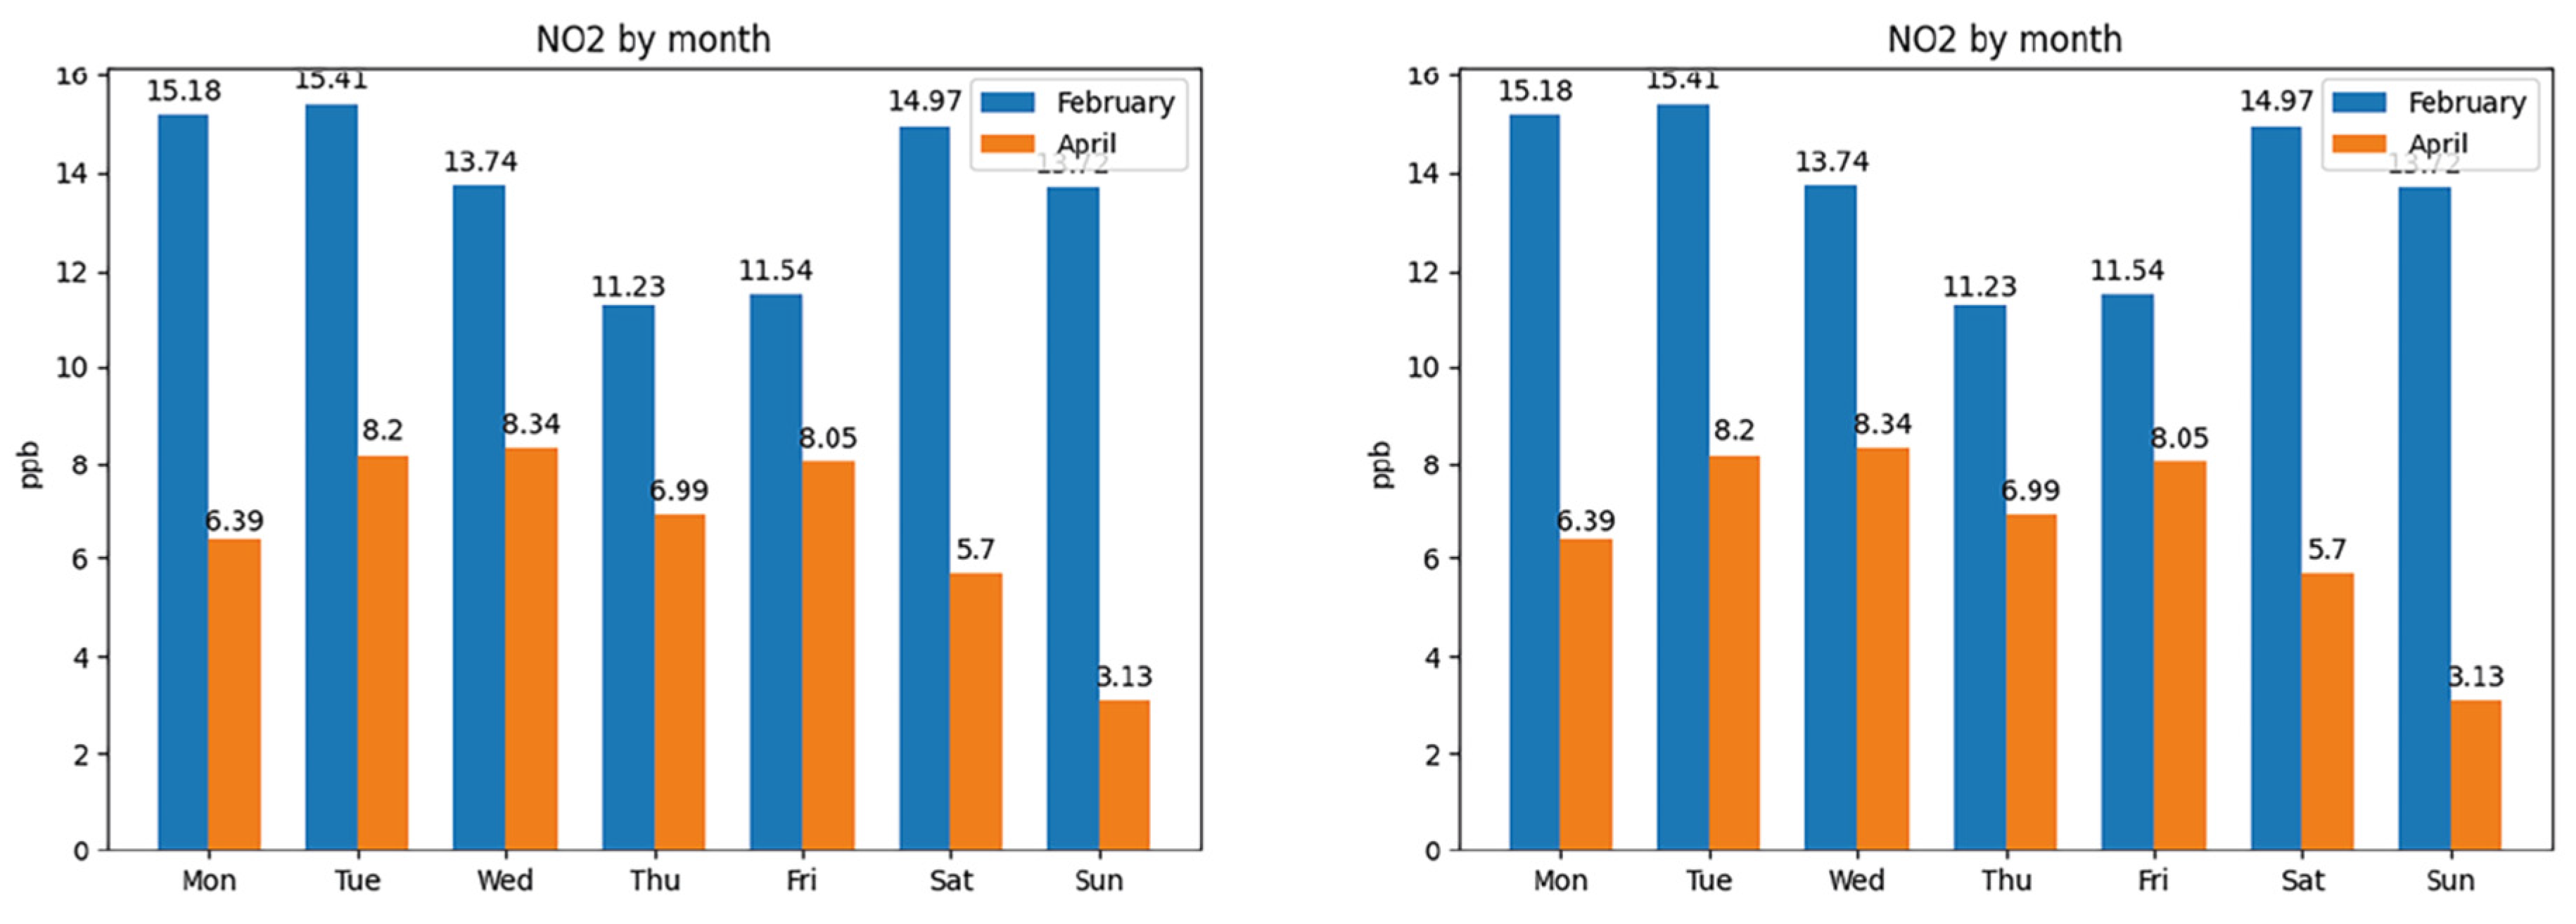
As a result, a brief study of the impact of quarantine was conducted, because the portable devices were being moved around while this study was being conducted on the different stations added to the network. Most stations registered sharp decreases in pollutant concentration between the month of February, before any safety measures were put in place and April, when non-essential services shutdown. The most affected pollutant was PM, whose main source are cars. The following
Figure 3 shows a comparison for the average concentration per day of the week for Bilbao, a large city with over 340,000 inhabitants, and Miranda de Ebro, a much smaller city with less than 40,000 inhabitants.
However, not every location was affected to the same extent, and the
Figure 4 below shows the same comparison for NO2 as in
Figure 3, a pollutant in which industrial operations are the greatest factor.
The following
Table 1 shows the average reductions for every pollutant; we did not include ozone in this study as only one station in the network was able to measure it.
Additionally, a predictive model was developed using deep learning techniques with a mean average error of 15%. This model is able to predict future pollutant concentrations based on daily pollutant cycles, given the pollutant’s recent history, once the concentration levels normalized during quarantine, the model was able to predict new cycles while maintaining its low margin for error.
2. Methods
Aiming at exploring the social impact of the use of the HealthyAIR tool, a survey study was conducted using a Likert scale and carried out online. As follows, we describe in depth our methods, the data collection through the survey, the participants of the study, and the data analysis.
2.1. Data Collection
Data were collected via the online survey with participants who reported the use of the tool HealthyAIR on a Likert-type scale. The survey was available from 11 June 2020 via the following link for one month (
https://forms.gle/Sy9yauzgj9x4Ynsx5). The study participants answered a questionnaire with eleven-questions (11Q) for healthcare professionals and engineers, and fourteen questions (14Q) for users/patients. These questions were grouped into eight social impact indicators, as follows:
On the side of the professional:
- -
Indicator of change in behavior and practice.
- -
Indicator of change in the improvement of work practice.
- -
Indicator of evaluation and impact on professionals.
- -
Indicator of satisfaction with follow-up and treatment.
On the side of the users/patients:
- -
Indicator of social improvement, health, and quality of life.
- -
Indicator of improvements in the experience of the person.
- -
Indicator of improvement in the environment.
- -
Indicator of improvement in services provided by health personnel for better monitoring and treatment of pathology.
2.2. Study Paticipans
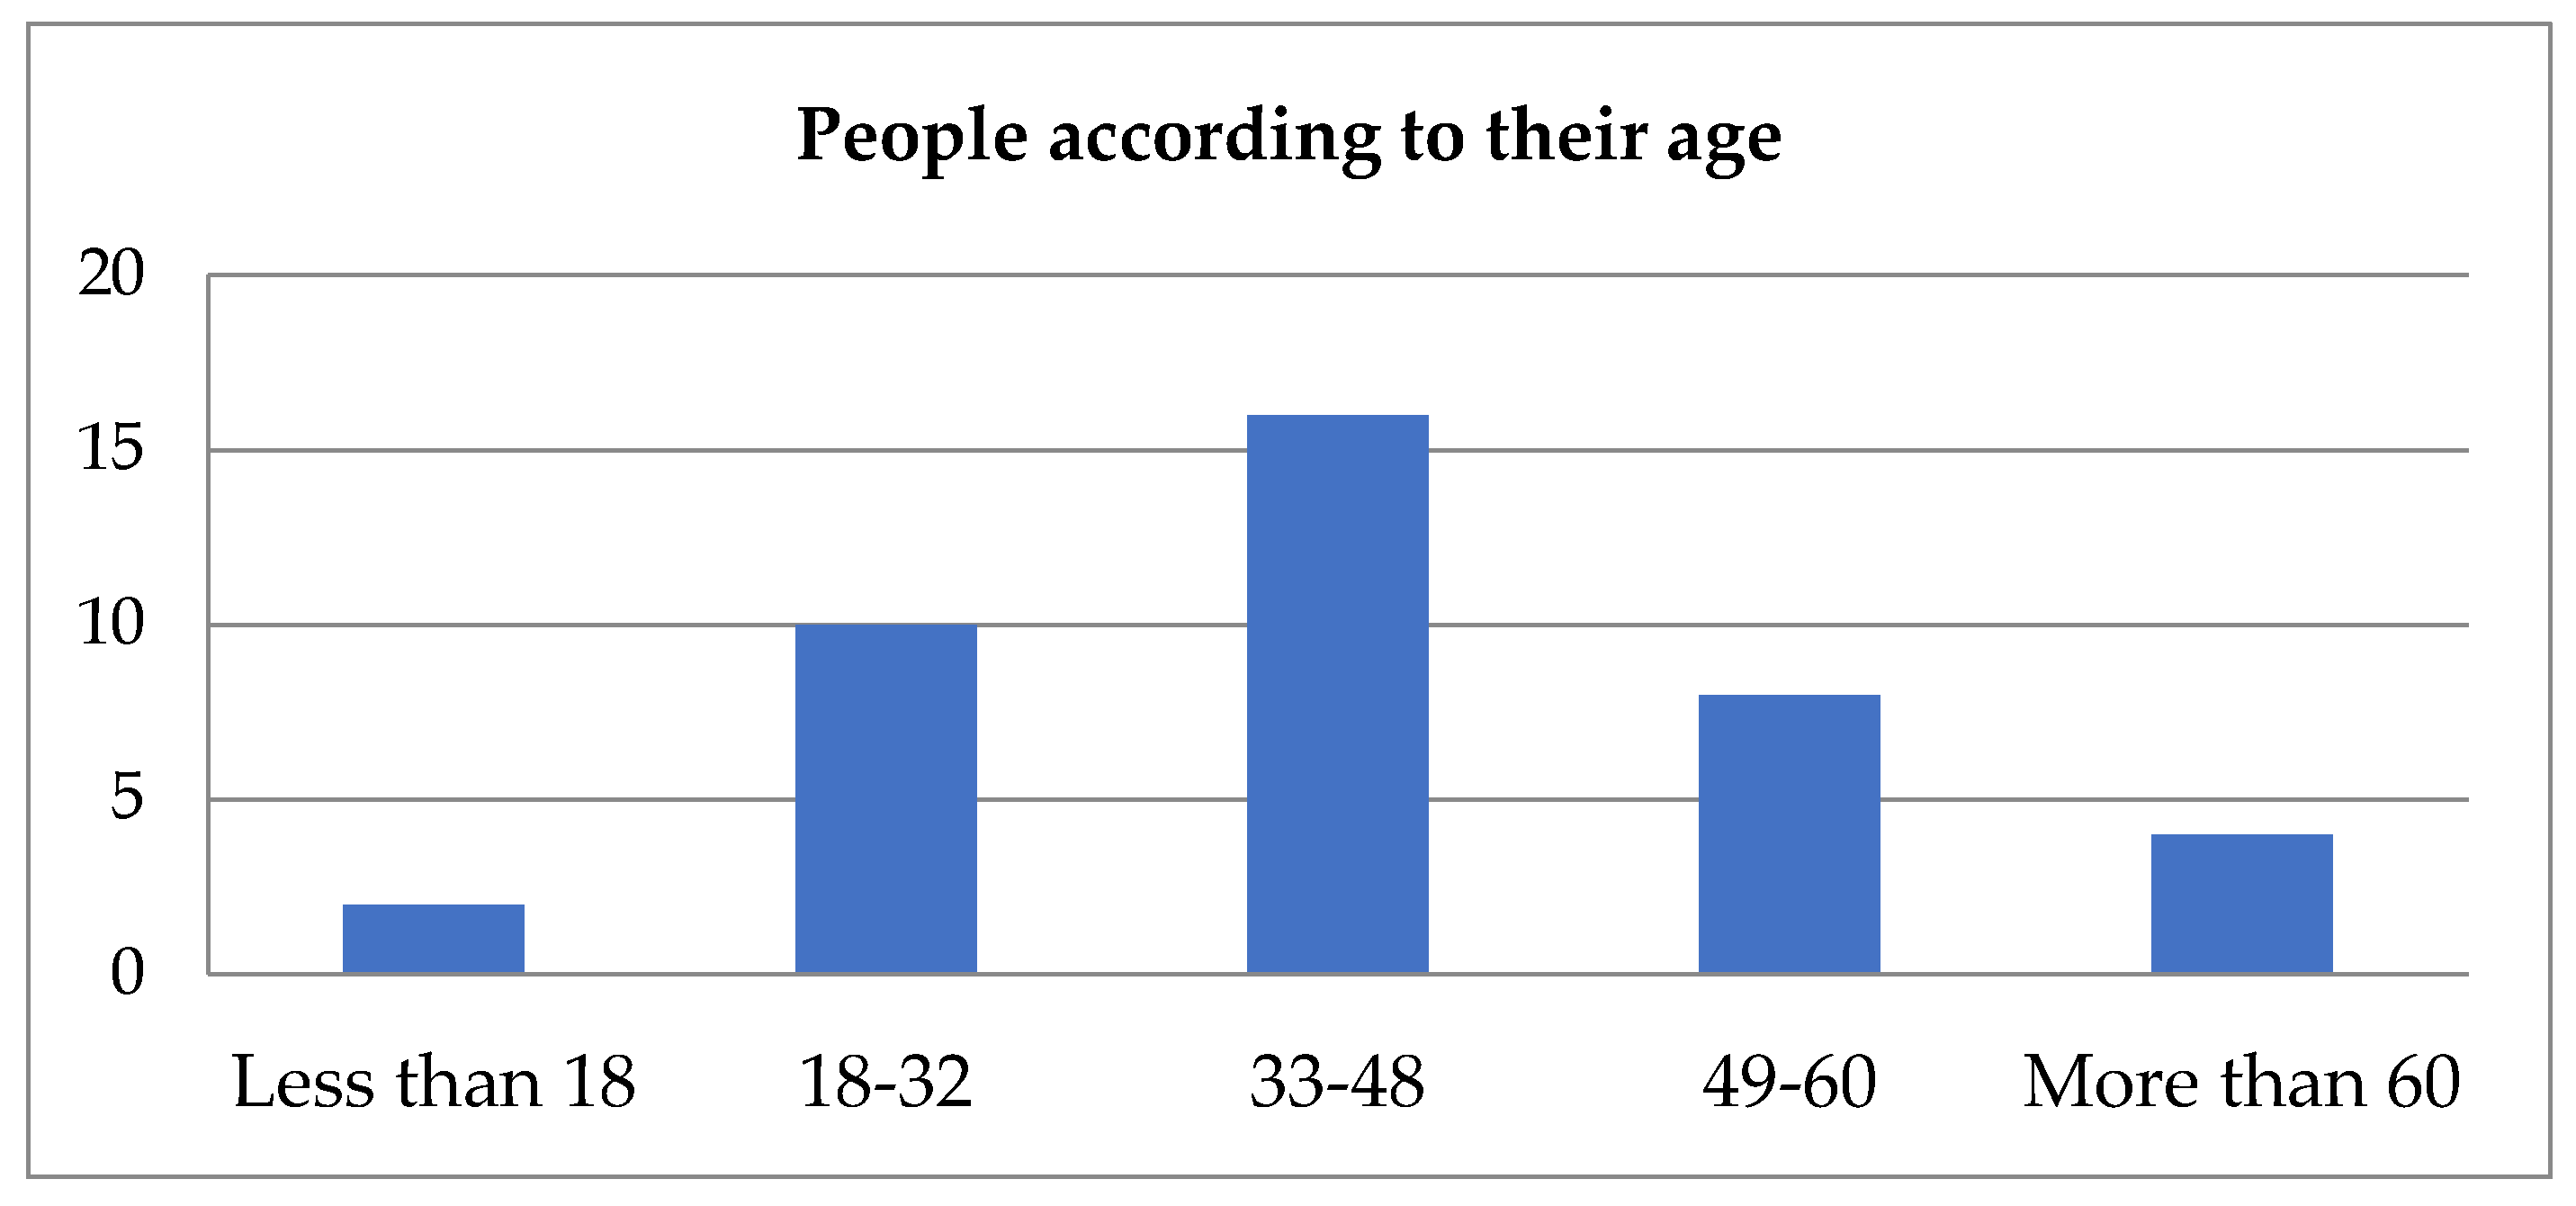
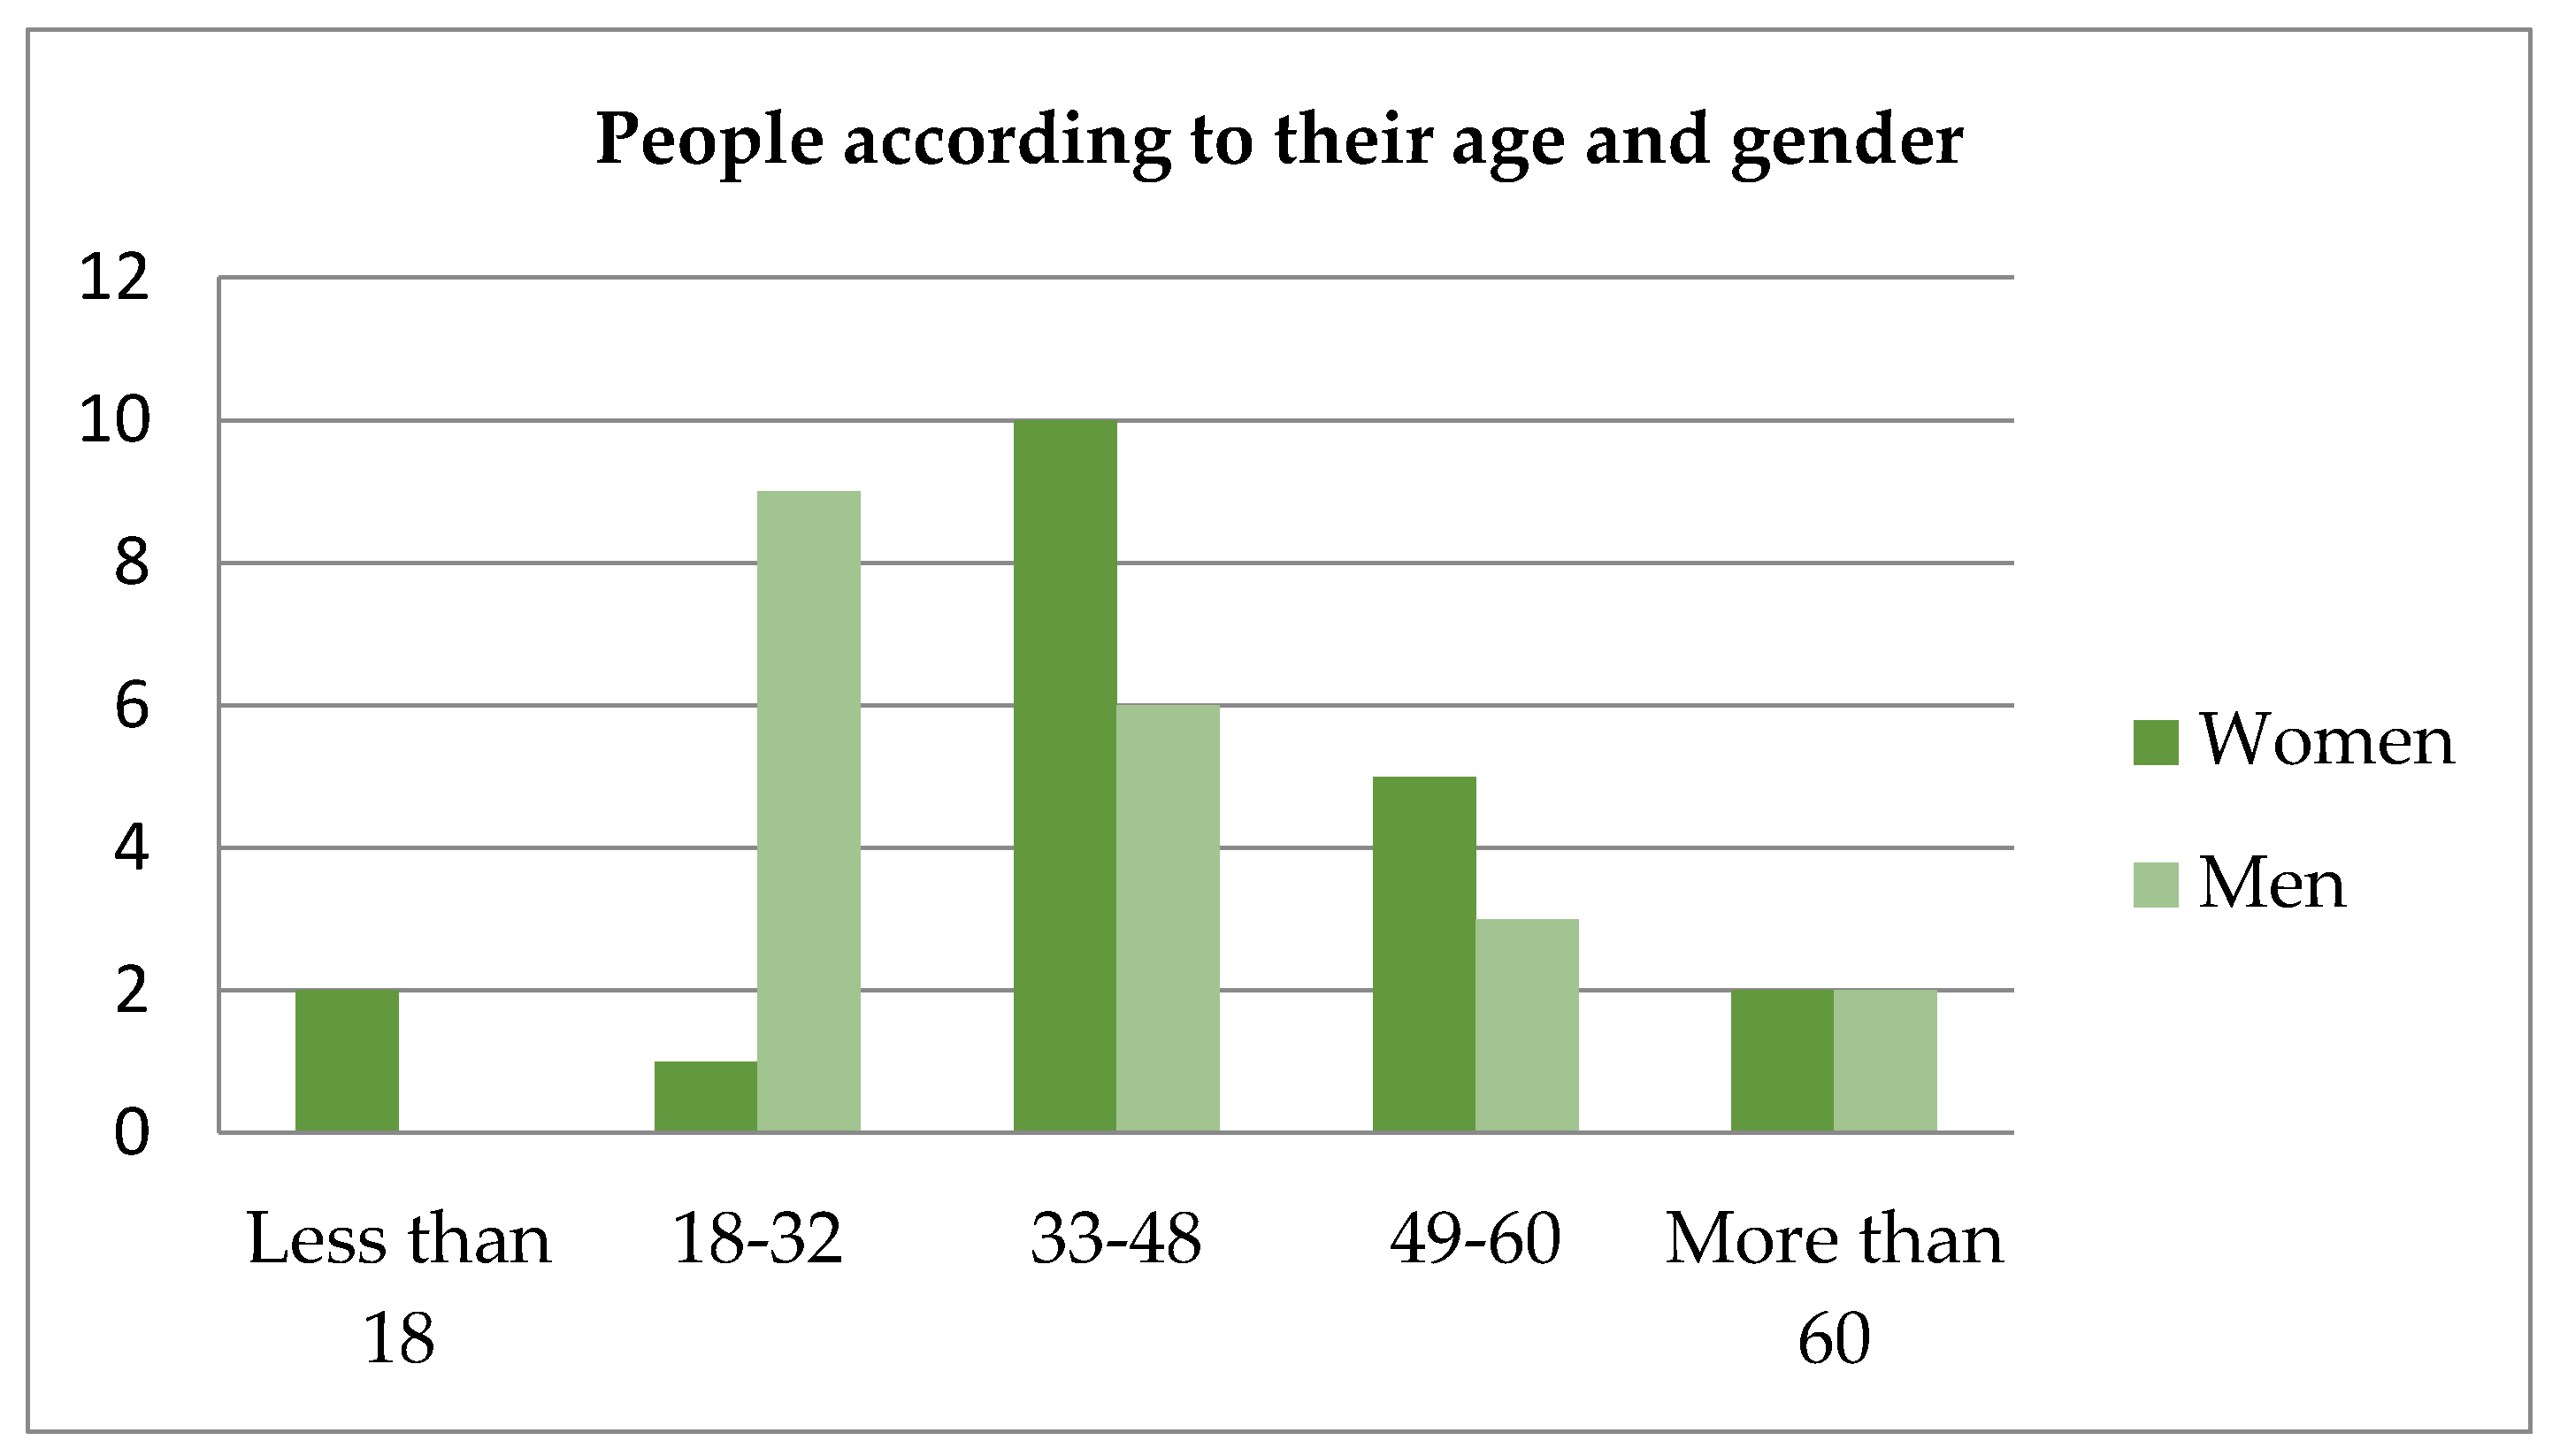
For this study, 40 people in total participated in the survey, 20 of whom were men and the remaining 20 were women. Their ages ranged from 18 to over 60 years. Data are represented in the
Table 2 below.
Firstly, it can be seen in
Figure 5 that the majority of the people are over 32 years old (70%) and it should be also mentioned that, among the 12 people who are under 33 years old, 9 of them (75%) are men and the rest are women.
Now, according to
Table 3,
Table 4 and
Table 5, several percentages appear, with the three tables showing three features and illness.
Table 3. This first table shows gender. In the first term, it shows that 25% of men and only 5% (one person) of women are patients. Moreover, if the whole group is taken into consideration, 15% of the people suffer from cardiorespiratory diseases.
Table 4. This one shows occupation. Twenty percent of the engineers’ group and 16% of the standard users’ group are patients. None of the five people who work as healthcare personnel are patients.
Table 5. In order to create this last table, the group was divided into two subgroups: people who are over 32 and those who are not. Thus, 16.67% of the people who are not over 32 are patients while 14.28% of the people who are over 32 are patients.
As it can be seen in
Table 6, global mean age is 41.05 with a standard deviation of 15.63 years. Looking at the quartiles, the men’s group seems to be younger than the women’s because the first quartile of the latter is 40 (this fact can be confirmed in
Figure 6).
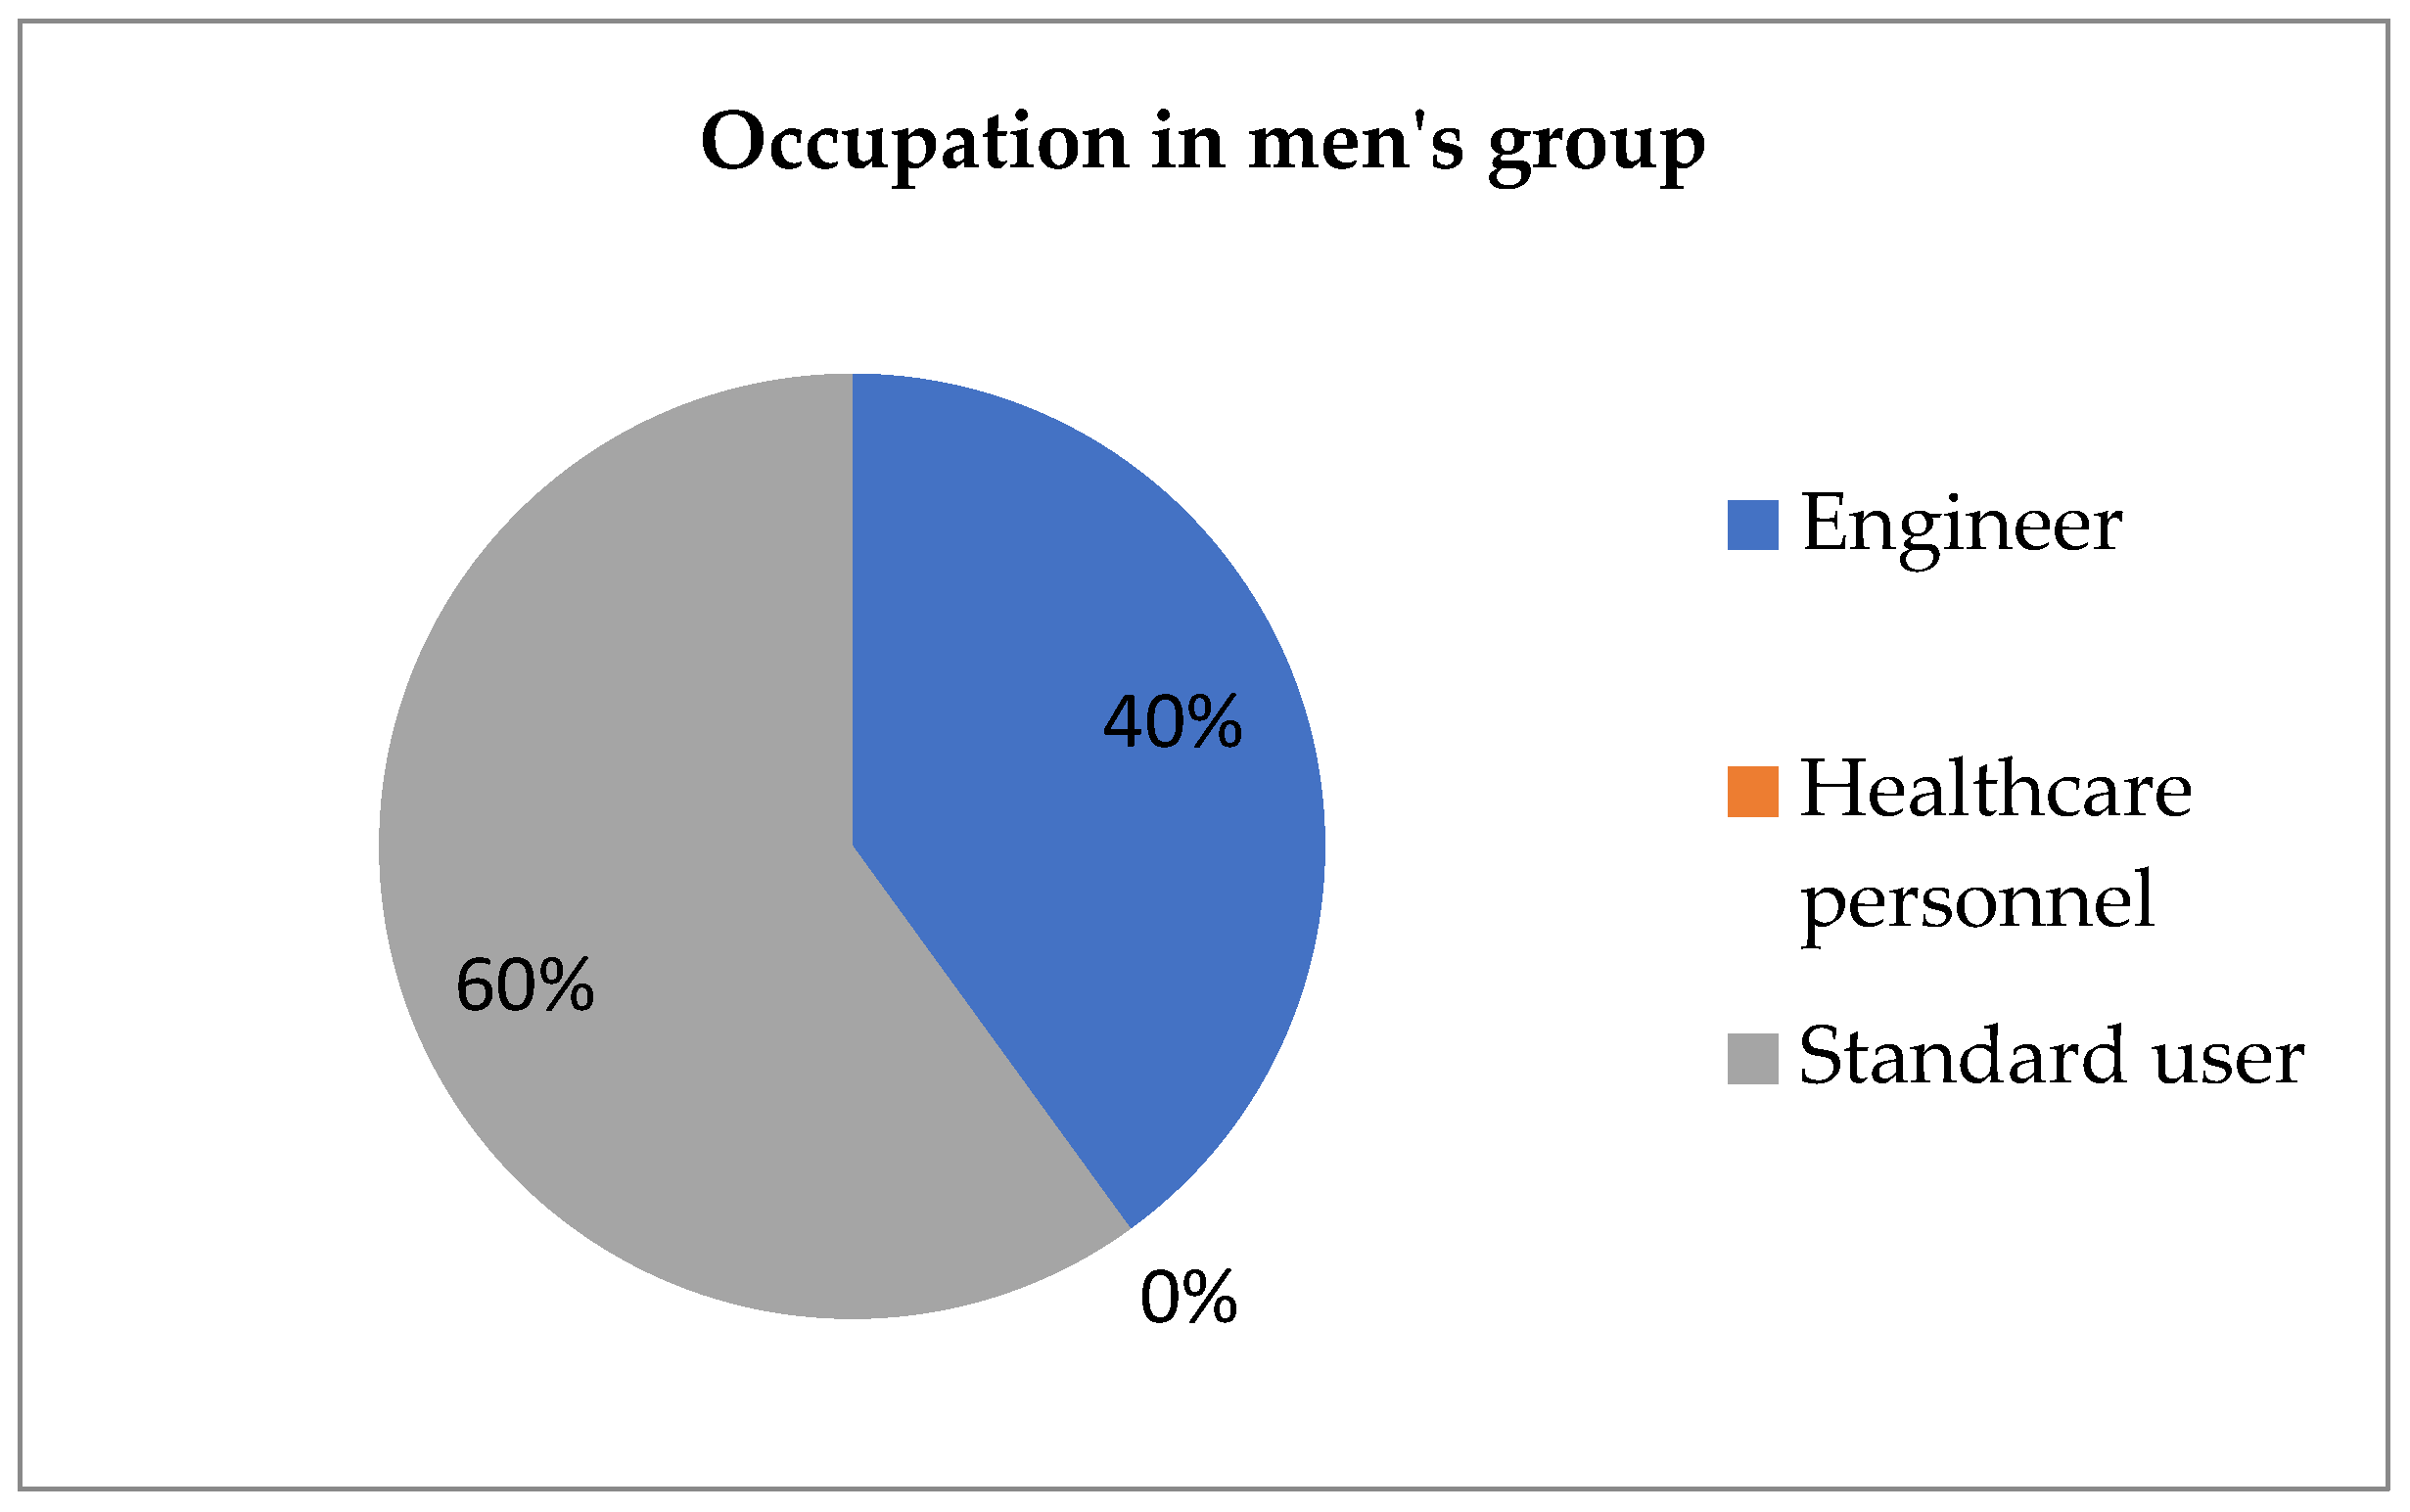
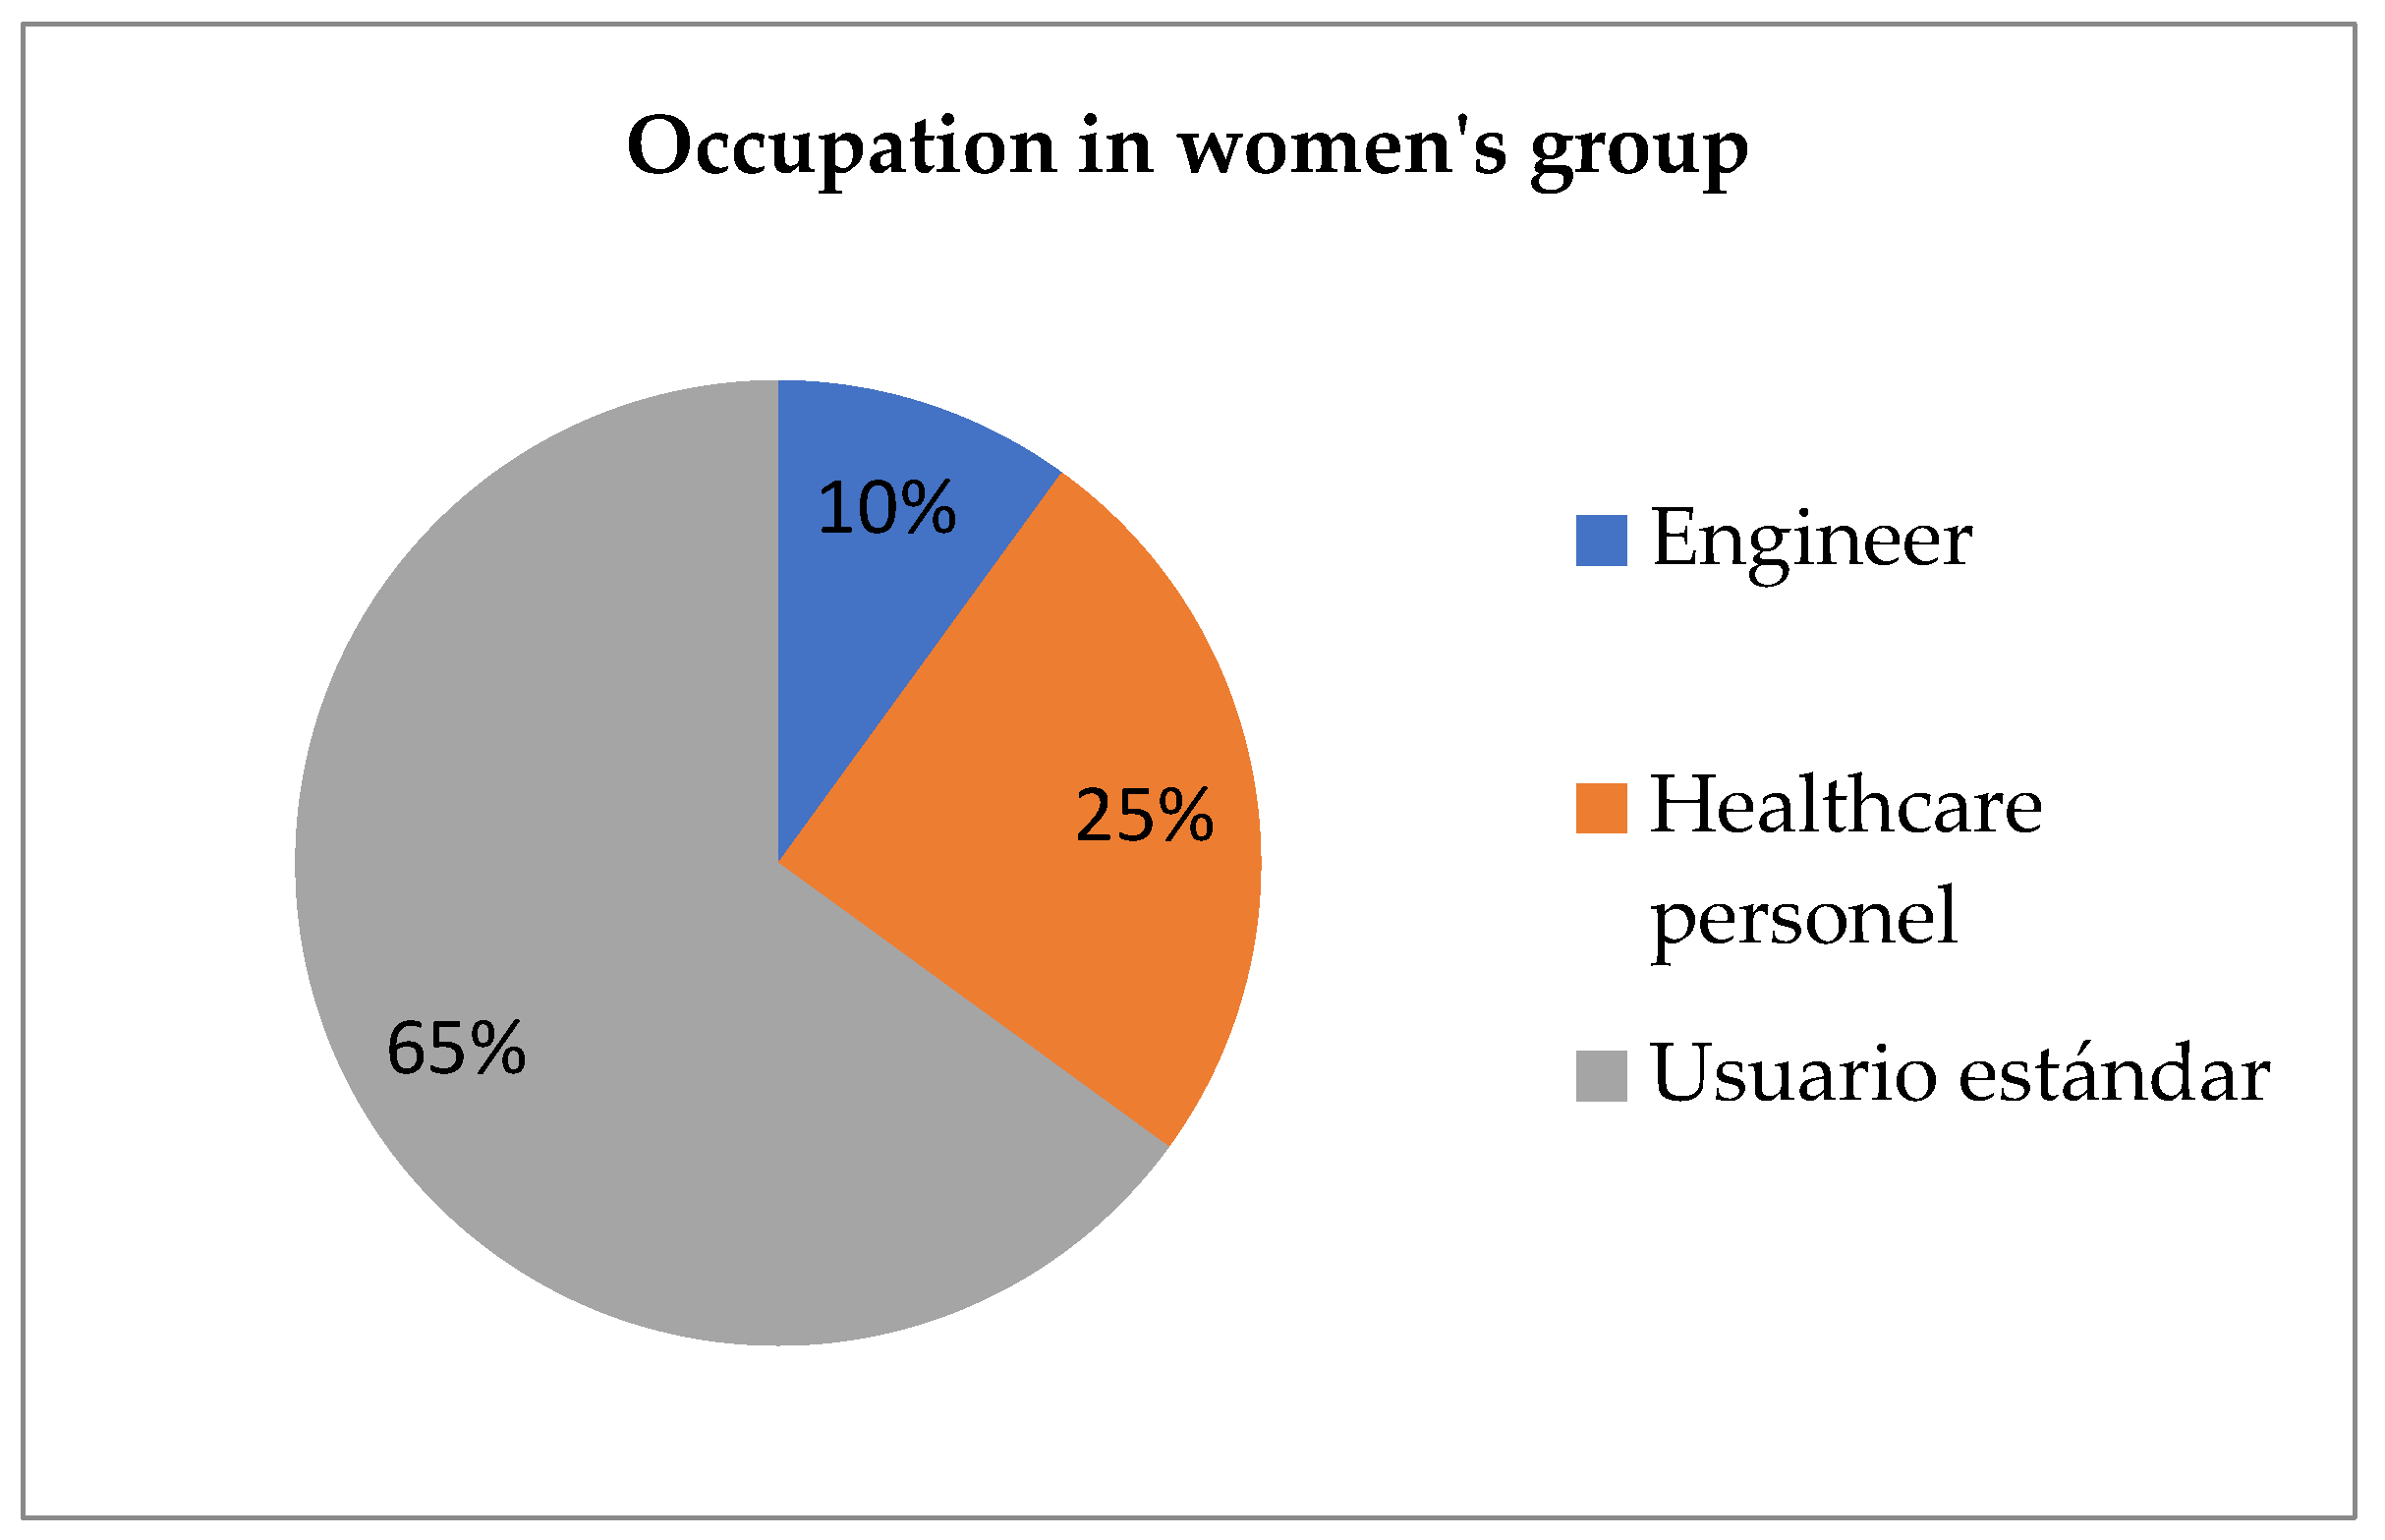
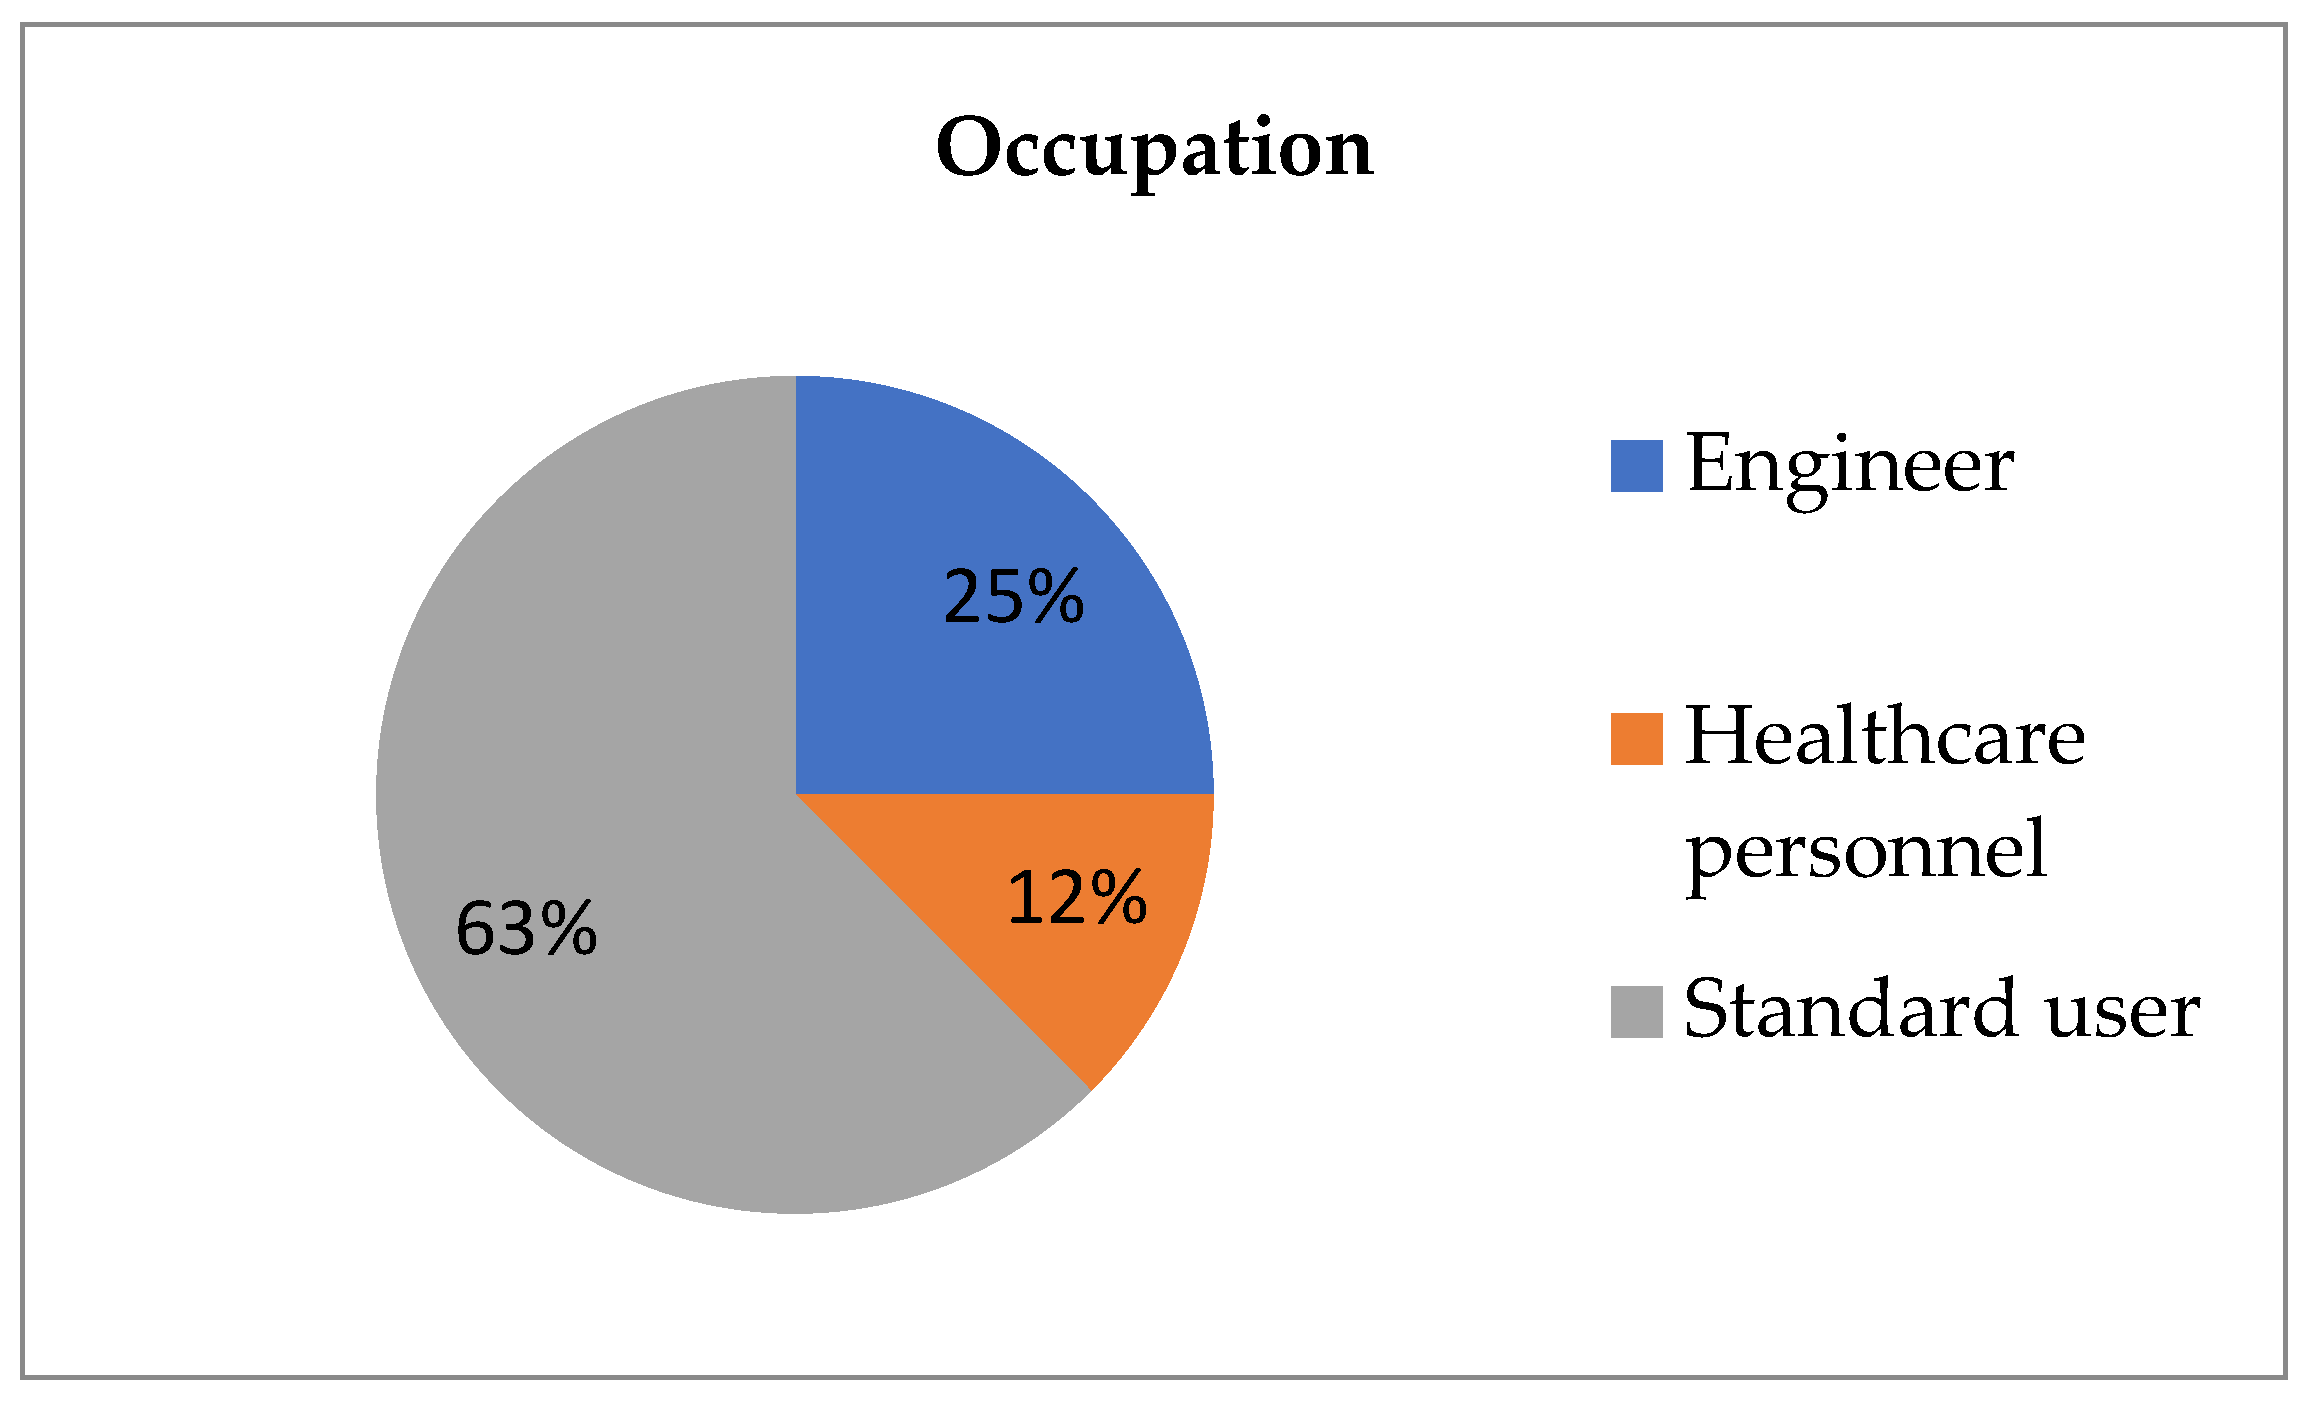
Occupations are studied in
Figure 7,
Figure 8 and
Figure 9. In the men’s group, there are no healthcare personnel and it is made up of 8 engineers (40%) and 12 standard users (60%). On the other hand, in the women’s group, there are 2 engineers (10%), 5 people who are healthcare personnel (25%), and 13 standard users (65%). Finally, according to previous data, 25% of the whole group are engineers, 12% are healthcare personnel, and 63% are standard users.
The next area subject to study is whether any possible association exists between illness and the remaining variables. As gender, illness and occupation are categorical variables, the test used is Fisher’s test. This is applied five times in the study according to the following pairs: men/women, engineer/healthcare personnel, engineer/standard user, healthcare personnel/standard user, and under or equal to 32 years/over 32 years.
Every test gives a p-value that is greater than 0.05, which is the set significance level, and so the variables cannot be said to be associated.
As it has been said, Fisher’s exact test becomes more conservative if any of the hypotheses is violated. In this case, gender related marginal distribution is fixed before starting the experiment. Since this occurs, in order to be less conservative, Barnard’s test and Fisher’s exact-Boschloo are considered [
15,
16,
17].
Barnard’s test is less conservative than Fischer’s one if there is at least one of the two marginal distributions fixed. Gender/illness case verify this hypothesis (because 20 men and 20 women condition was set before starting the experiment), so Barnard’s test is able to be applied.
Null hypothesis is set to be that illness does not depend on gender. After applying the two-sided test, p = 0.106588 (>0.05 = α) arises and, because of that, null hypothesis cannot be rejected.
On the other hand, for the purpose of analyzing the other tables, since their marginal distributions are not fixed and the only fixed value is the sample size (n = 40), Fisher’s exact-Boschloo is considered.
As the previous case, null hypothesis is set to be that illness does not depend on the other classification. These classifications are: engineer-healthcare personnel, engineer-standard user, healthcare personnel-standard user, and under or equal-over 32. In every single case, the resulting p-value is greater than 0.05, so the null hypothesis cannot be rejected.
2.3. Data Analysis Methods
2.3.1. Working with Intervals
For an arbitrary interval, which is expressed by (a, b], its mean value is said to be .
In order to work with age intervals, each one of them is associated with its mean value. To do this, age intervals need to be defined, and there are initially three that arise naturally: (18, 32], (32, 48] and (48, 60]. Thus, they are associated with 25, 40, and 54, respectively. A maximum and minimum age now needs to be considered in the first and last cases, which should be 16 and 90, respectively. As such, these two intervals are (16, 18] and (60, 90] and they are associated with 17 and 75.
After this has been established, participants in the survey are supposed to be as old as the mean value of the interval stated. For example, if anyone is between 18 and 39 years, this is set to be 40 years old as long as the calculations are done.
Lastly, every operation (arithmetic mean, standard deviation, median, etc…) is undertaken as usual with the new data.
2.3.2. Fisher’s Exact Test
This test involves ascertaining whether there is any association between two ways of classifying a dataset. For example, there is a set of birds divided into two species and there are nests as well as birds. Nests are also divided into two groups: metal nests and wooden nests. The experiment involves letting the birds choose one nest and writing down the resulting distribution, as it is done in the following
Table 7.
Due to existing ties between the values
a,
b,
c, and
d, once one of them is known, the rest can then be calculated. Moreover, the probability of (for example) a obtaining a determined value follows a hypergeometric distribution with the following formula:
In this formula, ‘!’ means
factorial. If
n is said to be a natural number,
n! (which is read ‘
n factorial’) corresponds to the value:
In the first term, Fisher’s exact test calculates the probability of every single distribution for given values A, B, C, and D (which are supposed to be known). After that, probabilities that are less or equal to the distribution probability observed are added up and this value will be the two tailed p-value of the experiment.
As can be seen, as long as A, B, C, and D are known, this test gives an exact value. If this assumption is violated, the test becomes a more conservative one and loses its accuracy, although it is still acceptable. In this survey, A and B are known because they correspond to gender, occupation, or age in each part. However, how many people were ill was not known before starting the experiment, and so in this case, the Fisher’s tests that were carried out are not accurate.
Despite the fact that the sample size is 40, in this study, this is not relevant due to the considered tests (Fisher, Barnard, and Fisher–Boschloo). These tests are designed for small sample size and if the sample size is greater and some extra hypotheses are guaranteed calculations are approached by Chi-square test.
Only the test’s hypotheses are relevant in order to carry out the test and, in this case, sample size is not under any restriction [
15,
16,
17].
2.3.3. Programs Used
In order to complete all the calculations, the programs which were used are:
Microsoft Excel 2010,
RStudio 3.6.1,
2.3.4. Social Impact Analysis
This part of the analysis was carried out based on the indicators for social impact established by Flecha in the Monitoring the Impact of EU Framework Programmes [
10]. These indicators are defined for each Key Impact Pathway and serve to track progress towards the expected social impact. For the purpose of our study, the data collected is analyzed under this framework that includes the four Key Impact Pathways: (a) addressing global challenges, (b) achieving R&I missions, (c) engaging EU citizens, and (d) supporting policy-making [
10].
3. Results and Discussion
The practice of research impact assessment has been rapidly developing [
19]. Whereas interest in assessing research impact and developing evidence-based science policy is not new [
20,
21,
22,
23,
24,
25], early analyses mainly examined innovation processes and research outputs. Research into the synergies between science and citizens has increased over the years, according to Fresco [
26], and there is a growing interest among researchers and funding agencies in how to facilitate communication channels to disseminate scientific results. According to the European Commission [
27], social impact is used to refer to economic impact, societal impact, environmental impact and, additionally, human rights’ impact. This understanding of the social impact of research is linked to the creation of the Social Impact Open Repository (SIOR), which constitutes the first open repository worldwide that displays, cites, and stores the social impact of research results [
28,
29].
Below are the results obtained from the online survey of users/patients and healthcare professionals and engineers. We have divided these results into 8 indicators that show the social impact that of this project as part of a co-creation process.
3.1. Survey of Social Impact
3.1.1. On the Side of the Professional
- Indicator of change in behavior and practice.
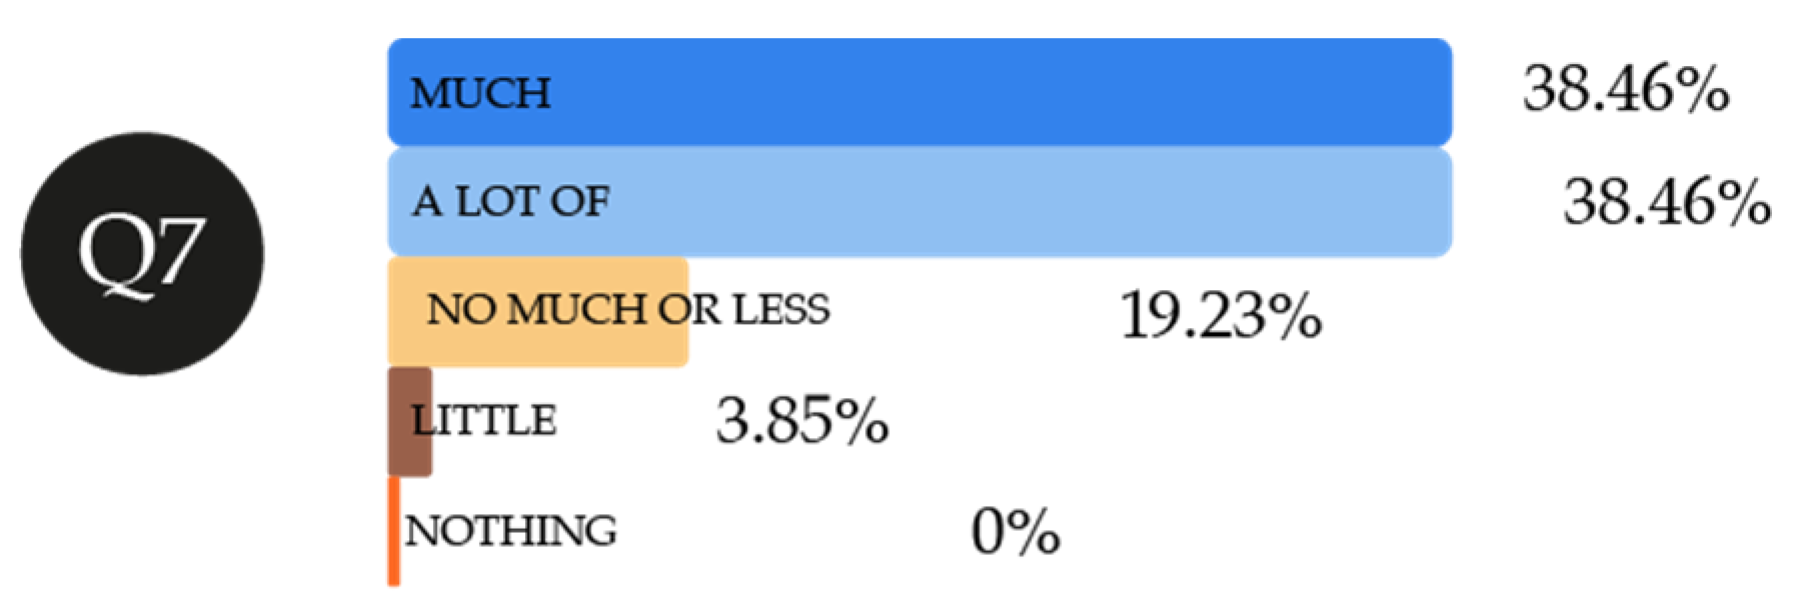
With regard to changes that this tool would entail in behavior and practice for healthcare personnel and engineers who may develop and improve it, attention should be drawn to the fact that those interviewed totally agree (33.33%) that their work would help to prevent respiratory pathologies (
Figure 10). According to these professionals, they totally agree (33.33%) or agree (26.67%), that the tool would in turn help authorities to improve their healthcare prevention policies and programs, which would have a repercussion on an improvement in societal quality of life. Bearing in mind that this is a tool that is currently in its first phase of development, those interviewed only shared something (33.33%) about this new knowledge with other people.
Q 7: The new application would help to predict changes in the development of respiratory pathologies.
Q 9: Authorities might be able to improve their policies and programs using data provided by the application.
Q 10: I have shared this knowledge with other people (friends, family, etc.).
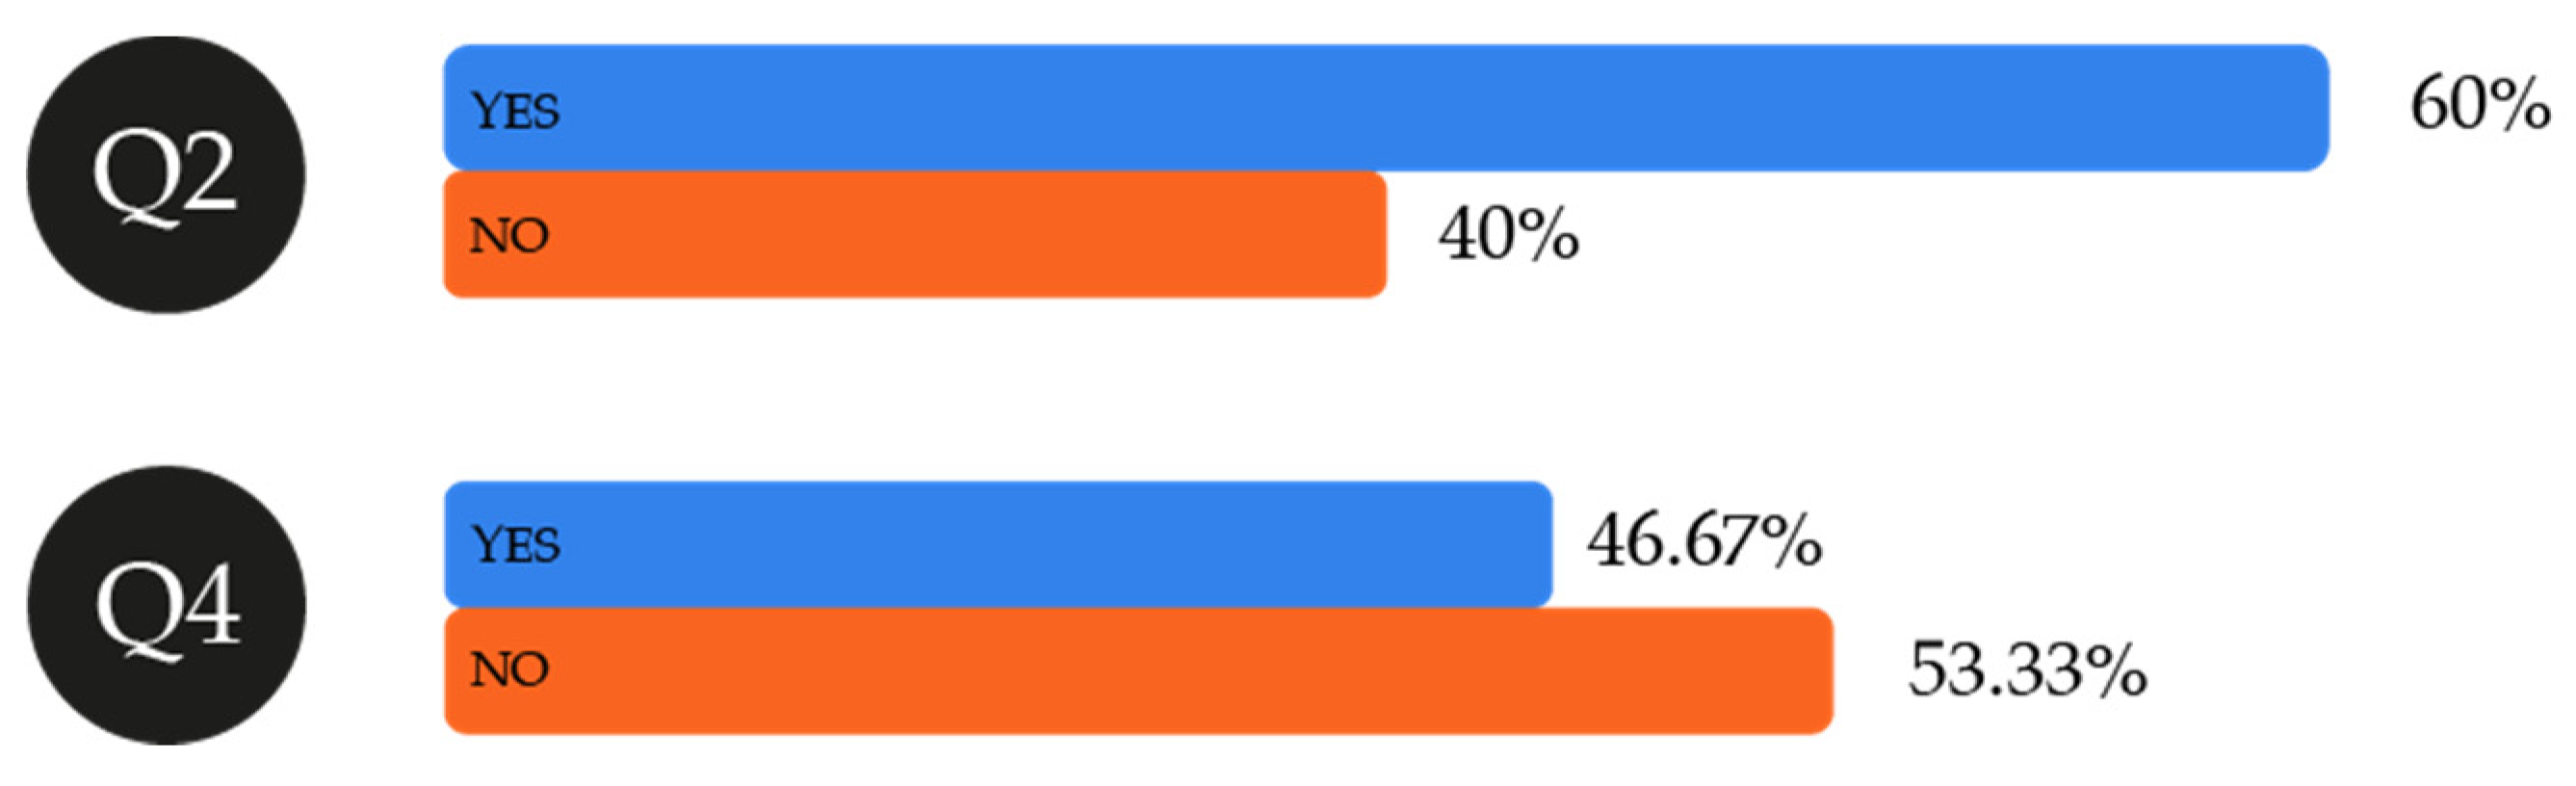
- Indicator of change in the improvement in work practice.
Sixty percent of the professionals interviewed think that this tool would change their work practices, which would mean it is a clear indicator of social impact (
Figure 11). However, only 46.7% think that the improvements in data collection permitted by this tool in comparison to other applications they had already been using would translate into “more personalized and controlled monitoring”, given that “there would be more statistical and graphic data” or owing to “monitoring in line with air quality”.
Q 2: There would be some change in my work practice when using this tool.
Q 4: The data collection procedure would be improved in comparison to those I was familiar with or had already been using: in what way?
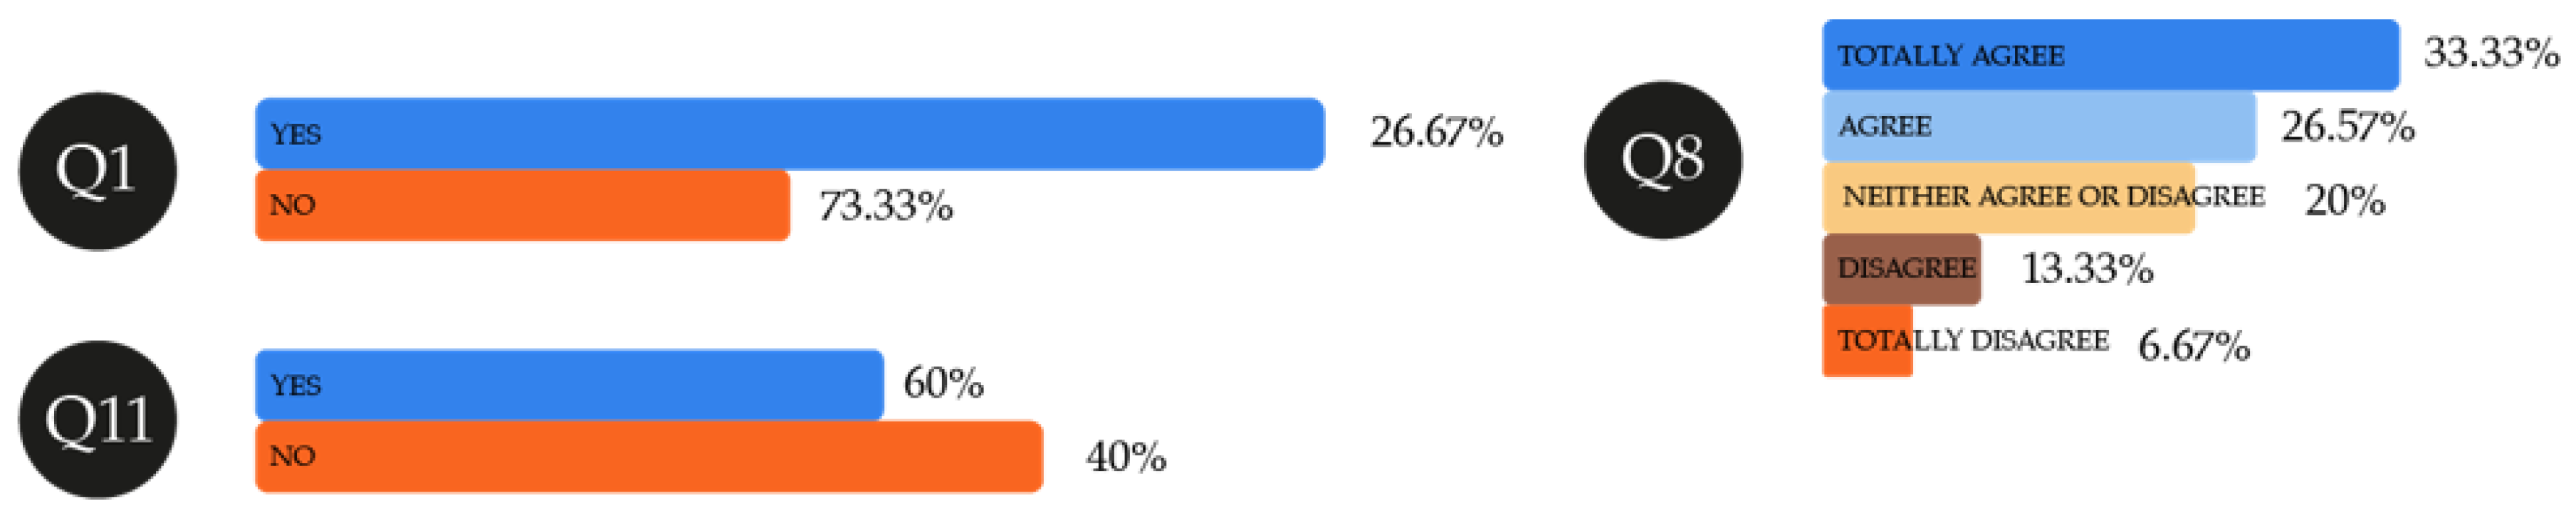
- Indicator of evaluation and impact on professionals.
Most of those interviewed (73.33%) were unaware of any tool that citizens might use to measure air quality instantaneously (
Figure 12). Others named tools such as aqicn.org, treatment of air quality by microfiltration and UV rays, while another was aware of a tool but could not remember its name. This may benefit and lend visibility to HealthyAIR, targeting a market in which there is a need for a product such as this. In times in which COVID-19 is highly present, it might prevent the condition of patients with respiratory pathologies from worsening. The professionals interviewed were in turn mostly in favor (60%) of taking part in research processes such as this and in giving their opinion and suggestions about it.
Those interviewed mostly believe (33.33% and 26.67%) in the possibilities of replicability open to the HealthyAIR tool and the major options it has for being personalized. This implies there is a very large market in which the application could cause a major social impact.
Q 1: I was aware of some type of scientific tool aimed at citizens that would enable air quality to be ascertained.
Q 8: The tool could be replicated with other types of respiratory disease caused by other air pollutants.
Q 11: It is important to give our opinion about scientific research processes such as this one.
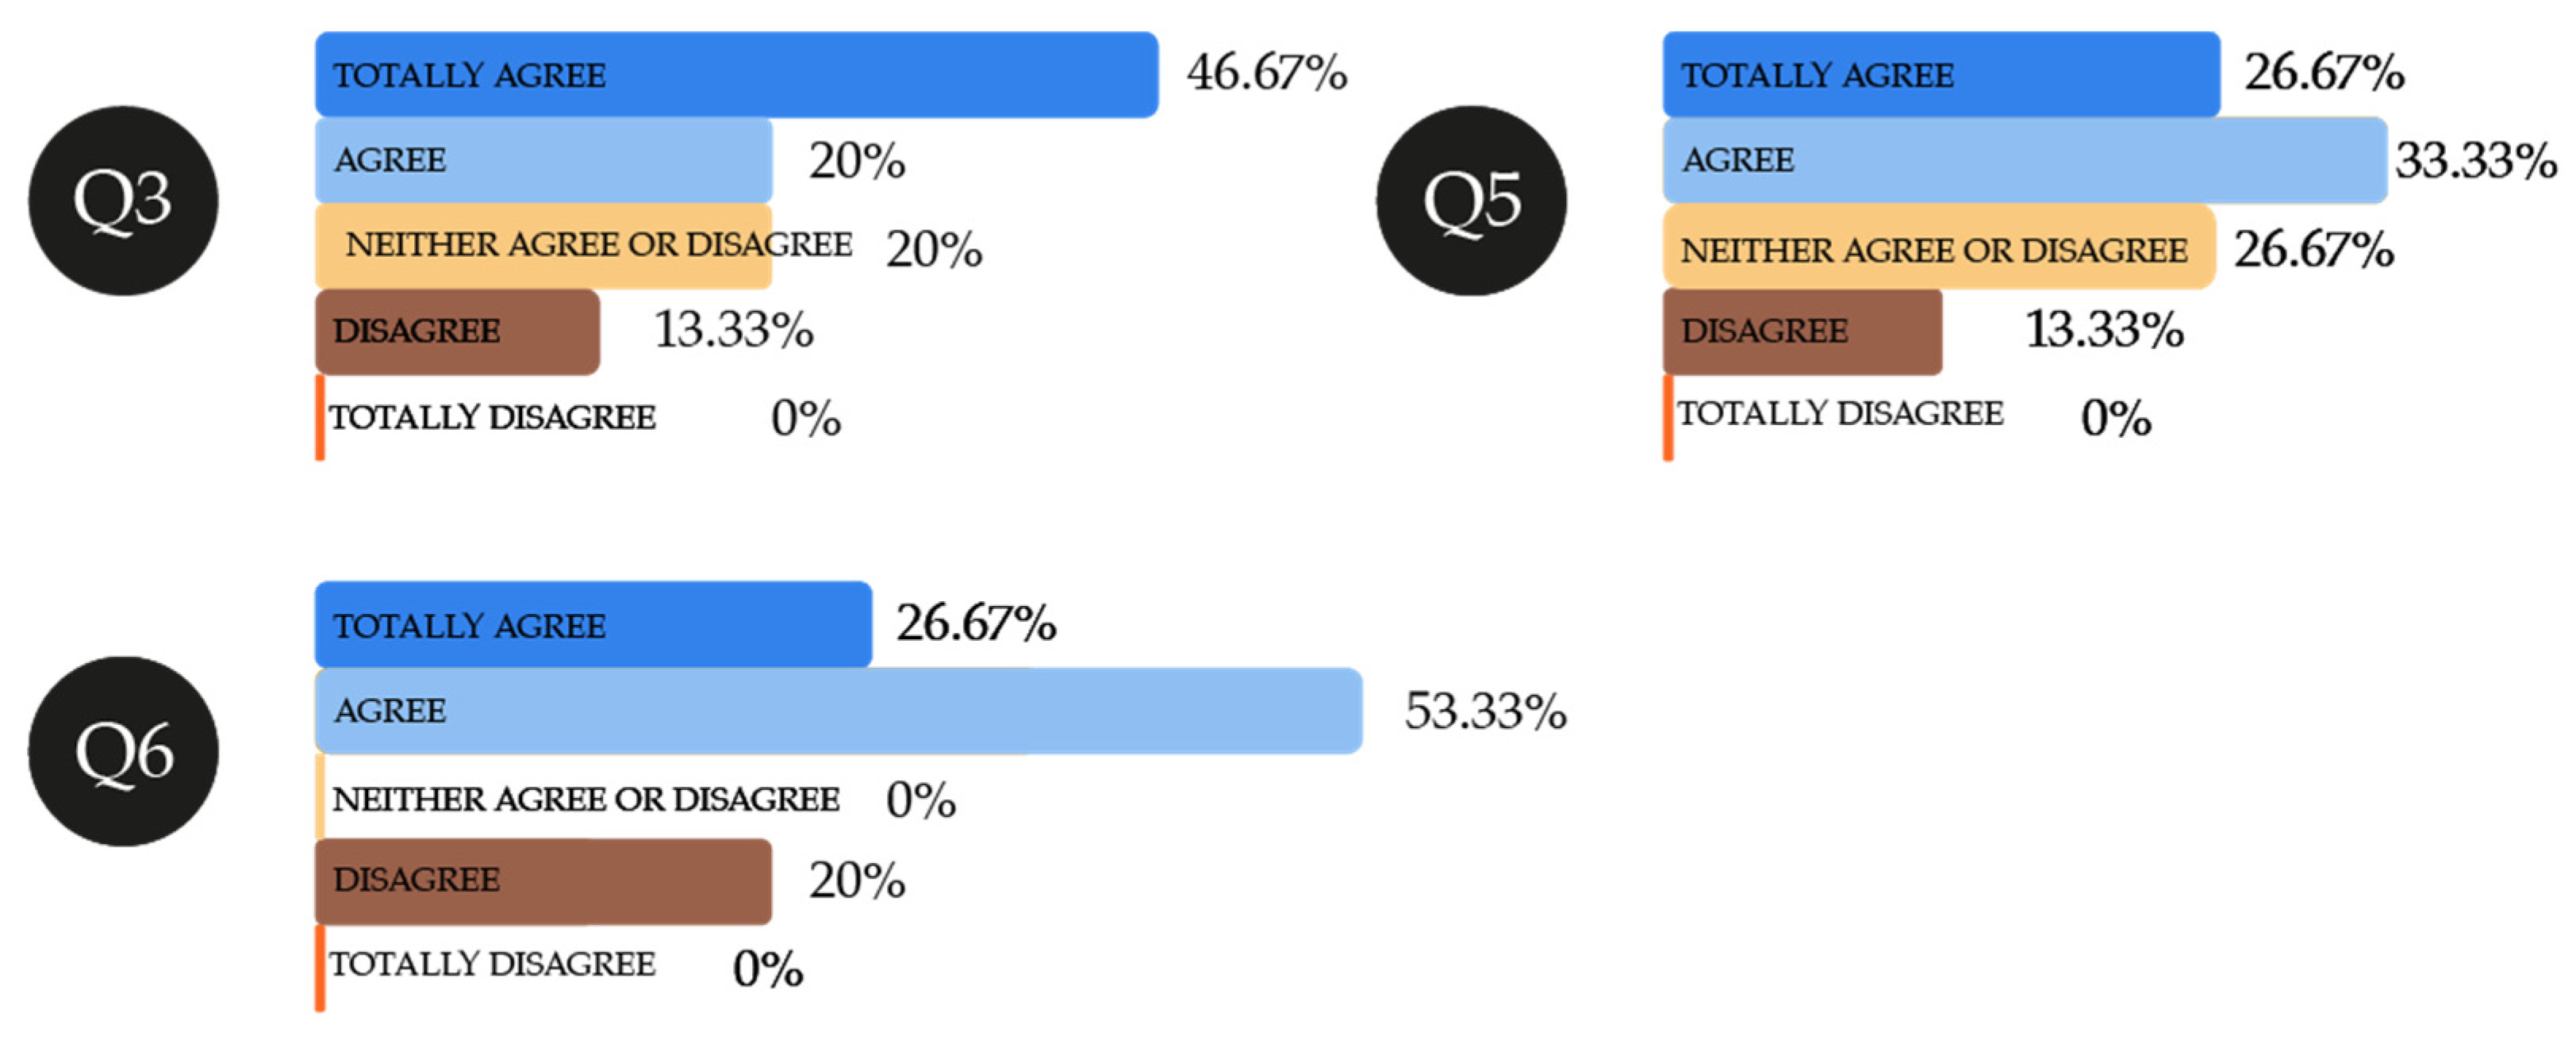
- Indicator of satisfaction with follow-up and treatment.
Nearly half of the experts interviewed totally agree that this tool might personalize data collection of those patients who use it, this ensuring their treatment is more effective (
Figure 13). Similarly, with HealthyAIR, 60% of those interviewed totally agree or agree that they would feel more involved in the monitoring process of cardiorespiratory pathologies in patients. In addition, 53.33% are also of the view that this clinical monitoring would be very effective.
Q 3: Data treatment or collection might be personalized with the new application, as opposed to other existing options.
Q 5: The tool would make me take part more in the treatment process.
Q 6: Better monitoring of patients’ pathology linked to air pollutants would be undertaken with this application.
3.1.2. On the Side of the Users
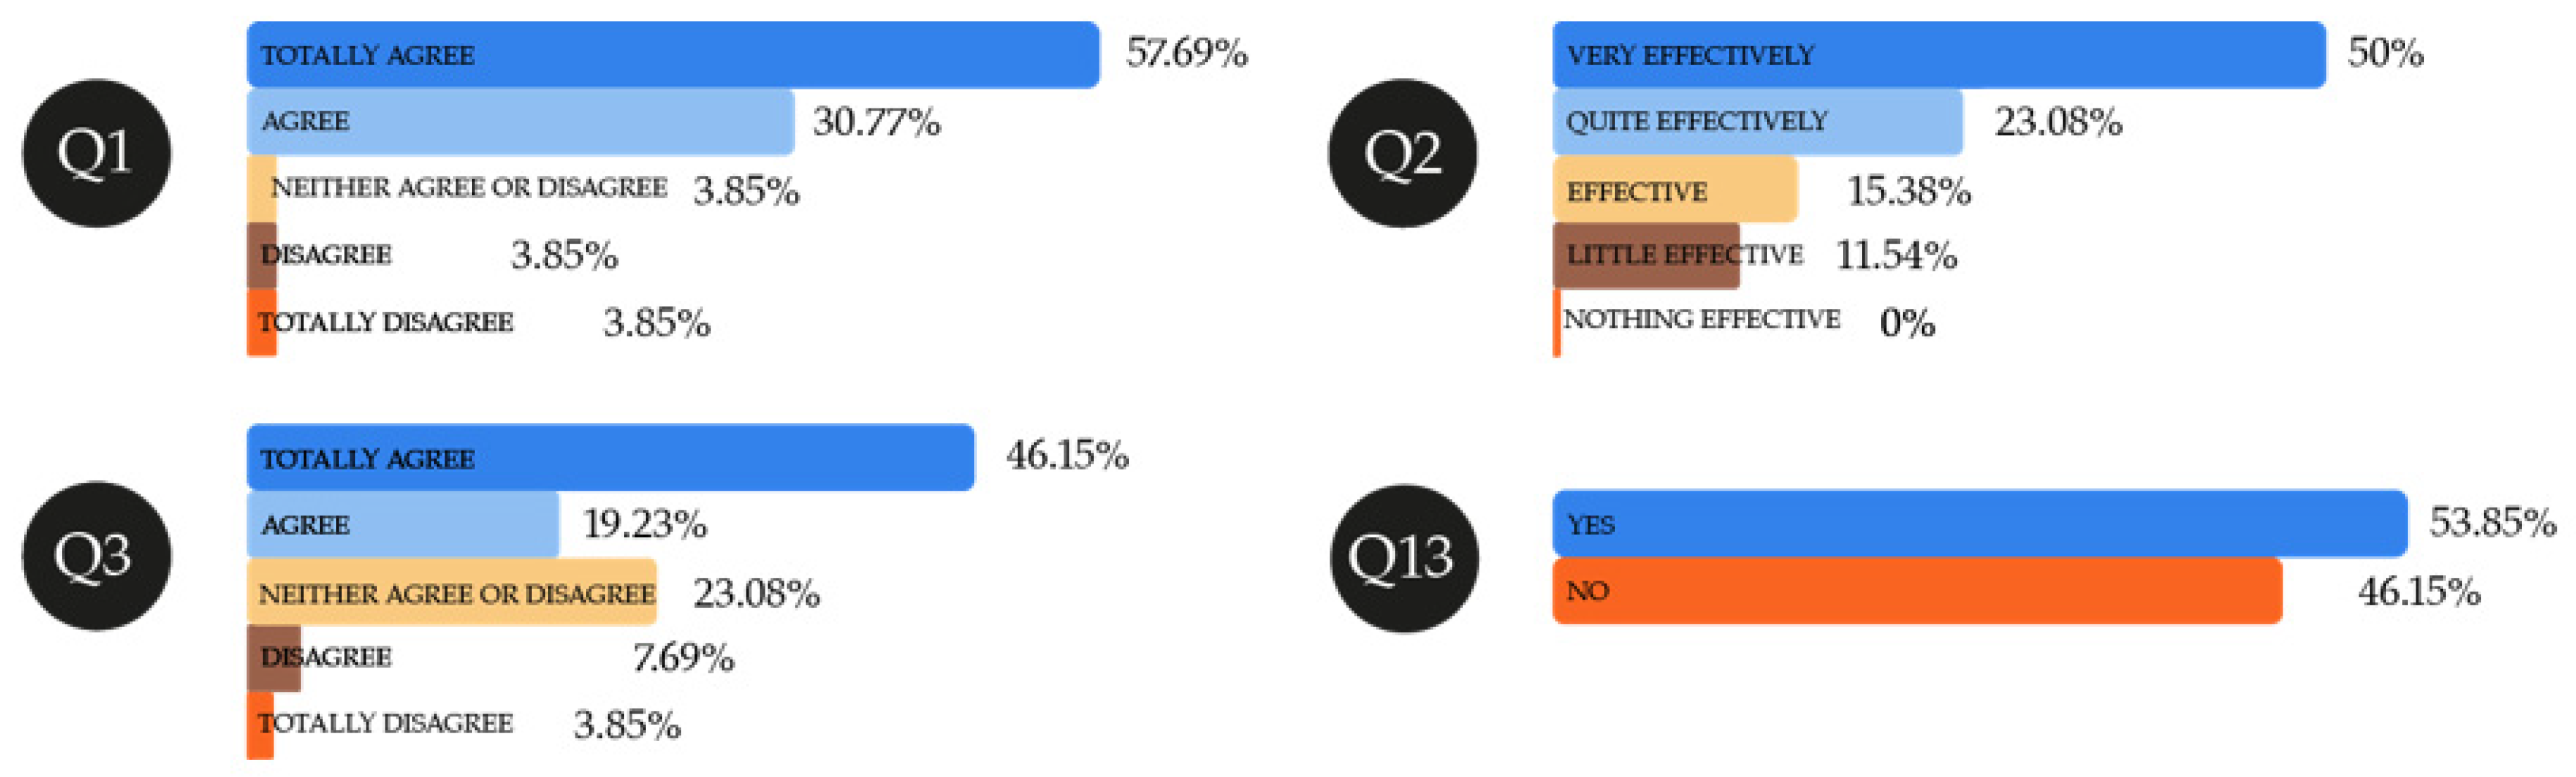
- Indicator of social improvement, health, and quality of life.
As regards to improving their quality of life, users are very convinced (57.69%) that the HealthyAIR tool should be a service that can be accessed by most, as half of them consider it to be an effective application for people with respiratory problems and, to a lesser extent (46.15%), to prevent complications arising in their respective pathologies (
Figure 14). All the data give a very positive value to the project in which user collaboration in improving the tool is important as a co-creation process. Thus, 53.85% of interviewees themselves believe that it is important for their opinion to be reflected in scientific research such as this.
Q 1: Patients with these types of pathology deriving from pollutants or even those who are healthy should have easy access to this type of service.
Q 2: This application would prove effective in treating people with cardiorespiratory problems.
Q 3: This application is able to prevent possible complications in pathologies deriving from air pollutants to which we are exposed.
Q 13: It is important to give my opinion about scientific research processes such as this.
- Indicator of improvements in the experience of the person.
None of the 25 users interviewed were aware of similar tools to HealthyAIR. This lack of awareness is somewhat contradictory, as technologies that are able to prevent and to improve symptoms of people with respiratory problems do exist on the market. Therefore, other projects should be studied in greater depth that may improve their quality of life and enable the social impact on this group to be increased. Indeed, among the experts interviewed, there was some engineers who were aware of tools that have a similar concept.
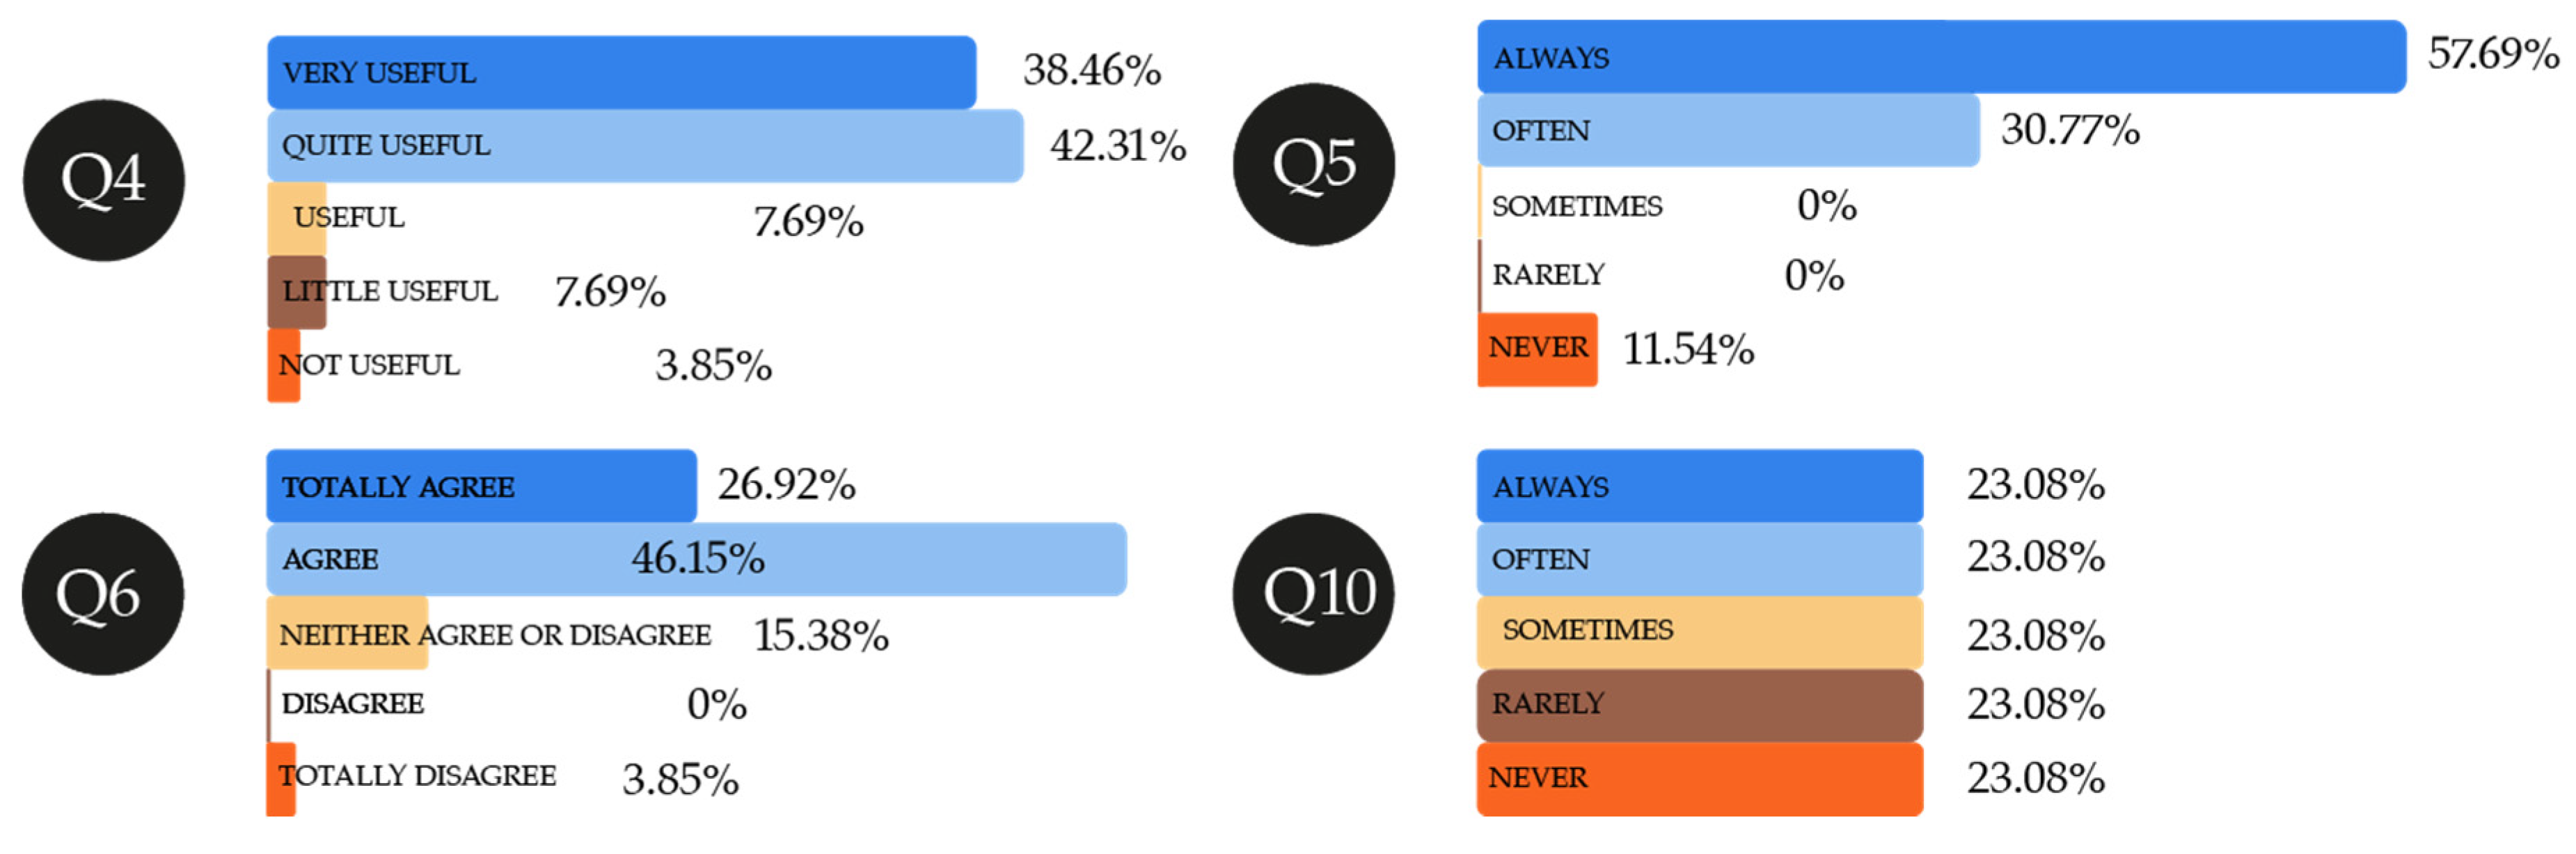
Special mention should be made of the fact HealthyAIR users would find an application quite useful (42.31%) or very useful (38.46%), which denotes the need for it (
Figure 15). Instantaneous access to data is another feature that interests the user, shown by the fact that they would use it always (57.69%) or often (30.77%). To be able to use the tool, those interviewed agree (46.15%) or totally agree (26.92%) that the application interface should be easy to handle. Lastly, the fact that the user may measure the presence of pollutants in the air is rated to a less significant extent.
Q 4: The usefulness of the tool’s portability and access to treatment or data.
Q 5: I would gain instant access to data whenever I needed it during the treatment process.
Q 6: The tool’s interface should be easy to use in order for it to be effective.
Q 10: The use of this new application would enable me to take any measurements I needed to.
Q 9: I was aware of some other tool before this application with which people could access any measurements of air pollutants they wanted or needed.
- Indicator of improvements in the environment.
Another increasingly important indicator is respect for the environment, as it will have a repercussion on our quality of life. According to the users interviewed, they quite agree (38.46%) or very much agree (38.46%) that changes in daily practices both on the part of patients and healthcare professionals could be achieved by developing this application (
Figure 16). Both would be able to reduce energy costs by its resulting in the need to travel less to healthcare centers, given that all data is stored in the cloud and may be used as an alarm in the event of any possible risks. There would be a decrease in the amount of time devoted to each patient, as they would be constantly monitored. This would, in turn, imply changes and savings in comparison to the use of other forms of therapy that may not provide the information that is provided by HealthyAIR in real time.
Q 7: My quality of life would improve with this new application, for instance in reducing travel time, available time, use of alternative technologies or ways of saving in comparison to other forms of therapy.
Recent advances in social impact monitoring and evaluation have contributed to an improved understanding of the range of impacts that such initiatives can bring [
30]. However, our hope for the future of conservation and environmental management is that social impacts will not only be measured, but that the results will also be applied in a meaningful way in order to maximize social benefits and minimize social costs. Corporate governance is an umbrella term and is the driving force behind corporate social responsibility. It can also be defined as an organization’s obligation to benefit society in ways that go beyond the primary business objective of maximizing profit [
31]. According to the principles of sustainable development, it is argued that organizations should make decisions not only based on economic or financial factors, but also on long-term social and environmental consequences.
- Indicator of improvements in services provided by healthcare personnel for better monitoring and treatment of pathology.
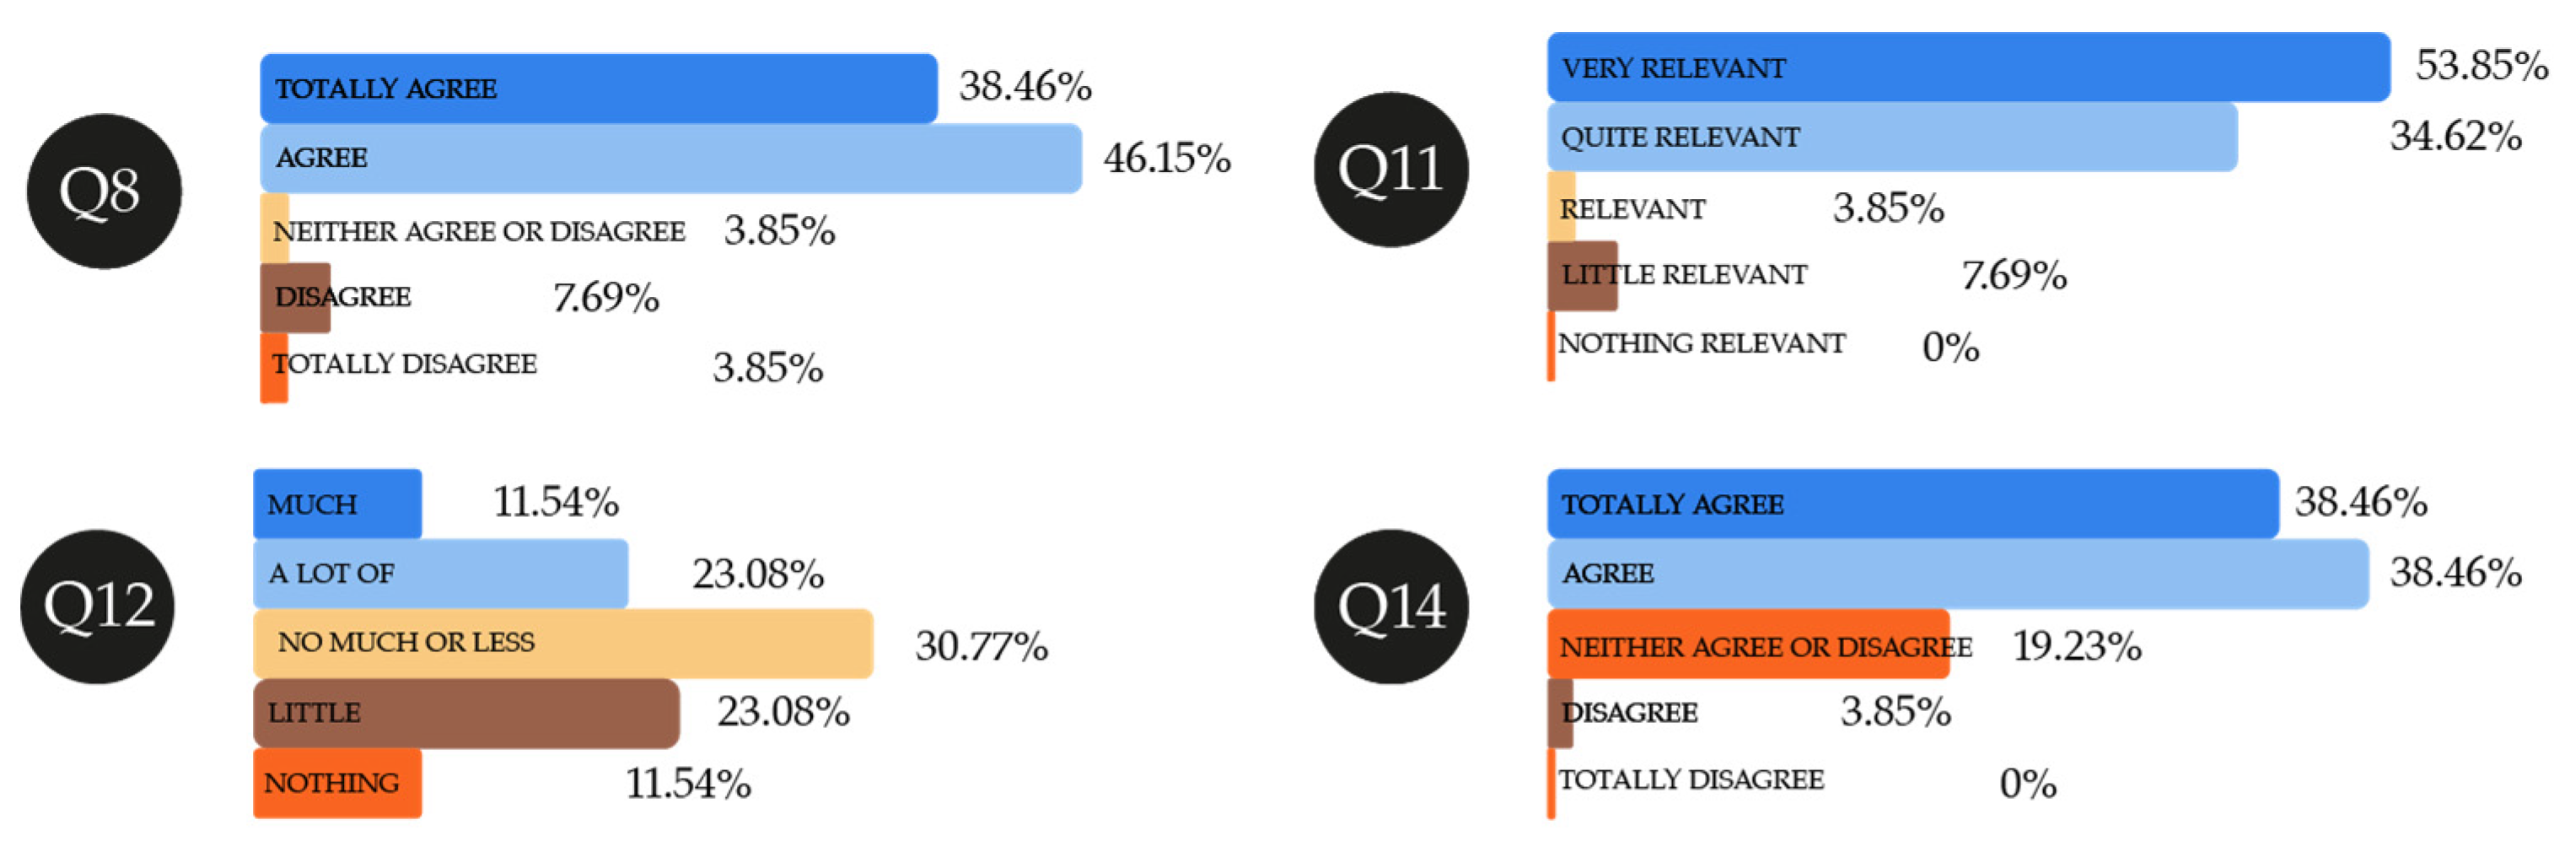
The users interviewed totally agree (38.46%) or agree (46.15%) with the fact that, using this application, healthcare personnel would be able to ensure better monitoring and treatment of their respiratory pathologies, mainly asthma or hay fever (
Figure 17). Users consider the information provided in the application guide to be somewhat relevant (30.77%), in order to thus understand the data obtained. This may mean they have not understood it well and that some corrections may need to be made to simplify the language and explanations contained in the guide. Those interviewed have only shared some (30.77%) of their knowledge of this application with other people, the same as in the case of healthcare professionals and engineers. This may be for the same reason, as it is a tool that is still in its phases of development. Lastly, users totally agree (38.46%) or agree (38.46%) that the application is beneficial in terms of complexity, entails an improvement in knowledge about the disease, and is useful in the case of absence of family or medical support.
Q 8: Healthcare personnel would monitor and treat the pathology better using this application.
Q 11: The information provided by researchers/engineers is important to be able to understand the data provided by the application.
Q 12: I have shared this knowledge with other people (friends, family, etc.).
Q 14: The process involving adaptation to an application such as this would be good in terms of complexity and knowledge about the disease, and in the case of absence of family or medical support.
All the above leads us to consider the HealthyAIR tool has a specific social impact on people who suffer from cardiorespiratory diseases caused by different pollutants. During periods of the pandemic owing to COVID-19, when the use of face masks is mandatory and special care needs to be taken to ensure these patients do not suffer any complications, the tool would seem to have a great potential for impact.
3.2. Social Impact Assessment
Based on the results obtained from the survey after the HealthyAIR tool was used by engineers, healthcare professionals, and end-users with and without cardiorespiratory diseases, social impact indicators have been applied for assessing the progress reported in relation to three Key Impact Pathways (1) “Addressing global challenges,” (2) “Achieving R&I missions”, and (3) “Engaging EU Citizens”. Particularly, the first and the second ones are highly relevant for measuring social impact since they have an explicit relationship to those expected improvements for society.
3.2.1. Addressing Global Challenges
The results provided reported that the use of the HealthyAIR tool can contribute to the efforts to combat air pollution and advance towards the Sustainable Development Goals SDG: 3 Good health and well-being, 7 Affordable and clean energy, and 11 Sustainable cities and communities [
32]. This contribution addresses some of the global challenges according to the short, mid, and long-term indicators as identified:
Short-term indicators: (a) Creation of a database containing personalized information about air pollution according to patient and predictability of risky situations via artificial intelligence (SDG: 3). (b) Increasing the knowledge among professionals and end-users about when air pollution affects us personally in external and internal environments (SDG: 3, 7, 11) and taking information at any given time as an alarm. (c) Endless replicability, as it can be adapted to any pollutant the person may need (SDG: 3, 11).
Mid-term indicators: (a) Technology transfer and adoption of new knowledge: a system to report systematically the number of changes in protocols, practices, and professional activity of healthcare professionals. (b) Technology transfer and adoption of new knowledge for users/patients who will have alarms at their disposal to warn them about immediate risks. (c) Technology transfer in educational engineering, other research groups, healthcare centers, and institutional bodies that may include and improve this knowledge by handling data about air pollution and how this affects citizens (SDG: 3, 7, 11). (d) Information that is easy to monitor and accessible to users/patients via mobile phones and, on the other hand, data that it is easy to monitor and be controlled by healthcare professionals who will have interfaces and combinations of relevant medical data at their disposal with which to make better diagnoses (SDG: 3). (e) Forecasting changes in protocols and health practices by monitoring patients with certain pathologies in new studies (SDG: 3). The information load would be low, as interested parties would gather information in new databases about air pollution.
Long-term indicators: (a) Social impact: number of qualitative and quantitative tests on technical and healthcare improvements as a result of knowledge transfer with regard to air pollution and repercussion on patients with respiratory pathologies, which other research groups or those pursuing new projects themselves would undertake. (b) Number of improvements in terms of the situation and previous protocols with regard to patients affected by respiratory pathologies that deal with the specific challenges attached to the project (SDG: 3, 7, 11). (c) Possibility of replicability and sustainability regarding such improvements a certain number of times by manufacturing new portable boxes, using different sensors. Carrying out other, more personalized tests and improving portability. (d) Verifying the social impact of research on social media: Twitter, Facebook, The Conversation, number of papers downloaded onto databases, number of citations, etc.
3.2.2. Achieving R&I Missions
The use of the HealthyAIR tool aligns with the European research and innovation missions approach that aims to deliver solutions to issues that have a societal relevance, for example, the ability to improve health, nutrition, or the living environment [
33]. The contribution of the HealthyAIR to achieve some of these missions in the short, mid, and long-term have been assessed as follows:
Short-term indicators: (a) Register the HealthyAIR usefulness model and extend the knowledge reported from this research to other areas of knowledge such as the detection of allergies and healthiness in foods. This will provide added value to other research in the area, thus ensuring a social impact in the future.
Mid-term indicators: (a) Technology transfer and adoption of new knowledge related to develop two prototypes of a new hFOOD tool that is able to predict food allergies and healthiness in foods.
Long-term indicators: (a) Developing new funded research into foods obtained based on the success and utility of HealthyAIR. (b) Amount of repercussion on society shared via social media that is linked to objectives of the research addressing R&I missions, according to number of projects funded and number of end users reached as a result of HealthyAIR being extended to food analysis (hFOOD).
3.2.3. Engaging EU Citizens
Engaging the participants in the co-creation of knowledge is a complex process in which multiple stakeholders are involved [
34] but it is more needed for advancing towards social impact. In the case of testing the HealthyAIR tool, participants are engaged and the progress has been assessed in the short-term, mid-term, and long-term:
Short-term indicators: (a) Users and professionals (engineers and healthcare personnel) take part in the process and are involved in co-creating different activities with regard to health and well-being, sustainability of cities, and non-pollutant energies. All the participant, engineers, users, and healthcare personnel received a brochure with all the information regarding the project development, test of the tool, and survey. Afterwards, they used the box equipped with sensors and we tested them again to check how easy it was to use it and its effectiveness in detecting pollutants. This process included co-creation with feedback. The process it is easily replicable.
Mid-term indicators: (a) 8 types of publication or event aimed at fostering citizens’ participation in the creation and use of scientific tests to improve forecasting and improvement in diagnoses of patients with respiratory diseases (asthma, allergy to dust, and effects caused by sulfur dioxide passing through the mouth using face masks).
Long-term indicators: (a) Dissemination via 10 types of publication aimed at fostering citizens’ participation in the creation and use of scientific tests to improve forecasting and improvement in diagnoses of patients with respiratory diseases (asthma, allergy to dust, and effects caused by sulfur dioxide passing through the mouth using face masks-COVID). (b) Measuring citizens’ participation on social media regarding activities, programs, products, and innovations based on the project.
3.3. Limitations
Whereas the study has made a contribution to the field of social impact assessment, several limitations must be acknowledged. First, we must acknowledge the number of participants was limited to 40 respondents. So that, given this sample, the results of this study cannot be generalized to a wider population. It must be taken into account the data collection for the study was carried out during the beginning of the state of alarm decreed by the Spanish government due to the COVID-19 health crisis. So that, this exceptional situation has entailed a limitation in reaching a wider sample. Despite the affordances of the tool for its replicability, further research should be conducted to expand and extend the social impact of the tool.
In addition, due to the compulsory confinement in Spain, there was a geographical limitation in the analysis of atmospheric pollutants. This analysis was more local than expected, focusing on two regions, a larger city like Bilbao (Vizcaya) and a smaller one like Miranda de Ebro (Burgos). So, our results must be considered within the context in which they were obtained.
In order to address the limitations identified, further studies can incorporate the analysis of other geographical areas, participants from other profiles, so that the artificial intelligence module that makes the prediction can learn from user profiles with different characteristics in terms of age, social background, level of handling of technology. A longitudinal analysis of the medium- and long-term social impact would also make a relevant contribution to this field.
4. Conclusions
HealthyAIR is a new tool which, from the social impact standpoint, enables more personalized and controlled monitoring of risks to be carried out in the case of respiratory pathologies. It has a direct impact on patients, as it helps them to adjust the places that they pass through according to the amount of pollution present there. This improvement is aligned with the social impact indicators established in the Key Impact Pathway “Addressing global challenges”—specifically, an improvement in their awareness about when air pollutants affect us in external and internal environments is noted. In this sense, it is a short-term improvement indicator in line with some of the targets set out in SGD 3, 7, and 11.
For healthcare personnel, the use of this tool implies a major change in their work practice, as they would receive additional information about the ecosystem in which the patient circulates, which would in turn help the former to personalize symptoms and treatment. This would also help to prevent such respiratory failure, which would translate into an improvement in the sustainability of the healthcare system. Its use would enable authorities to have the option of improving their health prevention policies and programs, which would have a significant repercussion on improvement in the quality of life of these patients. Thus, a potential social impact may be identified in the future in the Key Impact Pathway “Supporting policy-making” owing to the contribution of these advances in increasing and including this knowledge in reports, projects, and programs deriving from the personalization and prevention of respiratory diseases. On a knowledge level, the impact following the implementation of the system directly affects engineers and trading companies insofar as they benefit from it with a view to improving their products and include new functions. This is directly related to the scalability feature associated with the social impact of the research. Specifically, this would help to make advances in the replicability of HealthyAIR, by meeting one of the social impact criteria pointed out in SIOR, in which replicability of the impact as the actions based on the project findings have been successfully implemented in more than one context [
35].
Indeed, replicability of this project is expected to be on a major scale since it can be implemented in different contexts such as those of allergen particles in the air—an area that has a huge impact on people given the percentage growth of pollen allergies or other suspended particles detected in children and adults. At present, this technological solution might be used to prevent a worsening in condition and cardiorespiratory failure both in patients with COVID-19 and other relatively new viruses that affect the respiratory system.
The co-creation process has been closely taken into account over the course of this project, in which possible users of the application were asked to provide their suggestions. This will help to improve future HealthyAIR prototypes, technology transfer, and the adoption of new knowledge in the short term. Along the same lines, the analysis of projects that have shown to achieve social impact conducted by Aiello and colleagues [
35] revealed that the participation of a range of players in the co-creation of knowledge is required to achieve such an impact. This process implies going beyond the mere dissemination of results, enabling collaboration to be established that may make it easier to co-create knowledge within the framework of the project.
When HealthyAIR moves on to the commercialization phase, the aim is to simplify user guides to make them easier to understand, as certain weaknesses were detected in this sense during the research phase. Users interviewed think the quality of clinical monitoring of their respiratory pathologies would be highly effective when using this tool and that it should be a service accessible to the majority, since it would seem to be a very useful application. HealthyAIR might also reduce environmental costs, as patients would need to travel less to healthcare centers thanks to a lower risk of accessing highly-polluted areas. Furthermore, the tool would warn them and the patient would have the option of readjusting their daily habits and routines. In terms of healthcare costs, there would be less consultation time set aside for each patient, and also a reduction in consumption of medication, due to the fact that respiratory failure would be reduced by the forecasting component associated with HealthyAIR. All the data reinforce the clear sustainable nature of the tool.
The social impact indicators analyzed in this article have focused on advancing towards the following Sustainable Development Goals: 3 Good health and well-being, 7 Affordable and clean energy, and 11 Sustainable cities and communities. Although the results have contributed to achieve this goal, we can conclude that, in the short term, the HealthyAIR tool attains the milestones we have listed, in the medium and long term the project and projections we have established will need to be monitored in terms of: publications and congresses, dissemination in the media, new co-creation processes, prototype improvements, development of other projects that may arise from this one such as hFOOD (which detects allergens in foods), and future changes in social policies.

 ,
, 


