Investigating the Potential of Radar Interferometry for Monitoring Rural Artisanal Cobalt Mines in the Democratic Republic of the Congo

 ,
,  ,
,  and
and
Abstract
1. Introduction
2. Materials and Methods
2.1. Study Area
2.2. Sentinel-1 ISBAS Processing
2.3. Mine Identification
2.4. Statistical Analysis
2.5. ASM Activity
3. Results
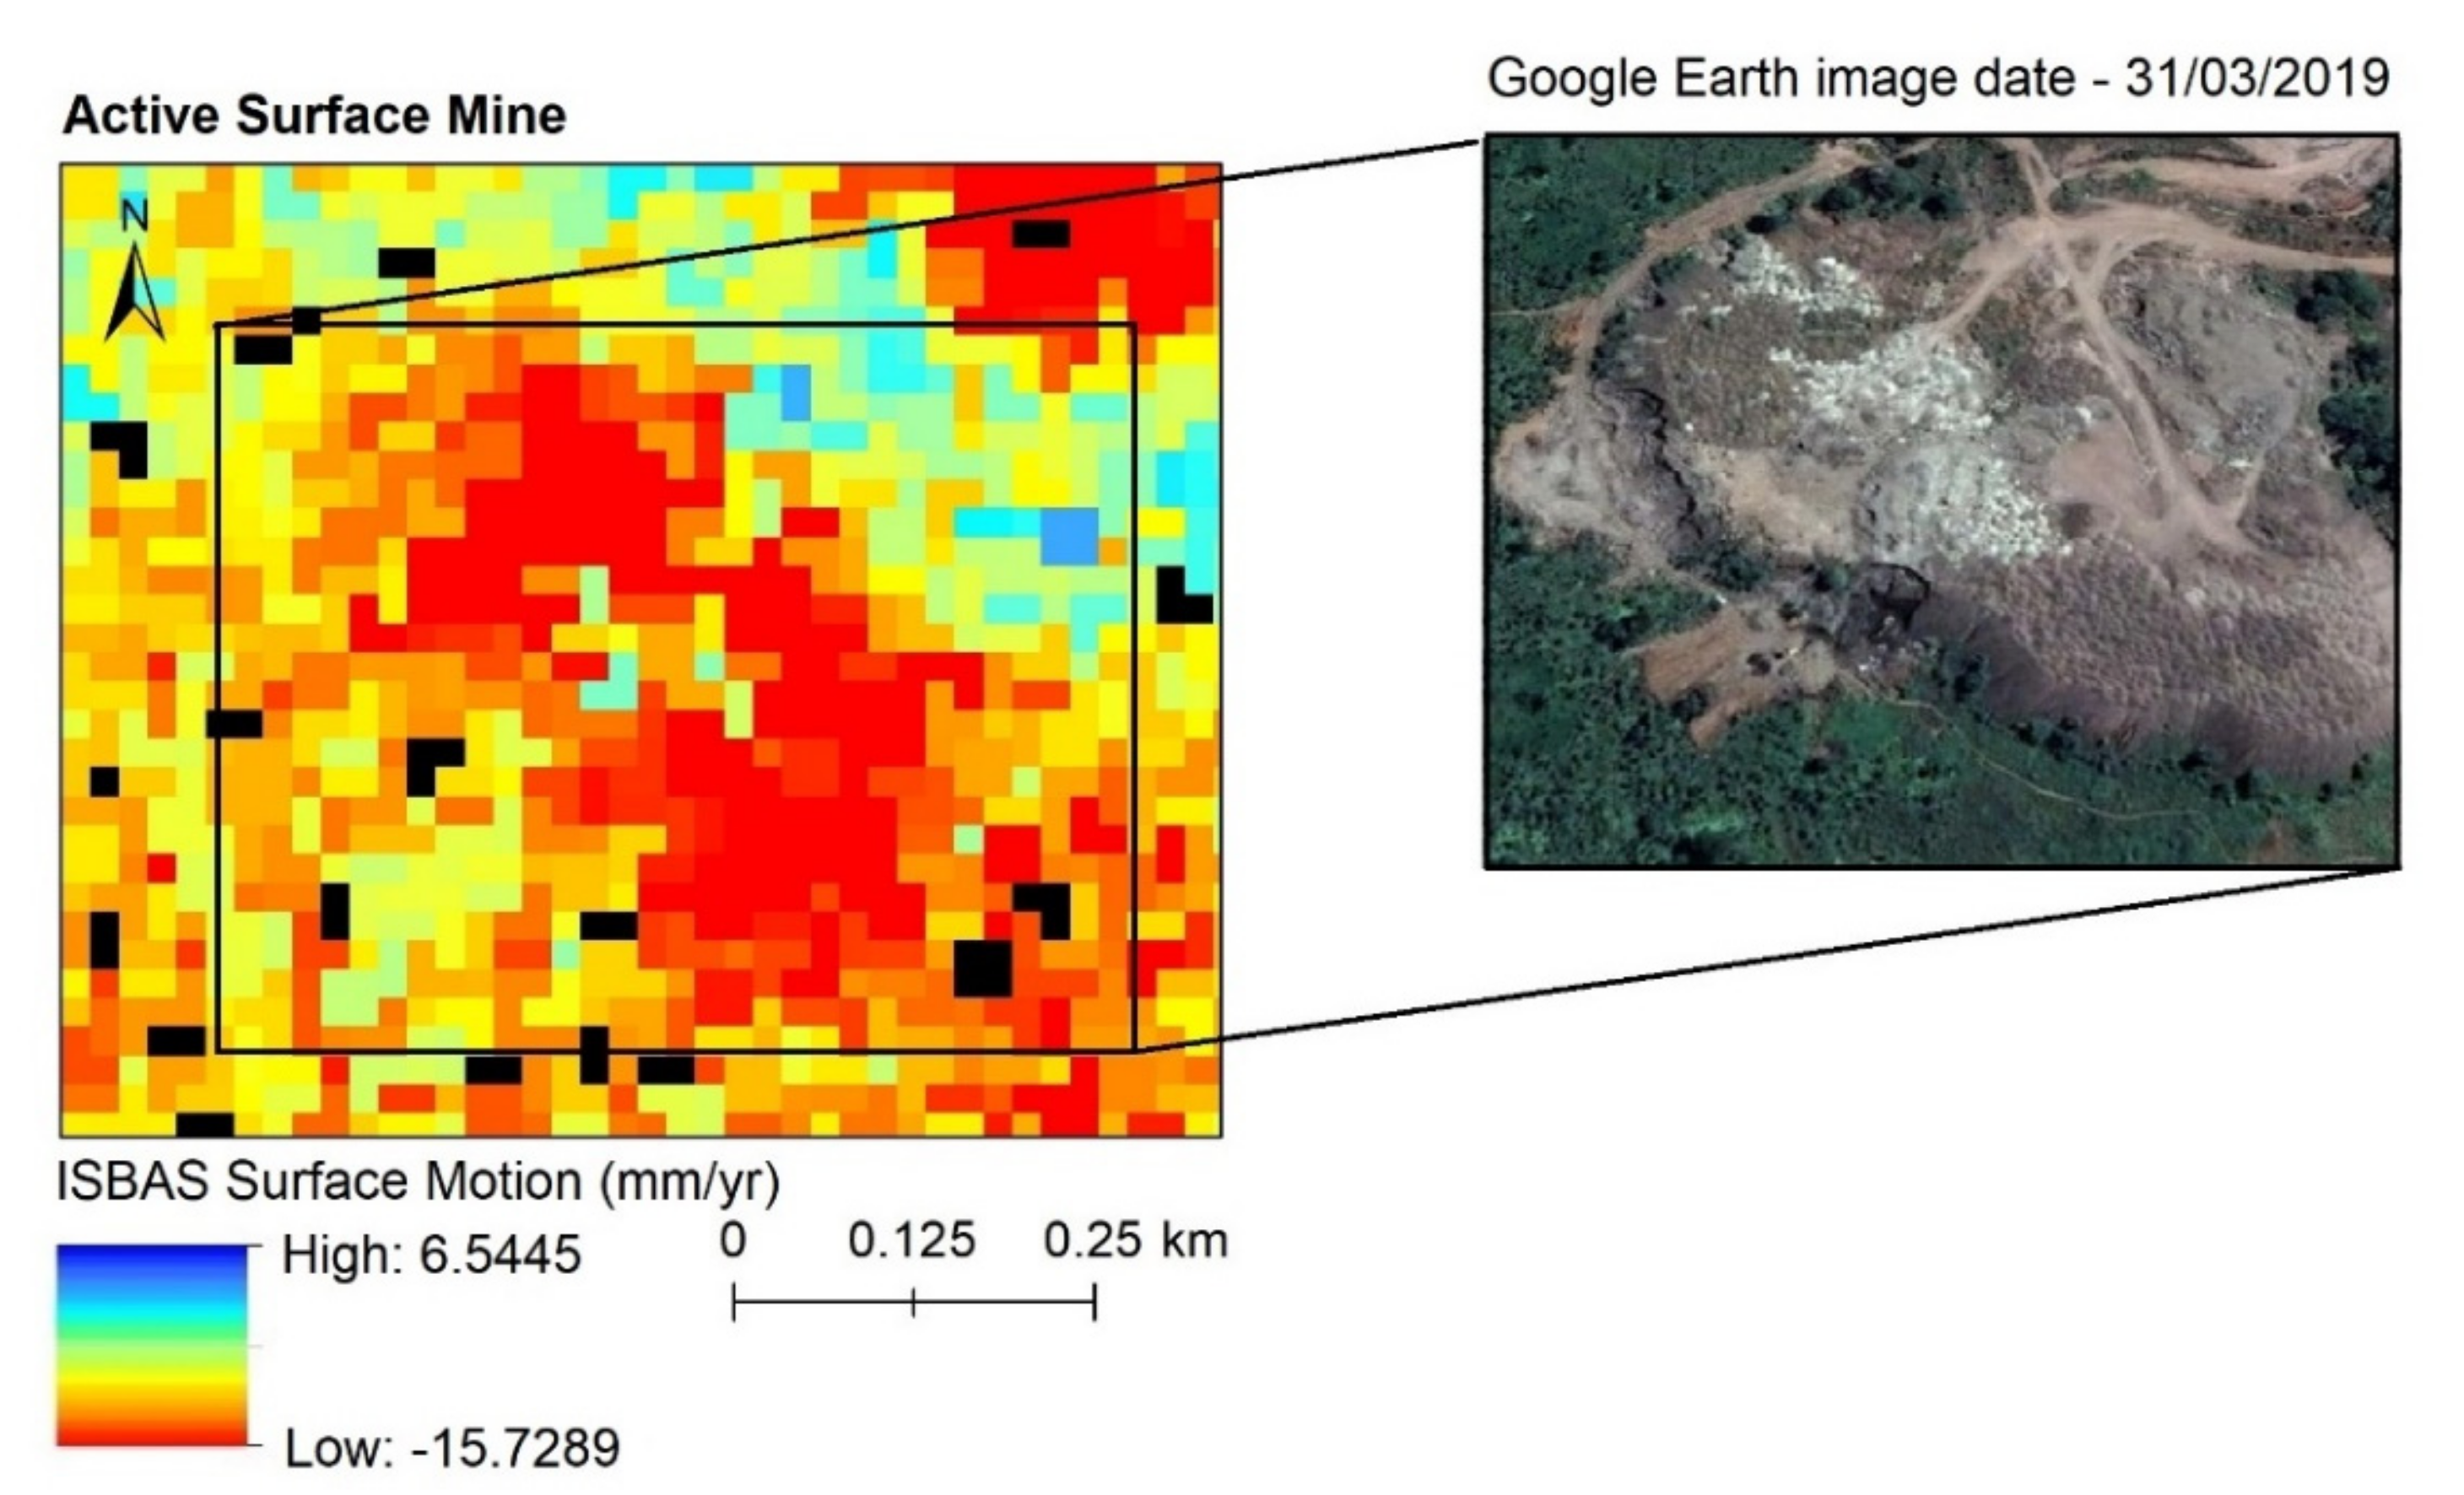
3.1. ISBAS Surface Motion Outputs
3.2. Mine Identification
3.3. Statistical Analysis
3.4. ASM Activity
4. Discussion
5. Conclusions
Author Contributions
Funding
Acknowledgments
Conflicts of Interest
References
- Financial Times. Dozens Die on Congo Mine Accident. Available online: https://www.ft.com/content/aea51eb0-98c7-11e9-8cfb-30c211dcd229 (accessed on 25 October 2019).
- Financial Times. Congo, Child Labour and Your Electric Car. Available online: https://www.ft.com/content/c6909812-9ce4-11e9-9c06-a4640c9feebb (accessed on 25 October 2019).
- Financial Times. Glencore in New Cobalt Supply Deal with South Korean Battery Maker. Available online: https://www.ft.com/content/9413aeaa-16b1-11ea-9ee4-11f260415385 (accessed on 16 February 2020).
- The Wall Street Journal. Despite Cleanup Vows, Smartphones and Electric Cars Still Keep Miners Digging by Hand in Congo. Available online: https://www.wsj.com/articles/smartphones-electric-cars-keep-miners-digging-by-hand-in-congo-1536835334 (accessed on 27 October 2019).
- CNN. CNN Discovers Child Labor in Cobalt Trade. Available online: https://edition.cnn.com/videos/world/2018/05/02/cnn-freedom-project-electric-cars-cobalt-elbagir-pkg.cnn (accessed on 25 October 2019).
- Walt, V.; Meyer, S. Blood, Sweat, and Batteries. Available online: https://pulitzercenter.org/reporting/blood-sweat-and-batteries (accessed on 27 October 2019).
- Amnesty International. Time to Recharge: Corporate Action and Inaction to Tackle Abuses in the Cobalt Supply Chain. Available online: https://www.amnesty.org/en/documents/afr62/7395/2017/en/ (accessed on 10 January 2020).
- Church, C.; Crawford, A. Green Conflict Minerals: The Fuels of Conflict in the Transition to a Low-Carbon Economy: IISD Report. International Institute for Sustainable Development. Available online: https://www.iisd.org/publications/green-conflict-minerals-fuels-conflict-transition-low-carbon-economy (accessed on 2 May 2020).
- OECD. Interconnected Supply Chains: A Comprehensive Look at Due Diligence Challenges and Opportunities SOURCING Cobalt and Copper from the Democratic Republic of the Congo. Available online: https://mneguidelines.oecd.org/interconnected-supply-chains-a-comprehensive-look-at-due-diligence-challenges-and-opportunities-sourcing-cobalt-and-copper-from-the-drc.htm (accessed on 10 January 2020).
- Bundesanstalt für Geowissenschaften und Rohstoffe. Mapping of the Artisanal Cobalt Mining Sector in the Provinces of Haut-Katanga and Lualaba in the Democratic Republic of the Congo. Available online: https://www.bgr.bund.de/EN/Themen/Min_rohstoffe/Downloads/studie_BGR_kupfer_kobalt_kongo_2019_en.html (accessed on 10 January 2020).
- Faber, B.; Krause, B.; Sánchez de la Sierra, R. Artisanal Mining, Livelihoods, and Child Labor in the Cobalt Supply Chain of the Democratic Republic of Congo. Centre for Effective Global Action Policy Report. Available online: https://escholarship.org/uc/item/17m9g4wm (accessed on 7 April 2020).
- O’Driscoll, D. Overview of Child Labor in the Artisanal and Small-Scale Mining Sector in Asia and Africa. Available online: https://assets.publishing.service.gov.uk/media/5a5f34feed915d7dfb57d02f/209-213-Child-labour-in-mining.pdf (accessed on 16 February 2020).
- Amnesty International. “This is what We Die For”: Human Rights Abuses in the Democratic Republic of the Congo Power the Global Trade in Cobalt. Available online: https://www.amnesty.org/en/documents/afr62/3183/2016/en/ (accessed on 25 October 2019).
- Bannock Consulting. Vulnerability of Artisanal and Small-Scale Mining to Commodity Price Fluctuation. Available online: https://assets.publishing.service.gov.uk/media/57a08c9640f0b652dd00140e/C40PAPER5.pdf (accessed on 5 May 2020).
- Guardian. “Is your phone Tainted by the Misery of the 35,000 Children in Congo’s Mines?”. Available online: https://www.theguardian.com/global-development/2018/oct/12/phone-misery-children-congo-cobalt-mines-drc (accessed on 14 August 2019).
- Transport & Environment. Cobalt from Congo: How to Source it Better. Comparative Analysis of Existing Supply Chain Certification Schemes and Artisanal Practices. Available online: https://www.transportenvironment.org/sites/te/files/publications/Cobalt%20from%20Congo_how%20to%20source%20it%20better_Final.pdf (accessed on 10 January 2020).
- Davies, D. Restrictions on Sourcing of Cobalt are Changing. Available online: https://www.pv-magazine.com/2020/03/10/restrictions-on-sourcing-of-cobalt-are-changing/ (accessed on 7 April 2020).
- International Rights Advocates (Attorneys for Plaintiffs) v Apple Inc., Alphabet Inc., Dell Inc., Microsoft Inc., and Tesla. United States District Court for the District of Columbia, Case 1:19-cv-03737. Filed 12/15/19. Available online: http://iradvocates.org/sites/iradvocates.org/files/stamped%20-Complaint.pdf (accessed on 29 May 2020).
- Financial Times. China’s Top Cobalt Producer Halts Buying from Congo Miners. Available online: https://www.ft.com/content/ce9af944-fb70-4576-88d0-dc76821facfd (accessed on 29 May 2020).
- Reuters. Column: Congo’s Move to Control Artisanal Cobalt is Double-Edged. Available online: https://uk.reuters.com/article/uk-cobalt-congo-ahome/column-congos-move-to-control-artisanal-cobalt-is-double-edged-idUKKBN2011HE (accessed on 29 May 2020).
- Freedom United. The Democratic Republic of Congo’s Bid to Stamp out Child Labor in Cobalt Sector. Available online: https://www.freedomunited.org/news/congos-bid-to-stamp-out-child-labor-in-cobalt-sector/ (accessed on 7 April 2020).
- Estoque, R.C. A Review of the Sustainability Concept and the State of SDG Monitoring Using Remote Sensing. Remote Sens. 2020, 12, 1770. [Google Scholar] [CrossRef]
- Giuliani, G.; Mazzetti, P.; Santoro, M.; Nativi, S.; Van Bemmelen, J.; Colangeli, G.; Lehmann, A. Knowledge generation using satellite earth observations to support sustainable development goals (SDG): A use case on Land degradation. Int. J. Appl. Earth Obs. Geoinf. 2020, 88, 102068. [Google Scholar] [CrossRef]
- Anderson, K.; Ryan, B.; Sonntag, W.; Kavvada, A.; Friedl, L. Earth observation in service of the 2030 Agenda for Sustainable Development. Geo-Spat. Inf. Sci. 2017, 20, 77–96. [Google Scholar] [CrossRef]
- Foody, G.M.; Ling, F.; Boyd, D.S.; Li, X.; Wardlaw, J. Earth observation and machine learning to meet Sustainable Development Goal 8.7: Mapping sites associated with slavery from space. Remote Sens. 2019, 11, 266. [Google Scholar] [CrossRef]
- Brown, D.; Boyd, D.S.; Brickell, K.; Ives, C.D.; Natarajan, N.; Parsons, L. Modern slavery, environmental degradation and climate change: Fisheries, field, forests and factories. Environ. Plan. Nat. Space 2019. [Google Scholar] [CrossRef]
- Jackson, B.; Bales, K.; Owen, S.; Wardlaw, J.; Boyd, D.S. Analysing slavery through satellite technology: How remote sensing could revolutionise data collection to help end modern slavery. J. Mod. Slavery 2018, 4, 169–199. [Google Scholar]
- Boyd, D.S.; Jackson, B.; Wardlaw, J.; Foody, G.M.; Marsh, S.; Bales, K. Slavery from space: Demonstrating the role for satellite remote sensing to inform evidence-based action related to UN SDG number 8. ISPRS J. Photogramm. Remote Sens. 2018, 142, 380–388. [Google Scholar] [CrossRef]
- Rosen, P.A.; Hensley, S.; Joughin, I.R.; Li, F.K.; Madsen, S.N.; Rodriguez, E.; Goldstein, R.M. Synthetic aperture radar interferometry. Proc. IEEE 2000, 88, 333–382. [Google Scholar] [CrossRef]
- Massonnet, D.; Feigl, K.L. Radar interferometry and its application to changes in the Earth’s surface. Rev. Geophys. 1998, 36, 441–500. [Google Scholar] [CrossRef]
- Yang, Z.; Li, Z.; Zhu, J.; Yi, H.; Hu, J.; Feng, G. Deriving dynamic subsidence of coal mining areas using InSAR and logistic model. Remote Sens. 2017, 9, 125. [Google Scholar] [CrossRef]
- Ng, A.H.M.; Ge, L.; Zhang, K.; Chang, H.C.; Li, X.; Rizos, C.; Omura, M. Deformation mapping in three dimensions for underground mining using InSAR–Southern highland coalfield in New South Wales, Australia. Int. J. Remote Sens. 2011, 32, 7227–7256. [Google Scholar] [CrossRef]
- Perski, Z.; Hanssen, R.; Wojcik, A.; Wojciechowski, T. InSAR analyses of terrain deformation near the Wieliczka Salt Mine, Poland. Eng. Geol. 2009, 106, 58–67. [Google Scholar] [CrossRef]
- Yuan, W.; Wang, Q.; Fan, J.; Li, H. Mining land subsidence monitoring using Sentinel-1 SAR data. International Archives of the Photogrammetry. Remote Sens. Spat. Inf. Sci. 2017, 42, 655–658. [Google Scholar]
- Hu, Z.; Ge, L.; Li, X.; Zhang, K.; Zhang, L. An underground-mining detection system based on DInSAR. IEEE Trans. Geosci. Remote Sens. 2012, 51, 615–625. [Google Scholar] [CrossRef]
- Sowter, A.; Bateson, L.; Strange, P.; Ambrose, K.; Syafiudin, M.F. DInSAR estimation of land motion using intermittent coherence with application to the South Derbyshire and Leicestershire coalfields. Remote Sens. Lett. 2013, 4, 979–987. [Google Scholar] [CrossRef]
- Crosetto, M.; Monserrat, O.; Cuevas-González, M.; Devanthéry, N.; Crippa, B. Persistent scatterer interferometry: A review. ISPRS J. Photogramm. Remote Sens. 2016, 115, 78–89. [Google Scholar] [CrossRef]
- Sowter, A.; Amat, M.B.C.; Cigna, F.; Marsh, S.; Athab, A.; Alshammari, L. Mexico City land subsidence in 2014–2015 with Sentinel-1 IW TOPS: Results using the Intermittent SBAS (ISBAS) technique. Int. J. Appl. Earth Obs. Geoinf. 2016, 52, 230–242. [Google Scholar] [CrossRef]
- Grebby, S.; Orynbassarova, E.; Sowter, A.; Gee, D.; Athab, A. Delineating ground deformation over the Tengiz oil field, Kazakhstan, using the Intermittent SBAS (ISBAS) DInSAR algorithm. Int. J. Appl. Earth Obs. Geoinf. 2019, 81, 37–46. [Google Scholar] [CrossRef]
- Gee, D.; Sowter, A.; Novellino, A.; Marsh, S.; Gluyas, J. Monitoring land motion due to natural gas extraction: Validation of the Intermittent SBAS (ISBAS) DInSAR algorithm over gas fields of North Holland, the Netherlands. Mar. Pet. Geol. 2016, 77, 1338–1354. [Google Scholar] [CrossRef]
- Novellino, A.; Cigna, F.; Sowter, A.; Ramondini, M.; Calcaterra, D. Exploitation of the Intermittent SBAS (ISBAS) algorithm with COSMO-SkyMed data for landslide inventory mapping in north-western Sicily, Italy. Geomorphology 2017, 280, 153–166. [Google Scholar] [CrossRef]
- Alshammari, L.; Boyd, D.S.; Sowter, A.; Marshall, C.; Andersen, R.; Gilbert, P.; Marsh, S.; Large, D.J. Use of Surface Motion Characteristics Determined by InSAR to Assess Peatland Condition. J. Geophys. Res. Biogeosci. 2020, 125, e2018JG004953. [Google Scholar] [CrossRef]
- Alshammari, L.; Large, D.J.; Boyd, D.S.; Sowter, A.; Anderson, R.; Andersen, R.; Marsh, S. Long-term peatland condition assessment via surface motion monitoring using the ISBAS DInSAR technique over the Flow Country, Scotland. Remote Sens. 2018, 10, 1103. [Google Scholar] [CrossRef]
- Marshall, C.; Large, D.J.; Athab, A.; Evers, S.L.; Sowter, A.; Marsh, S.; Sjögersten, S. Monitoring tropical peat related settlement using isbas insar, kuala lumpur international airport (klia). Eng. Geol. 2018, 244, 57–65. [Google Scholar] [CrossRef]
- Cigna, F.; Sowter, A. The relationship between intermittent coherence and precision of ISBAS InSAR ground motion velocities: ERS-1/2 case studies in the UK. Remote Sens. Environ. 2017, 202, 177–198. [Google Scholar] [CrossRef]
- Gee, D.; Bateson, L.; Sowter, A.; Grebby, S.; Novellino, A.; Cigna, F.; Marsh, S.; Banton, C.; Wyatt, L. Ground motion in areas of abandoned mining: Application of the intermittent SBAS (ISBAS) to the Northumberland and Durham Coalfield, UK. Geosciences 2017, 7, 85. [Google Scholar] [CrossRef]
- Bateson, L.; Cigna, F.; Boon, D.; Sowter, A. The application of the Intermittent SBAS (ISBAS) InSAR method to the South Wales Coalfield, UK. Int. J. Appl. Earth Obs. Geoinf. 2015, 34, 249–257. [Google Scholar] [CrossRef]
- Novellino, A.; Athab, A.D.; bin Che Amat, M.A.; Syafiudin, M.F.; Sowter, A.; Marsh, S.; Cigna, F.; Bateson, L. Intermittent SBAS ground motion analysis in low seismicity areas: Case studies in the Lancashire and Staffordshire coalfields, UK. In Seismology from Space: Geodetic Observations and Early Warning of Earthquakes; Royal Astronomical Society: London, UK; Burlington House: London, UK, 2014. [Google Scholar]
- Gee, D.; Bateson, L.; Grebby, S.; Novellino, A.; Sowter, A.; Wyatt, L.; Marsh, S.; Morgenstern, R.; Athab, A. Modelling groundwater rebound in recently abandoned coalfields using DInSAR. Remote Sens. Environ. 2020, 249, 112021. [Google Scholar] [CrossRef]
- Wang, S.; Lu, X.; Chen, Z.; Zhang, G.; Ma, T.; Jia, P.; Li, B. Evaluating the Feasibility of illegal open-pit mining identification using insar coherence. Remote Sens. 2020, 12, 367. [Google Scholar] [CrossRef]
- Choi-Fitzpatrick, A. The Good Drone: How Social Movements Democratize Surveillance. MIT Press 2020. [Google Scholar]
- Andries, A.; Morse, S.; Murphy, R.J.; Lynch, J.; Woolliams, E.R. Seeing sustainability from space: Using Earth observation data to populate the UN Sustainable Development Goal indicators. Sustainability 2019, 11, 5062. [Google Scholar] [CrossRef]
- Faucon, M.P.; Le Stradic, S.; Boisson, S.; wa Ilunga, E.I.; Séleck, M.; Lange, B.; Guillaume, D.; Shutcha, M.N.; Pourret, O.; Meerts, P.; et al. Implication of plant-soil relationships for conservation and restoration of copper-cobalt ecosystems. Plant Soil 2016, 403, 153–165. [Google Scholar] [CrossRef]
- Syampungani, S.; Chirwa, P.W.; Akinnifesi, F.K.; Sileshi, G.; Ajayi, O.C. The miombo woodlands at the crossroads: Potential threats, sustainable livelihoods, policy gaps and challenges. Nat. Resour. Forum 2009, 33, 150–159. [Google Scholar] [CrossRef]
- Gee, D.; Sowter, A.; Grebby, S.; de Lange, G.; Athab, A.; Marsh, S. National geohazards mapping in Europe: Interferometric analysis of the Netherlands. Eng. Geol. 2019, 256, 1–22. [Google Scholar] [CrossRef]
- Farr, T.G.; Rosen, P.A.; Caro, E.; Crippen, R.; Duren, R.; Hensley, S.; Kobrick, M.; Paller, M.; Rodriguez, E.; Roth, L.; et al. The shuttle radar topography mission. Rev. Geophys. 2007, 45, 1–33. [Google Scholar] [CrossRef]
- Chen, C.W.; Zebker, H.A. Two-dimensional phase unwrapping with use of statistical models for cost functions in nonlinear optimization. JOSA A 2001, 18, 338–351. [Google Scholar] [CrossRef]
- Lesiv, M.; See, L.; Laso Bayas, J.C.; Sturn, T.; Schepaschenko, D.; Karner, M.; Moorthy, I.; McCallum, I.; Fritz, S. Characterizing the spatial and temporal availability of very high resolution satellite imagery in google earth and microsoft bing maps as a source of reference data. Land 2018, 7, 118. [Google Scholar] [CrossRef]
- IISD SDG Knowledge Hub. Global Electric Vehicles Sales Surge, but Emissions from Transport Rise Faster. Available online: http://sdg.iisd.org/news/global-electric-vehicles-sales-surge-but-emissions-from-transport-rise-faster/ (accessed on 2 May 2020).
- Ferretti, A.; Colesanti, C.; Perissin, D.; Prati, C.; Rocca, F. Evaluating the effect of the observation time on the distribution of SAR permanent scatterers. Proc. Fringe. 2003, 1–5. [Google Scholar]
- Crundwell, F.K.; Moats, M.S.; Ramachandran, V.; Robinson, T.G.; Davenport, W.G. Production of cobalt from the copper–cobalt ores of the central african copperbelt. Extr. Metall. Nickel Cobalt Platin. Group Met. 2011, 1, 377–391. [Google Scholar]
- Sovacool, B.K. The precarious political economy of cobalt: Balancing prosperity, poverty, and brutality in artisanal and industrial mining in the Democratic Republic of the Congo. Extr. Ind. Soc. 2019, 6, 915–939. [Google Scholar] [CrossRef]
- Lindberg, S.; Anderson, U. Blood Batteries, So High is the Price for the Technology of the Future. Available online: https://special.aftonbladet.se/blodsbatterier/ (accessed on 16 February 2020).
- Elenge, M.M.; De Brouwer, C. Identification of hazards in the workplaces of artisanal mining in Katanga. Int. J. Occup. Med. Environ. Health 2011, 24, 57–66. [Google Scholar] [CrossRef]
- Tsurukawa, N.; Prakash, S.; Manhart, A. Social Impacts of Artisanal Cobalt Mining in Katanga, Democratic Republic of Congo. Öko-Institut eV, Freiburg. Available online: https://pdfs.semanticscholar.org/8b56/d22b7f68856322fc47121a429e7c72a73cc1.pdf (accessed on 13 June 2020).
- Moreira, A. A golden age for spaceborne SAR systems. In Proceedings of the 20th International Conference on Microwaves, Radar and Wireless Communications, Gdansk, Poland, 16–18 June 2014; IEEE: Piscataway, NJ, USA, 2014; pp. 1–4. [Google Scholar]
- Nilsson, M.; Griggs, D.; Visbeck, M. Map the interactions between Sustainable Development Goals. Nature 2016, 534, 320–322. [Google Scholar] [CrossRef] [PubMed]
- Van den Brink, S.; Kleijn, R.; Sprecher, B.; Tukker, A. Identifying supply risks by mapping the cobalt supply chain. Resour. Conserv. Recycl. 2020, 156, 104743. [Google Scholar] [CrossRef]
- Enough Project. Powering Down Corruption: Tackling Transparency and Human Rights Risks from Congo’s Cobalt Mines to Global Supply Chains. Available online: https://enoughproject.org/reports/powering-down-corruption (accessed on 2 May 2020).


| LSM/ASM | Mine Type | Mining Operations | Negative Associations |
|---|---|---|---|
| LSM | Industrial | • long-term operations • high capital investment • uniform, terraced platform pit structure • use large machinery and a high degree of mechanisation and automation (surface scrapers, bulldozers, and diggers) • often operator, processor, and refiner sit in the same mining complex (high proportion of industrial buildings and infrastructure) | • bribery and corruption • money laundering • tax evasion |
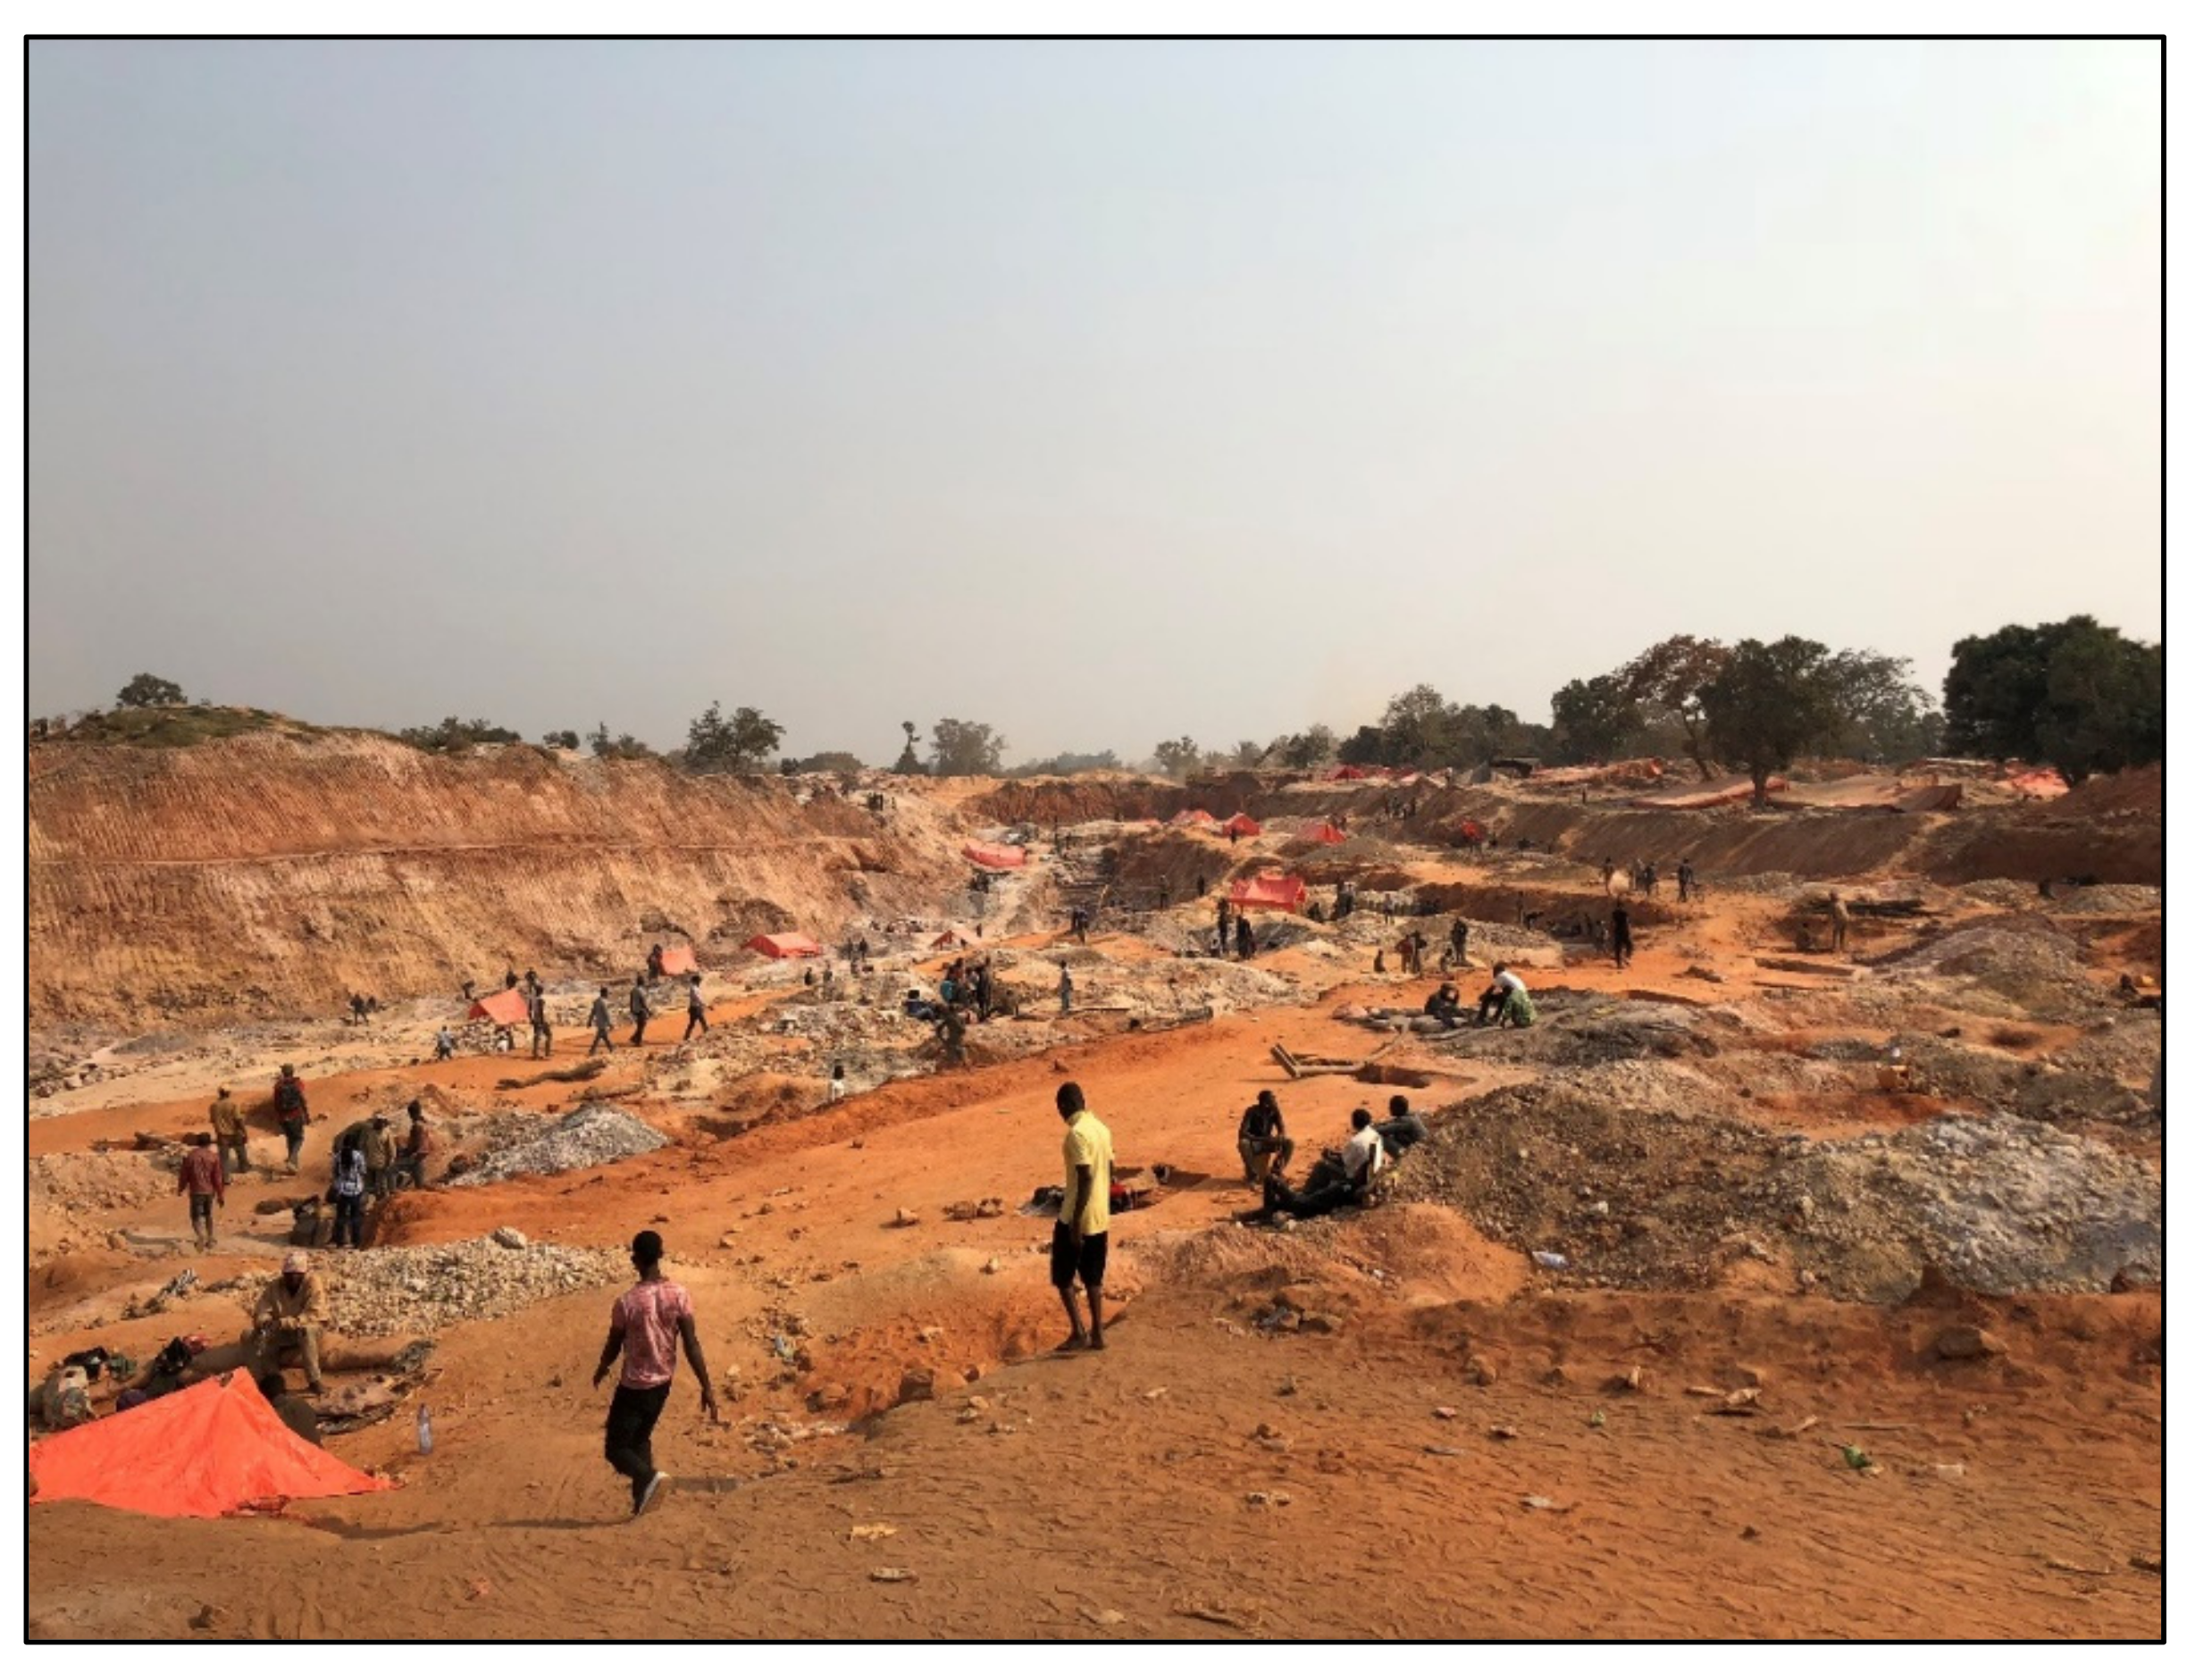
| ASM | Surface | • low capital investment • open pit, irregular surface texture (lunar) • labour intensive, rudimentary tools (shovels, chisels, and mallets) and handpicking (mineral sorting) • varying levels of formalisation (permits) | • hazardous working conditions • alcohol abuse • child labour • child trafficking • debt bondage (high degree of dependency on sponsors) • violence and extortion by security forces |
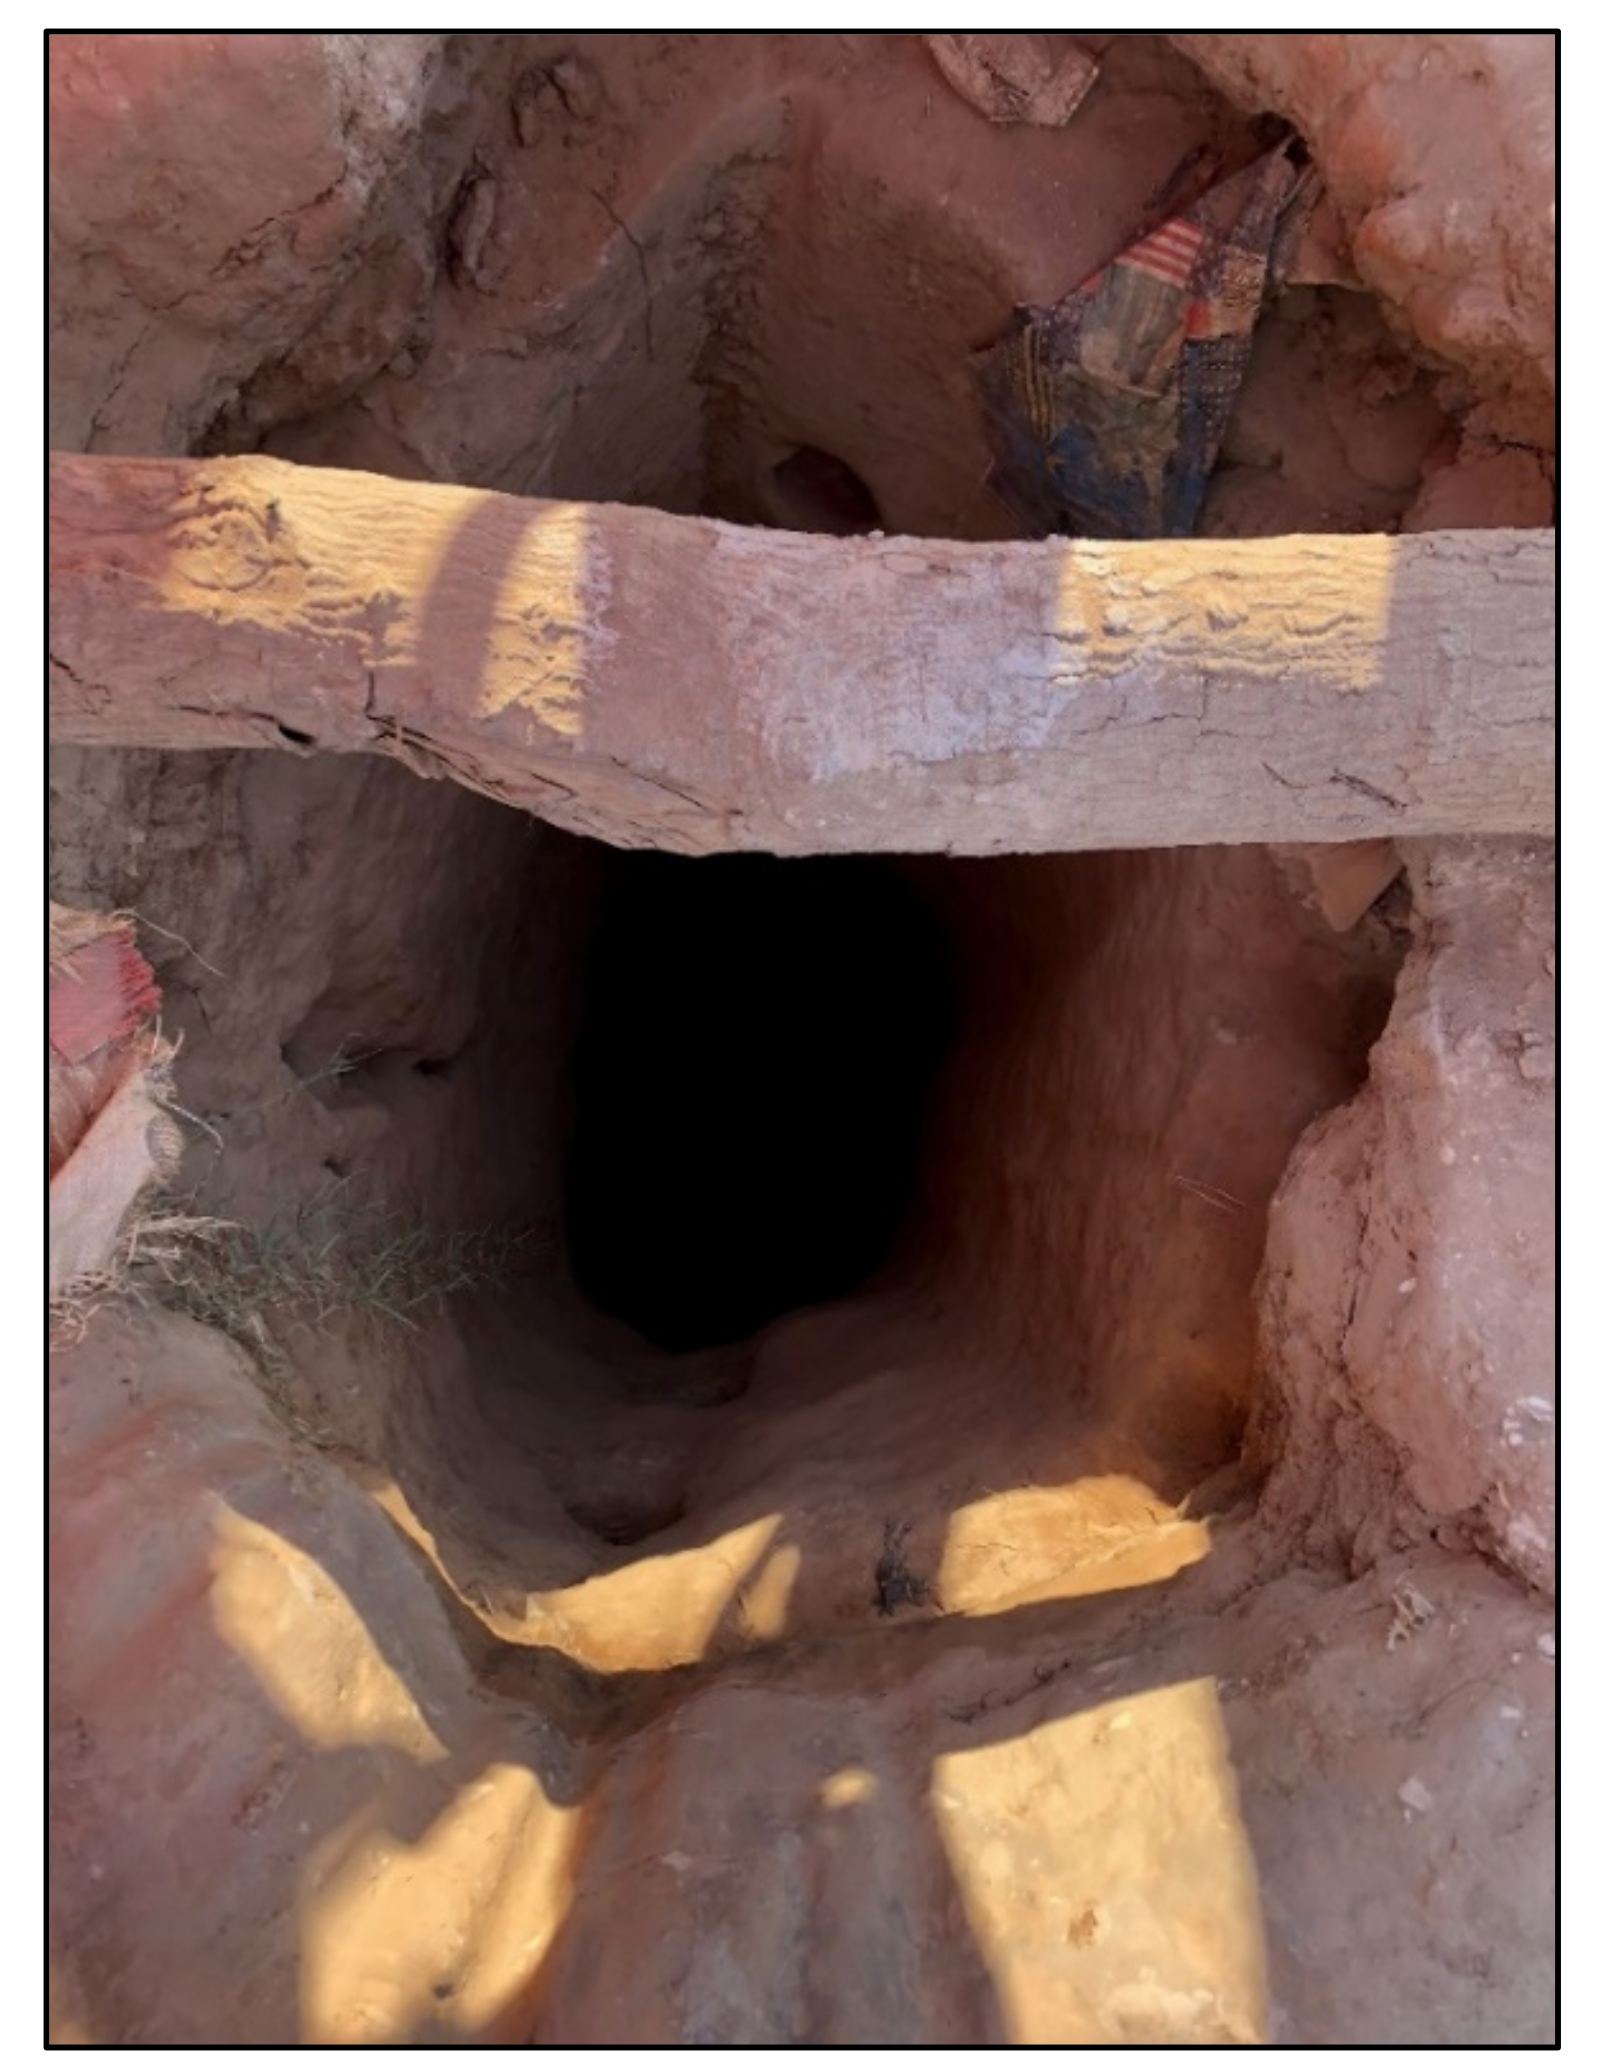
| ASM | Tunnel | • seasonal work (calendar year and cobalt price) • low capital investment • underground tunnels up to 30 m deep • dug with shovels, chisels, and mallets • tunnel structure supported by wooden stakes • vary in number from 10 s to 100 s in one location | • hazardous working conditions • alcohol abuse • child labour • child trafficking • debt bondage (high degree of dependency on sponsors) • violence and extortion by security forces |
| LSM/ASM | Mine Type | Surface Motion Characteristics: | |
|---|---|---|---|
| Subsidence | Uplift | ||
| LSM | Industrial | • a high volume of rock material removal • creation of terrace structure • exploration of new deposits • exploration of deeper deposits | • rock material pilling • halt in activity or abandonment of pit • development of infrastructure |
| ASM | Surface | • landslides • mineral extraction • exploration of new deposits • removal of vegetation | • rock material pilling • seasonality • halt in activity or abandonment of pit |
| ASM | Tunnel | • tunnel collapse • vertical and horizontal digging • groundwater level movement • mineral extraction • exploration of new deposits • removal of vegetation | • rock material pilling • seasonality • halt in activity or abandonment of tunnel |
| Visual Features | ||
|---|---|---|
| Industrial | Surface | Tunnel |
| • uniform, terraced platform pit structure • steep slopes • large industrial complexes • a high proportion of industrial buildings and infrastructure • often walled off from surrounding areas | • open pit, irregular surface texture (lunar) • crevasse and craters created from the constant removal and scraping of rock • vary in size • often found adjacent to industrial LSM complexes • often found near bodies of water for washing and sorting purposes | • tunnel hole between 1-2 m in diameter • pink tarp tents (covering tunnel hole) • vary in numbers from 10 s to 100 s in one location • often found adjacent to industrial LSM complexes |
| Tile | Total Number of Pixels | Number of NA Pixels | Percentage of NA Pixels |
|---|---|---|---|
| North | 12,792,848 | 1,066,479 | 8.3% |
| South | 6,466,246 | 313,431 | 4.8% |
| Mine Type | Number | Mean Area (m2) | Minimum Area (m2) | Maximum Area (m2) |
|---|---|---|---|---|
| Industrial | 48 | 512,309.02 | 5002 | 2,213,418 |
| Surface | 100 | 374,595.02 | 1166 | 17,658,728 |
| Tunnel | 67 | 59,514.82 | 411 | 458,686 |
| Mine/Non-Mine | Mean | Standard Deviation | Minimum | Maximum | ||||
|---|---|---|---|---|---|---|---|---|
| Median | IQR | Median | IQR | Median | IQR | Median | IQR | |
| Mine | −2.33 | 1.72 | 0.93 | 0.49 | −4.64 | 3.20 | −0.05 | 1.63 |
| Non-Mine | −1.13 | 0.81 | 0.79 | 0.16 | −2.67 | 1.59 | 0.65 | 0.90 |
| Mine Type | Mean | Standard Deviation | Minimum | Maximum | ||||
|---|---|---|---|---|---|---|---|---|
| Median | IQR | Median | IQR | Median | IQR | Median | IQR | |
| Industrial | −3.02ab | 2.35 | 1.41de | 0.88 | −7.16gh | 4.52 | 0.26 | 2.11 |
| Surface | −2.52ac | 1.50 | 0.92df | 0.42 | −4.94gi | 2.54 | −0.12 | 1.58 |
| Tunnel | −1.75bc | 1.19 | 0.83ef | 0.31 | −3.27hi | 1.62 | −0.07 | 1.45 |
Publisher’s Note: MDPI stays neutral with regard to jurisdictional claims in published maps and institutional affiliations. |
© 2020 by the authors. Licensee MDPI, Basel, Switzerland. This article is an open access article distributed under the terms and conditions of the Creative Commons Attribution (CC BY) license (http://creativecommons.org/licenses/by/4.0/).
Share and Cite
Brown, C.; Daniels, A.; Boyd, D.S.; Sowter, A.; Foody, G.; Kara, S. Investigating the Potential of Radar Interferometry for Monitoring Rural Artisanal Cobalt Mines in the Democratic Republic of the Congo. Sustainability 2020, 12, 9834. https://doi.org/10.3390/su12239834
Brown C, Daniels A, Boyd DS, Sowter A, Foody G, Kara S. Investigating the Potential of Radar Interferometry for Monitoring Rural Artisanal Cobalt Mines in the Democratic Republic of the Congo. Sustainability. 2020; 12(23):9834. https://doi.org/10.3390/su12239834
Chicago/Turabian StyleBrown, Chloe, Anna Daniels, Doreen S. Boyd, Andrew Sowter, Giles Foody, and Siddharth Kara. 2020. "Investigating the Potential of Radar Interferometry for Monitoring Rural Artisanal Cobalt Mines in the Democratic Republic of the Congo" Sustainability 12, no. 23: 9834. https://doi.org/10.3390/su12239834
APA StyleBrown, C., Daniels, A., Boyd, D. S., Sowter, A., Foody, G., & Kara, S. (2020). Investigating the Potential of Radar Interferometry for Monitoring Rural Artisanal Cobalt Mines in the Democratic Republic of the Congo. Sustainability, 12(23), 9834. https://doi.org/10.3390/su12239834