1. Introduction
Hazardous natural events cause not only large economic and social losses, but also significant environmental impacts due to restoration activities, including debris removal and disposal, repair or replacement of structural and non-structural components or, in worst cases, building demolition. Most life cycle analysis (LCA) models for buildings have been developed to assess the environmental impact of construction and operational phases through the building life cycle. Several researchers (e.g., [
1,
2], and many others listed in
Section 2) have recently highlighted the need to incorporate the effects of natural hazards into building LCA practice. The majority of these studies focused on seismic hazard, since earthquakes can produce extensive damage to buildings when compared to other natural hazards, and thus have higher economic, social and environmental consequences.
The European building stock, being both earthquake-prone and heavily energy-consuming, needs a comprehensive strategy of renovation, due to its structural vulnerability and to its significant impact on the environment. Most existing buildings in Europe are multi-story reinforced concrete (RC) framed structures with exterior masonry infills built in the aftermath of the second world war, having almost exhausted their initially intended service life. Furthermore, according to the European Commission [
3], the construction sector is mainly responsible for environmental impacts associated to human activities; for instance, around 40% of the total energy consumption and 36% of carbon emissions in Europe are due to buildings. Nonetheless, the building renovation rate is still very low, due to non-negligible costs, possible business inactivity, potential need of inhabitant relocation and insufficient hazard-awareness. Additionally, retrofit interventions on existing buildings tend to be solely aimed at reducing either energy consumption or seismic vulnerability alone.
For these reasons, current European policies are pushing towards a sustainable renovation of existing buildings, aiming at the mitigation of both their seismic vulnerability and at the improvement of their energy efficiency. If applied to buildings, sustainability is the result of the interaction between (i) environmental aspects, usually expressed in terms of energy consumption or greenhouse gas (GHG) emissions; (ii) economic aspects, referring to costs of building construction and maintenance; and (iii) social aspects, mainly related to the effects on the community, such as standard of living, risk-awareness, or potential injuries/fatalities due to hazardous events.
With a view to provide a contribution to this important field, the main objective of this study is to propose a life cycle framework for the sustainable renovation of the existing building stock, accounting for the contributions of initial construction, operational energy consumption, earthquake-induced damage repair activities, potential retrofitting interventions, and demolition (and also its associated potential material recycling). One-off and annual monetary costs and equivalent carbon emissions evaluated throughout the building life cycle are used as independent performance metrics to identify the renovation strategy that leads to an optimal balance between seismic resilience and energy efficiency, depending on the climatic conditions and the seismic hazard at the site of interest.
The workflow of the methodology is composed of multiple modules, each referring to a specific building life cycle phase, which can be performed individually or in groups depending on the considered scenario. For instance, by not considering in the cost/impact assessment calculations the pre-retrofit modules, the procedure can be readily applied in contexts where the focus is exclusively on the remaining post-retrofit life of the building, i.e., where the costs and impacts associated to the initial construction and pre-retrofit life of the building are not necessarily of pertinence, such as e.g., in Negro et al. [
4] and Passoni et al. [
5]. In addition, this modular scheme also allows the possible extension of the framework to any other natural hazard that is relevant within the region of interest (e.g., floods, hurricanes, etc.).
Finally, to assist the description and discussion of the proposed methodology, an illustrative application to an example building, assumed as potentially located in different geographic sites and to be renovated according to alternative retrofit strategies, is also carried out.
2. Overview of Existing Methods and Proposals
2.1. Integrated Approaches for Seismic Loss Estimation and Environmental Impact Assessment
The recent past has witnessed a growing number of research endeavors focused on environmental impact assessment methods, and on the integration of those with seismic loss estimation frameworks. Leveraging on the similar effort by Hasik et al. [
6], a brief review of the existing literature is presented herein, advancing on the one discussed already in [
7]. A list of some of the existing works on this topic is thus reported in
Table 1, which also provides information on (i) LCA method, aimed at a standard quantification of building life cycle environmental impacts; (ii) seismic loss assessment method, for the estimation of the average annual economic losses due to seismic hazard; (iii) energy performance assessment, indicating the tools used to perform energy analyses; (iv) damage-to-impact conversion method, needed to assess the environmental impacts of different damage states and consequent repair activities defined within the seismic loss assessment; (v) impact-to-cost conversion method, used to translate the building environmental impacts into economic metrics; and (vi) decision variable, i.e., the performance metric preferred to present the results. Each of these aspects, further discussed in detail in the following sub-sections, are to be considered within a life cycle framework.
2.1.1. Life Cycle Assessment (LCA) Method
LCA is a widespread approach to evaluate the environmental impacts of products or processes. As described in ISO 14040:2006 [
20] and ISO 14044:2006 [
21], it is characterized by four main steps: (i) definition of goal and scope; (ii) life-cycle inventory (LCI) analysis, including the assessment of processes and materials inflows and outflows; (iii) life-cycle impact assessment (LCIA), consisting of the quantification of impacts; and (iv) interpretation of the results, these showing the major contributors, either materials or processes, to global environmental impacts. The global warming potential (GWP) is the most commonly used environmental performance metric, and it is typically expressed in terms of equivalent carbon emissions (eCO
2), those converting the contributions of different GHG emissions with varying GWP into the same metric.
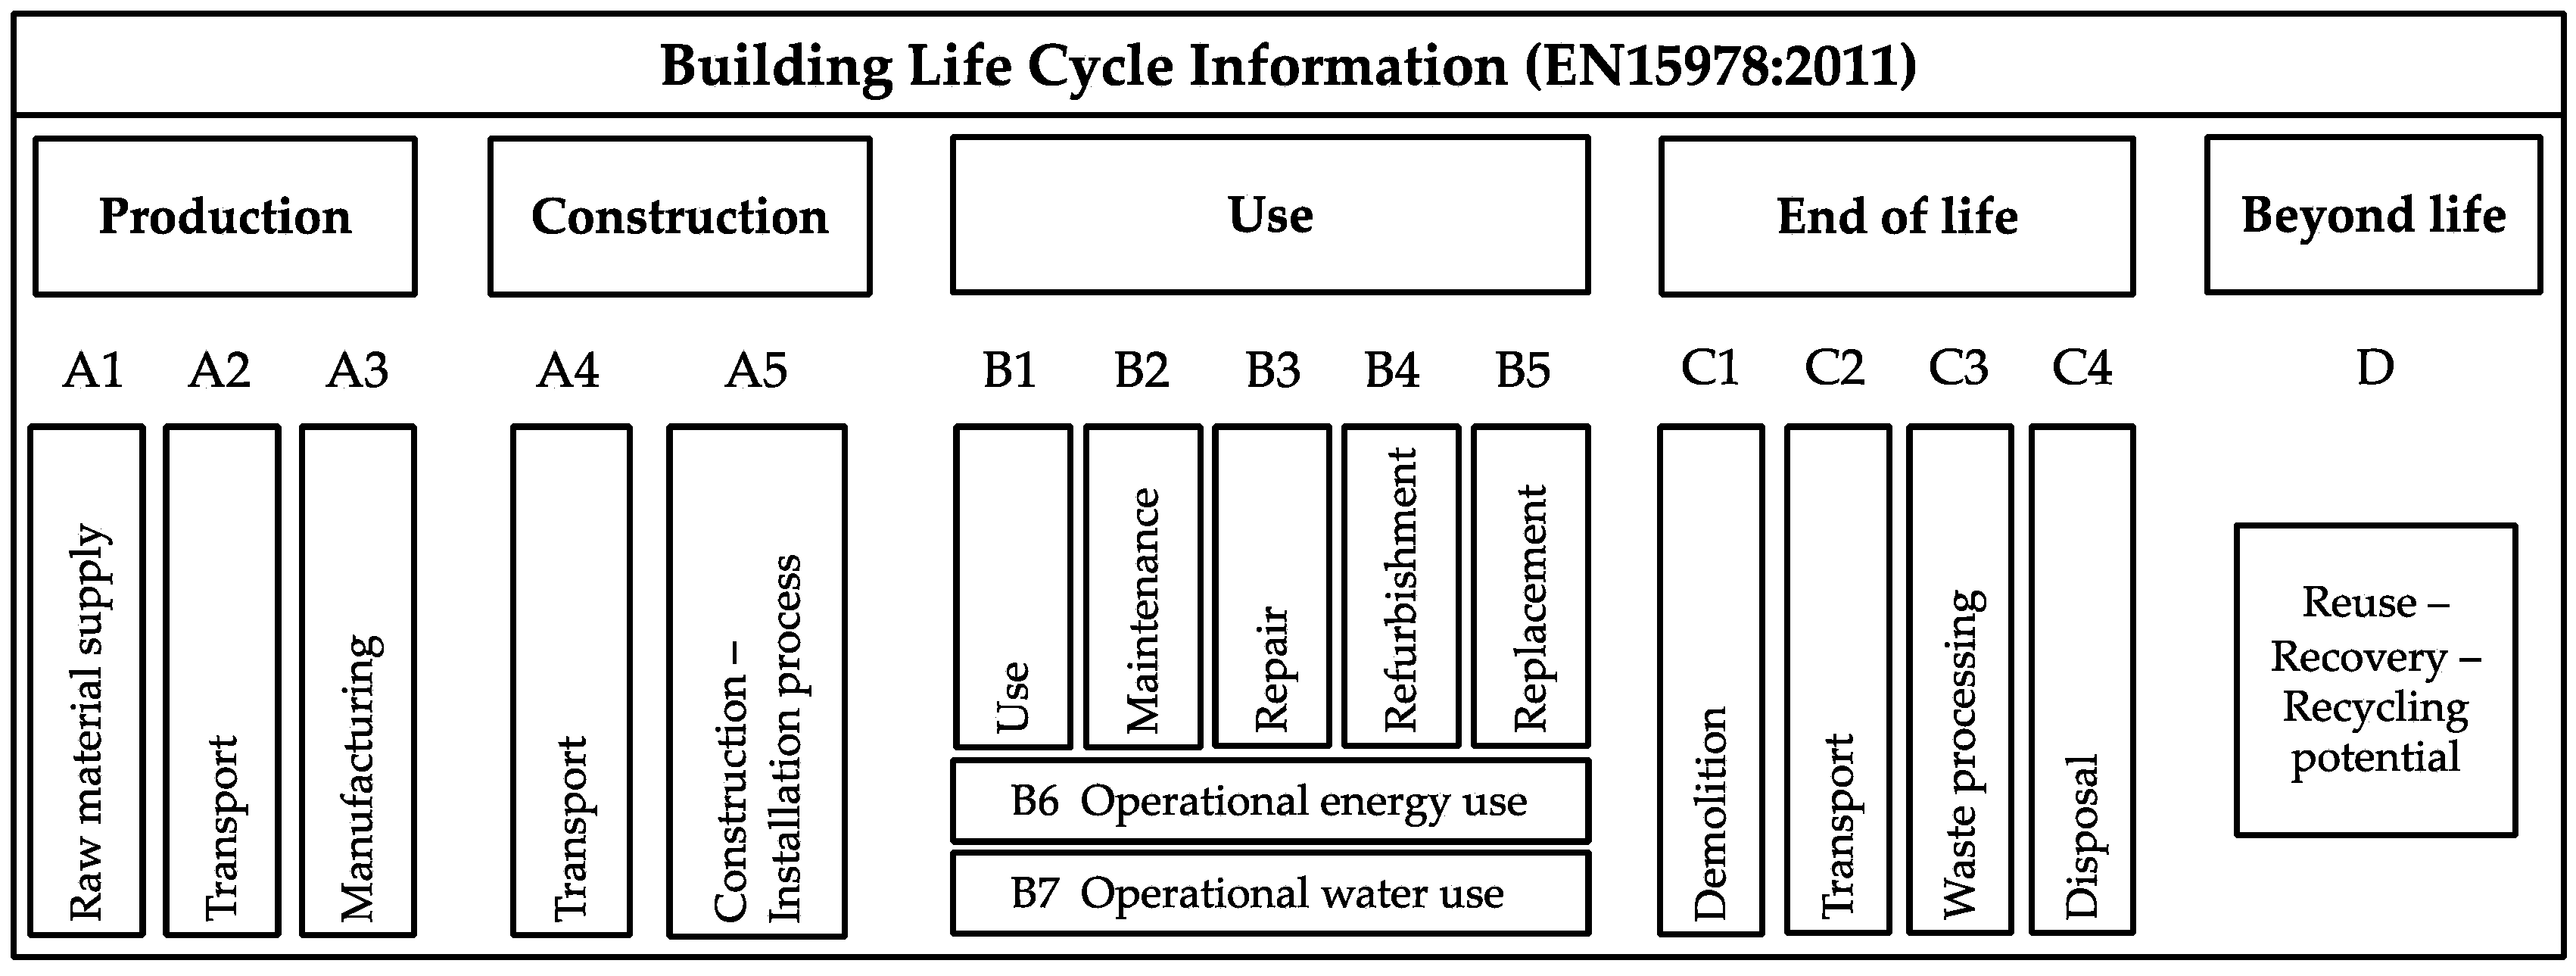
Concerning building LCA, the ISO 21931:2010 [
22] identifies three main stages in the building life cycle: (i) the pre-use stage, including raw materials extraction, transportation, component manufacturing, as well as the construction process itself; (ii) the use stage, including operational energy and water usage and building maintenance; and (iii) the end-of-life stage, including building demolition, transportation and disposal of waste materials. Notably, a more recent European standard [
23] introduced a beyond-life stage, including possible reuse, recycle and recovery of salvaged materials, as illustrated in
Figure 1. According to the standard [
23], Modules A1-A3 are mandatory for environmental product declarations (EPDs), corresponding to a cradle-to-gate LCA and accounting for all the processes until the product leaves the factory gates.
Bill-of-materials (BOM), economic input-output (EIO), or hybrid procedures are alternative ways to assess environmental impacts [
24]. In the studies included in this review, building environmental impacts were assessed through different LCA methods, performing either BOM or EIO, or by applying (e)CO
2 factors. BOM-based LCA (referred to as BOM) requires an inventory of materials quantities and processing needs and rely on available tools, like GaBi [
25], SimaPro [
26], Athena Impact Estimator [
27] or, Tally [
28], among others, or databases, such as Ecoinvent [
29] or U.S. LCI [
30]. EIO-based LCA (referred to as EIO) [
31] requires product or activity cost information to be used within available tools that translate industry sector-specific costs into the corresponding environmental impacts, such as the U.S. EIO-LCA [
32,
33]. Lastly, environmental impacts can be calculated through (e)CO
2 factors or estimates, available in literature or in specific databases, in which environmental impacts per kilograms of materials or for specific activities are collected. For instance, the inventory of carbon and energy (ICE), developed at the University of Bath [
34], collects cradle-to-gate equivalent carbon emissions per kilograms of material, which represent valid estimates for the European region.
2.1.2. Seismic Loss Assessment Method
Several metrics have been proposed in the last decades to quantify seismic risk. Amongst these, the average annual loss (AAL), i.e., the average monetary loss that a building is going to experience during its service life due to seismic hazard, is becoming more widely used in the recent years.
The most complete seismic loss assessment method is the fully probabilistic performance-based earthquake engineering (PBEE) methodology [
35,
36], developed by the Pacific Earthquake Engineering Research (PEER) Center, which is a probabilistic approach to estimate earthquake-induced damage and corresponding losses depending on the site-specific seismic hazard and on the building-specific structural response. It has a four-step main structure: seismic hazard quantification at the site of interest, evaluation of building structural performance under seismic hazard, estimation of damage in different building components conditioned on the estimated structural response, and calculation of losses due to repairing of the damaged components.
Hazard analysis is the characterization of the seismic hazard at the site of interest through a hazard curve that provides a relation between an intensity measure (IM) and the corresponding mean annual frequency of exceedance (MAFE). The result of a hazard analysis is the probability that a certain IM (e.g., spectral acceleration at a given period equal to 0.5 g) is reached.
Structural analysis is needed to quantify the demands on building structural and non-structural components conditioned on a certain seismic intensity level, typically expressed in terms of inter-story drift ratios (IDRs), peak floor acceleration or velocity (PFA or PFV, respectively), and commonly referred to as engineering demand parameters (EDPs). The result of a structural analysis is the probability that an EDP (e.g., 2% IDR) is exceeded, given a certain IM (e.g., spectral acceleration at a given period equal to 0.5 g).
Damage analysis consists in assigning damage measures (DMs) of damageable members to discrete damage states (DSs) depending on the level of damage. Those DSs are defined by component-specific fragility curves, representing the probability of exceedance of a given DS, conditioned on a certain value of EDP. The result of a damage analysis is the probability that a DS (e.g., severe cracking of beam-column joints) is attained, given an EDP value (e.g., 2% IDR). The last step is the
loss analysis, which translates the DM into the decision variable (DV) of interest. The results of the procedure are in terms of MAFE of a certain value of the DV, such as monetary losses, downtime, casualties, or environmental impacts, given that a certain DM has been attained. The majority of the reviewed past studies referred to the PEER PBEE framework for seismic loss estimation, and used tools developed by the PEER Center to estimate earthquake-induced losses on buildings, e.g., the Performance Assessment Calculation Tool (PACT) [
37].
Instead, the software tool Hazus [
38] is building-based and typically used to estimate post-earthquake losses at a local, state and regional scale. Some of the authors included in
Table 1 above performed the seismic loss assessment through the Hazus approach or via the Advanced Engineering Building Module (Hazus AEBM) that allows easier implementation of building-specific damage and loss functions by users. Some other reviewed works preferred custom approaches, referred to as other in
Table 1, mostly being variations of either PEER PBEE or Hazus frameworks.
2.1.3. Energy Performance Assessment
Energy simulation tools represent an important support to assess the energy performance of buildings and to investigate alternative energy refurbishment solutions through cost-optimal analyses, aiming both at a reduction of operational GHG emissions, as well as at substantial improvements in energy consumption and comfort levels, depending on the building characteristics, function, and geographic location. The energy performance assessment is actually part of the building LCA in the operational phase, but it is separately discussed herein since some authors performed the energy assessment independently in order to translate the energy consumption into building carbon footprint.
Currently, several energy simulation tools ([
39,
40], amongst others) are available for energy performance assessment of buildings, each using specific algorithms for the calculations. A few of the works included in this review performed energy analyses through EnergyPlus [
39], which is one of the best-known simulation software tools. Conversely, for simplicity, some other researchers used average statistic data to estimate the energy consumption of buildings in terms of kWh per year.
2.1.4. Damage-to-Impact Conversion Method
Environmental impacts can be treated in the same way as any other consequence function (e.g., economic losses or downtime) to be integrated within a seismic loss assessment. To do so, for each damage state and consequent repair activity defined in the seismic loss estimation framework for individual components (or for an entire building), a damage-to-impact conversion is needed to get an estimate of the corresponding environmental impacts. In the available literature, and as underlined already by Hasik et al. [
6], damage and associated repair were converted into environmental impacts through one of the following three approaches.
The EIO approach (examples found in [
17,
19]) requires the disaggregation of each repair activity into a list of processes to be assigned to specific industry sectors, whose costs are translated into environmental impacts via specific EIO tools, in which impacts per dollar of expense in different sectors are available, e.g., the U.S. EIO-LCA [
32]. The second approach (examples found in [
1,
16]) combines custom damage and repair descriptions with proper BOM LCA or (e)CO
2 factors. The final alternative (examples found in [
12,
15,
18]) is the repair-cost ratio approach. Given that the economic losses due to repair are usually expressed as a percentage of the replacement cost of the building (i.e., the so-called AAL ratio), the same ratio can be applied to the environmental impact of building construction to get a rough quantification of impacts produced by the repair activities. Noteworthily, a basic assumption of this approach is a non-realistic uniform distribution of labor and material costs from the initial construction to the repair stages. Further, the cost percentage assigned to labor should be excluded from this calculation, since it does not produce environmental impacts.
2.1.5. Impact-to-Cost Conversion Method
The operational energy needs of the building usually represent the major contributors to the carbon footprint of the building. Some studies thus treated the operational energy use in terms of environmental impacts, whilst some others translated those impacts into economic metrics through an impact-to-cost conversion, so as to deal with a single decision variable, i.e., monetary expenses due to both seismic risk and to building embodied carbon and/or energy consumption.
2.1.6. Decision Variable (DV)
The need to communicate with stakeholders, insurance companies, governments, and any other potentially involved party has throughout the years called for the definition of both meaningful as well as easily understandable performance metrics. Concerning seismic risk, the AAL is widely recognized as an insightful and easy-to-understand performance metric. At the same time, the cost of operational energy during the building life is even easier to understand for clients, for clear reasons. Thus, some researchers just focused on life cycle costs integrating the contributions of seismic hazard and energy needs, using monetary expenses (MEs) as an individual performance metric. However, the majority of the reviewed research works presented their results in terms of environmental impacts (EIs), since nowadays they are considered a performance metric as meaningful as monetary costs or downtime. The choice of the DV is clearly functional to the purposes of the studies, as discussed above.
2.2. Life Cycle Frameworks for the Renovation of the Existing Building Stock
As anticipated in the Introduction, some new proposals of life cycle frameworks recently emerged in this research context with the aim of developing combined methods for seismic and energy assessment of the existing building stock. Such methods add earthquake-induced repair activities into traditional LCA frameworks and underline the importance of combined retrofitting aimed at improving the seismic and energy performance of existing buildings.
Within the European Pilot Project titled “Integrated techniques for the seismic strengthening and the energy efficiency of existing buildings” and coordinated by the Joint Research Centre (JRC) [
4], the sustainable structural design (SSD) method proposed by Lamperti Tornaghi et al. [
41] is being adapted and further developed for application to the case of integrated assessment and retrofitting of the existing European building stock. In such methodology, comparative cost-benefit analyses of different integrated interventions consider not only the seismic damage/retrofitting and energy consumption of buildings, but also the corresponding carbon emissions, which are converted into an assumed equivalent monetary cost.
Passoni et al. [
5] proposed a four-step methodological framework based on the principles of life cycle thinking (LCT) for the holistic renovation of the existing building stock, in which the selection of the optimal retrofit solution is driven by a qualitative multi-criteria decision making (MCDM) approach and by the quantification of economic and environmental impacts of retrofit intervention, duration of works and maintenance.
The above methodologies for integrated assessment and renovation of existing buildings are focused solely on the impact/cost assessment related to the remaining life of a building, thus neglecting the costs and impacts associated to the initial construction and pre-retrofit life of the building, which may however be useful in contexts where there is an interest in e.g., (i) comparing costs/impacts associated to past, present and future construction technologies, or (ii) establishing an integrated classification for buildings on the basis of their entire life cycle economic and environmental impacts considering both seismic vulnerability and energy efficiency.
3. Proposal of a Life Cycle Framework for the Renovation of Existing Buildings
As previously stated, the present study presents a life cycle framework for existing building renovations that account for the contributions of initial construction, operational energy consumption, earthquake-induced damage repair activities, retrofitting interventions, and demolition (and its associated potential material recycling), in terms of both economic and environmental performance metrics. The proposed methodology can be used to undertake cost-benefit analyses aimed at identifying the renovation strategy that leads to an optimal balance, considering both economic and environmental metrics, between reduction of seismic vulnerability and increase of energy efficiency of a building, depending on the climatic conditions and the seismic hazard at the site of interest.
The different modules of the methodology, each of which are independent from the other and refer to a specific building life cycle phase, can be implemented through available up-to-date methods to attain the corresponding task (e.g., the seismic loss estimation can be performed according to the above PEER PBEE approach [
35,
36]). Furthermore, the developed framework also envisages the possibility of extending the application of the general procedure to every type of buildings (e.g., RC frame and wall structures, steel systems, masonry structures, etc.), and, more significantly, to any other natural hazard (such as floods, hurricanes, and so on) depending on the region of interest.
3.1. General Workflow of the Life Cycle Framework
The life cycle framework proposed in this study aims at the quantification of monetary expenses and environmental impacts (in terms, for example, of equivalent carbon emissions), through a summation of the contributions of the following phases within the building service life:
initial construction, whose costs and carbon emissions can be estimated through available databases, statistics or references, or via specific software tools (such as the ones discussed for building LCA in
Section 2.1.1);
operational use phase in the pre-retrofit configuration, including building energy consumption, estimated through energy performance analyses, and earthquake-induced damage and repair activities, evaluated through seismic loss assessment methods;
retrofit intervention, which may be a sole structural strengthening, a sole energy refurbishment, or an integrated retrofit intervention aiming at the reduction of both building seismic vulnerability and energy consumption, whose costs and carbon emissions can be estimated via available spreadsheets of producers, or through the same tools indicated for construction;
operational use phase in the post-retrofit configuration, which is strongly influenced by the type of retrofit adopted (for instance, if a sole energy refurbishment is designed, then the energy needs of the building will decrease, but the average monetary losses or environmental impacts due to seismic hazard will remain the same as those in the pre-retrofit configuration);
demolition, whose costs and carbon emissions can be assumed equal to the 25% of the corresponding estimates for construction, assuming that the 75% of construction and demolition (C&D) waste is recycled for newer purposes, according to recent European requirements [
42]. The same percentage can be assumed for the potential recycle of materials used for the retrofit intervention.
It is worth remembering that the contributions of construction, retrofit intervention, and demolition are one-off costs or impacts, while operational costs and carbon emissions are distributed along the service life of the building, thus usually expressed in annual terms.
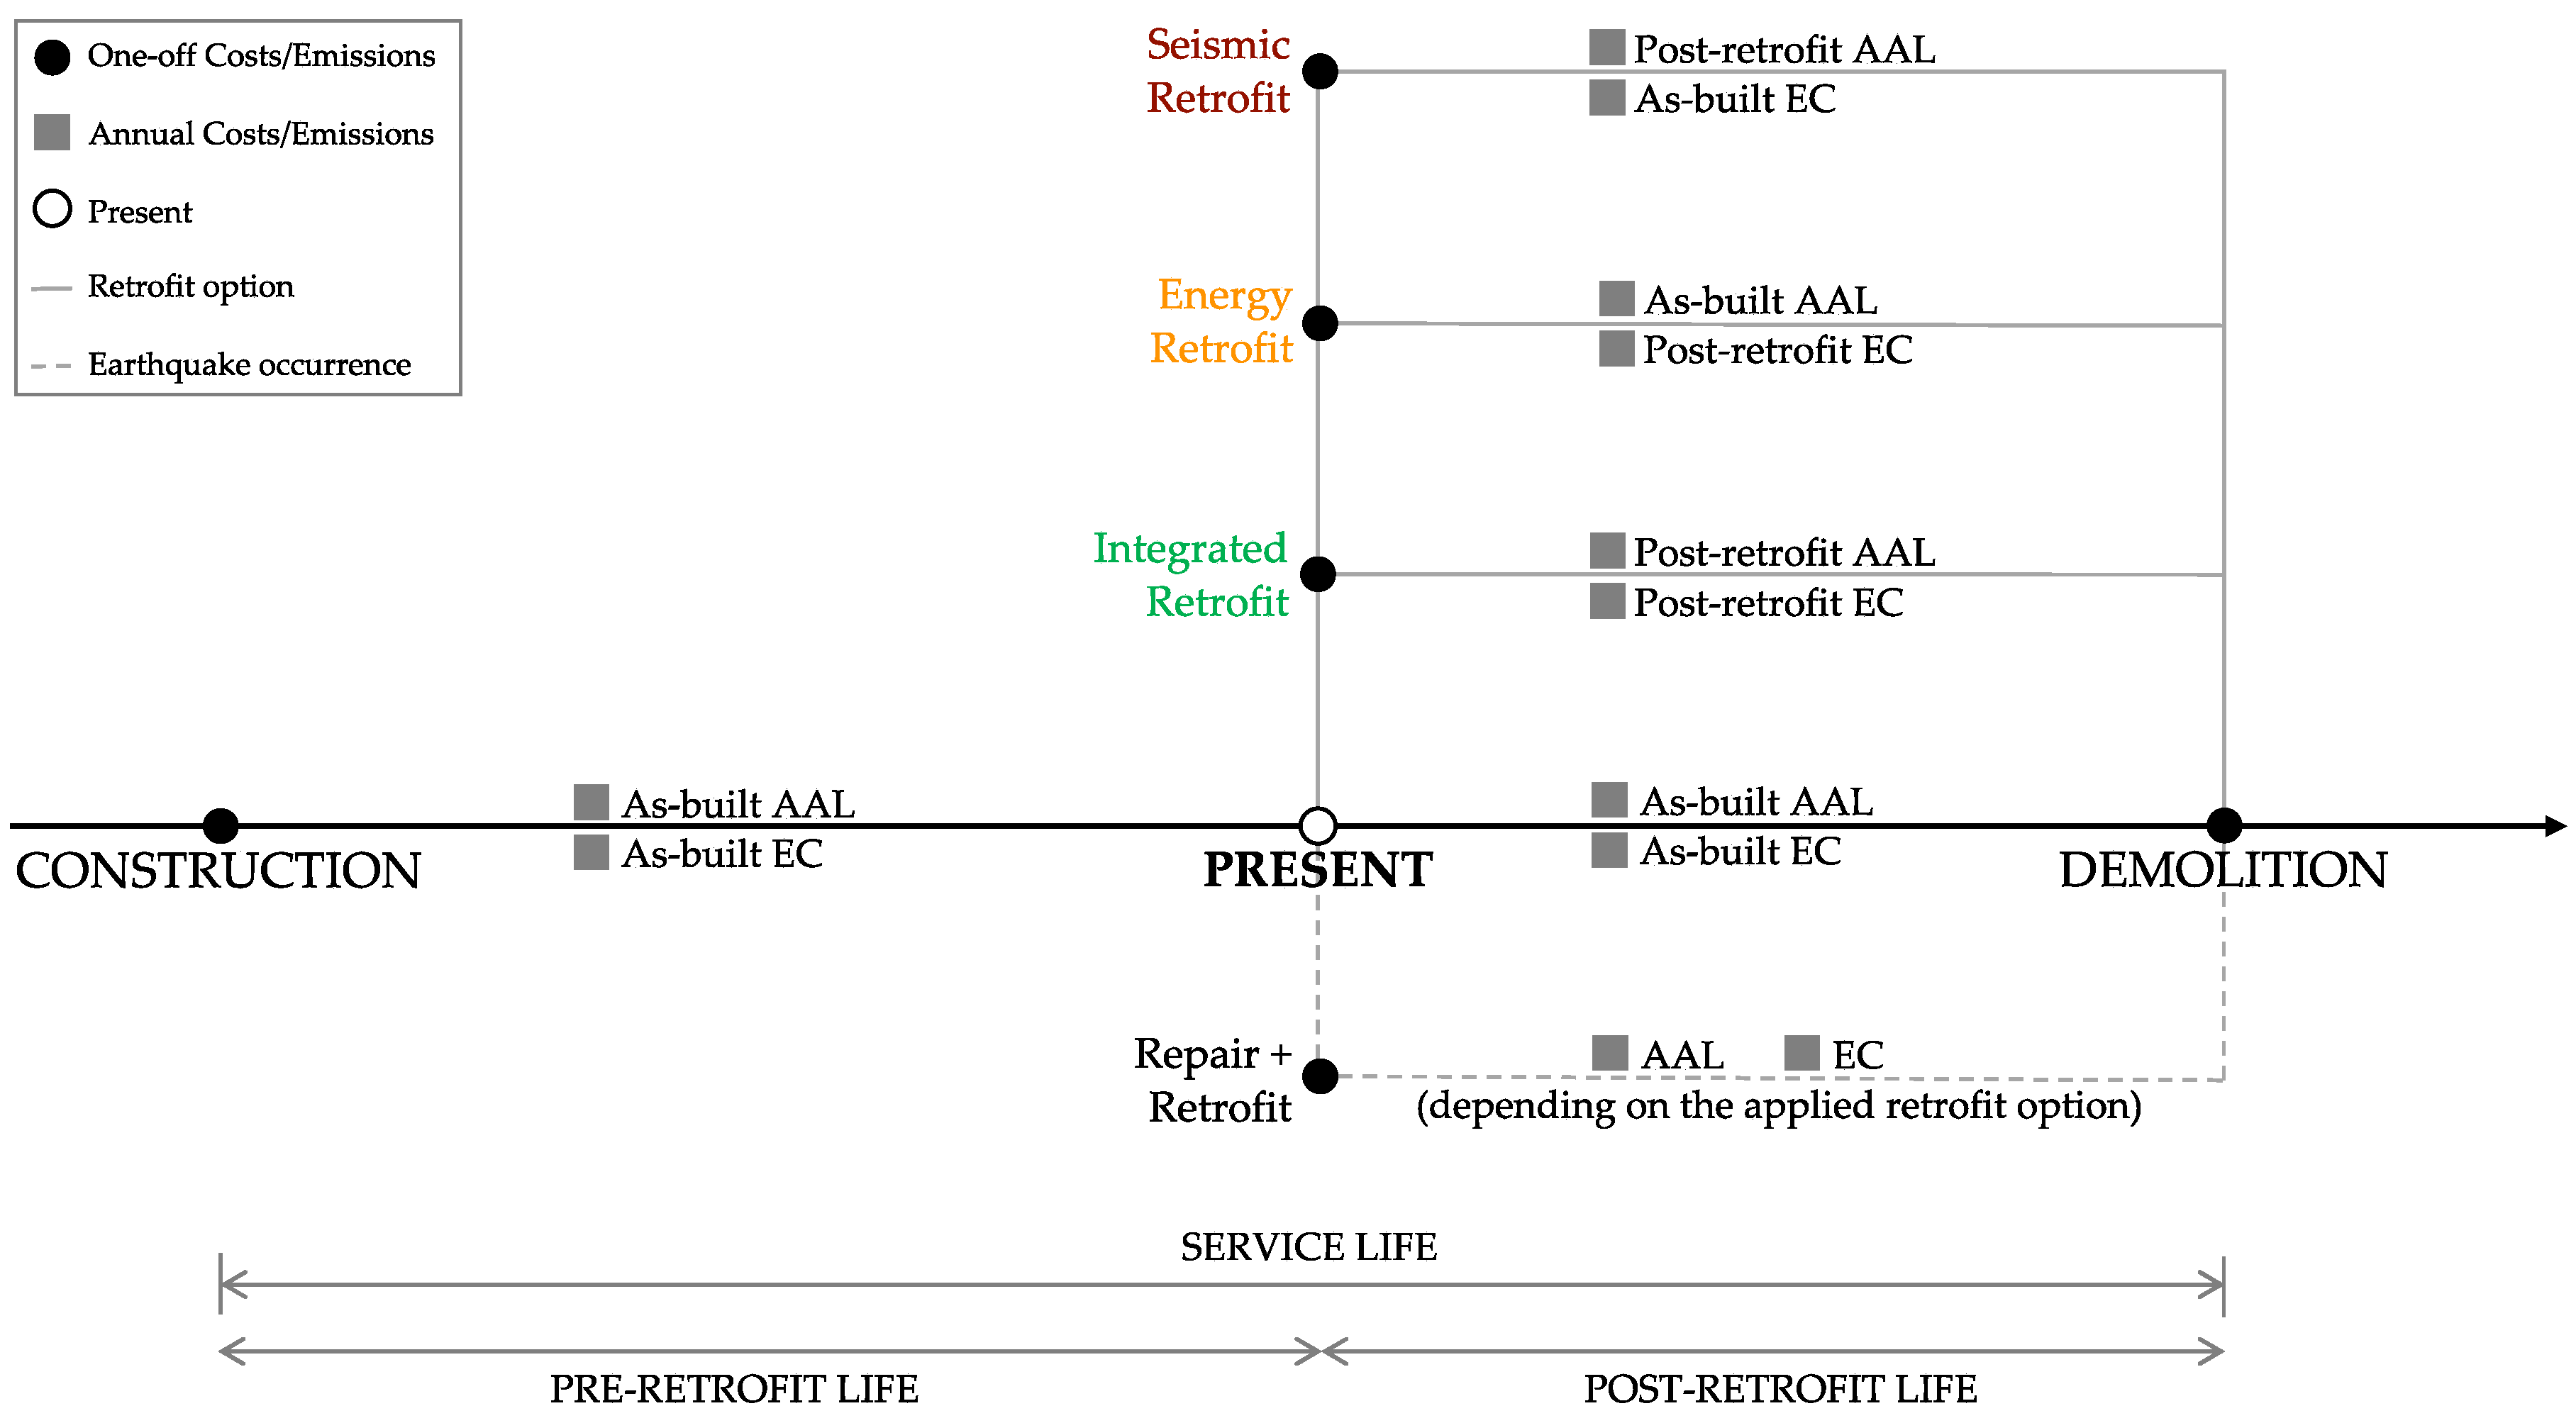
The scheme in
Figure 2 shows the temporal distribution and the main characteristics of the modules included within the framework. The present time can be interpreted in different ways, since it may refer to the time of assessment, the time to decide whether to renovate the building or not, or an earthquake occurrence (followed by the building renovation). The definition of the present time is needed for two main reasons: (i) to make monetary expenses financially comparable, capitalization and actualization at the current-time monetary value are needed, through compound interest rates (
ri, accumulated from past investments) and future discount rates (
rd), respectively; and (ii) in case of building renovation, whether an earthquake occurred or not, the time of intervention significantly affects the final results in terms of both total monetary expenses and equivalent carbon emissions within the building life cycle, as the illustrative example will show. It should be noted however that interest and discount rates as well as prices of products or services (e.g., energy or human activity prices) do change in time, whilst they are typically assumed to be constant in life cycle cost analyses (LCCA) for simplicity, possibly affecting the results.
In order to aid the description of the proposed framework, the application to an illustrative example is also presented herein, with the following purely demonstrative and exemplificative assumptions:
generic building with an RC frame structure and a total floor area equal to 1500 m2;
a construction cost of 1000 €/m2 and an embodied equivalent carbon of the entire building of approximately 400 kg eCO2/m2, resulting in a total cost of construction equal to 1,500,000 € and an estimate of embodied carbon emissions due to the building construction equal to 600,000 kg eCO2;
three different geographic locations, including (i) a highly seismic site, with warm weather (assuming an AAL ratio, for both costs and carbon emissions, equal to 1.5%, and 100 kWh/m2 per year of energy needed to heat the building), referred to as “Warm_HighEq”; (ii) a site with average seismic and climatic characteristics (assuming an AAL ratio, for both costs and carbon emissions, equal to 0.8%, and 200 kWh/m2 per year of energy needed to heat the building), referred to as “Mild_AvgEq”; and (iii) a very cold site, characterized by low seismic hazard (assuming an AAL ratio, for both costs and carbon emissions, equal to 0.1%, and 400 kWh/m2 per year of energy needed to heat the building), referred to as “Cold_LowEq”;
three different retrofit intervention strategies, including (i) a purely structural intervention (referred to as “Strct_Int”), i.e., the introduction of new RC shear walls (assuming a cost of 40 € per floor meter squared and corresponding equivalent carbon emissions approximately equal to 25 kg eCO2/m2); (ii) a sole energy refurbishment (referred to as “Enrg_Int”), i.e., the application of thermal insulation panels in expanded polystyrene outside the building envelope (assuming a cost of 70 €/m2 and corresponding equivalent carbon emissions approximately equal to 10 kg eCO2/m2); and (iii) an integrated strategy (referred to as “Intgr_Int”), combining the above two retrofit interventions (assuming a cost of 90 €/m2 and corresponding equivalent carbon emissions approximately equal to 30 kg eCO2/m2);
a reduction of 1/10 of the AAL after the introduction of the RC shear walls, and a 50%-reduction of energy consumption for heating thanks to the thermal insulation of the building envelope;
a service life of 50 years, and three different times of intervention, i.e., 20, 30, and 40 years after the building construction.
It is worth specifying that, at this stage of the study, the sole contribution of the heating system to the total energy needs is considered, since it is the major contributor to energy consumption in a building and it significantly varies depending on the geographic location. In addition, the annual costs associated to energy consumption for heating are calculated assuming a cost of 1 € per standard cubic meter of natural gas, knowing that 1 standard cubic meter corresponds to approximately 10.68 kWh. On the other hand, the equivalent carbon emissions due to the building energy consumption for heating are calculated assuming a conversion factor equal to 0.19 to translate kWh into kg of eCO2. It is again underlined that this building serves as an illustrative example and that all numeric values listed above have therefore been herein arbitrarily assumed (though taking naturally advantage of the authors’ knowledge and experience from previous engineering endeavors, so that the assumed values do fall within realistic ranges).
3.2. Total Annual Costs and Emissions
As mentioned already, the life cycle framework proposed herein aims at the quantification of monetary expenses and carbon emissions, through a summation that accounts for the contributions of the building phases described in the previous section. Thus, costs and carbon emissions are assumed as meaningful life cycle performance metrics (LCPMs).
The summation, in terms of an annual LCPM, i.e., either Total Annual Costs (€/m
2 yr) or Total Annual Emissions (kg eCO
2/m
2 yr), is calculated as follows:
in which, (i)
C,
RI and
D refer to Construction, Retrofit Intervention and Demolition, respectively, and they are one-off costs or carbon emissions; (ii)
SL1,
SL2 and
SL indicate the pre-retrofit, post-retrofit and total Service Life of the building, respectively; (iii)
AALas-built and
AALpost-retrofit are the Average Annual Losses (in terms of either monetary losses or carbon emissions) due to seismic hazard, estimated before and after the retrofit intervention, respectively; (iv)
ECas-built and
ECpost-retrofit are the annual monetary expenses and carbon emissions due to the building Energy Consumption, evaluated before and after the retrofit intervention, respectively; and (v)
FA is the building total Floor Area. Each contribution to this summation can be treated as an independent module that can be evaluated separately to perform just a partial calculation.
The summation in (1) has been calculated for the illustrative example considering the different scenarios listed above, to compare the total annual costs and carbon emissions resulting from different combinations of retrofit option, geographic location, and time of intervention. In this case, since it is assumed that the time of assessment corresponds to the retrofit intervention, the cost contributions of C, AALas-built and ECas-built are capitalized at the present time, whilst AALpost-retrofit, EC post-retrofit and D are actualized at the present time, assuming constant ri and rd for both financial processes equal to 1%.
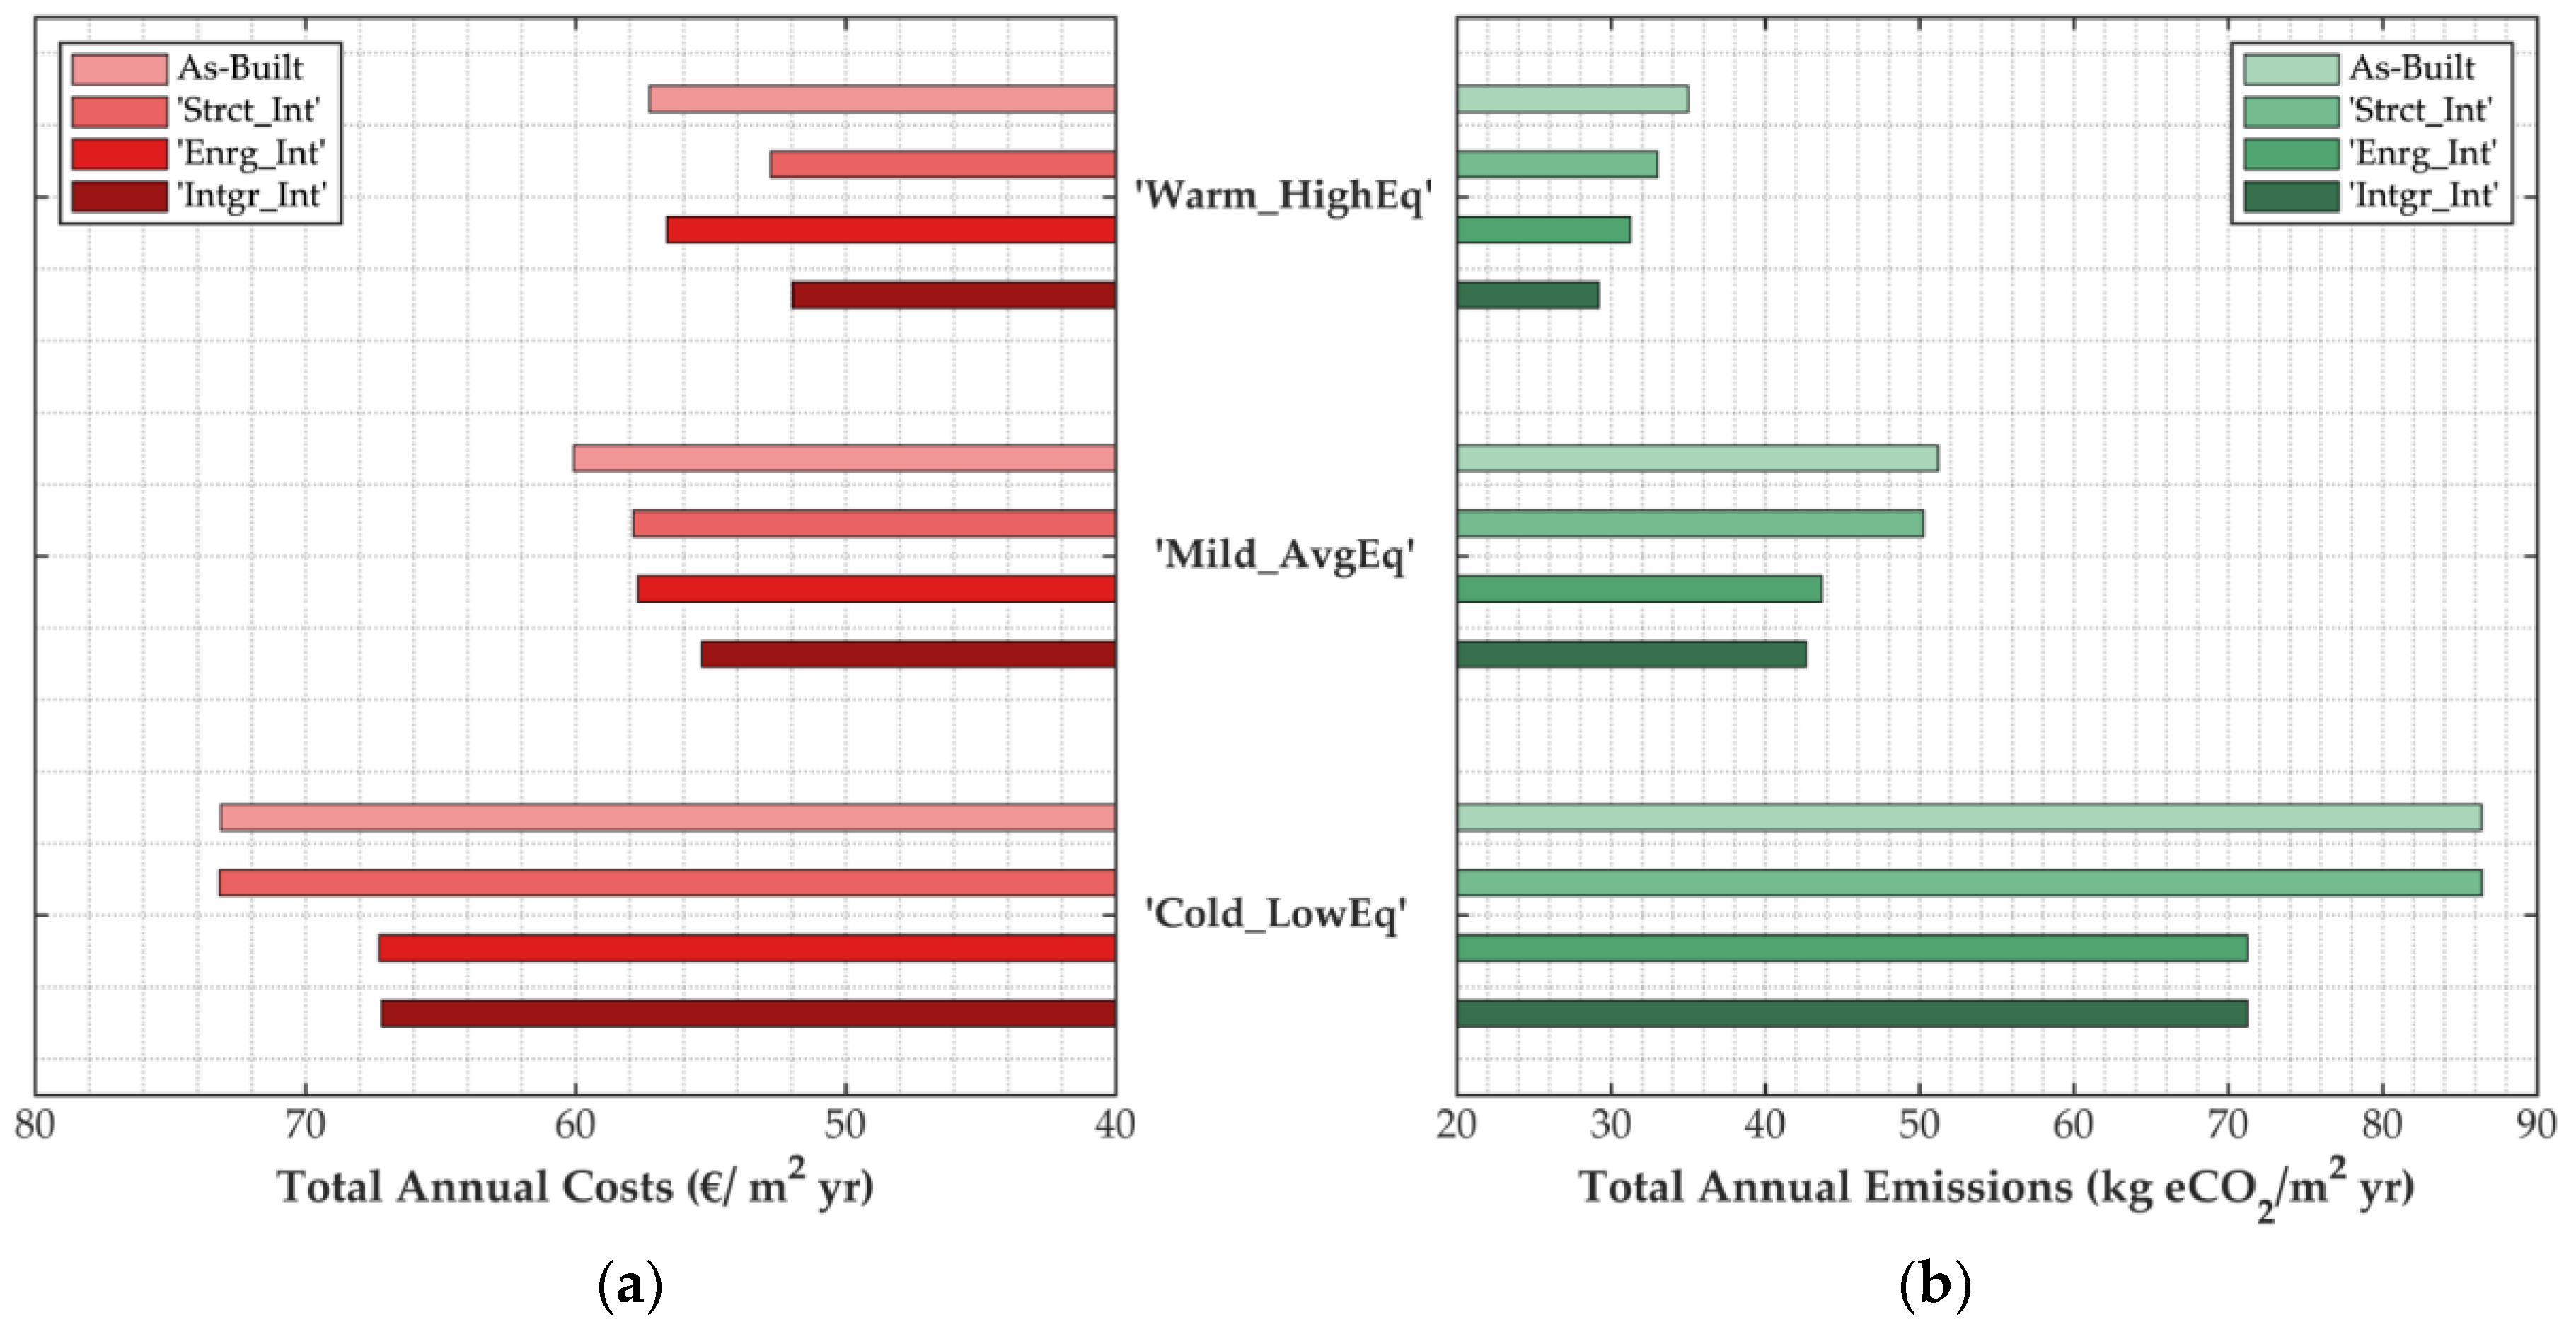
Figure 3 illustrates the total annual costs and carbon emissions resulting from the summation above for the three retrofit strategies and sites considered, assuming that the renovation of the building is performed after 30 years from construction. It is observed that, as expected, the integrated intervention is always the most convenient strategy, in terms of both total costs and carbon emissions. However, it is interesting to see that for “Warm_HighEq” Site, subjected to the highest seismic demands, the structural retrofit option is convenient from the economic viewpoint, but not necessarily satisfactory in terms of carbon emissions, if compared to the other two options, whilst the sole energy refurbishment seems not to be the appropriate choice. Conversely, for “Cold_LowEq” Site, subjected to higher energy needs, the sole energy refurbishment and the integrated intervention are equally convenient, whilst the structural retrofit option does not lead to an improvement over the as-built configuration, given that in this case the seismic hazard is negligible.
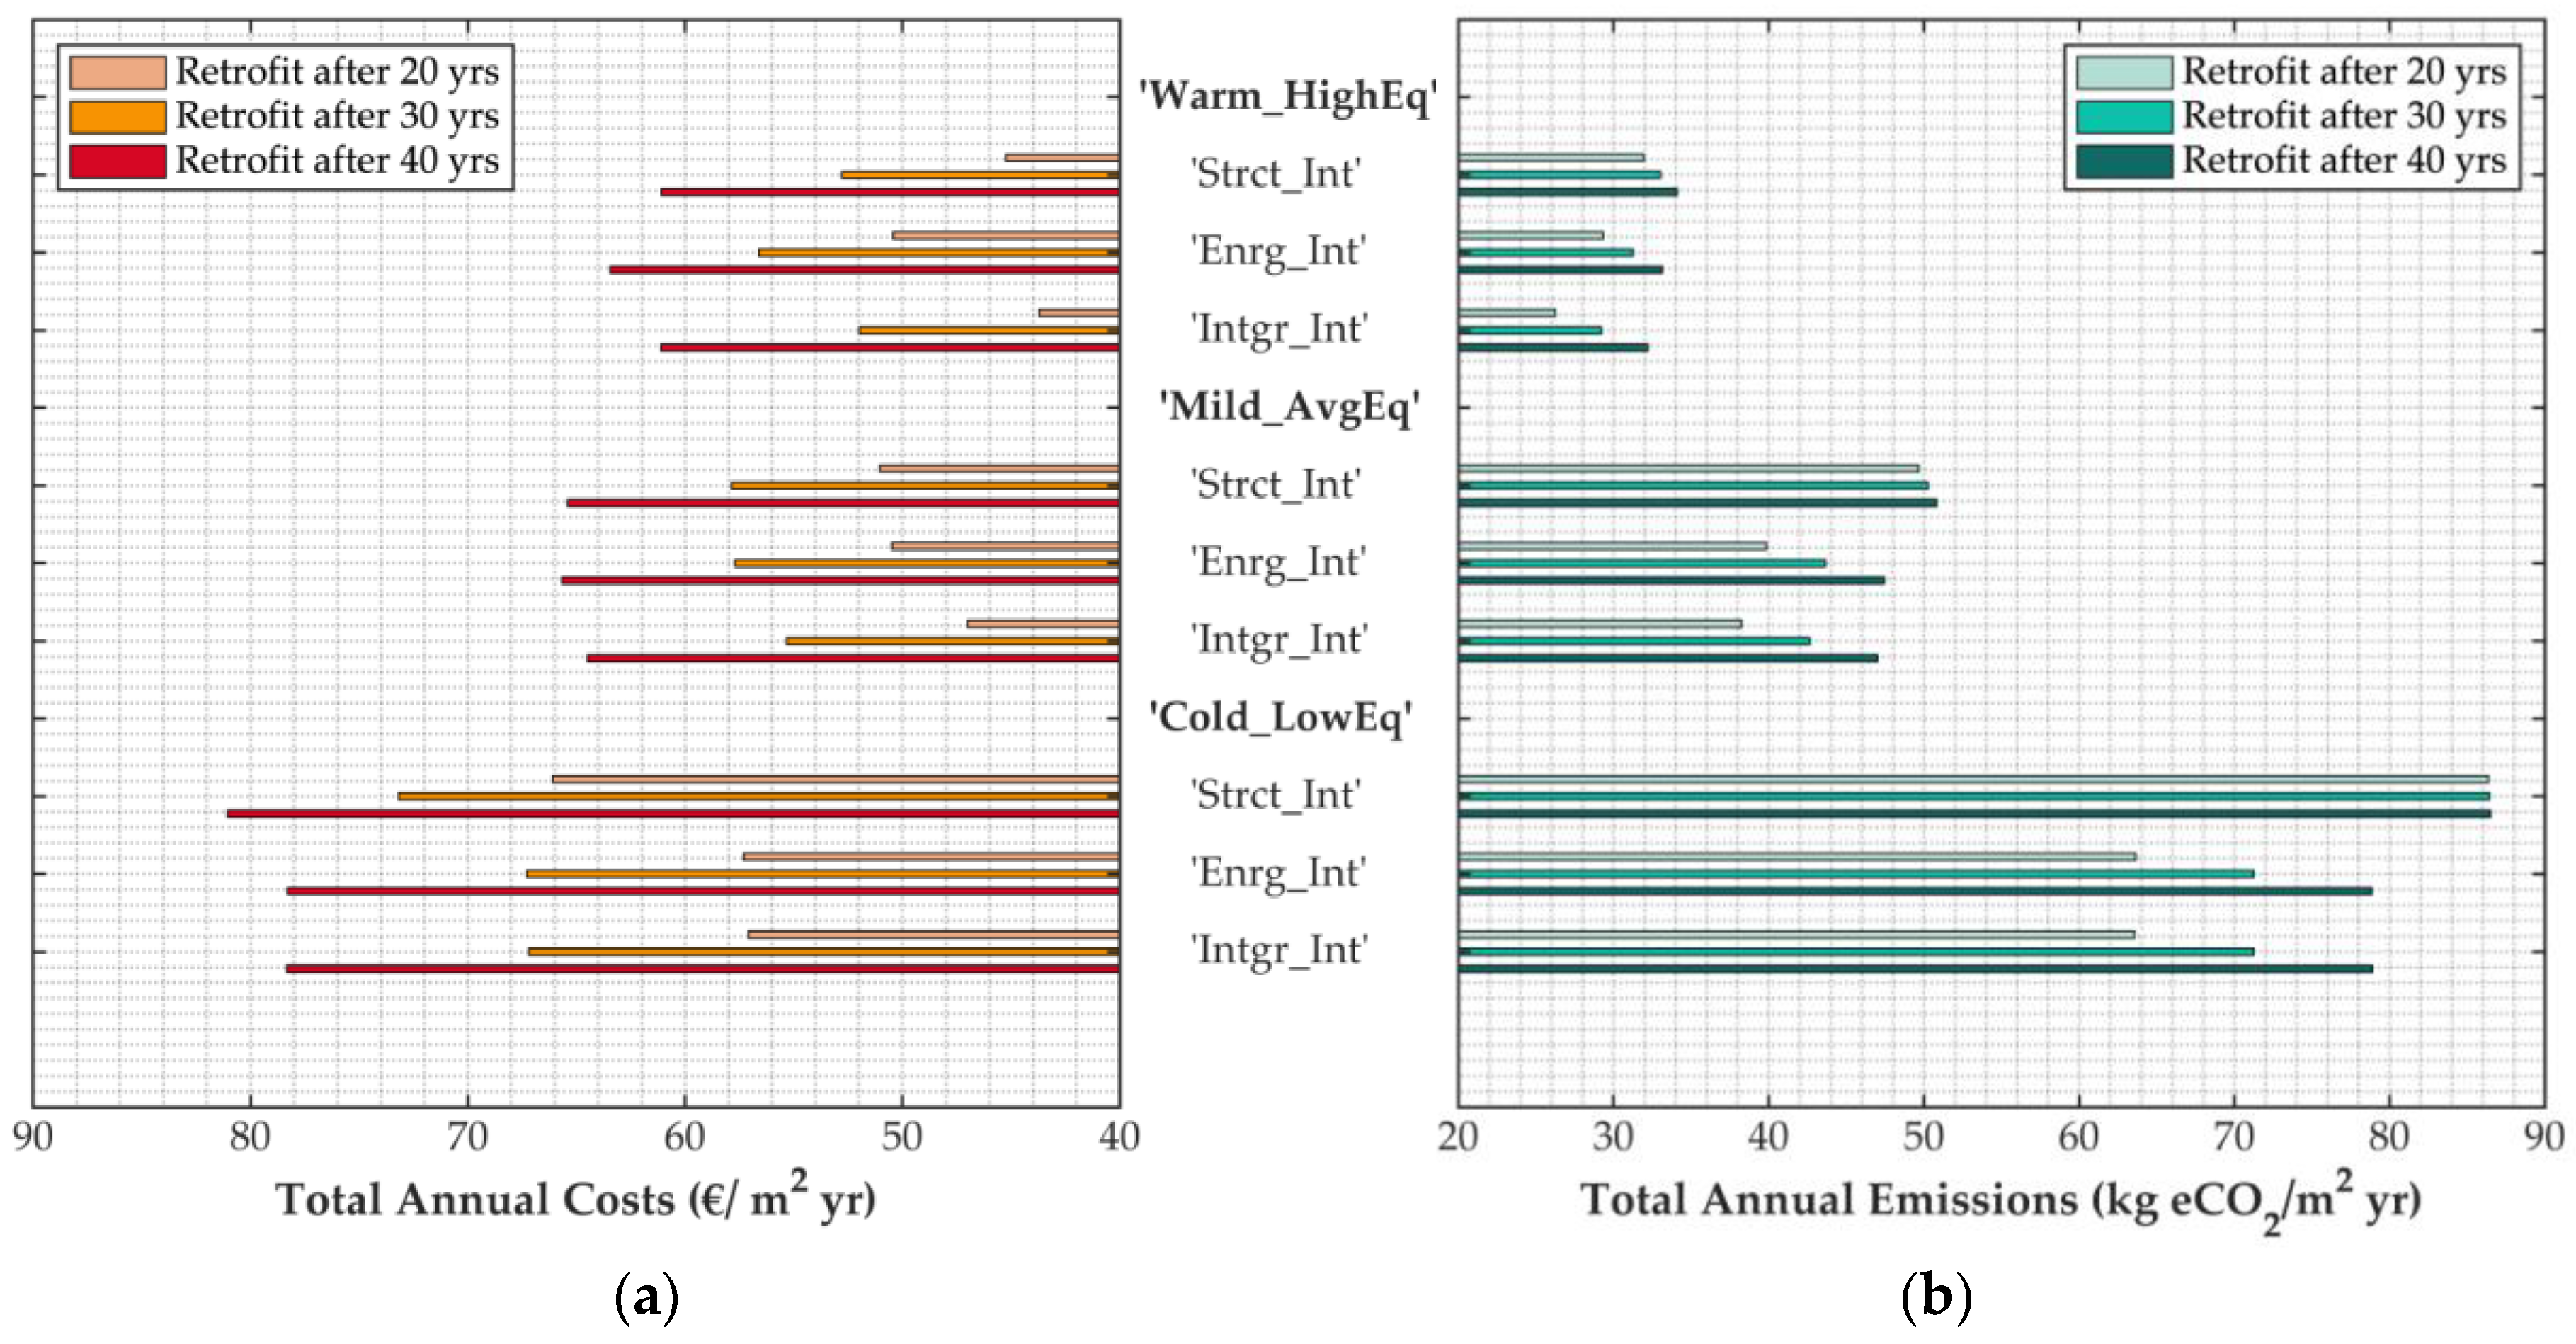
Figure 4 shows instead how the results of the summation in terms of total annual costs and carbon emissions vary depending on the retrofit strategy adopted, the geographic location, and the time of intervention. It is observed that the later the intervention takes place, the higher the total annual costs and carbon emissions for each renovation strategy are. It is worth also noting that, for instance, for the “Cold_LowEq” Site, the results for the structural retrofit option are not affected by the year of intervention as much as the other two retrofit options, and this is again due to the limited efficiency of a sole structural strengthening in a location with high energy demands and low seismic hazard.
It is also interesting to investigate the percentage contribution of each life cycle stage to the total annual costs and carbon emissions given above, as reported in
Table 2 and
Table 3, respectively. It is recalled that each of the calculation modules refer to construction (“Constr”), earthquake-induced losses in the as-built configuration (“Eq_Pre”), operational energy needs in the as-built configuration (“Enrg_Pre”), retrofit intervention (“Interv”), earthquake-induced losses in the post-retrofit configuration (“Eq_Post”), operational energy needs in the post-retrofit configuration (“Enrg_Post”), and demolition (including potential recycle of construction and retrofit materials)—“Demol”.
The construction phase is clearly the major contributor to total annual costs, accounting for approximately 50% of the total estimate, whilst it accounts for only the 10–30% of the total carbon emissions. The contributions, in the as-built configuration, of earthquake losses and operational energy needs to both total annual costs and carbon emissions vary according to the site seismic hazard and climatic conditions, as expected. The retrofit intervention itself does not contribute significantly to the overall life cycle summation, proving that comparing alternative retrofit interventions is meaningful not merely in terms of one-off investments but mainly in terms of long-term expenses or carbon emissions throughout the post-retrofit service life. Subsequently to the retrofit intervention, therefore, the contributions of earthquake losses and energy needs vary according to the retrofit option adopted. Indeed, a significant reduction of the contribution of earthquakes or energy needs is naturally attained when either a sole structural or energy retrofit is considered, whilst when an integrated strategy of intervention is adopted both contributions vary in an important fashion. The demolition phase, instead, is responsible for approximately 5–7% and 2–6% of total annual costs and carbon emissions, respectively, and only a minor variation is observed between the different retrofit options, most likely as a result of the fact that the contribution of the construction materials demolition and recycle is much higher than that of the retrofit materials. Finally, it is also noted that, from the environmental viewpoint, the building energy consumption is always the greater contributor.
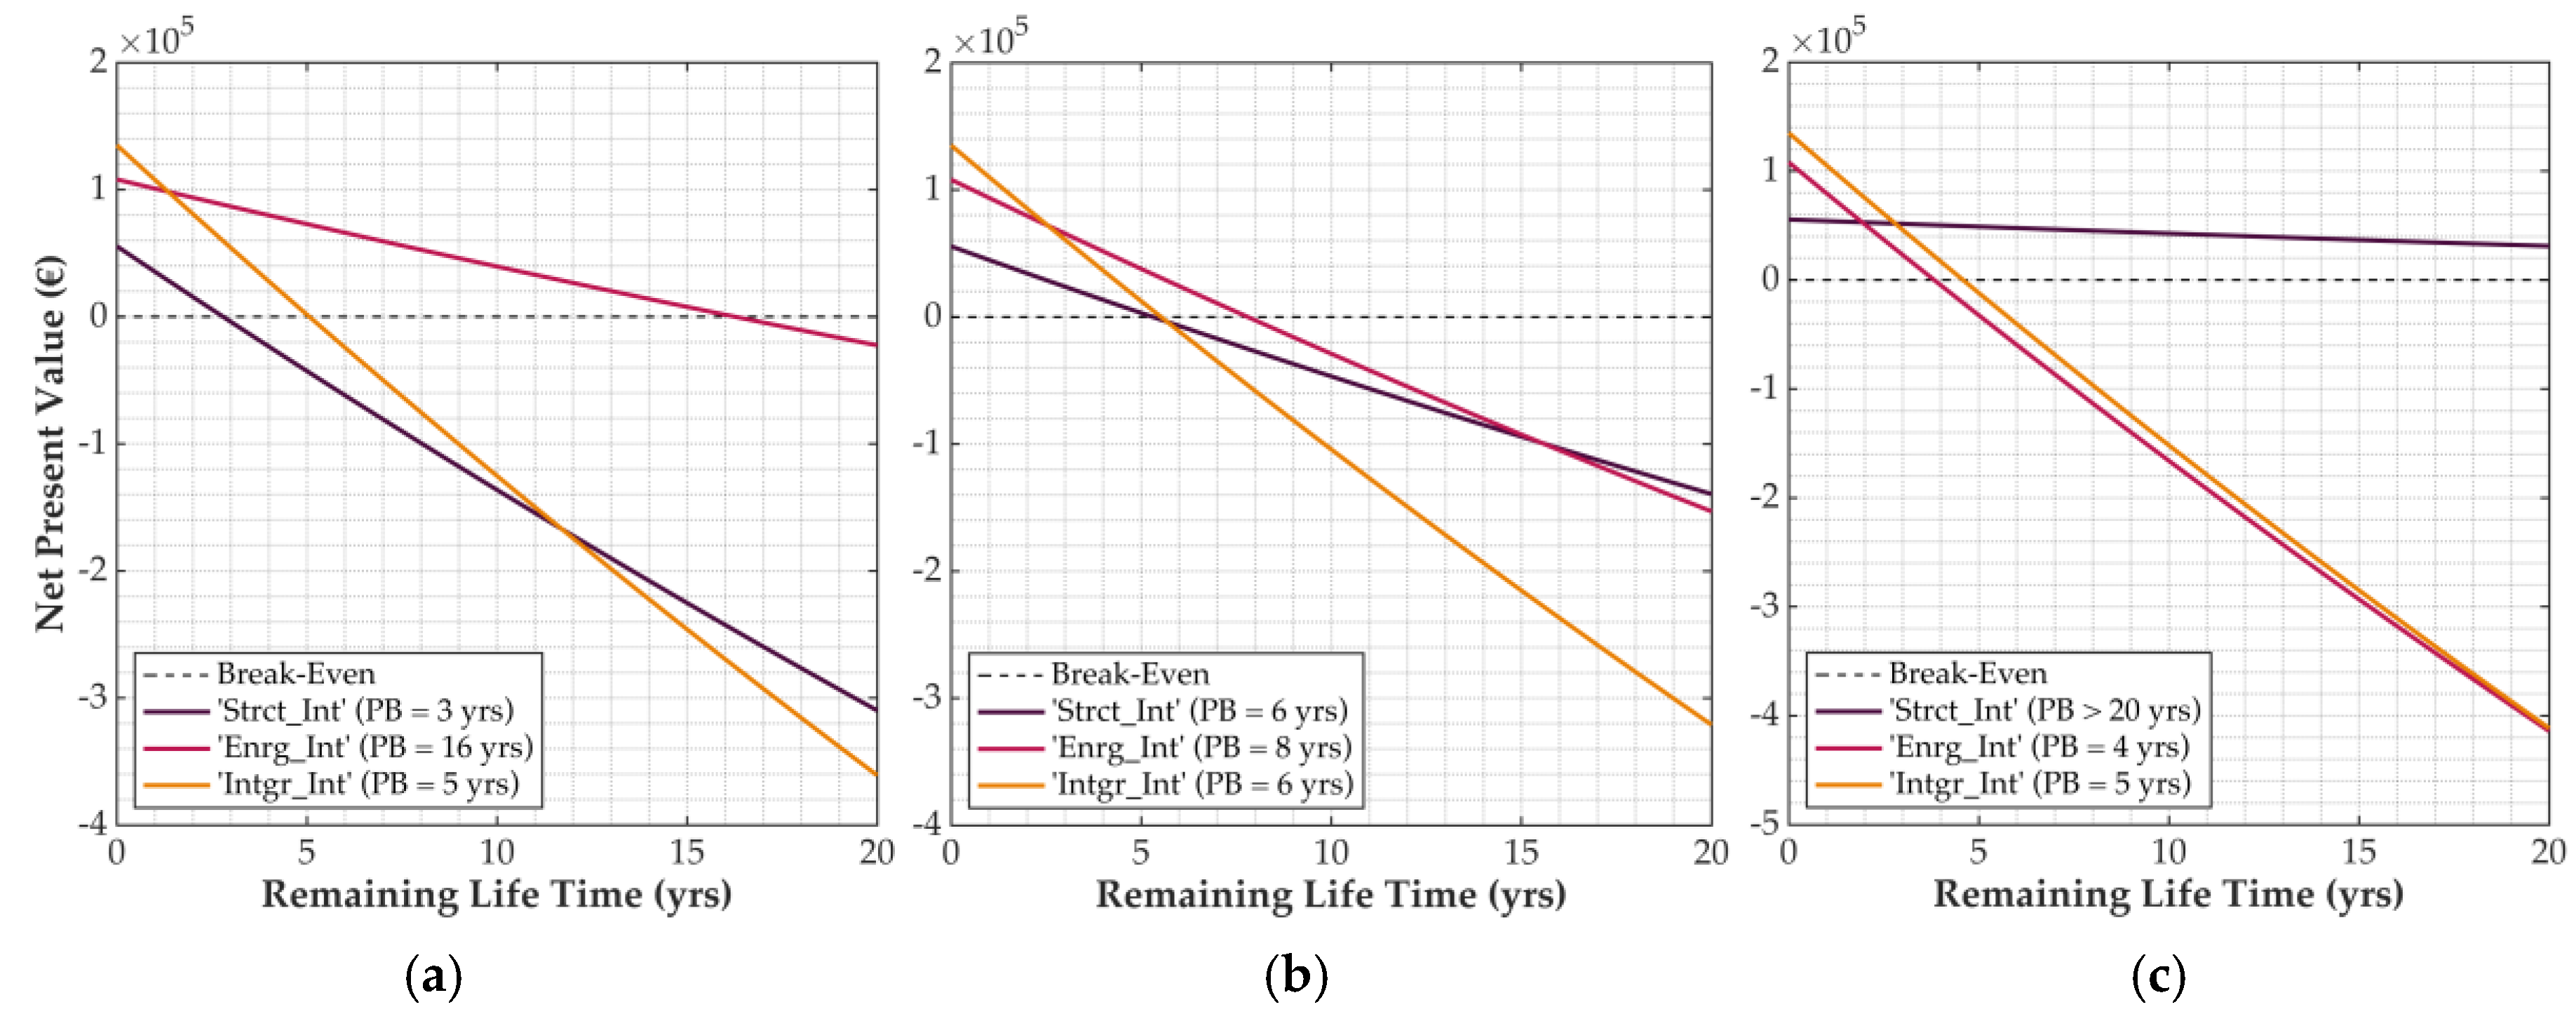
3.3. Payback Period
As already discussed, in a decision-making process it is critical to evaluate and consider not only the initial investment associated to a given retrofit intervention, but also the ensuing long-term savings. A breakeven analysis is thus carried out to assess, for each retrofit scenario, the corresponding payback period (PB), i.e., the number of years needed to pay back the initial investment with the benefits due to the reduction of annual costs thanks to the retrofit option adopted—e.g., the reduction of AAL for the “Strct_Int”, or the reduction of energy consumption for the “Enrg_Int”, or even the reduction of both for the “Intgr_Int”. To perform this analysis, the net present value (NPV) of the investment for the retrofit intervention over the time interval
t is calculated as follows:
including the contributions of the retrofit intervention itself (
RI), and the variations of annual costs due to earthquake losses and energy consumption (
AAL and
EC, respectively) in the post-retrofit configuration, during the remaining service life of the building (
SL2), pertinently adjusted through the discount rate
rd. The PB is equal to the time interval
t resulting in a negative NPV in Equation (2).
Figure 5 compares the NPVs of the different retrofit options in the three geographic locations. It is interesting to see that for “Warm_HighEq” Site, the structural retrofit has the lowest PB, but the coupled intervention seems to be equally, or even more, attractive in a long-term perspective. On the contrary, for “Cold_LowEq” Site, the structural retrofit has the longest payback, since it is surely more urgent to do an energy refurbishment. As already observed, however, the integrated strategy is very convenient in all sites, including from the PB viewpoint, where results are consistently low.
3.4. Average Annual Loss of Life (AALL)
Amongst the major concerns related to earthquake occurrence, the possibility of loss of life is probably the most significant issue in terms of social impact. As described in [
43], fatalities due to seismic events are mostly caused by structural failures and consequent buildings partial or total collapses. Non-structural components can also be responsible for deaths or serious injuries, and their contribution is usually dominant for low-damage levels, albeit difficult to predict. Other causes for casualties include follow-on hazards (e.g., fires, landslides, tsunamis, amongst others), infrastructure accidents, hearth attacks, and so on. The number of deaths and injuries may vary significantly between seismic events even of similar characteristics; the building structural typology and geometric characteristics, the number of people inside the building and the occupancy type, the time of the day or even the season of earthquake occurrence, are amongst the main factors influencing the number of casualties due to a seismic event.
At this stage of the study, the sole loss of life due to earthquakes is considered, neglecting injured and homeless. The average annual loss of life (AALL) is thus suggested as an additional meaningful parameter in the selection of the optimal renovation strategy for a building, so as to properly address earthquake-related social consequences. As for other parameters discussed already, one can use the preferred casualty model to compute the average annual fatalities. Several fatality models are available, such as the one included in the PEER PBEE methodology [
35], the one by Coburn et al. [
43], or its adaptation to the Italian case by Zuccaro and Cacace [
44]. It is however expected that different methods lead to different estimates, being built upon different assumptions and characterized by non-negligible uncertainties.
For illustration purposes, values of AALL equal to 0.18, 0.09 and 0.03 fatalities per year were assumed, respectively, for the “Warm_HighEq”, “Mild_AvgEq”, and “Cold_LowEq” sites. A reduction of 1/3 of the AALL after the introduction of new RC shear walls (“Strct_Int”) was also assumed to account for the positive effect that the structural intervention has on the reduction of potential fatalities in the sample building. It is again underlined that these numerical assumptions are only functional to the illustrative example.
3.5. Life Cycle Performance Metrics for the Selection of the Optimal Retrofit Solution
The results obtained in
Section 3.2,
Section 3.3 and
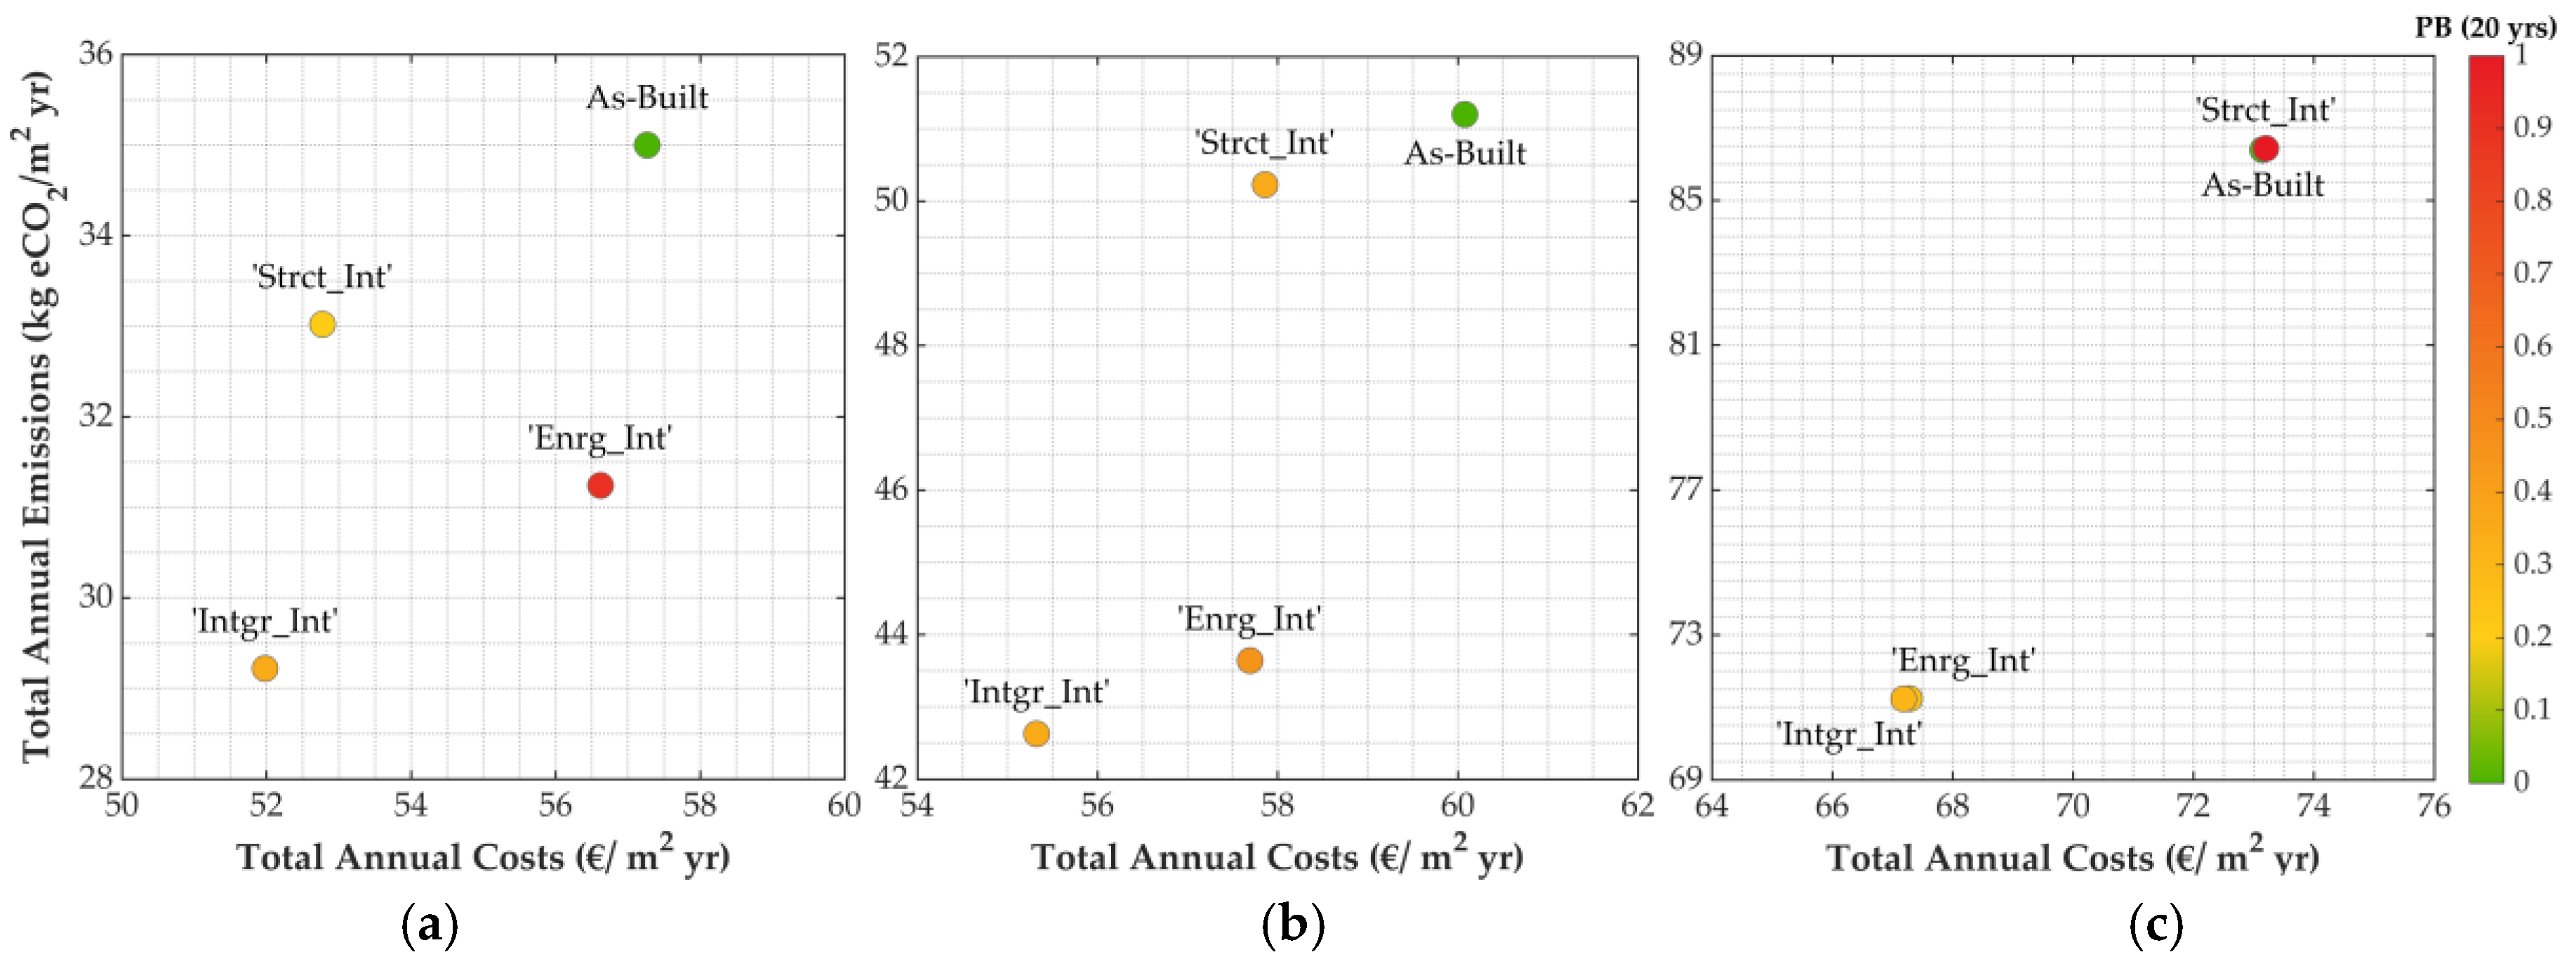
Section 3.4 above are herein plotted together, in normalized fashion, with a view to explore ways in which they may be readily employed to aid the process of selecting the optimal retrofit option for a given site of interest, considering the entire life cycle of the building. The payback period is normalized with respect to the assumed remaining life of the building (20 years in the current example), whilst the AALL is normalized with respect to the number of building occupants, assumed to be equal to 200.
Figure 6 compares the results for the three considered locations when the retrofit intervention is assumed to take place 30 years on from construction. The optimal retrofit option, considering the total annual costs and carbon emissions as performance metrics, would be the closest to the axes origin (as had been shown before, these new plots render once again evident that the integrated retrofit solution constitutes the optimal solution). Furthermore, the color scale also provides an indication on the payback period, with green indicating an earlier payback period and red standing for a longer time to recover the investment on retrofit.
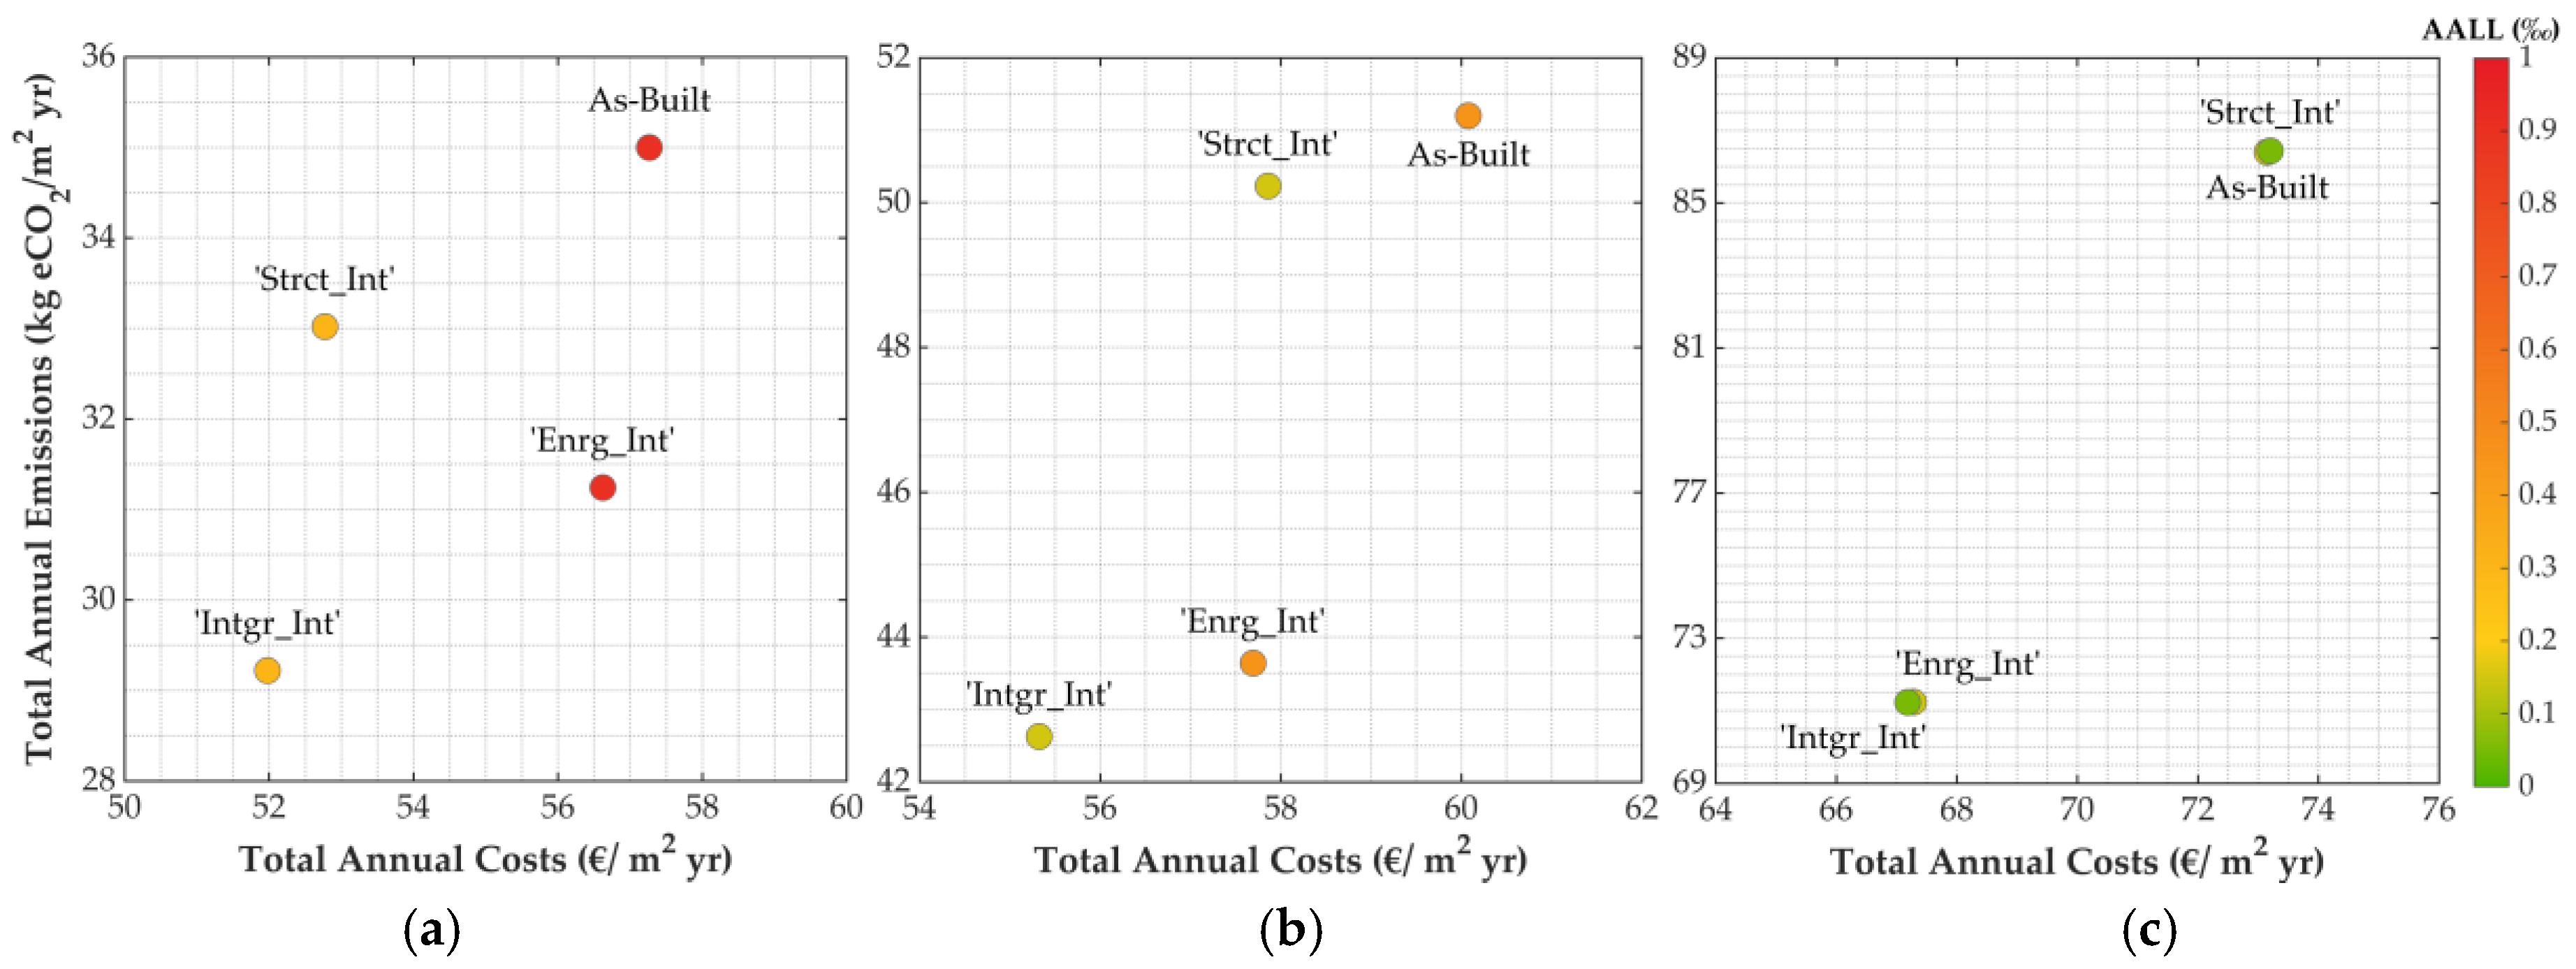
Figure 7 compares instead the results for the three considered sites, together with the normalized AALL. The color scale provides an indication on the normalized number of average annual fatalities, with green-to-red colors standing for increasing number of resulting casualties. The optimal retrofit option, in terms of life cycle costs and carbon emissions, is naturally still the one that is closest to the axes origin, i.e., the integrated intervention, but these alternative plots highlight also the impact of the interventions in terms of occupants life protection. Indeed, considering e.g., the “Mild_AvgEq” site from
Figure 6 alone, one could be led to conclude that there is no significant difference between the integrated intervention and the sole energy refurbishment (in terms of life cycle costs and carbon emissions) and that therefore it could be better to avoid longer working times and higher invasiveness of intervention by choosing the sole energy retrofitting option. However, if one then refers to the analogous plot in
Figure 7, it is evident that the possibility of loss of life should not be ignored and that the sole energy refurbishment does not improve the as-built configuration in terms of life protection, whilst the integrated option confirms its optimality in those terms as well.
4. Discussion
The application to an illustrative example of the proposed life cycle methodology for the identification of renovation strategies that lead to an optimal balance between reduction of seismic vulnerability and increase of energy efficiency of a building, showed that:
life cycle monetary expenses and equivalent carbon emissions can be used as performance metrics to select the optimal retrofit solution for the site of interest, and the payback period and the average annual loss of life due to potential earthquakes are additional decision-making support tools;
every life cycle calculation module included within the framework can be performed individually or in groups depending on the scenario of interest, with the possibility to add the contributions of other natural hazards of interest;
the time of intervention may contribute significantly to total annual costs and carbon emissions, and the more effective a retrofit option is, the higher the discrepancies considering different times of intervention;
integrated renovation strategies are always convenient, especially in a long-term perspective, minimizing life cycle costs and carbon emissions, payback periods and potential fatalities due to earthquakes;
long-term expenses and impacts are as important as one-off direct costs and carbon emissions of the retrofit intervention.
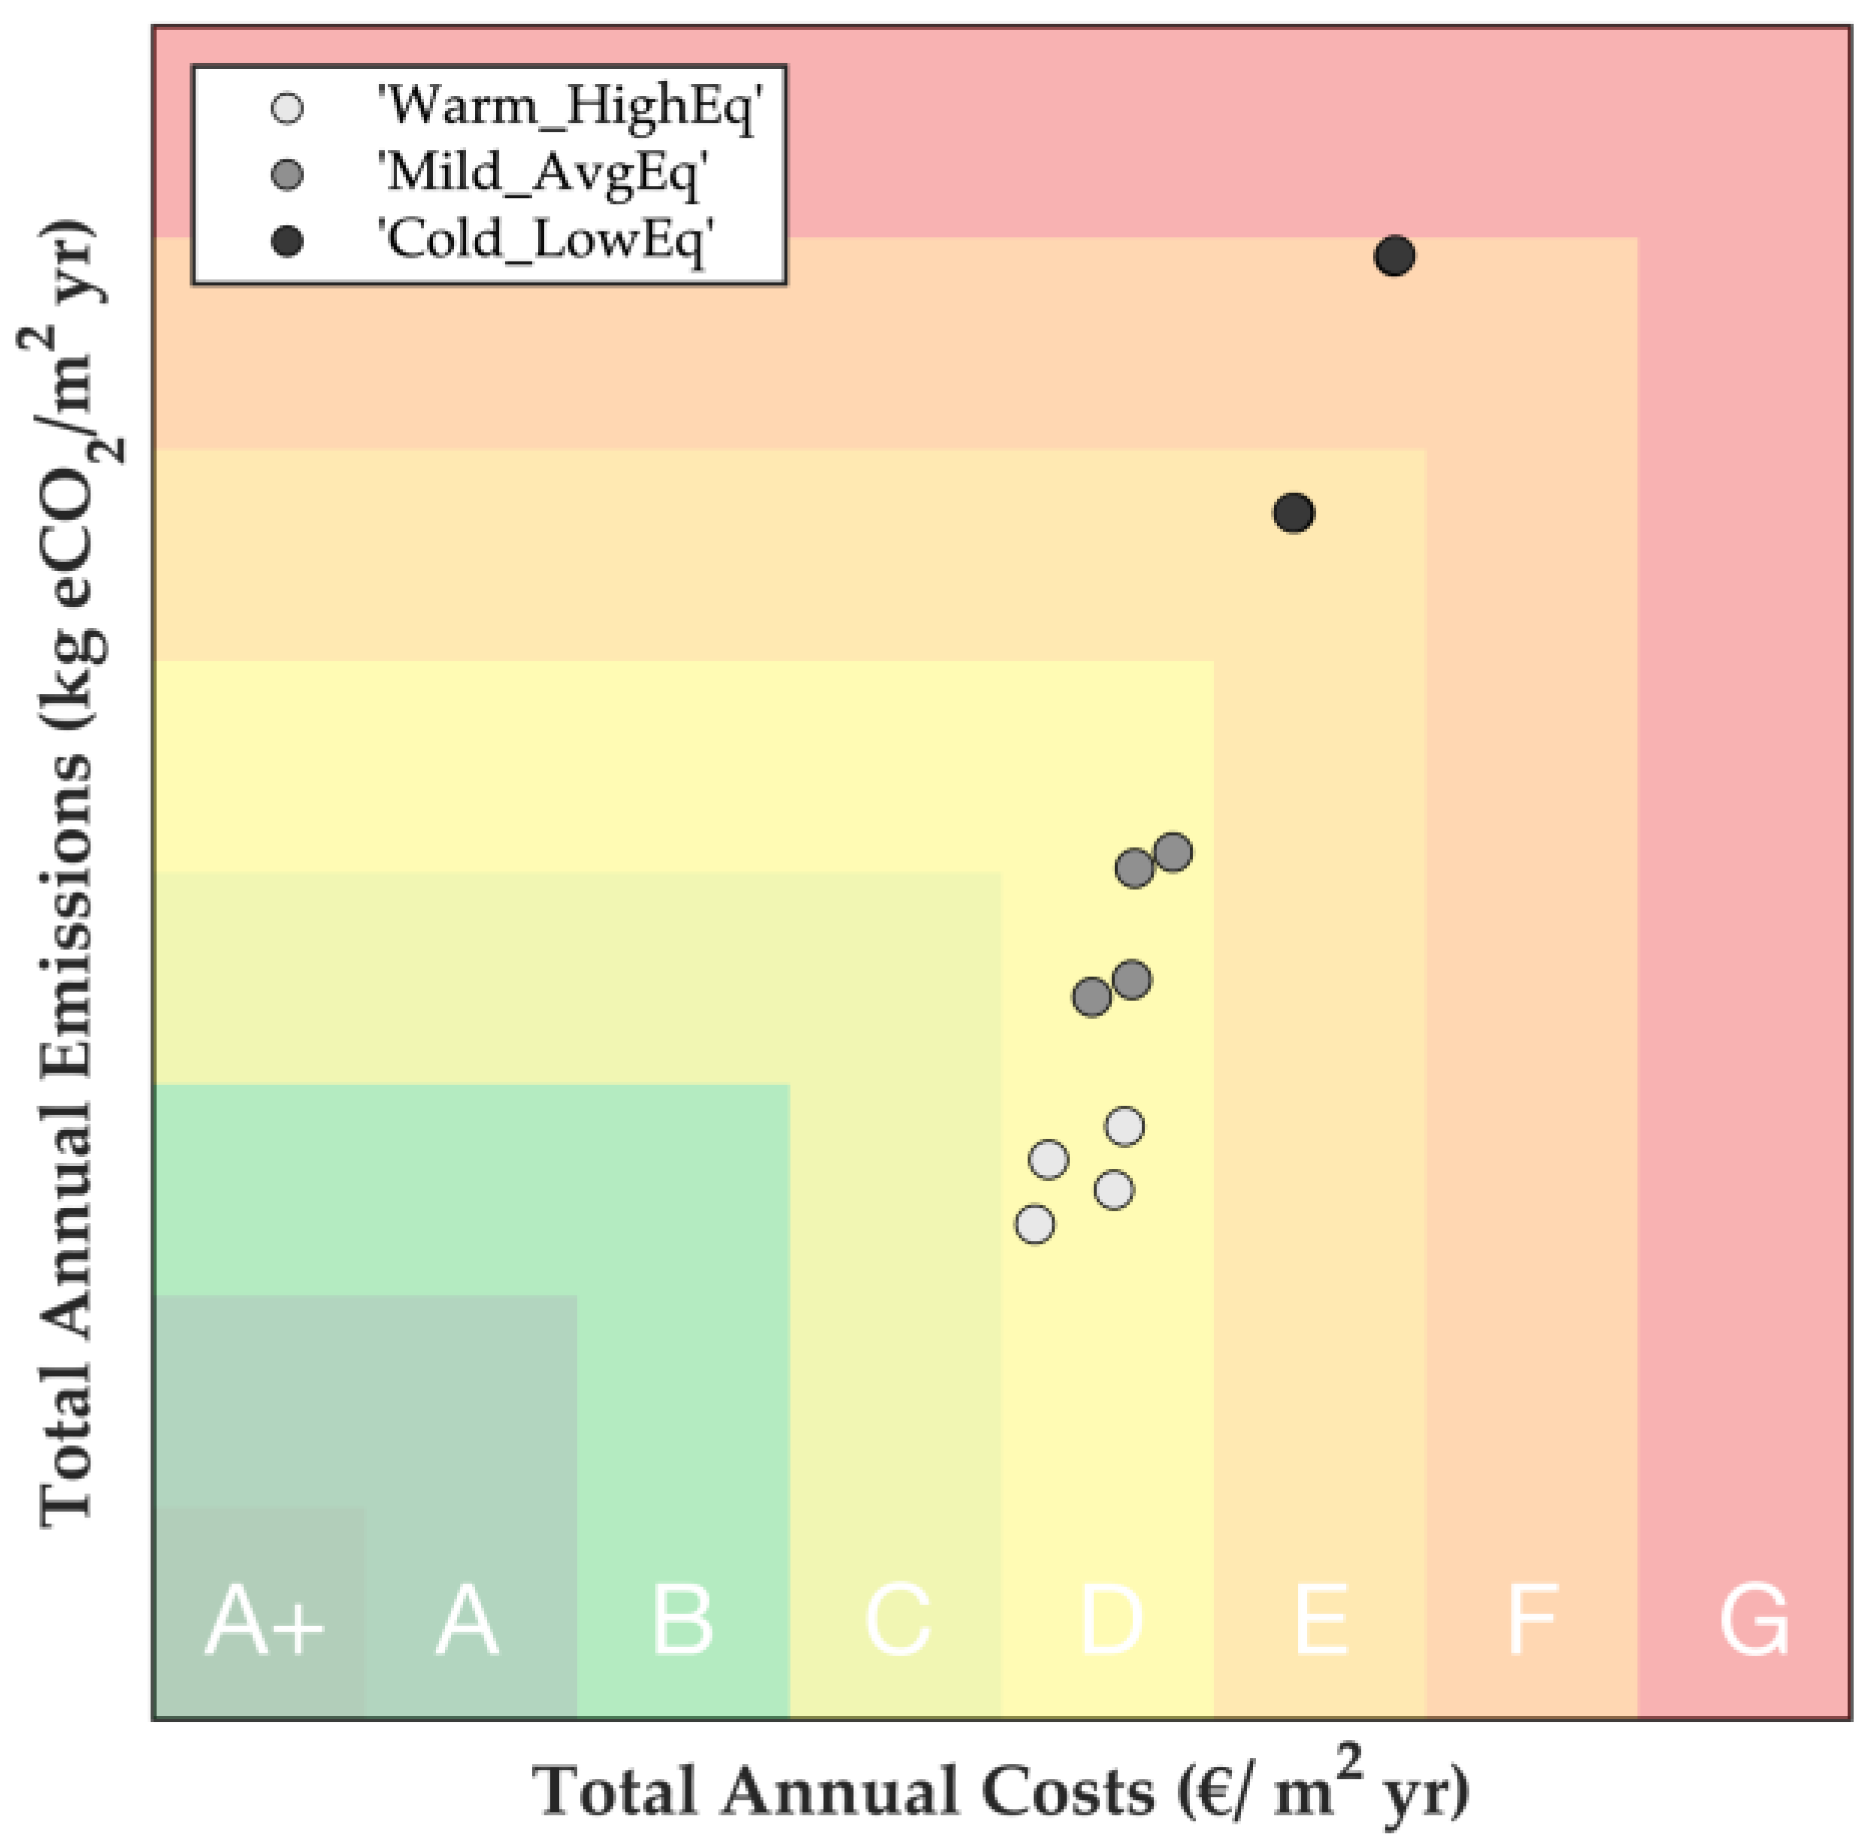
Noteworthily, if the results obtained for the three different considered sites (“Warm_HighEq”, “Mild_AvgEq”, “Cold_LowEq”) are plotted in the same graph (
Figure 8), a somewhat interesting linear trend between life cycle costs and carbon emissions seems to emerge; a much higher number of applications should be carried out though in order to investigate if the same or different trends will be observed when reproducing the calculations proposed herein for varied buildings and different geographic locations.
Figure 8 also hints at the possibility of using this plot of normalized total annual costs and carbon emissions as the basis for a new classification system that integrates life cycle economic and environmental impacts considering both seismic vulnerability and energy efficiency of a given building. It is noted that the horizontal and vertical axes have been purposely left unnumbered in this plot (though the values in question can be readily inferred from
Figure 6 and
Figure 7 above), so as to underline the fact that this is a conceptual plot where the correspondence between cost/emission value ranges and the color scale in
Figure 8 is purely demonstrative; a significantly more extensive study will need to be carried out in order to define appropriate ranges of values for each one of the classes.
Clearly, in order to add further completeness and robustness to the proposed framework, a number of further investigations could be carried out, including the consideration of indirect losses, i.e., those associated to the partial or total interruption of the activities inside the building (the so-called downtime) due to earthquakes, the possibility of an elongation of the building service life due to the retrofit intervention adopted, and the application of the framework to existing case-study buildings. That said, it is believed that the proposed framework provides, as it currently stands, a viable and practical approach for life cycle-based identification of optimal building renovation strategies, as well as for classifying buildings on the basis of life cycle economic and environmental impacts considering both seismic vulnerability and energy efficiency of a given building.
5. Conclusions
The European building stock, being both earthquake-prone and heavily energy-consuming, would strongly reduce its life cycle costs and environmental impacts through a wide strategy of renovation. However, the current renovation rate is still very low, and the awareness of the importance of integrating seismic and energy aspects emerged only recently, especially in geographic locations characterized by high seismic and energy demands. In this paper, it was underlined that the renovation of existing buildings should be addressed according to sustainable principles, considering environmental, economic and social issues, within a life cycle perspective. The main objective of this study was thus the proposal of a life cycle framework for the identification of the optimal renovation strategy for buildings, through the quantification of the economic and environmental contributions of multiple building life cycle stages, including the additional effects of earthquake-induced damage and repair activities and of possible retrofit interventions.
The proposed methodology features the explicit quantification of the economic and environmental contributions of initial construction, operational energy consumption, earthquake-induced damage repair activities, retrofitting interventions, and demolition. Monetary expenses and equivalent carbon emissions evaluated in a life cycle perspective are thus indicated as meaningful performance metrics to identify the renovation strategy that provides an optimal balance between the reduction of seismic vulnerability and the improvement of energy efficiency, depending on the seismic demands and the energy needs at the site of interest. The payback period and the average loss of life due to earthquakes are suggested as additional decision-making support tools, due to the perceived value of both the time needed to pay back an investment and the possibility of incurring earthquake-induced victims. In this way, a quantitative comparison between alternative retrofit options can be undertaken through life cycle parameters, and the optimal renovation strategy corresponds to the one with the lowest life cycle parameters that guarantee the best balance with the payback period and the average loss of life.
It was shown that the time of intervention on a building quantitively influences the life cycle performance metrics, due to the vulnerable and energy-consuming as-built configuration if compared to retrofitted configurations, as well as the seismic and climatic conditions at the site of interest. Integrated renovation strategies proved to be always convenient, especially in a long-term perspective, highlighting the need to mitigate both seismic vulnerability and energy consumption with a view to reduce both life cycle costs and equivalent carbon emissions.
Furthermore, a potential new integrated building classification system, based on life cycle economic and environmental impacts considering both seismic vulnerability and energy efficiency, that would thus go much beyond the currently unconnected building energy and seismic classification systems, was also proposed.
Author Contributions
Conceptualization, R.P. and M.C.; methodology, M.C., R.P., M.T.L., F.B. and F.C.; software, M.C. and M.T.L.; validation, R.P., F.C., F.B., M.T.L. and M.C.; formal analysis, M.C.; investigation, M.C.; resources, M.C., F.C., M.T.L., F.B. and R.P.; data curation, M.C.; writing—original draft preparation, M.C.; writing—review and editing, R.P. and M.C.; visualization, M.C.; supervision, R.P., F.B. and F.C.; project administration, R.P.; funding acquisition, R.P. All authors have read and agreed to the published version of the manuscript.
Funding
This research was funded by the Italian Civil Protection Department, within the framework of the ReLUIS-DPC 2019–2021 research project, more specifically its WP5 activities (focused on the development and verification of integrated seismic and energy retrofitting solutions).
Acknowledgments
The authors would like to acknowledge the very insightful and useful discussions with Helen Crowley on different aspects of seismic risk assessment. The constructive feedback of two anonymous reviewers, which led to a clear improvement of the original version of the manuscript, is also gratefully recognised.
Conflicts of Interest
The authors declare no conflict of interest. The funders had no role in the design of the study; in the collection, analyses, or interpretation of data; in the writing of the manuscript, or in the decision to publish the results.
References
- Belleri, A.; Marini, A. Does seismic risk affect the environmental impact of existing buildings? Energy Build. 2016, 110, 149–158. [Google Scholar] [CrossRef]
- Menna, C.; Asprone, D.; Jalayer, F.; Prota, A.; Manfredi, G. Assessment of ecological sustainability of a building subjected to potential seismic events during its lifetime. Int. J. Life Cycle Assess. 2013, 18, 504–515. [Google Scholar] [CrossRef]
- European Commission. Energy-Efficient Buildings PPP: Multi-Annual Roadmap and Longer Term Strategy; Publications Office of the European Union: Luxembourg, 2010. [Google Scholar]
- Negro, P.; Dimova, S.; Bournas, D.; Tsionis, G.; Strezova, D. Integrated Techniques for the Seismic Strengthening and Energy Efficiency of Existing Buildings: A Pilot Project. In Proceedings of the 17th World Conference on Earthquake Engineering (17WCEE), Sendai, Japan, 13–18 September 2020. [Google Scholar]
- Passoni, C.; Marini, A.; Belleri, A.; Menna, C. Redefining the concept of sustainable renovation of buildings: State of the art and an LCT-based design framework. Sustain. Cities Soc. 2020, 64, 102519. [Google Scholar] [CrossRef]
- Hasik, V.; Chhabra, J.P.S.; Warn, G.P.; Bilec, M.M. Review of approaches for integrating loss estimation and life cycle assessment to assess impacts of seismic building damage and repair. Eng. Struct. 2018, 175, 123–137. [Google Scholar] [CrossRef]
- Caruso, M.; Bianchi, F.; Cavalieri, F.; Pinho, R. Critical overview and application of integrated approaches for seismic loss estimation and environmental impact assessment. In Proceedings of the RILEM Book Series of the 3rd RILEM Spring Convention and Conference (RSCC2020), Guimarães, Portugal, 10–14 March 2020. in press. [Google Scholar]
- Menna, C.; Vitiello, U.; Mauro, G.M.; Asprone, D.; Bianco, N.; Prota, A. Integration of Seismic Risk into Energy Retrofit Optimization Procedures: A Possible Approach Based on Life Cycle Evaluation. In IOP Conference Series: Earth and Environmental Science; IOP Publishing Ltd.: Bristol, UK, 2019; p. 012022. [Google Scholar]
- Chhabra, J.P.S.; Hasik, V.; Bilec, M.M.; Warn, G.P. Probabilistic Assessment of the Life-Cycle Environmental Performance and Functional Life of Buildings due to Seismic Events. J. Archit. Eng. 2018, 24, 04017035. [Google Scholar] [CrossRef]
- Mauro, G.M.; Menna, C.; Vitiello, U.; Asprone, D.; Ascione, F.; Bianco, N.; Prota, A.; Vanoli, G.P. A Multi-Step Approach to Assess the Lifecycle Economic Impact of Seismic Risk on Optimal Energy Retrofit. Sustainability 2017, 9, 989. [Google Scholar] [CrossRef]
- Welsh-Huggins, S.J.; Liel, A.B. A life-cycle framework for integrating green building and hazard-resistant design: Examining the seismic impacts of buildings with green roofs. Struct. Infrastruct. E 2017, 13, 19–33. [Google Scholar] [CrossRef]
- Alirezaei, M.; Noori, M.; Tatari, O.; Mackie, K.R.; Elgamal, A. BIM-based Damage Estimation of Buildings under Earthquake Loading Condition. Procedia Eng. 2016, 145, 1051–1058. [Google Scholar] [CrossRef][Green Version]
- Calvi, G.M.; Sousa, L.; Ruggeri, C. Energy Efficiency and Seismic Resilience: A Common Approach. In Multi-hazard Approaches to Civil Infrastructure Engineering; Gardoni, P., LaFave, J.M., Eds.; Springer International Publishing: Cham, Switzerland, 2016; pp. 165–208. ISBN 978-3-319-29713-2. [Google Scholar]
- Gencturk, B.; Hossain, K.; Lahourpour, S. Life cycle sustainability assessment of RC buildings in seismic regions. Eng. Struct. 2016, 110, 347–362. [Google Scholar] [CrossRef]
- Padgett, J.E.; Li, Y. Risk-Based Assessment of Sustainability and Hazard Resistance of Structural Design. J. Perform. Constr. Fac. 2016, 30, 04014208. [Google Scholar] [CrossRef]
- Wei, H.-H.; Skibniewski, M.J.; Shohet, I.M.; Yao, X. Lifecycle Environmental Performance of Natural-Hazard Mitigation for Buildings. J. Perform. Constr. Fac. 2016, 30, 04015042. [Google Scholar] [CrossRef]
- Simonen, K.; Merrifield, S.; Almufti, I.; Strobel, K.; Tipler, J. Integrating Environmental Impacts as Another Measure of Earthquake Performance for Tall Buildings in High Seismic Zones. In Proceedings of the Structures Congress 2015, Palo Alto, CA, USA, 23–25 April 2015; pp. 933–944. [Google Scholar]
- Chiu, C.K.; Chen, M.R.; Chiu, C.H. Financial and Environmental Payback Periods of Seismic Retrofit Investments for Reinforced Concrete Buildings Estimated Using a Novel Method. J. Archit. Eng. 2013, 19, 112–118. [Google Scholar] [CrossRef]
- Comber, M.V.; Poland, C.; Sinclair, M. Environmental Impact Seismic Assessment: Application of Performance-Based Earthquake Engineering Methodologies to Optimize Environmental Performance. In Proceedings of the Structures Congress 2012, Chicago, IL, USA, 29–31 March 2012; pp. 910–921. [Google Scholar]
- ISO 14040: 2006. Environmental Management—Life Cycle Assessment—Principles and Framework; International Organization for Standardization (ISO): Geneva, Switzerland, 2006. [Google Scholar]
- ISO 14044:2006. Environmental Management—Life Cycle Assessment—Requirements and Guidelines; International Organization for Standardization (ISO): Geneva, Switzerland, 2006. [Google Scholar]
- ISO 21931:2010. Sustainability in Building Construction—Framework for Methods of Assessment of the Environmental Performance of Construction Works—Part. 1: Buildings; International Organization for Standardization (ISO): Geneva, Switzerland, 2010. [Google Scholar]
- EN 15978:2011. Sustainability of Construction Works—Assessment of Environmental Performance of Buildings—Calculation Method; European Committee for Standardization (CEN): Brussels, Belgium, 2011. [Google Scholar]
- Applied Technology Council (ATC). Seismic Performance Assessment of Buildings. Volume 4- Methodology for Assessing Environmental Impacts; Rep. No. FEMA P-58-4; Federal Emergency Management Agency (FEMA): Washington, DC, USA, 2018; Available online: https://femap58.atcouncil.org/reports (accessed on 6 December 2020).
- Thinkstep. GaBi v2.0. Available online: http://www.gabi-software.com/italy/index/ (accessed on 6 December 2020).
- PRé Consultants. SimaPro|The World’s Leading LCA Software. Available online: https://simapro.com/ (accessed on 6 December 2020).
- Athena Sustainable Materials Institute. Athena Impact Estimator for Buildings. Available online: http://www.athenasmi.org/ (accessed on 6 December 2020).
- KT Innovations. Tally. Available online: https://choosetally.com/ (accessed on 6 December 2020).
- Swiss Centre for Life Cycle Inventories. Ecoinvent v3.6. Available online: https://www.ecoinvent.org/ (accessed on 6 December 2020).
- U.S. Life Cycle Inventory Database. Available online: https://www.nrel.gov/lci/index.html (accessed on 6 December 2020).
- Leontief, W. Input-Output Economics, 2nd ed.; Oxford University Press: New York, NY, USA, 1986; ISBN 978-0-19-536522-1. [Google Scholar]
- Carnegie Mellon University Green Design Institute (CMUGDI). Free Life Cycle Assessment on the Internet. Available online: http://www.eiolca.net/cgi-bin/dft/use.pl (accessed on 6 December 2020).
- Weber, C.; Matthews, D.; Venkatesh, A.; Matthews, H.S. The 2002 US Benchmark Version of the Economic Input-Output Life Cycle Assessment (EIO-LCA) Model; Green Design Institute at Carnegie Mellon University: Pittsburg, PA, USA, 2009; Available online: http://www.eiolca.net/docs/index.html (accessed on 6 December 2020).
- Hammond, G.P.; Jones, C.I. Embodied energy and carbon in construction materials. Proc. Inst. Civ. Eng. Energy 2008, 161, 87–98. [Google Scholar] [CrossRef]
- Applied Technology Council (ATC). Seismic Performance Assessment of Buildings. Volume 1-Methodology; Rep. No. FEMA P-58-1; Federal Emergency Management Agency (FEMA): Washington, DC, USA, 2018; Available online: https://femap58.atcouncil.org/reports (accessed on 6 December 2020).
- Applied Technology Council (ATC). Seismic Performance Assessment of Buildings. Volume 2-Implementation Guide; Rep. No. FEMA P-58-2; Federal Emergency Management Agency (FEMA): Washington, DC, USA, 2018; Available online: https://femap58.atcouncil.org/reports (accessed on 6 December 2020).
- Applied Technology Council (ATC). Seismic Performance Assessment of Buildings. Volume 3–Supporting Electronic Materials and Background Documentation; Rep. No. FEMA P-58-3; Federal Emergency Management Agency (FEMA): Washington, DC, USA, 2018; Available online: https://femap58.atcouncil.org/reports (accessed on 6 December 2020).
- Kircher, C.A.; Whitman, R.V.; Holmes, W.T. HAZUS Earthquake Loss Estimation Methods. Nat. Hazards Rev. 2006, 7, 45–59. [Google Scholar] [CrossRef]
- EnergyPlus. Available online: https://energyplus.net/ (accessed on 6 December 2020).
- Edilclima. EC700 » Edilclima Engineering & Software. Available online: https://www.edilclima.it/software-termotecnica/prog-termotecnica-energetica/scheda/700 (accessed on 6 December 2020).
- Lamperti Tornaghi, M.; Loli, A.; Negro, P. Balanced Evaluation of Structural and Environmental Performances in Building Design. Building 2018, 8, 52. [Google Scholar] [CrossRef]
- European Parliament and Council. Directive 2008/98/EC of the European Parliament and of the Council of 19 November 2008 on Waste and Repealing Certain Directives; Official Journal of the European Union: Brussels, Belgum, 2008; Volume 312. [Google Scholar]
- Coburn, A.W.; Spence, R.J.S.; Pomonis, A. Factors Determining Human Casualty Levels in Earthquakes: Mortality Prediction in Building Collapse. In Proceedings of the 10th World Conference on Earthquake Engineering, Madrid, Spain, 19–24 July 1992. [Google Scholar]
- Zuccaro, G.; Cacace, F. Seismic Casualty Evaluation: The Italian Model, an Application to the L’Aquila 2009 Event. In Human Casualties in Earthquakes: Progress in Modelling and Mitigation; Spence, R., So, E., Scawthorn, C., Eds.; Advances in Natural and Technological Hazards Research; Springer: Dordrecht, The Netherlands, 2011; pp. 171–184. ISBN 978-90-481-9455-1. [Google Scholar]
| Publisher’s Note: MDPI stays neutral with regard to jurisdictional claims in published maps and institutional affiliations. |
© 2020 by the authors. Licensee MDPI, Basel, Switzerland. This article is an open access article distributed under the terms and conditions of the Creative Commons Attribution (CC BY) license (http://creativecommons.org/licenses/by/4.0/).

 ,
, 


