Article

The Numerical Diffusion Effect on the CFD Simulation Accuracy of Velocity and Temperature Field for the Application of Sustainable Architecture Methodology

by
Vladimíra Michalcová
1 and
Kamila Kotrasová
2,*
1
Department of Structural Mechanics, Faculty of Civil Engineering, VSB—Technical University of Ostrava, Ludvíka Podéště 1875/17, 708 33 Ostrava-Poruba, Czech Republic
2
Institute of Structural Engineering, Faculty of Civil Engineering, The Technical University of Košice, Vysokoškolská 4, 042 00 Košice, Slovakia
*
Author to whom correspondence should be addressed.
Sustainability 2020, 12(23), 10173; https://doi.org/10.3390/su122310173
Submission received: 9 November 2020 / Revised: 26 November 2020 / Accepted: 3 December 2020 / Published: 5 December 2020
(This article belongs to the Special Issue Civil Engineering as a Tool for Developing a Sustainable Society)

Abstract

:
Numerical simulation of fluid flow and heat or mass transfer phenomenon requires numerical solution of Navier–Stokes and energy-conservation equations, together with the continuity equation. The basic problem of solving general transport equations by the Finite Volume Method (FVM) is the exact calculation of the transport quantity. Numerical or false diffusion is a phenomenon of inserting errors in calculations that threaten the accuracy of the computational solution. The paper compares the physical accuracy of the calculation in the Computational Fluid Dynamics (CFD) code in Ansys Fluent using the offered discretization calculation schemes, methods of solving the gradients of the transport quantity on the cell walls, and the influence of the mesh type. The paper offers possibilities on how to reduce numerical errors. In the calculation area, the sharp boundary of two areas with different temperatures is created in the flow direction. The three-dimensional (3D) stationary flow of the fictitious gas is simulated using FVM so that only advective transfer, in terms of momentum and heat, arises. The subject of the study is to determine the level of numerical diffusion (temperature field scattering) and to evaluate the values of the transport quantity (temperature), which are outside the range of specified boundary conditions at variously set calculation parameters.

1. Introduction

Aerodynamics deals with the movement of the air and the interaction between airflow and solid objects. Aerodynamics of buildings study the physical problems of airflow effects on buildings and their surroundings. The motion of the air—the wind—affects not only the design of the load-bearing parts of the building structures, but the dimensioning and construction of their non-load-bearing parts. One of the important areas of sustainable architecture is the knowledge of airflow effects on the surrounding objects [1]. The wind significantly affects the energy efficiency of buildings [2], associated with the general phenomenon of air filtration [3] (see Figure 1), the details, elements, and systems of the packaging structures [4].
The aerodynamics of a building examines the effect of the wind on the structure itself [5], the air velocity near the structure [6,7,8,9,10] (see Figure 2), the pressure on the structure [5,11], the turbulence around the building [12], and the influence of meteorological conditions [13]. The mutual grouping of the buildings modifies the airflow, which creates the windy climate in their surroundings [14], and affects the human–wind interaction, human safety, and thermal comfort [15]. By studying the wind movement in relation to the wider topographical units, it is possible to positively regulate the efficiency of the ventilation of the urban units, the scattering of the exhaust fumes, and the formation of snowdrifts around the buildings and the line transport structures [16,17,18].
The results of the interaction of air movement and construction can be obtained from real measurements [19], from building scale models in the wind tunnel [20,21,22], as well as by using computer simulations. Computational Fluid Dynamics (CFD), also called CFD flow analysis, is one of the basic methods in numerical modeling concerning fluid flow, and it is used as a solution to engineering problems in almost all industries [23,24], especially in building construction [4,10].
The numerical solution of the general transport equations in the Ansys Fluent software by the Finite Volume Method (FVM) uses the discretization process, in which the basic problem is the accurate calculation of the transport quantity through the walls of the particular volume and its advective flow across these boundaries [25]. When calculating, it is necessary to count with the occurrence of the so-called “numerical diffusion”, often referred to in literature as “diffusion error” or “numerical viscosity” [26], and with the occurrence of values that are outside the range of the correct solution [27]. This non-physical CFD artifact impairs the accuracy of the discrete solutions of the equations in describing the advection transport of the scalar [28]. It is known that the numerical diffusion occurs mainly in the case where the flow direction is not parallel to the grid walls [29].
However, the optimal states (parallel flow) can only be achieved by calculating straight sections of pipeline without the obstacles using the hexahedral cells [30]. The direction of the flow is always in the general direction with respect to the cell walls (hexahedral, tetrahedral, and polyhedral) in the most flows [31]. When evaluating the advective state, it is necessary to consider the numerical error (numerical diffusion) [32]. This causes considerable problems in the numerical solving of several technical problems, including sustainable architecture.
There are a number of studies improving the numerical solution. Total Variation Diminishing (TVD) schemes have been [33] a widely applied group of monotonicity-preserving advection differencing schemes for partial differential equations in numerical computational fluid dynamics and heat transfer since the last century. Many scientific teams continue to develop this TVD method. It allows the implementation of the whole spectrum of TVD schemes into unstructured networks, while their exact formulation was restored on structured networks [34]. The authors [35] analyzed the TVD differencing on unstructured three-dimensional meshes, focusing on the non-linearity of TVD differencing and the extrapolation of the virtual upwind node. Furthermore, they proposed a novel monotonicity-preserving correction method for the TVD schemes that significantly reduces the numerical diffusion caused by mesh skewness. The authors [36] analyzed the causes of the numerical errors, in terms of the numerical diffusion and the compression arising from the use of the explicit second-order total variation diminishing schemes in the one-dimensional advection simulation.
The presented work offers possibilities on how to reduce the numerical errors in Ansys Fluent software using the correct calculation settings. It uses the available discretization schemes in the software, together with the available solutions methods of transport quantity gradients. The physical accuracy of the calculations, for the various combination-listed parameters, is monitored on three types of mesh.
The conclusions will recommend suitable variants of calculations and, thus, contribute to better numerical simulations in the field of construction.

2. Method

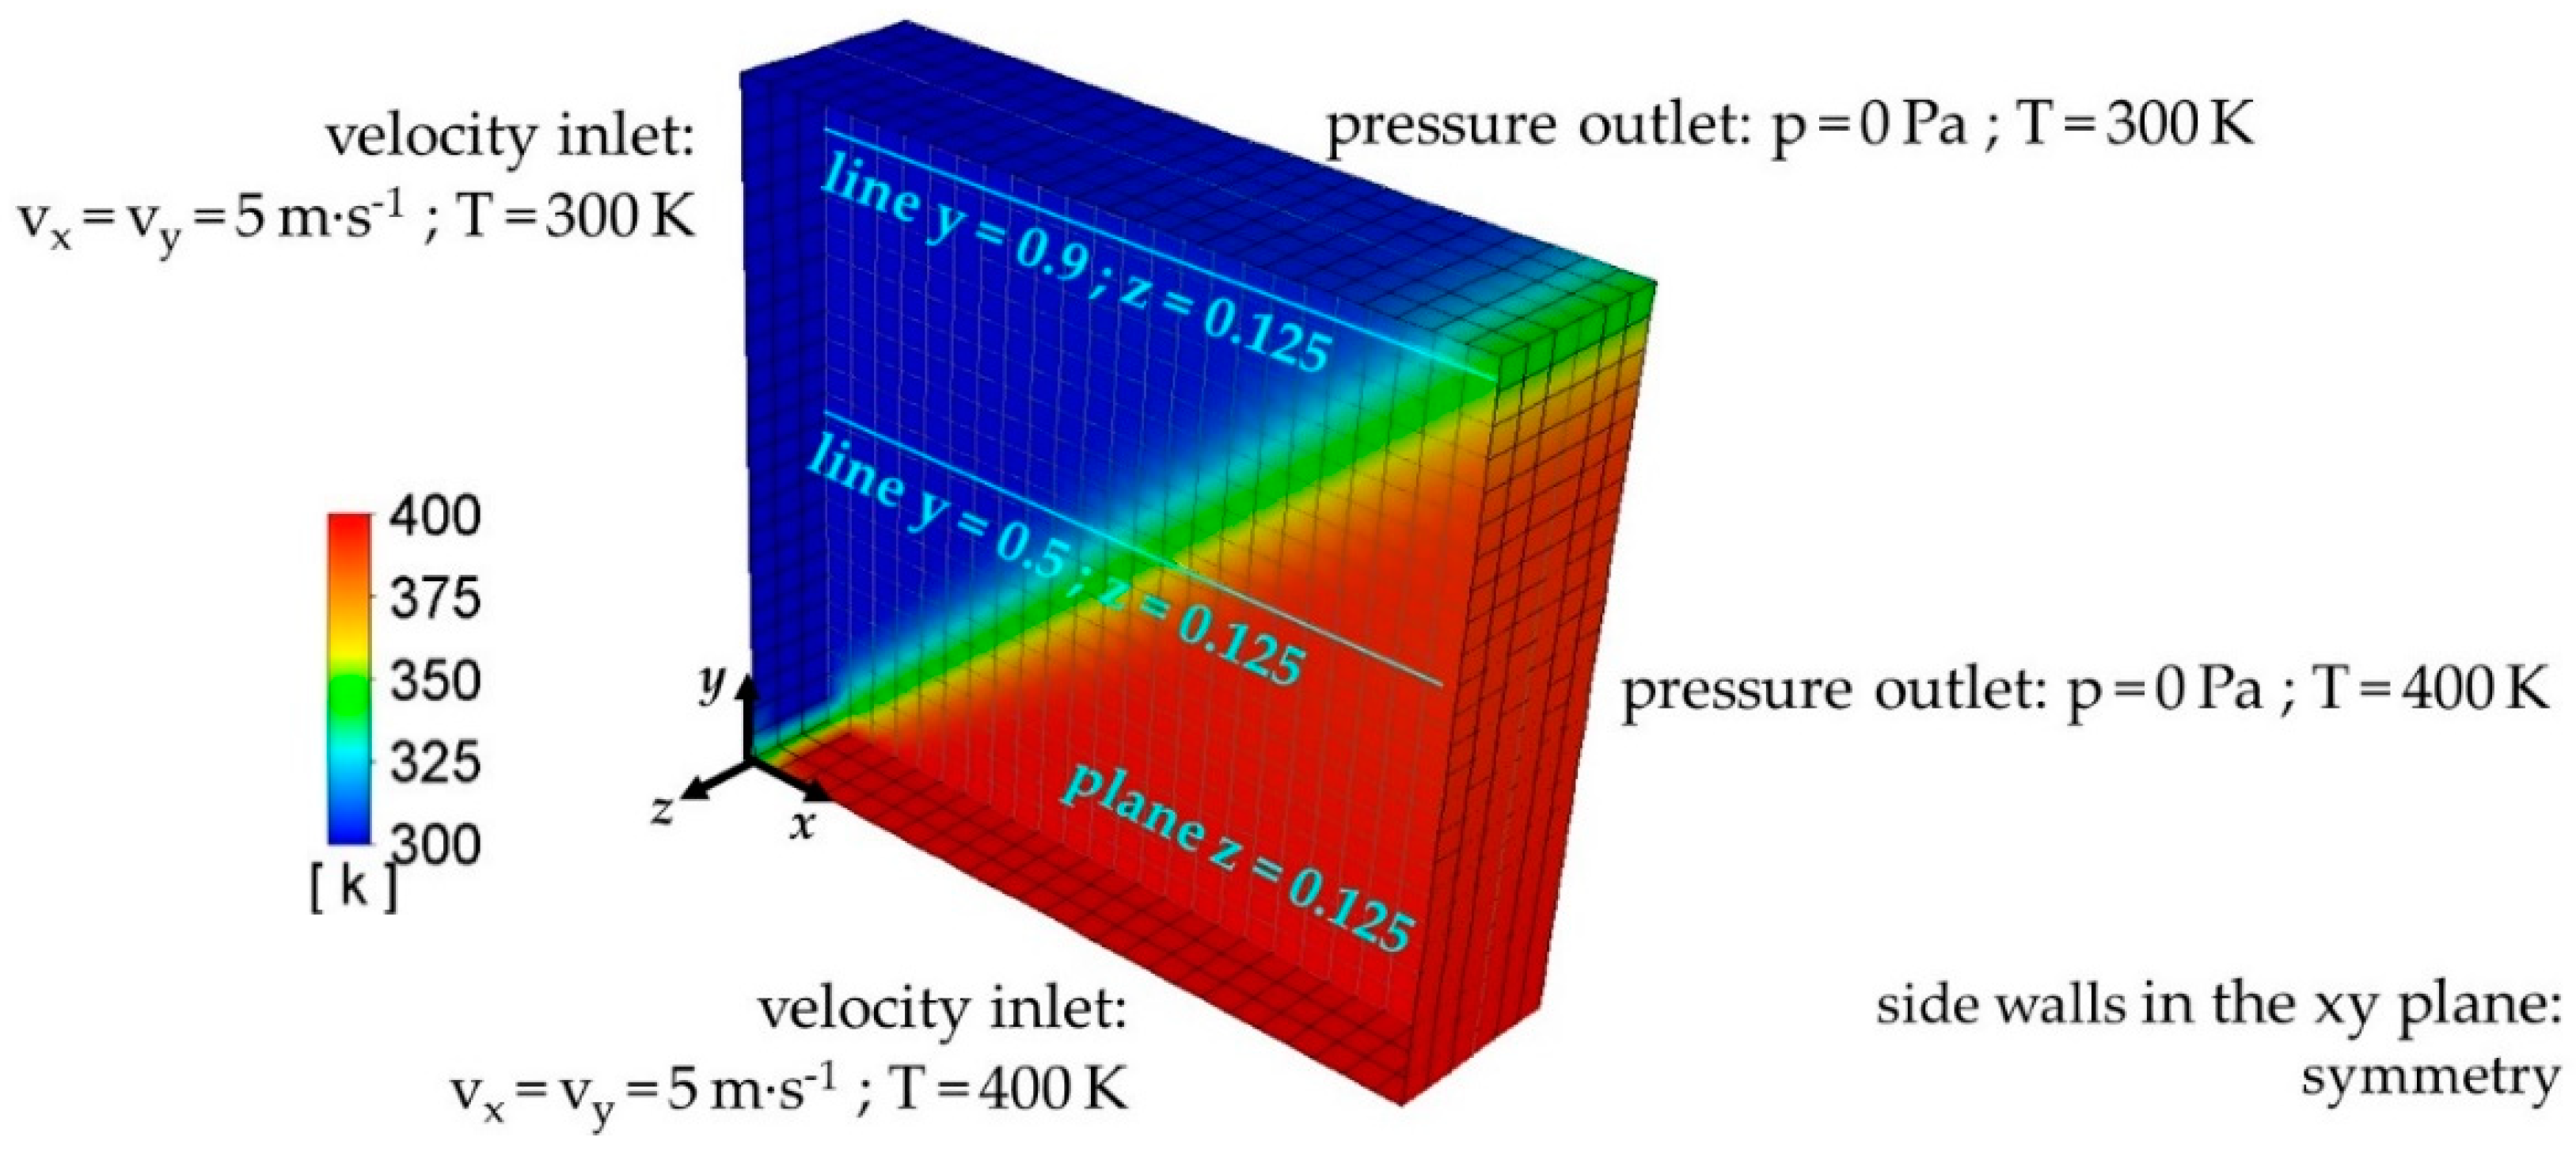
The three-dimensional stationary virtual gas flow of the computational domain with dimension 1 × 1 × 0.25 m (x × y × z) is simulated by the Finite Volume method (FVM). The fictitious gas density is ρ = 1 kg·m−3. The values of the thermal conductivity λ (W·m−1·K−1) and the dynamic viscosity μ (Pa·s) of the gas are close to zero. The pressure-velocity coupling algorithm is determined by the segregated SIMPLE method, which is suitable for steady-state calculations [37]. The boundary conditions are set so that the identical vectors enter at the two mutually perpendicular walls with the velocity vx and vy. One of these walls has the temperature T1 = 300 K and the second T2 = 400 K. The pressure outlet is on the two opposite walls (the static pressure p = 0 Pa). As at the entrance, the outlet temperature is also one wall T1 = 300 K and the second wall T2 = 400 K, see Figure 3. Thereby, the sharp boundary of the two domains with the temperature difference ∆T = 100 K is created in the calculation domain. This boundary is in the direction of the flow (in the domain at the angle of 45°). Only the advective transmission, in terms of the momentum and the heat, should occur for the accurate numerical calculation. The diffuse transfer should not occur. The output on the two side opposite walls (in the xy plane) is the zero flow of all quantities across the border (symmetry boundary condition, normal velocity is zero). These two sides of the opposite walls are not shown in Figure 3.
The solution of the problem is independent of the domain dimensions, gas density, and velocity. It was verified on pilot calculations, whereby gradually changing all of these values in the thousands. These test tasks were also performed for porous domain, with a wide range of permeability values corresponding to building materials. The transport quantity does not have to be only the temperature, but also, for example, the concentration of substances. In the presented paper, the size of the calculation area is set so that the calculations did not have the problem with above-standard number of cells and the scattering of the temperature field (numerical error—diffusion) was obvious at the same time. The air density is close to the air density. The velocity is chosen so that the calculations converged in an acceptable time.
The Ansys Fluent software uses the FVM to convert the general transport equations to the system of linear equations that are solved numerically by the Gauss–Seidel iteration method. This solution consists in integrating the equations in each control volume (cell), where the result is the discrete equations presented the flow equilibrium (the conservation laws of the transport quantity Φ in given volume). Its mathematical description for the stationary flow in the integral form is:
A ρ · v · Φ d A = A Γ Φ · Φ d A + V S Φ dV ,
where A (m·s−1) is the surface vector, V (m3) is the control volume (cell volume), ρ (kg·m−3) is the density of the flowing medium, v (m·s−1) is the velocity vector, Φ (K) is the value of the transport quantity (temperature), Φ (K·m−1) the gradient of the transport quantity Φ, ΓΦ is the diffusion coefficient of the transport quantity Φ (K·kg·m−1·s−1), SΦ (K kg m−3 s−1) is the source term of the quantity Φ per unit of the volume.
Equation (1) is applied to all control volumes of the calculation area. Equation (2) is obtained by the discretization of the Equation (1) in the given cell:
f N f a c e s ρ f · v f · Φ f · A f = n N f a c e s Γ Φ · Φ f · A f + S Φ · V ,
where Nfaces is the number of the faces surrounding of the cell, ρ f · v f · A f (kg·s−1) is the mass flow over the surface f, A f (m2) is the surface vector f, Φf (K) is the value of the transport quantity flowing over the surface f (the face value), Φf (K·m1) is the gradient of the transport quantity Φ on the surface f.
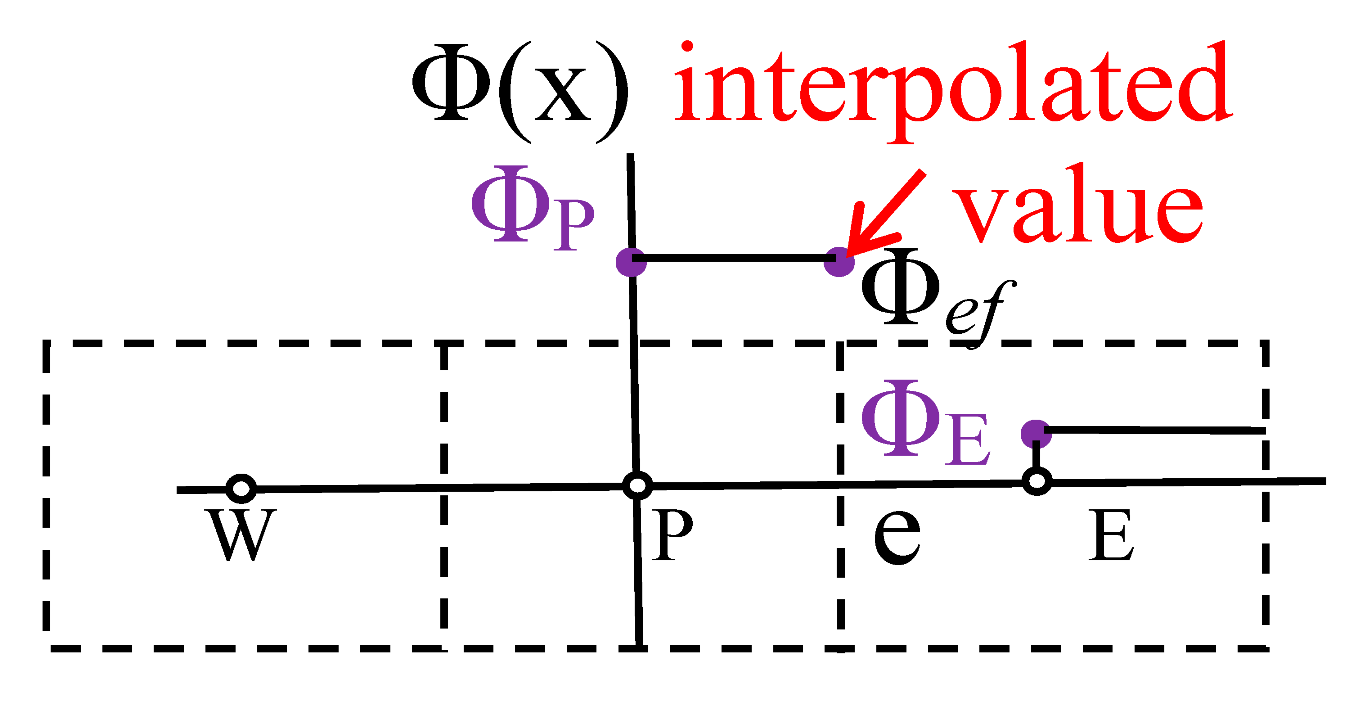
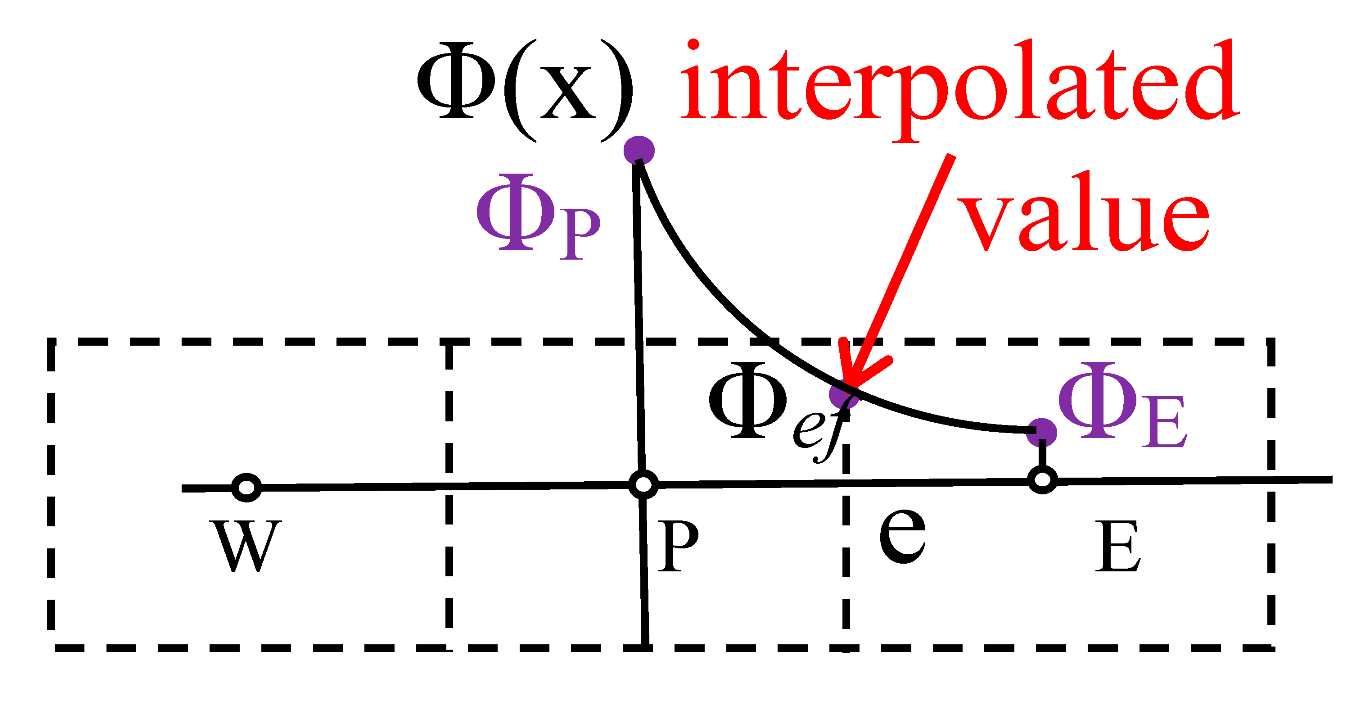
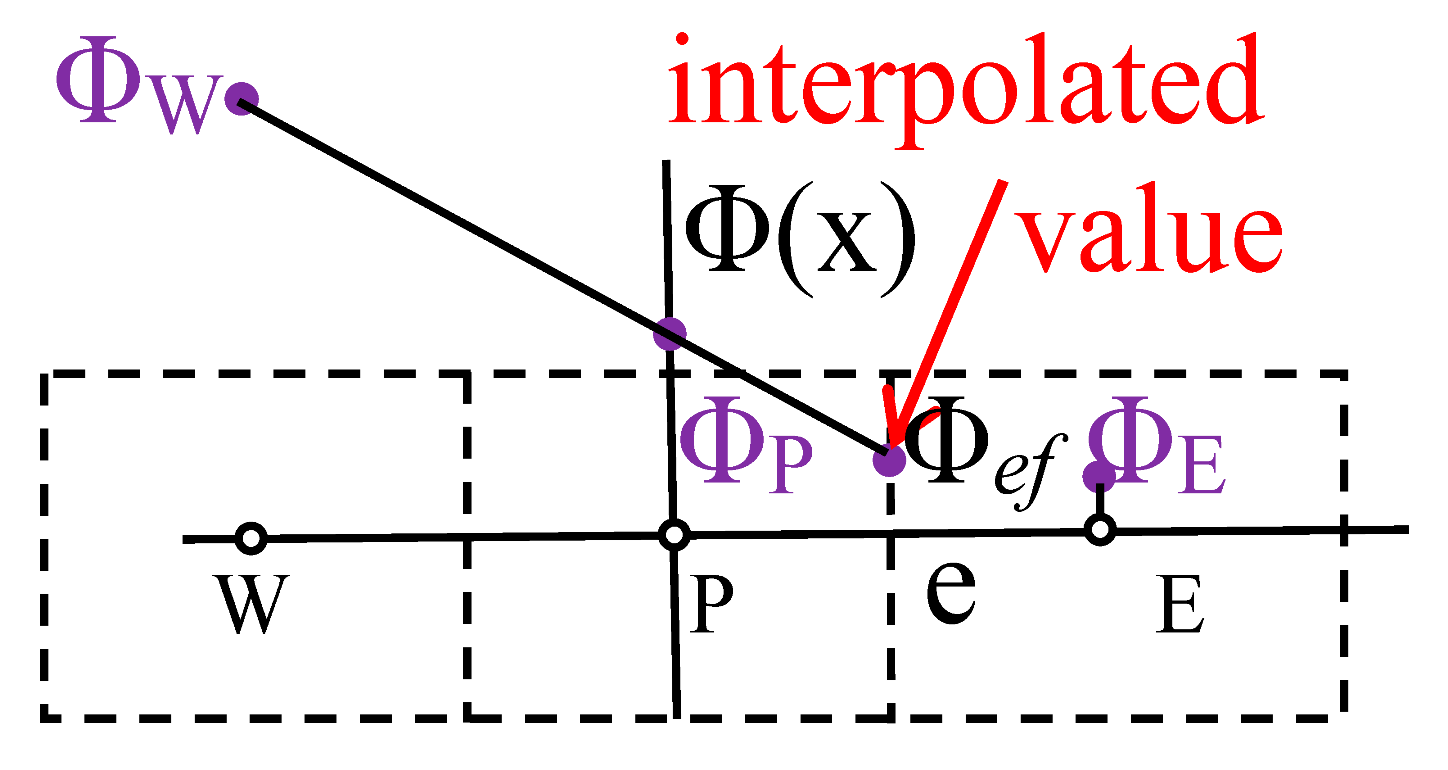
The left side in both equations represents the advective transfer of the quantity Φ, the right side expresses the diffuse transfer and the source term of the transport quantity Φ (its decrease or increase). The basic problem in the discretization of the advective term is the exact calculation of the transport quantity on the face of the specific volume Φf and its gradient ∇Φf. The diffusion process affects the transfer of the transport quantity along its gradient in all directions, while the advective transfer pervades only in the direction of the flow. It is very difficult to find the exact discretization computational scheme for the solving of the advective term in the Equation (2). The software Ansys Fluent stores the discrete values of the scalar quantity Φ in the center of the cell. The values of the scalar quantity Φf on the cell face are required for the calculation of the advective term in the equations and they are determined by the interpolation from the values in the centers of the adjacent cells. The number of the surrounding cells depends on the type of the grid, but, in most cases, the amount is the same as the number of the faces forming of the interest cell. The discretization “upwind” schemes are used for this process; it means that the value Φf is derived from the value of the next cell in the flow direction. The most upwind schemes require the determination of the transport quantity gradient ∇Φ for their solution. The gradients are necessary for the calculation of the scalar values on the cells faces not only for discretization the advective but also for the diffusion term in the Equation (2).

3. The Parameters Influencing the Accuracy of the Calculation

The level of the physical accuracy of the numerical calculation is influenced by the mesh type, the choice of discretization schemes for the conversion of the general transport equations to the linear equations, and also the choice of the calculating method of the transport quantity gradient ∇Φ (here temperatures).

3.1. The Mesh Type and the Mesh Density

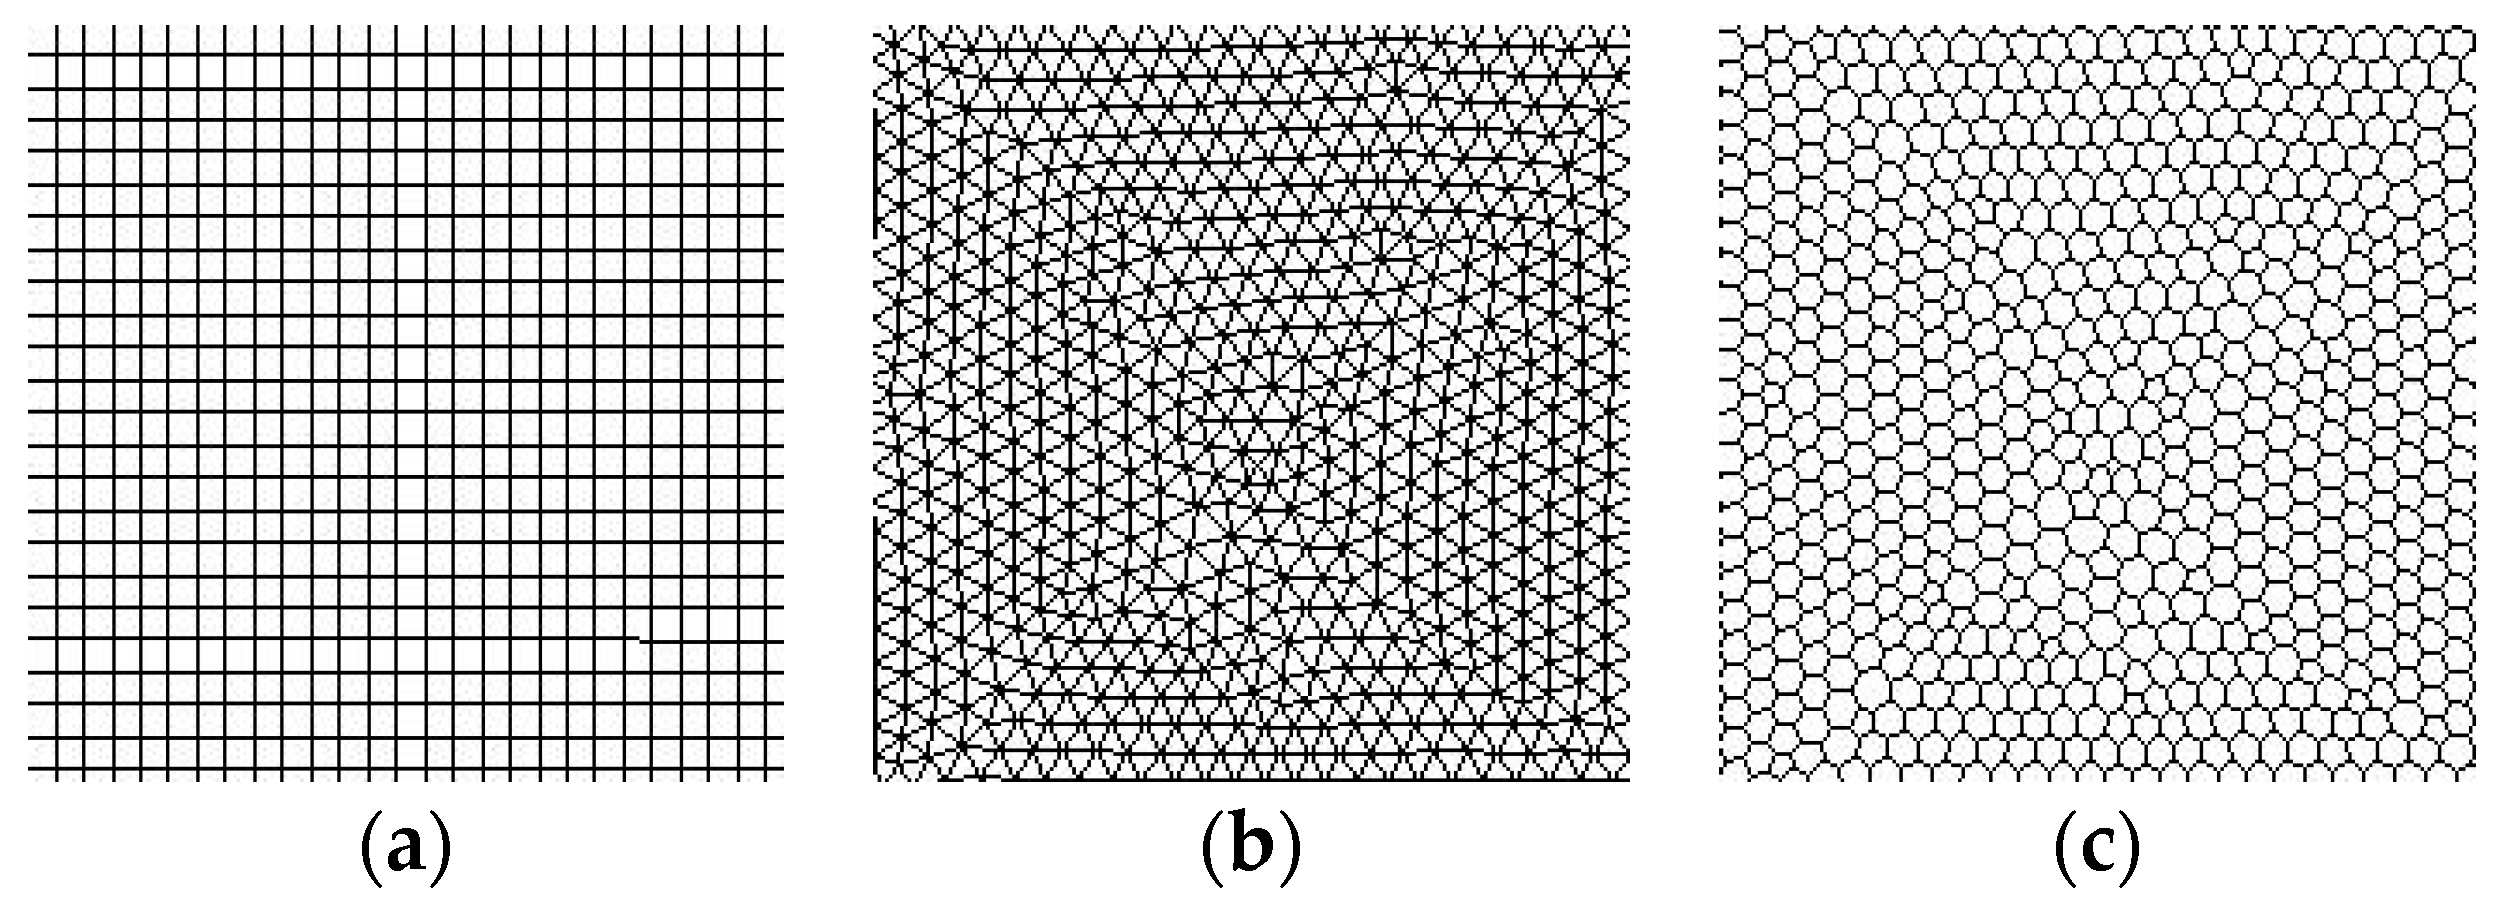
Three types of the grids: hexahedral, tetrahedral, and polyhedral are used for solving the problems, see Figure 4. All grid types have double density. The coarse hexahedral and tetrahedral mesh were formed from 25 cells with the length of 1 m at all longitudinal and vertical edges of the domain (x, y-axis direction), see Figure 5a. The 6 cells per 0.25 m are formed on the domain edges in z-axis direction. The fine hexahedral and tetrahedral mesh were formed from 100 cells per 1 m in the x, y-axis directions, see Figure 5b. The 25 cells per 0.25 m are formed on the domain edges in z-axis direction. The polyhedral mesh was formed directly in the Ansys Fluent from the tetra cells. The six calculation areas with the identical dimensions (Figure 3) and the parameters listed in Table 1 were created.

3.2. The Discretization Scheme

It is possible that the choice from the five upwind discretization schemes for the given problem. Their brief description and the scheme are in Table 2.

3.3. The Solution of the Transport Quantity Gradients

The gradients are needed, not only for the constructing values of the scalar at the cell faces, but also for computing the secondary diffusion terms and the velocity derivatives. The gradient ∇Φ of a given the variable Φ is used to discretization of the advection and the diffusion terms in the flow conservation equations. The gradients are computed in Ansys Fluent, according to the three following methods:
  • Green–Gauss cell-based;
  • Green–Gauss node-based;
  • Least Squares cell-based.
The first two methods use the Green–Gauss theorem to compute the ∇Φ at the cell center c0:
( Φ ) c 0 = 1 V f Φ f · A f ,
The face value Φf by default of the Green–Gauss cell-based is taken from the arithmetic average of the values at the neighboring cell centers:
Φ f = Φ c 0 + Φ c i 2 .
The face value Φf by default of the Green–Gauss node-based is taken by the arithmetic average of the nodal values on the face:
Φ f = 1 N f , n o d e s n N f , n o d e s Φ n ,
where Nf,nodes are the number of the nodes on the face. The nodal values Φn are determined from the weighted average of the cell values surrounding the nodes. The node-based gradient method is not available with the polyhedral meshes.
The third least squares cell-based method is based on assumption the change in the cell values between the cell c0 and ci along the vector r i from the center of the cell c0 to ci is expressed as:
( Φ ) c 0 · r i = ( Φ c i Φ c 0 ) .

4. Results

The influence of the setting combination the above parameters on the accuracy of the calculation is tested in this paper. The level of the temperature field scattering (numerical diffusion) is compared to the original sharp boundary of two areas with the temperature difference ∆T = 100 K. The study also monitors in which cases the temperature values appear outside the range of the specified boundary conditions, i.e., outside the range T ∈ (300 K, 400 K).

4.1. Evaluation the Mesh Density and the Mesh Type on the Numerical Diffusion

It is generally known that the mesh density has a significant effect on the magnitude of the numerical diffusion. Figure 6 shows the temperature fields in the median plane of the calculation area (plane z = 0.125 m, see Figure 3) calculated using the hexahedral meshes, the coarse also the fine grids. The difference in the temperature scattering with the mesh density of 25 cells/m versus the mesh density of 100 cells/m is shown. Figure 6a,b presents the results of the solutions using the first-order upwind scheme and Figure 6c,d using the second-order upwind scheme. The similar effect has the grid density on the numerical diffusion using the first-order upwind scheme for the tetrahedral and polyhedral mesh types. Using the second-order upwind, QUICK, and the third-order MUSCL discretization schemes, the scatterings of the temperature fields and their changes (by changing of the grid density) are smaller in all meshes, but there are problems with the temperature values outside the range of the correct solution (more Section 4.4).
The grid type also has influence on the numerical diffusion of the transport quantity, although not as significant as its density. The comparison of the temperature fields scatterings for all three types of the coarse grids (25 cells/m) for the identically selected calculation scheme (second-order upwind) and the method of the solution of the transport quantity gradients (Green–Gauss node-based) is shown in Figure 7. Figure 7a–c document the temperature field from the Ansys Fluent software and Figure 7d the temperature diagram in the horizontal axis of the calculation area (y = 0.5 m, z = 0.125 m). As it can be seen from Figure 7, the smallest scattering is achieved using the tetrahedral elements using the coarse mesh and the described calculation setting. Contrariwise, the biggest numerical diffusion arises using the hexahedral elements. The ideal variant (“ideal”) is the illustrative fictitious case with the zero numerical diffusion in Figure 7d.
The temperature fields using the fine mesh with the unchanged calculation parameters are in Figure 8. It is obvious that the differences in the individual results are smaller. The tetrahedral mesh still achieves the most accurate result.
However, it is important to remember that the overall evaluation of the mesh type is necessary to perform in parallel with the choice of the discretization scheme and the method of calculating the gradient of the transport quantity on the control volume face (see next chapter).

4.2. Evaluation of the Discretization Schemes in the Numerical Diffusion

The discretization schemes listed in Section 3.2, except the power law scheme, are tested. The solution of the power law scheme is identical with the first-order upwind scheme in this type of the problem (|Pe| > 10).
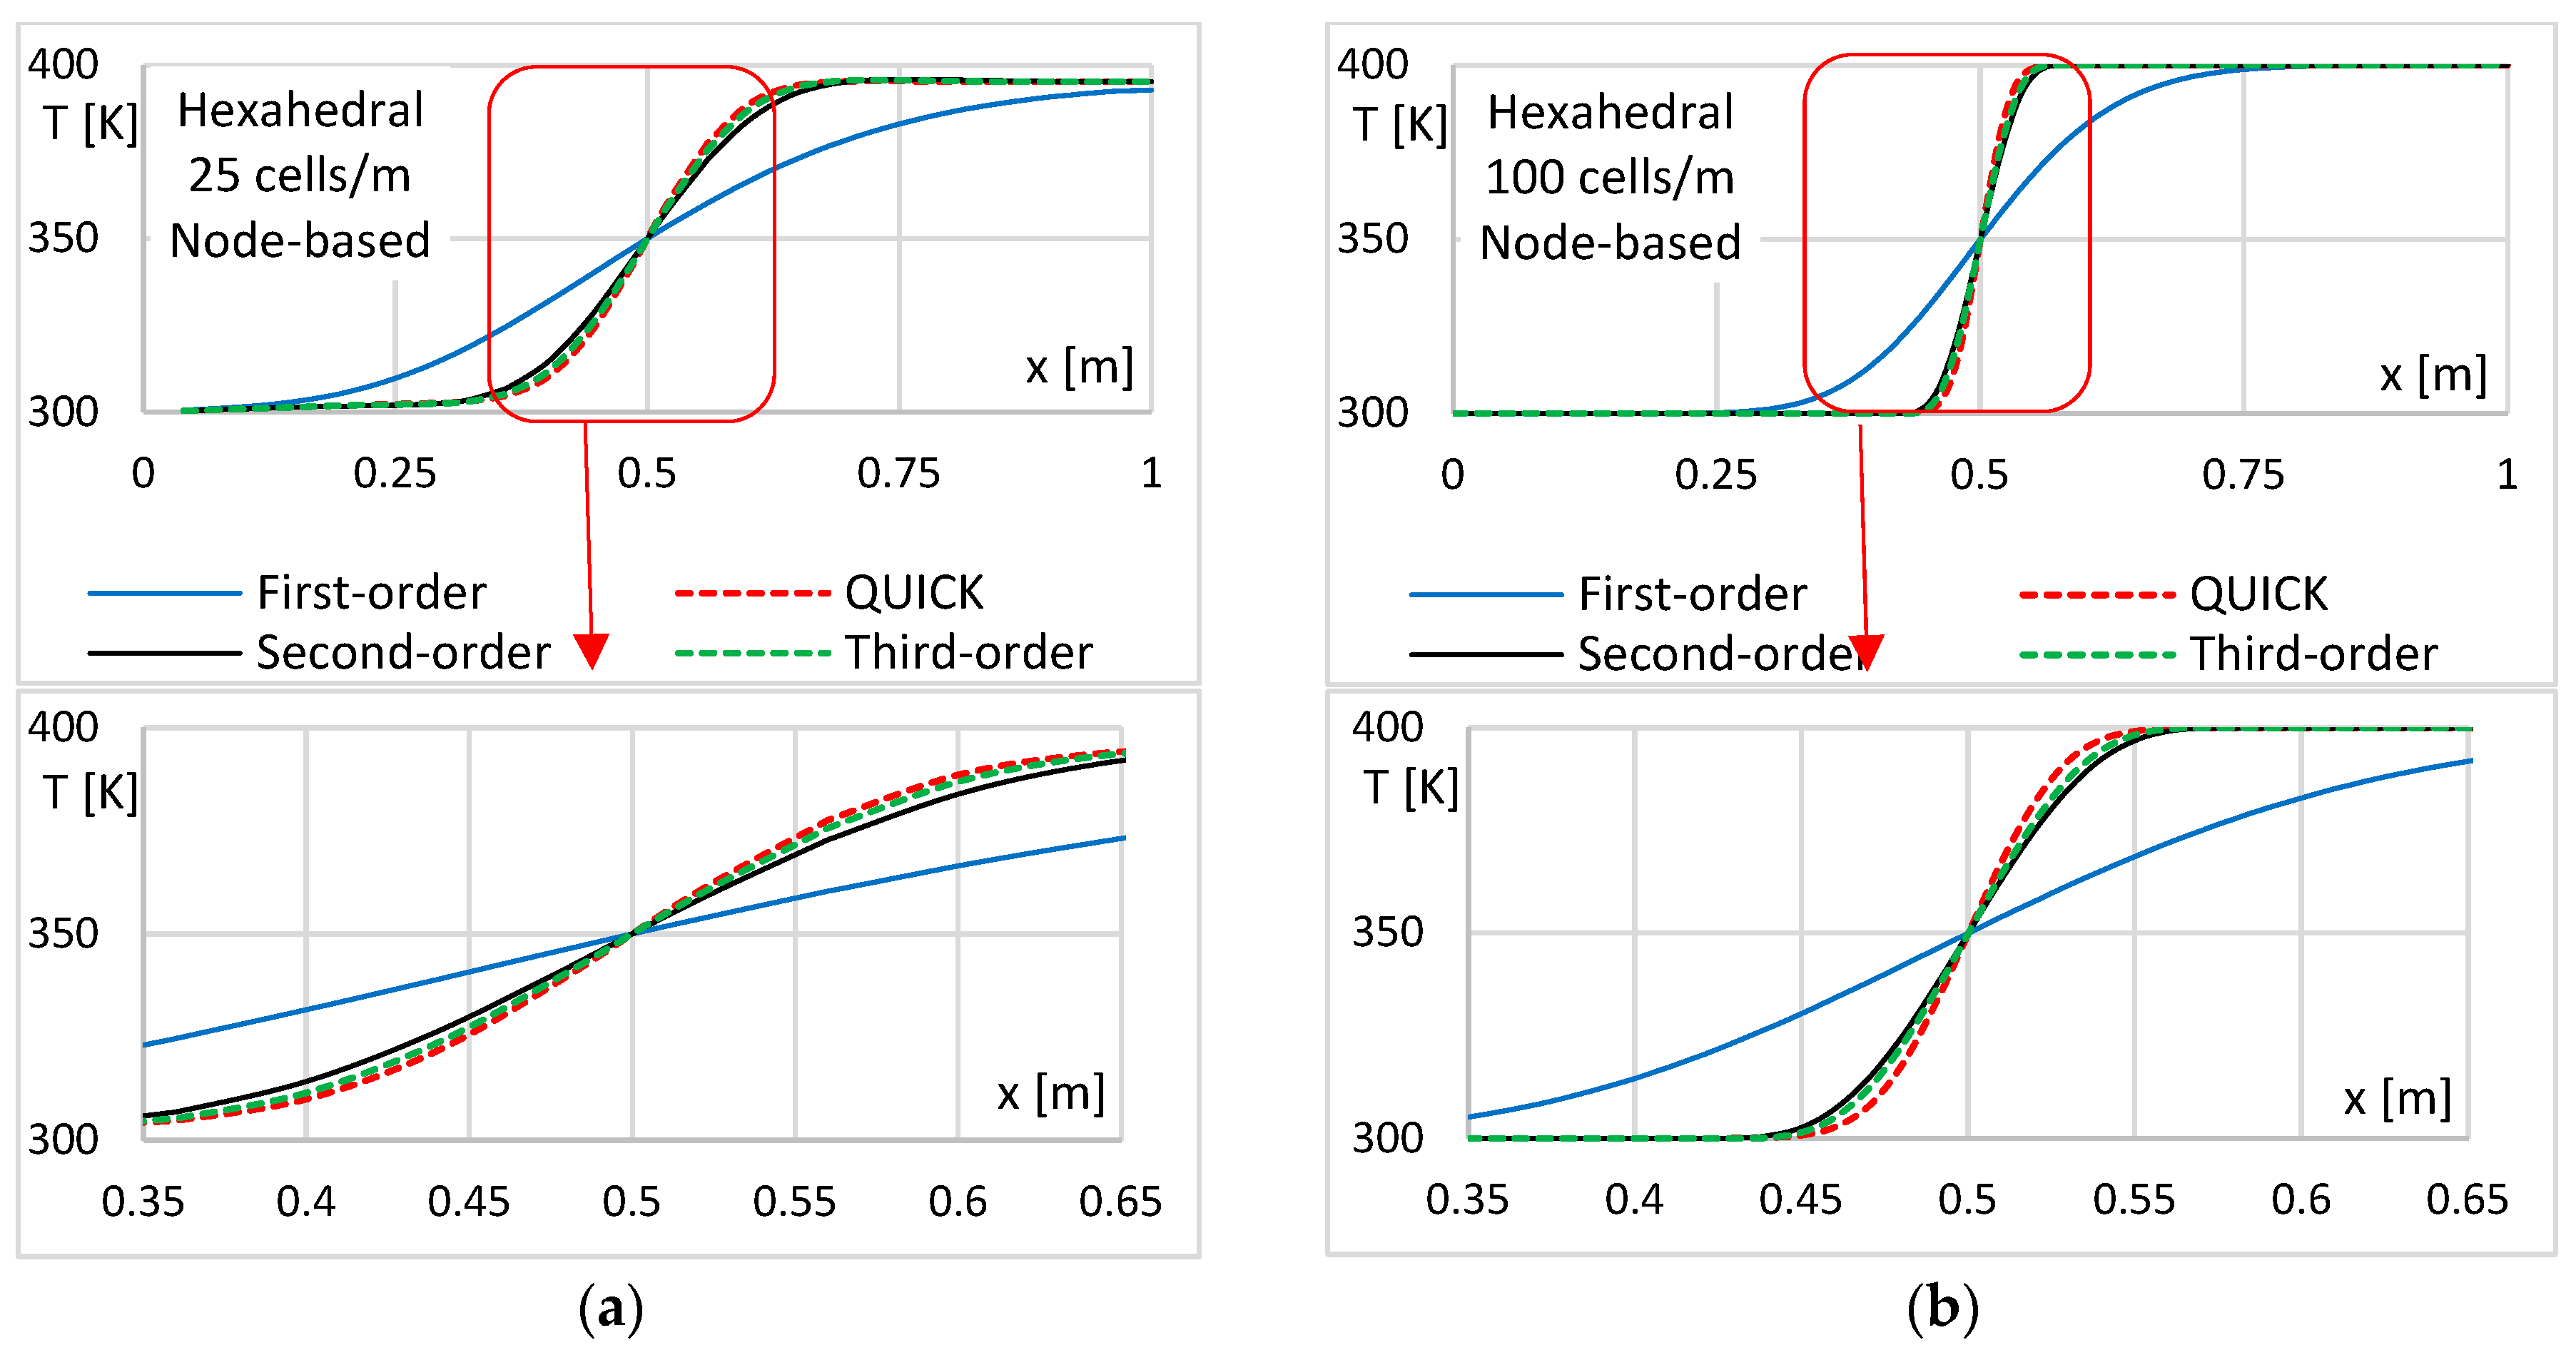
Figure 9 shows the temperature diagrams for all upwind schemes using the hexahedral mesh. The Green–Gauss node-based method was chosen for the transport quantity gradients in all cases presented here. The results using the coarse and fine grids are compared here. The results of the first-order upwind scheme are significantly diffusive, yet the differences are slight in other cases. The smallest temperature field scatterings in this case is shown by the QUICK scheme using the fine mesh.
Figure 10 shows the temperature diagrams only for the fine tetrahedral mesh (all upwind schemes) but the record on the horizontal axis in the higher layer is also added (y = 0.9 m, z = 0.125 m). The Green–Gauss node-based method was chosen for the transport quantity gradients in all cases presented here. It is in this case, when the different temperatures limit is at the greater distance from the entrance to the calculation area (x = 0.9 m). It is evident from the graphs that the mutual differences in the results between the selected schemes remain very similar along the entire length of the sharp boundary of the different temperatures. The numerical diffusion increases slightly at the greater distance from the entrance to the area (y = 0.9 m). The results give only slight differences using the tetrahedral mesh except of the first-order upwind scheme. The smallest temperature field scattering is now shown the third-order MUSCL, and this positivity is slightly highlighted at the great distance. This also applies to the polyhedral mesh. It will be discussed in more detail in the following chapters.
It is apparent that the calculation in all cases using the first-order upwind scheme creates a significantly larger scattering of the transport quantity in comparing with the other schemes. Although the higher-order discretization schemes give the small mutual differences, but the results are more pronounced for the different choice of the methods of the transport quantity gradients. This will be evaluated in the next section.

4.3. Evaluation of the Transport Quantity Gradients on the Numerical Diffusion

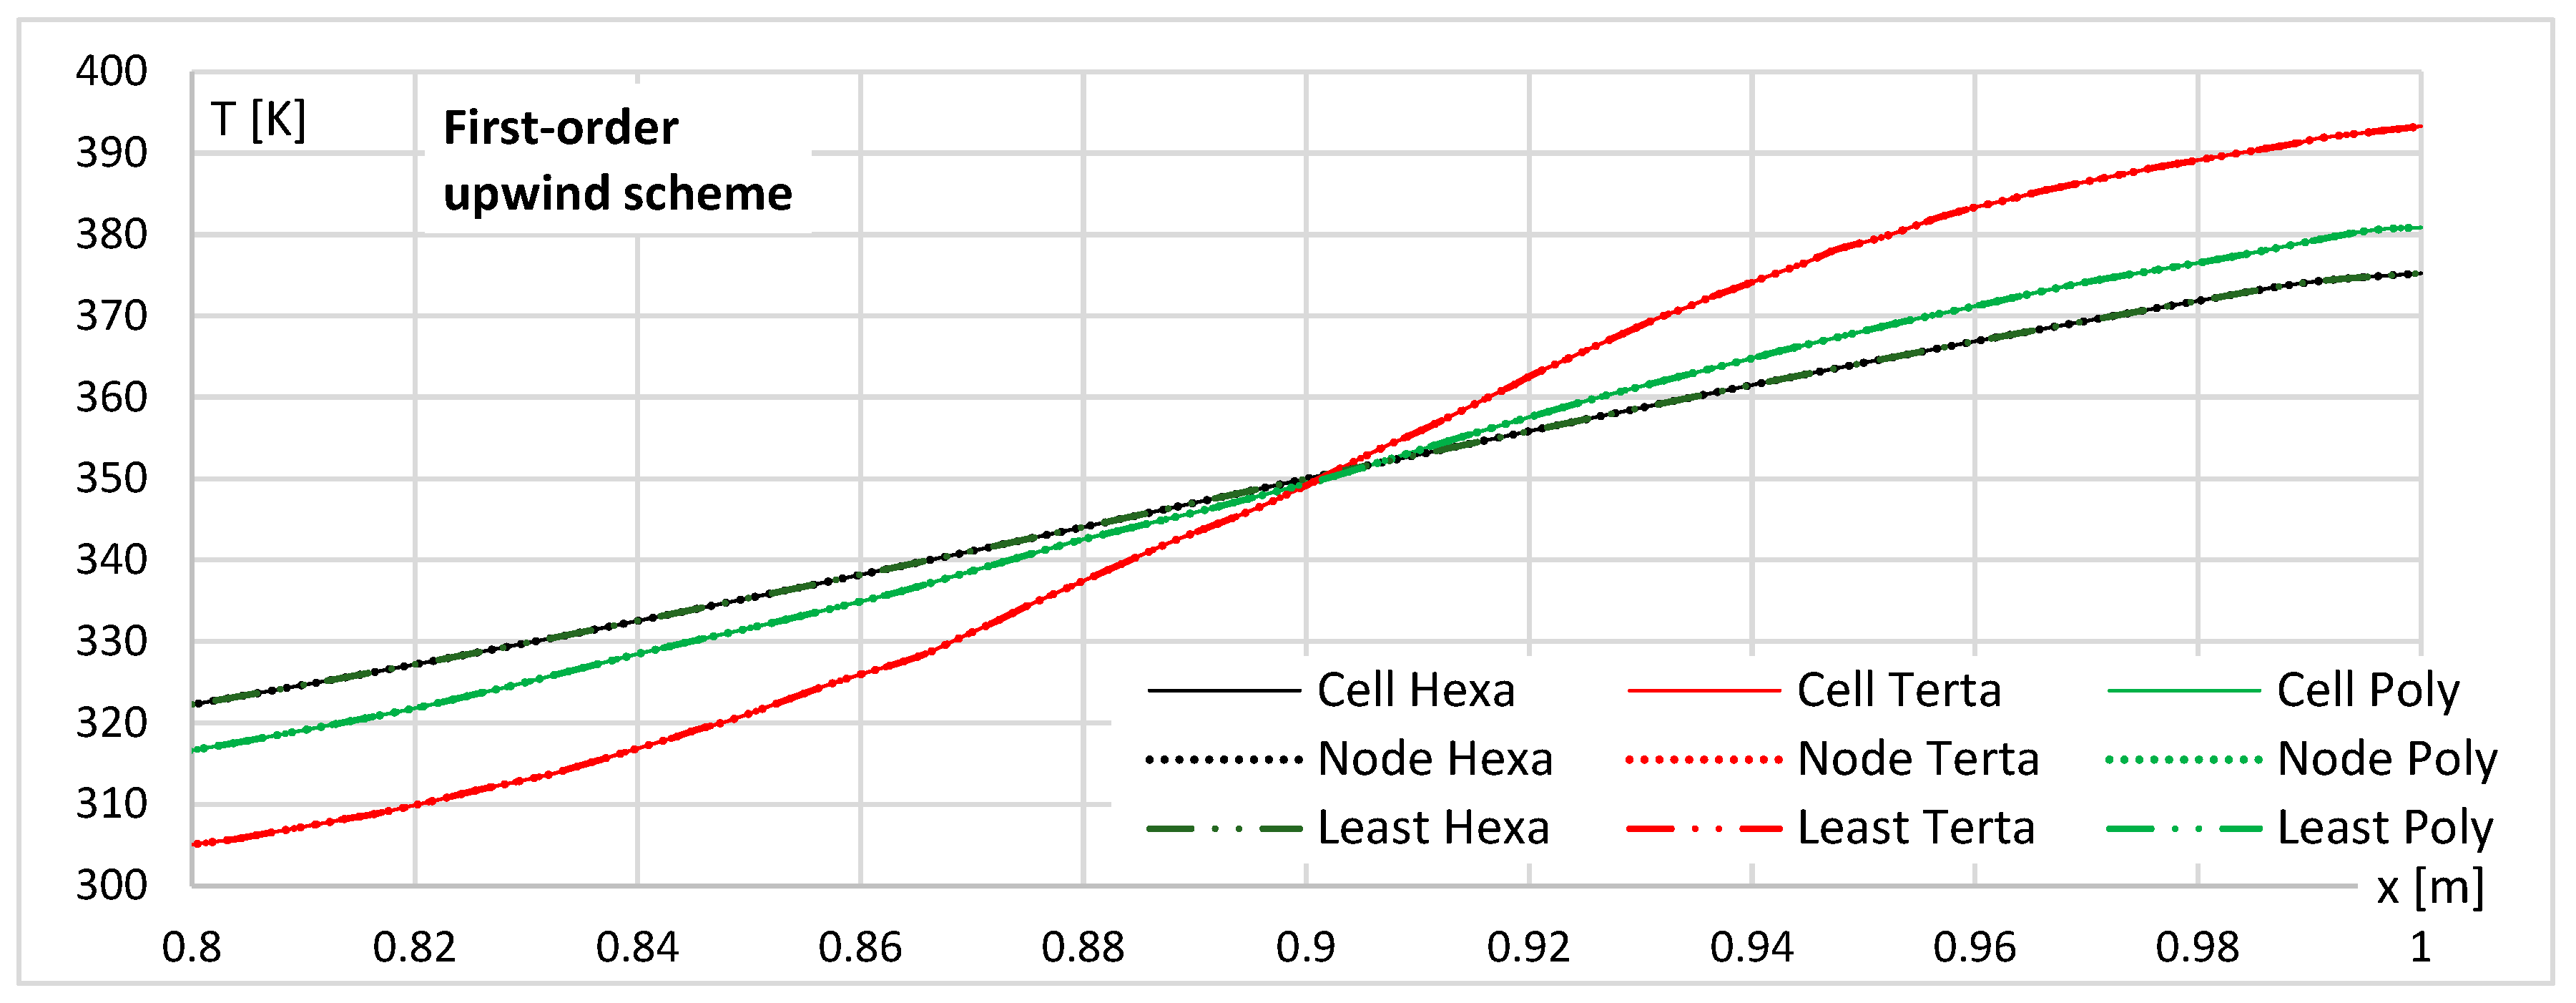
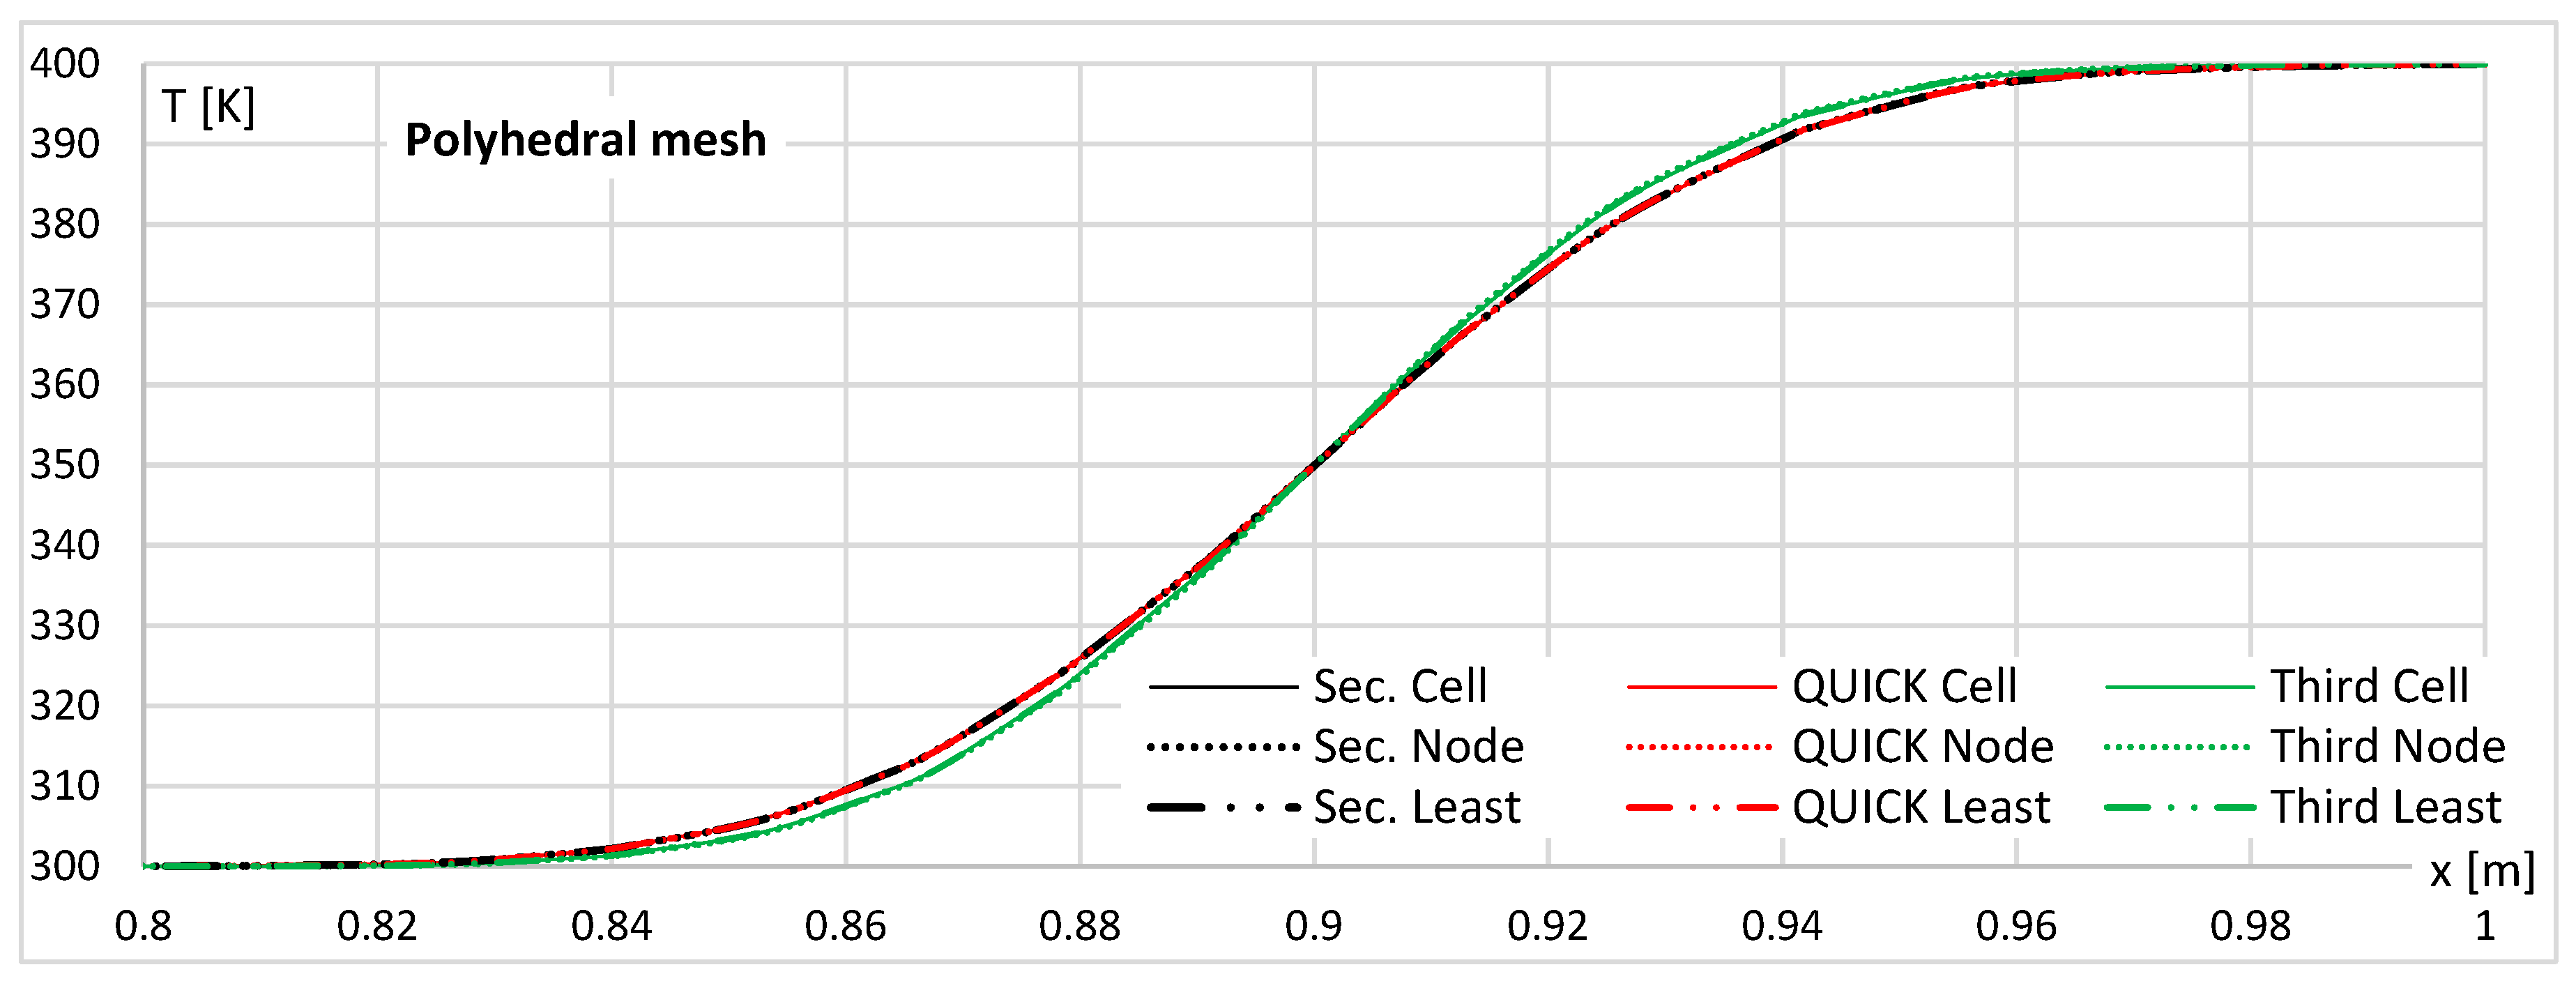
The influence of the method choice for the transport quantity gradients solving of the numerical diffusion is presented here for all fine mesh types (100 cells/meter). The temperature change record for y = 0.9; z = 0.12 m is shown in Figure 11, Figure 12, Figure 13, Figure 14 and Figure 15. The first-order upwind scheme does not depend on the gradient of the transport quantity ∇Φ, as Table 2 was shown. The temperature field scattering is significant (it was also shown in Section 4.2.) and it varies only due to the mesh type change (Figure 11).
The results of the other discretization schemes prove the certain dependence from the choice of the method for the solving transport quantity gradients and they differ according to the mesh type.
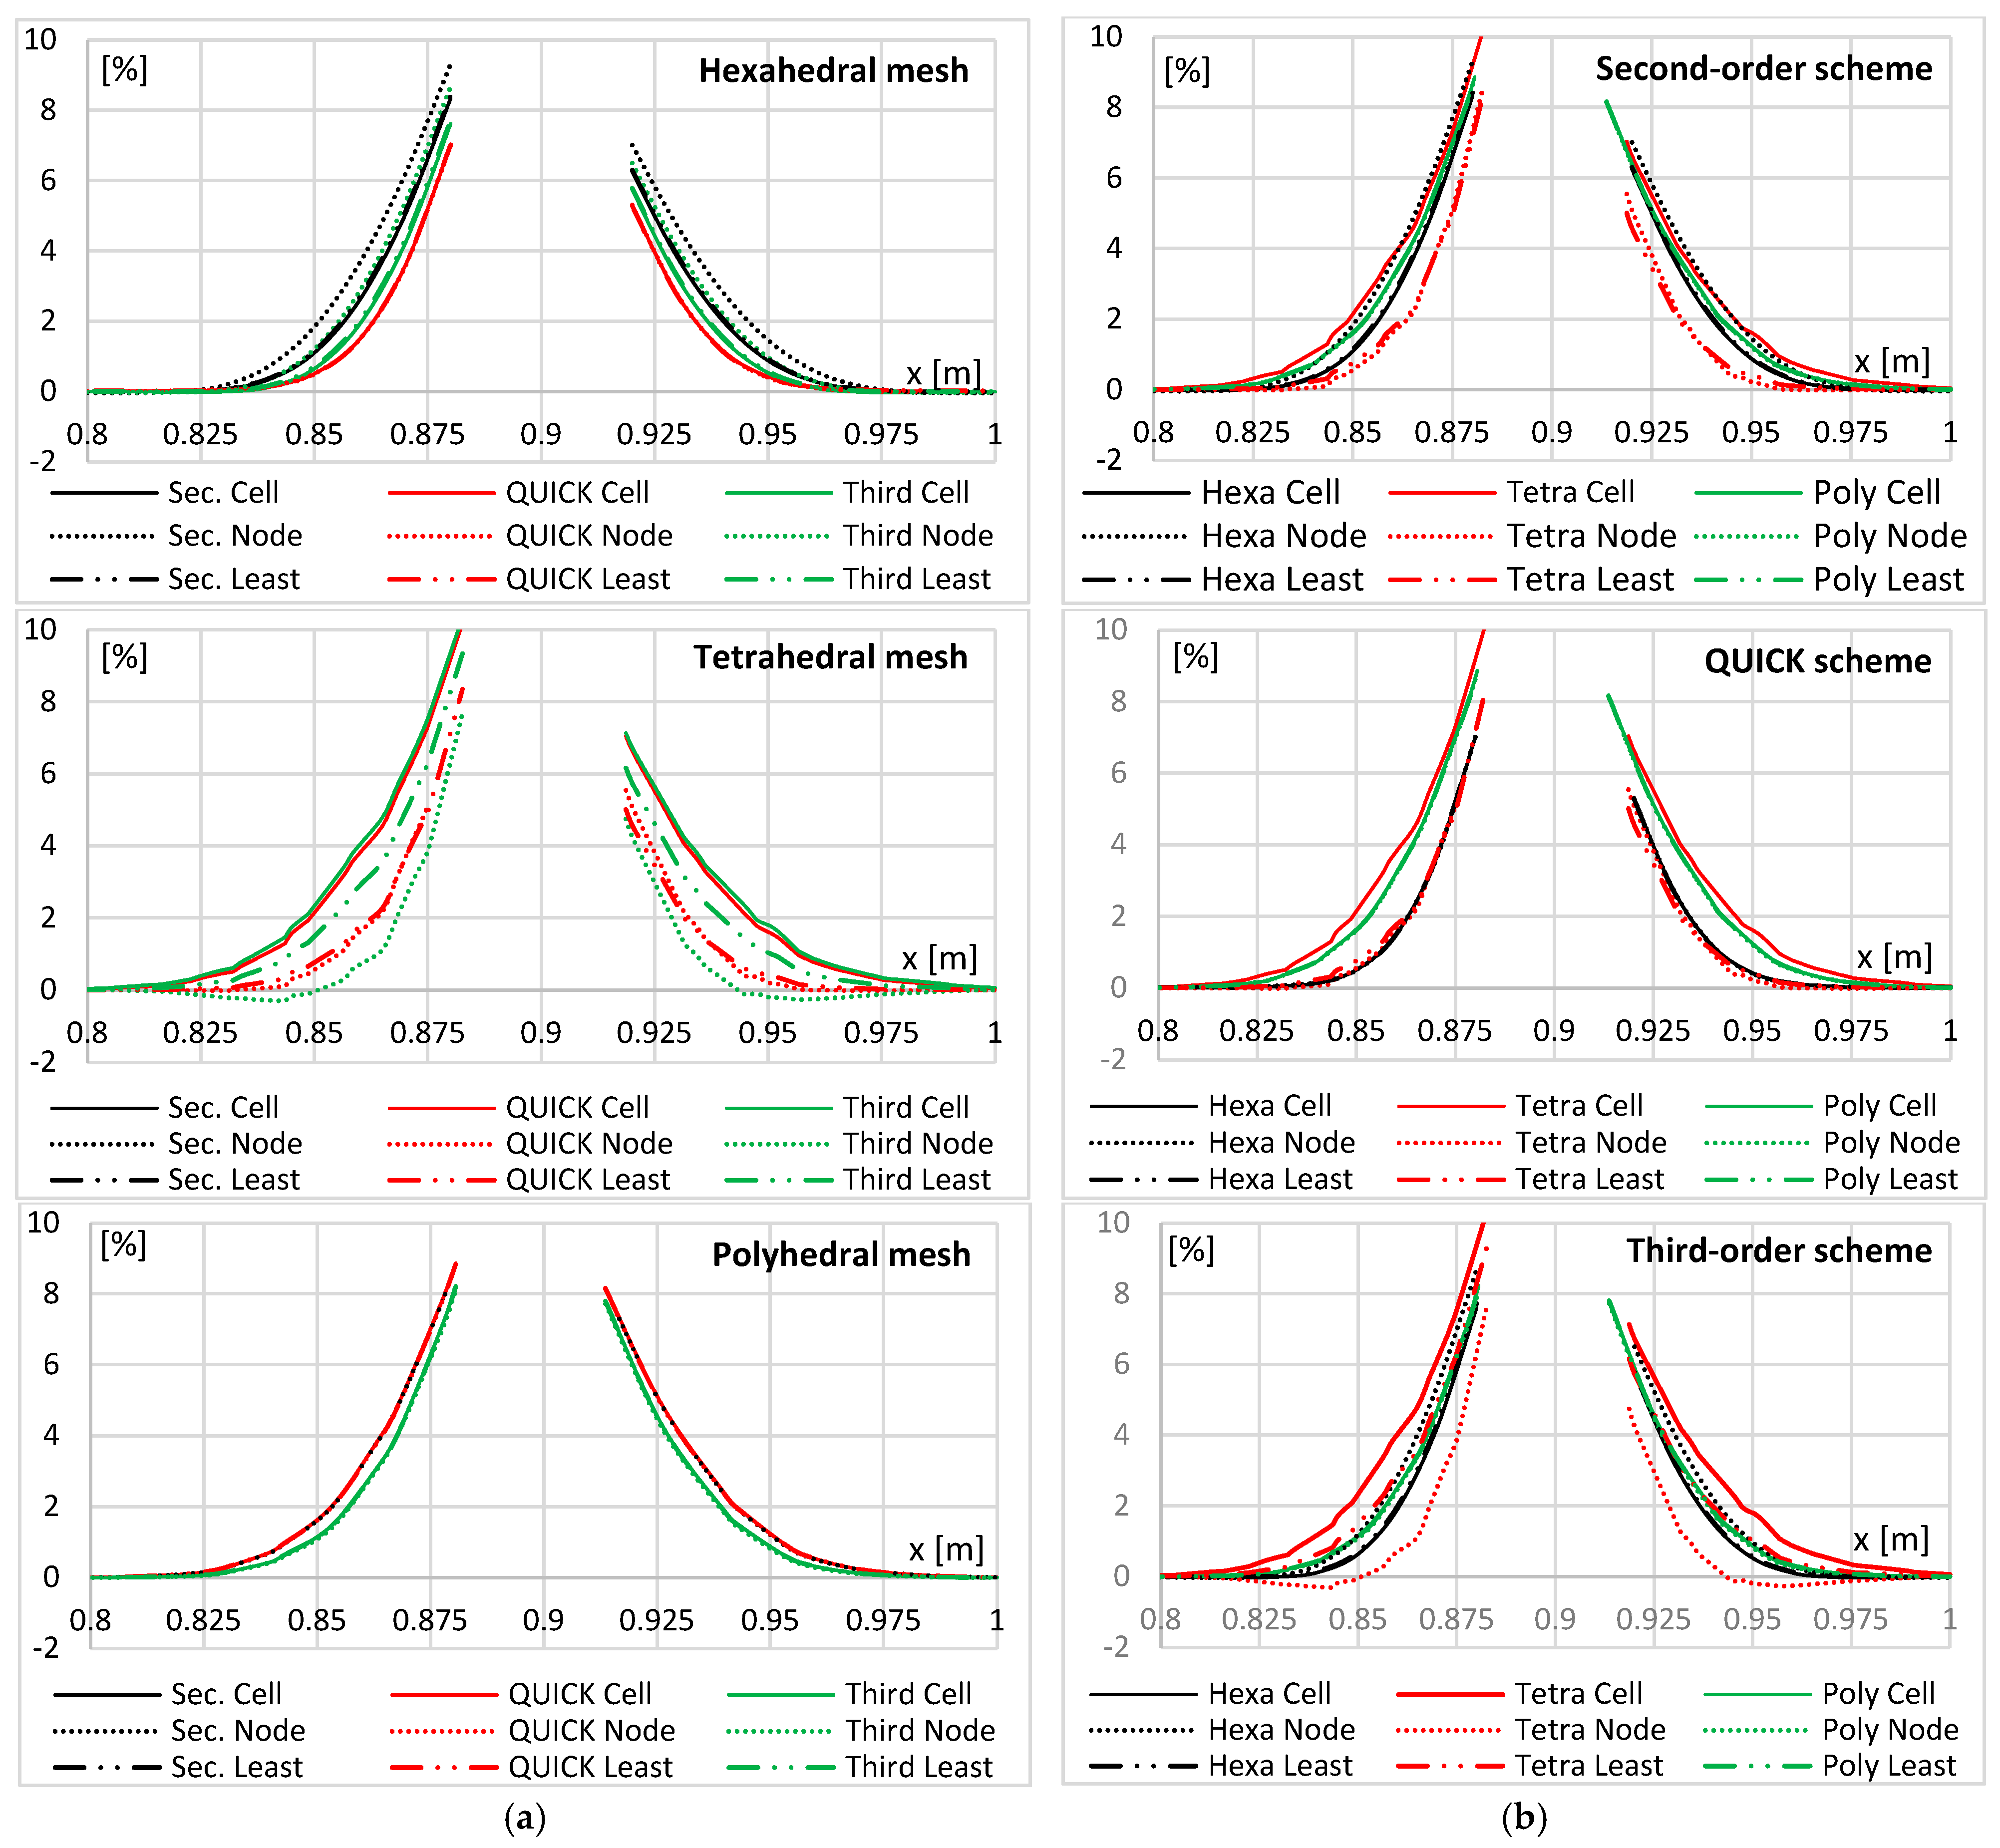
Hexahedral mesh (Figure 12 and Figure 14): the choice of the method for the solving transport quantity gradients affects the results in the combination using the Second-order upwind and the third-order MUSCL. The Green–Gauss node-based method shows significantly larger scattering of the temperature field in comparing with the other two methods. The greatest numerical diffusion arises using the second-order upwind scheme and all methods for solving the transport quantity gradients. The highest diffusivity using the hexahedral mesh (second-order upwind scheme and Green–Gauss node-based method) is comparable to the same calculation using the tetrahedral mesh (Figure 13). The calculation using the QUICK scheme, using the hexahedral mesh, is one of the most accurate, and the choice method for solving the transport quantity gradients in this case will not affect the results.
Tetrahedral mesh (Figure 13 and Figure 14): the method for solving the transport quantity gradient using the tetrahedral mesh affects the results for all discretization schemes, and the differences are more pronounced than used the hexahedral mesh. In the case of the Green–Gauss cell-based method choice, the numerical calculations have almost identical results in all discretization schemes and their diffusivity is the most pronounced. Conversely, the smallest scattering of the temperature field is achieved using the third-order MUSCL with the Green–Gauss node-based method option. The second-order upwind and the QUICK schemes with options, the Green–Gauss node-based, and the least squares cell-based methods, using this grid show good, almost identical results, in terms of the diffusivity on their accuracy, and is comparable to the QUICK hexahedral mesh scheme.
The percentage expression of the of the transport quantity error value from the ideal sharp limit in the line y = 0.9 m is shown in Figure 14. The area in the immediate vicinity of this limit x ∈ (0.88 m, 0.92 m) is not evaluated. The reason is the discontinuous function of ideal values. Figure 14a (left) presents the effect of different combinations of the calculation parameters on the specific meshes. The percentage expression of the error from the ideal value is in accordance with the real temperature diagram in Figure 12, Figure 13, or Figure 15. Figure 14b (right) shows the effect of the mesh type and the method for the solving of the transport quantity gradient on the results of the chosen upwind scheme.
Polyhedral mesh (Figure 14 and Figure 15): the numerical diffusion using the polyhedral mesh is not affected by the choice of the methods for the solving of the transport quantity gradient. The small differences arise only by changing of the discretization scheme. The second-order upwind and the QUICK schemes show the same results, where the temperature field scattering is larger than the solving used the third-order MUSCL. Compared to other meshes, the results show the average diffusivity.

4.4. Values of the Transport Quantities outside the Range of the Input Parameters

The choices of the discretization scheme and the method for the solving of the transport quantity gradient affect to the formation of the transport quantity values outside the range of the input parameters; it is also affected in the accuracy of the numerical calculations.
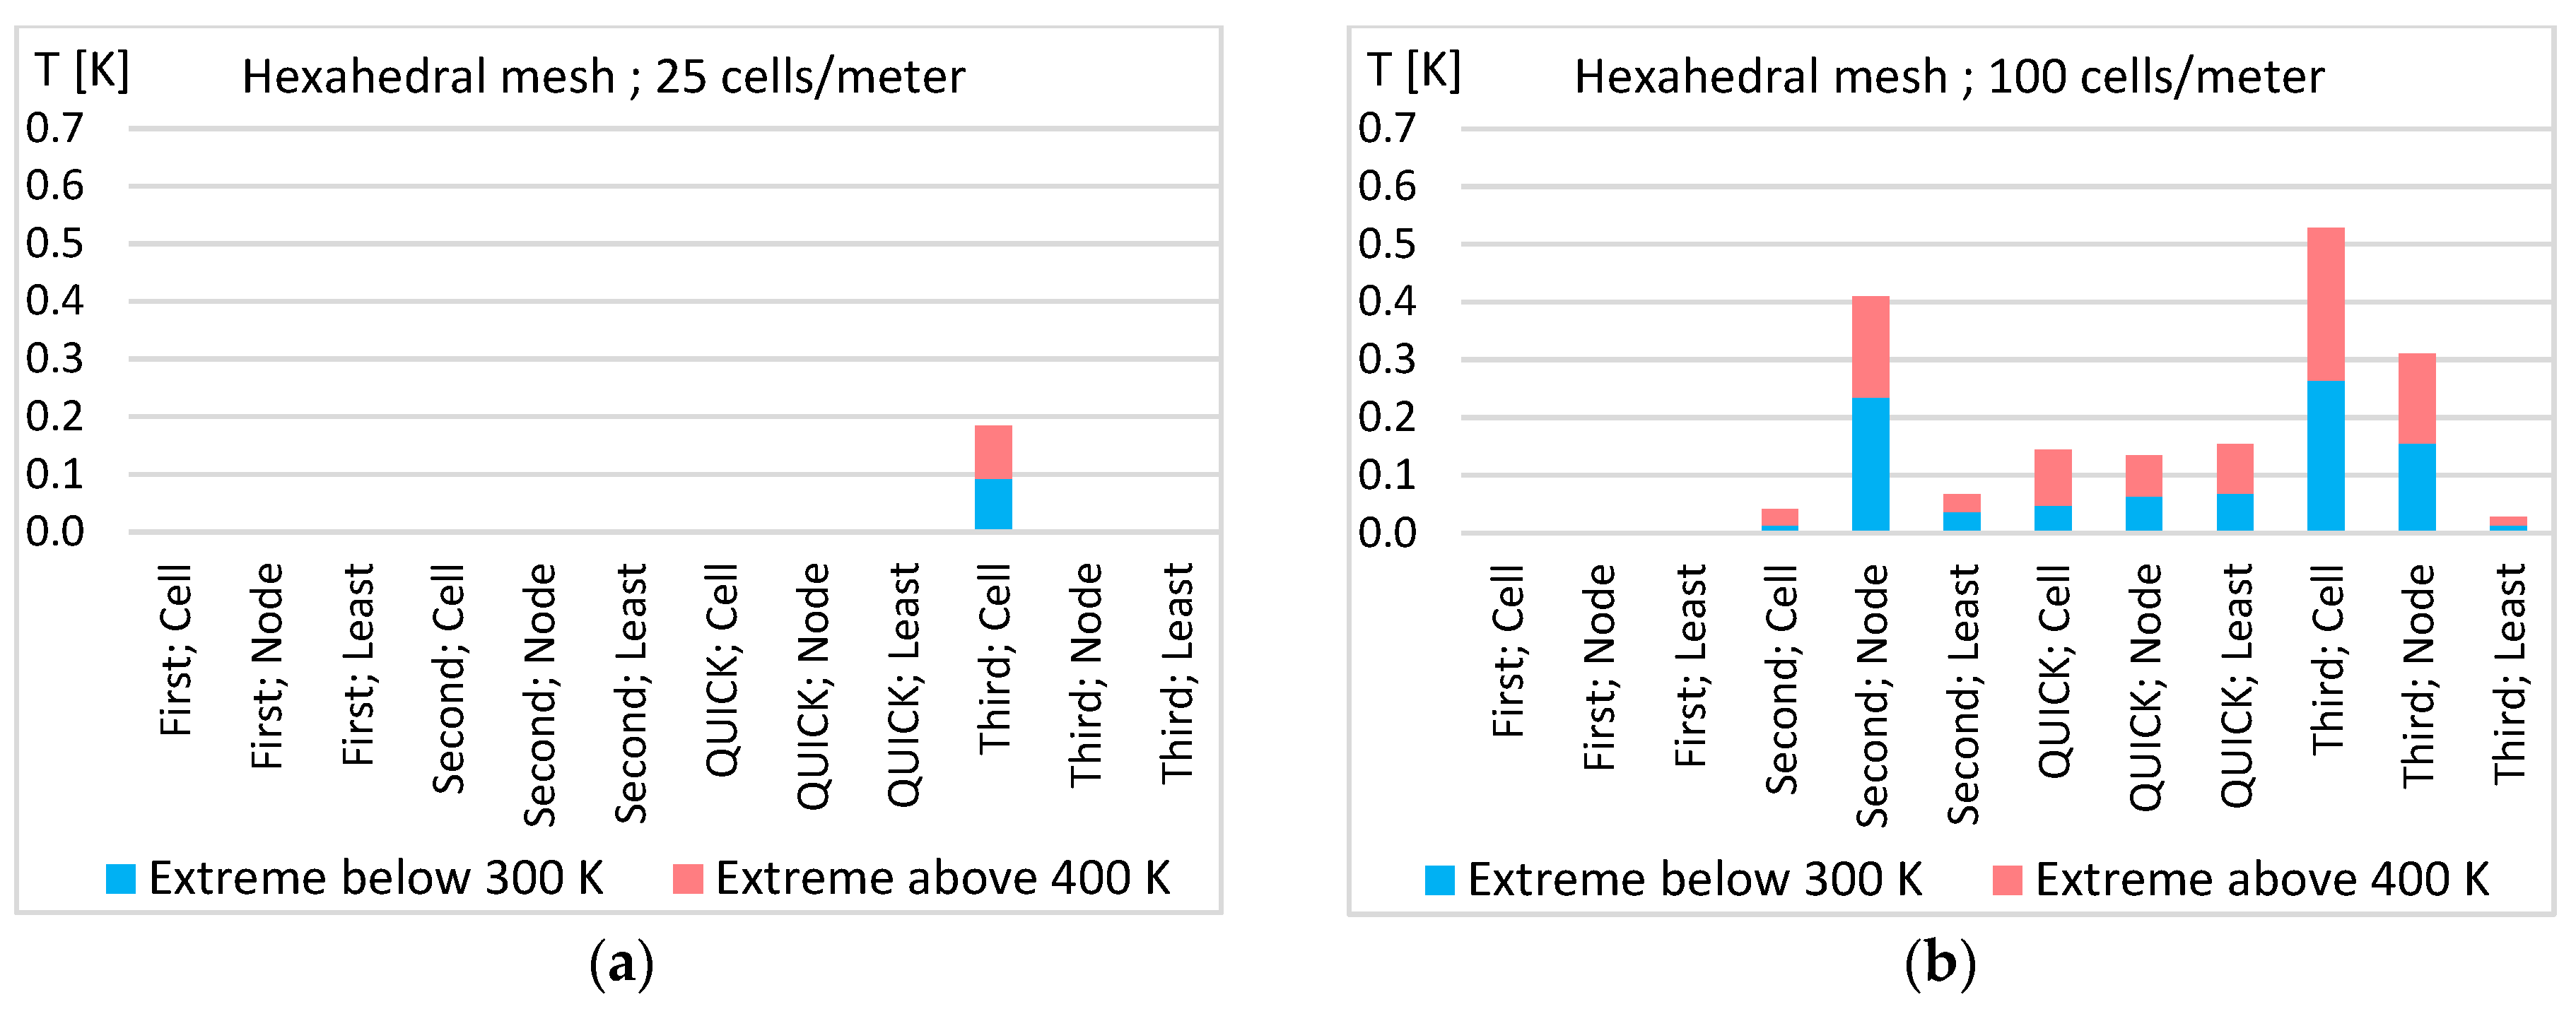
The lowest temperature deflections occur using of the hexahedral mesh. Their values outside the boundary conditions T ∈ (300 K, 400 K) are documented in Figure 16. The results differ significantly in comparing with the results using the other mesh; therefore, the scale in this case is ten times smaller than the following images. The highest deflections occurred using the dense mesh (100 cells/m) using the third-order MUSCL with the Green–Gauss cell-based method. The frequency of these deflections in the median plane of the calculation area (plane z = 0.125 m, see Figure 3) is shown in Figure 17a. Although the frequency is relatively high, these deflections can be considered negligible due to their minimum values. Figure 17b shows the frequency of the deflections using the Second-order upwind scheme with the Green–Gauss node-based; this shows the second highest values using the hexahedral mesh.
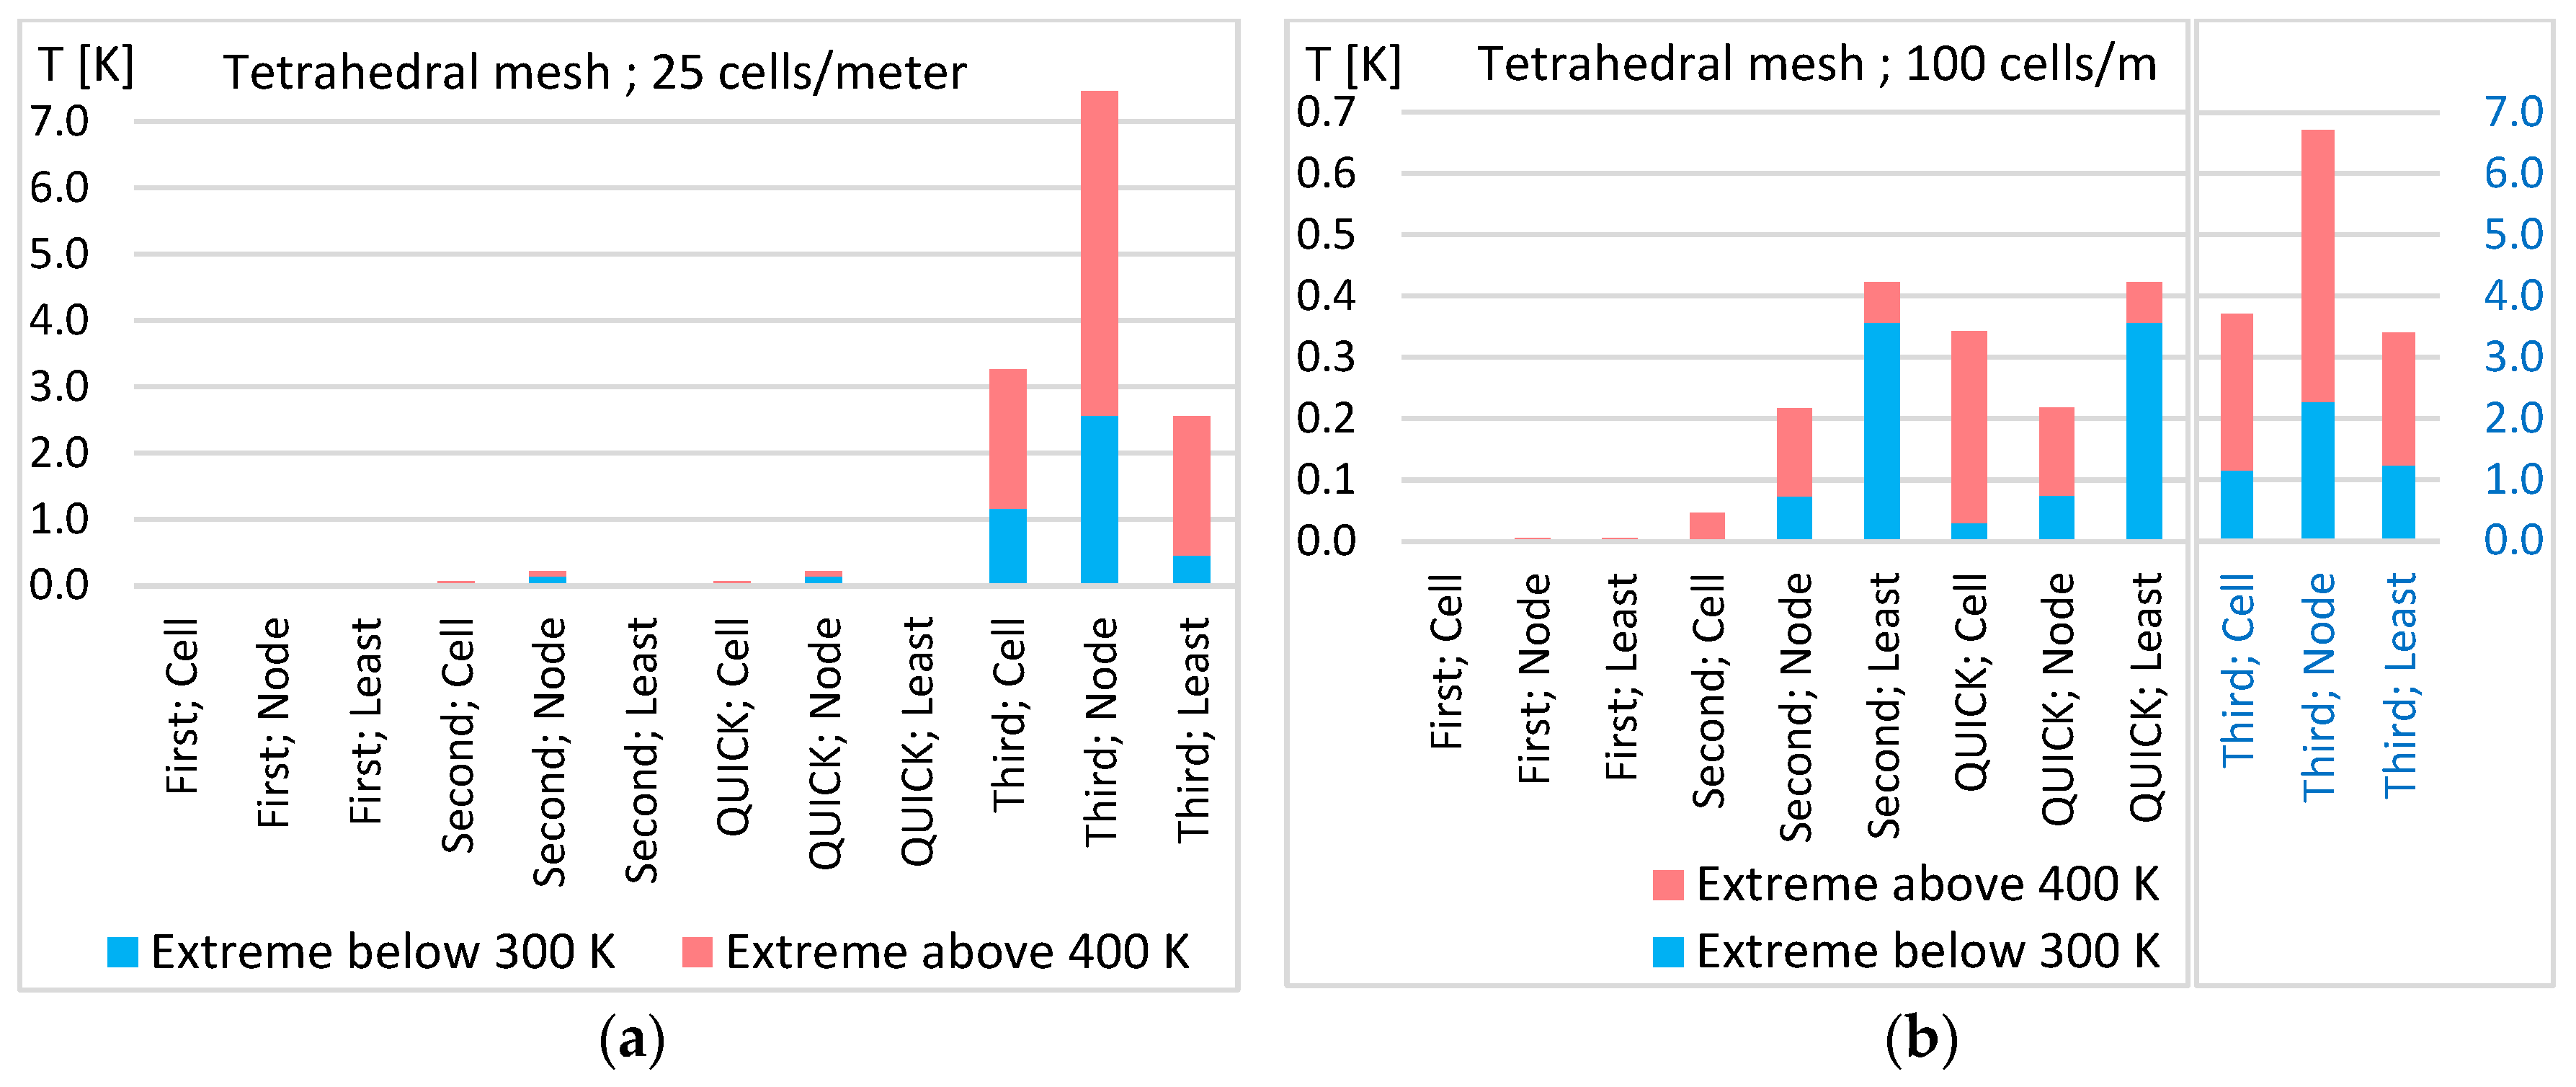
The significant extreme deflections of the specified temperature field values for solving the transport quantity gradient using the tetrahedral mesh occur, the third-order MUSCL for all methods. It is markedly for the coarse mesh, see Figure 18a. The deflection values using the fine mesh are in Figure 18b. The first and second-order upwind and the QUICK schemes have the targeted 10 × smaller scale (identical with the hexahedral), because the temperature values outside the range T ∈ (300 K, 400 K) are in order of the magnitude lower (maximum ± 0.4 K) than using the third-order MUSCL. This scheme has the scale identical to the coarse mesh.
The absolute highest deflections of the temperature values occur for the calculation using the Green–Gauss node-based method, both the fine and the coarse mesh, and this is the highest value exceedance of all variants of T = 400 K, see Figure 18. The frequency of the deflections for this case is in Figure 17c.
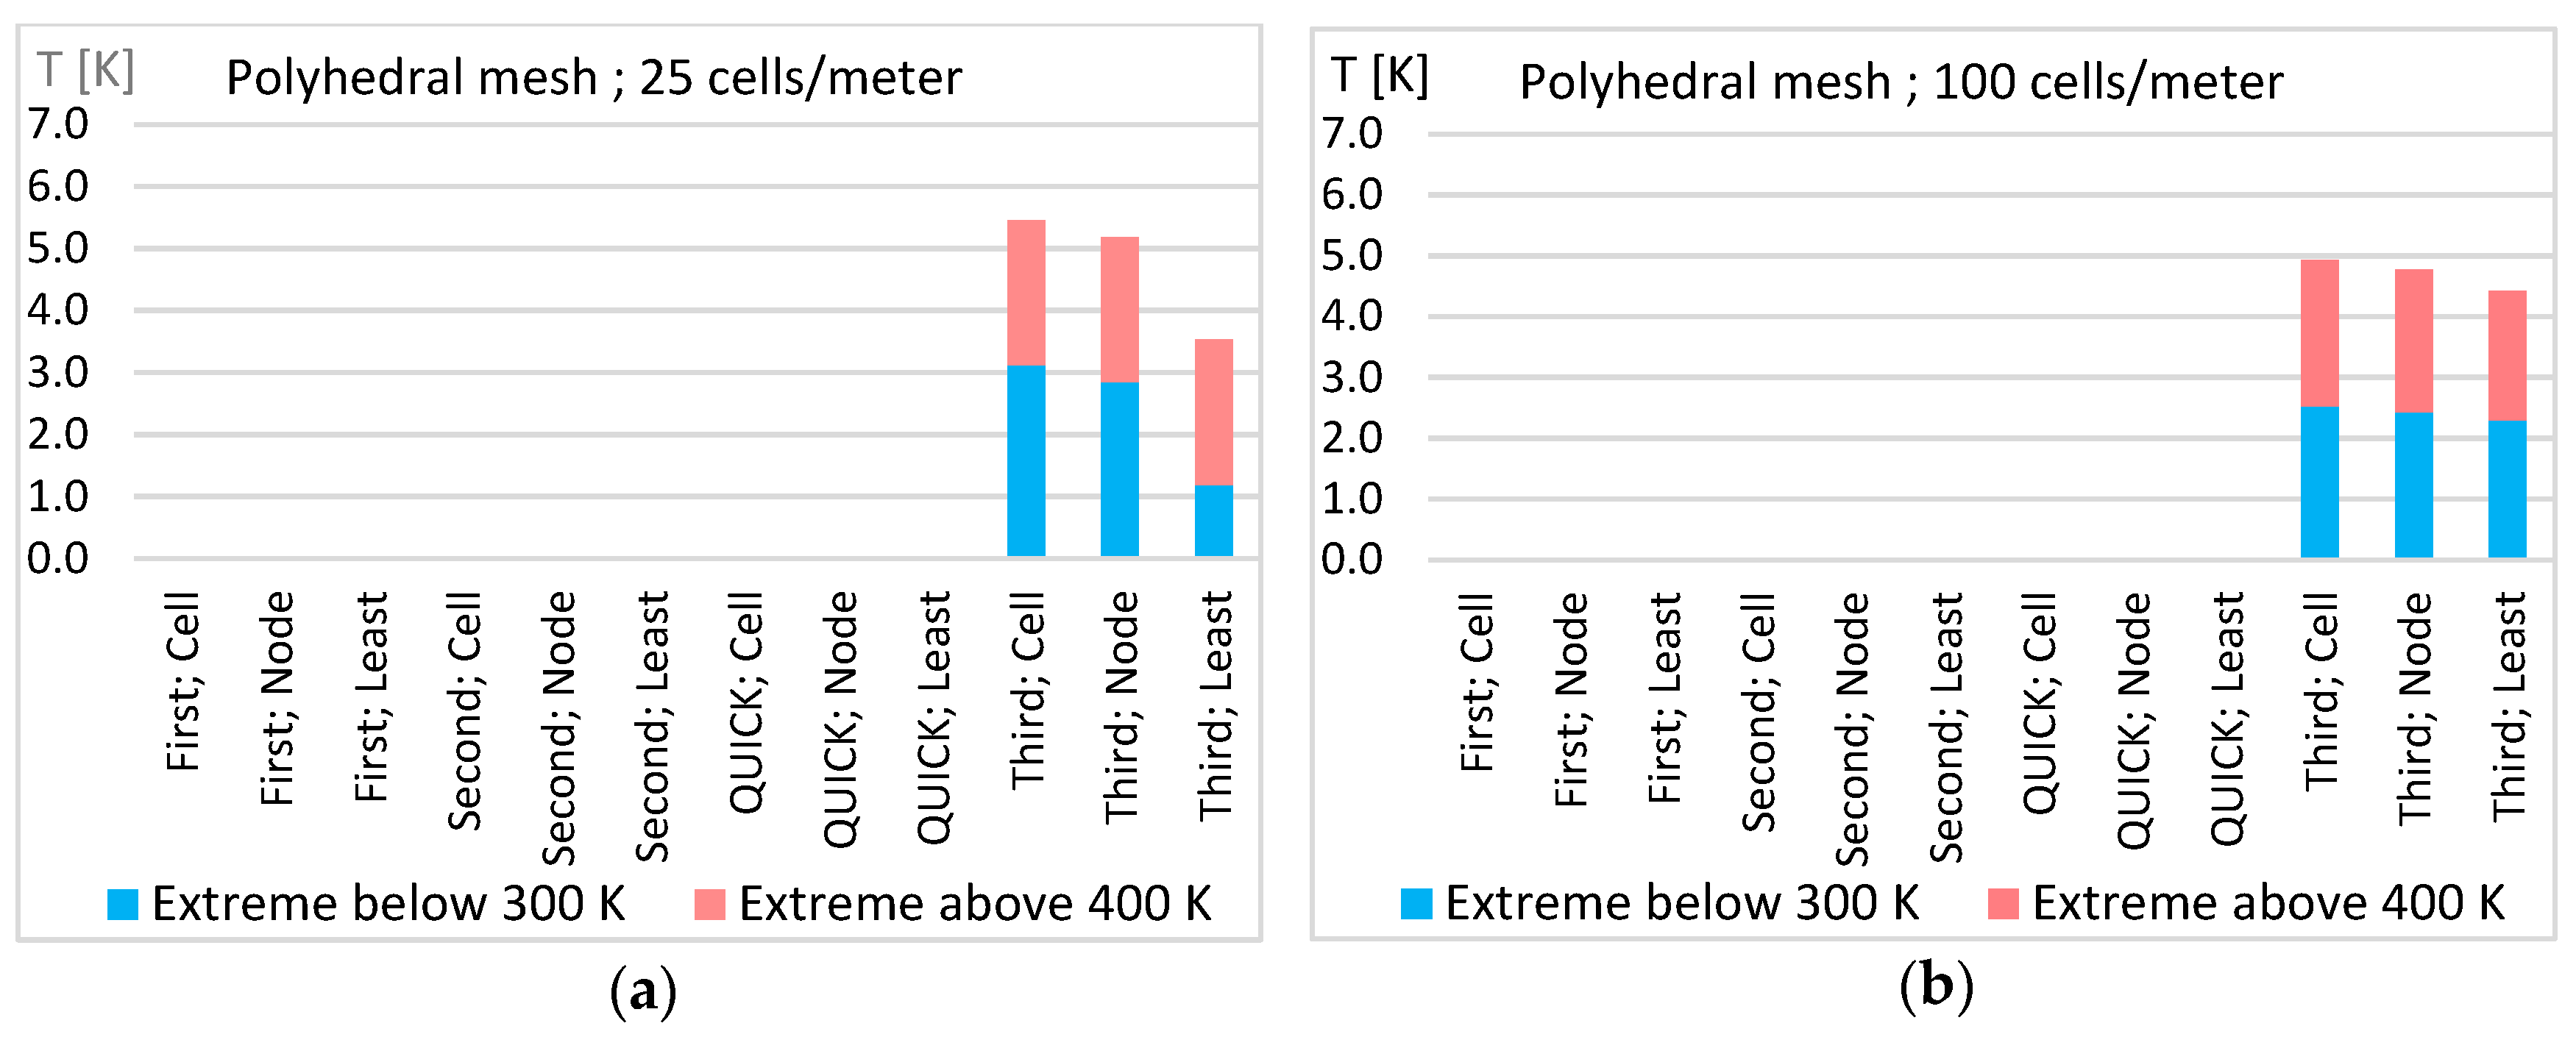
Using the polyhedral mesh gives almost zero exceeding values in the range of T ∈ (300 K, 400 K) except for the third-order MUSCL. This applies to all methods for solving the transport quantity gradient; see Figure 19. The highest deflections occur for the calculation using the Green–Gauss node-based method. Figure 17d shows the frequency of the deflections.

5. Discussion

5.1. Mesh Type

Hexahedral mesh:
  • Using the correct combination of the calculation parameters achieve the most accurate results of all tested tasks, but the results are diffusive with incorrect settings (for more see Section 5.2).
  • The lowest deflection of the entered values of the transport quantity Φ occur on this mesh.
  • The calculations are less sensitive to the choice of methods for solving the transport quantity gradient than using the tetrahedral mesh, unfortunately, in many cases, it is not possible to create the hexahedral cells for complex geometries separately.
Tetrahedral mesh:
  • The disadvantage is the large number of cells and, thus, the greater complexity of calculations.
  • The sensitivity to the choice of calculation parameters is high, but with the correct combination, can achieve good results (for more see Section 5.2).
Polyhedral mesh:
  • In many cases, it is recommended for great savings in the number of cells and, thus, less difficulty in the calculations.
  • The accuracy of the solutions is average to below average in this submitted study (see Section 5.2 for more information).

5.2. Discretization Scheme and the Method for Solving the Transport Quantity Gradients

First-order upwind scheme:
  • Produces very diffusive results, but it is easy to implement and its calculations are very stable.
  • This scheme is convenient for starting calculations.
Second-order upwind scheme:
  • It is more accurate than the first-order upwind scheme, but it is generally stated that it can lead to the values—that they are outside the range of the input in the regions with the strong gradients [38]. It is reflected in both the hexahedral and the tetrahedral mesh, but the deflections of the values are very low (see Figure 16 and Figure 18), and the frequency of the occurrence does not exceed the other cases (see Figure 17b).
  • This scheme achieves the weakest results among the higher order schemes using the hexahedral mesh.
  • Conversely, the solution using the tetrahedral mesh with the choice of the node-based and the least methods, together with the QUICK scheme, is relatively accurate, and comparable to the most accurate, using the hexahedral mesh (see Figure 12, Figure 13 and Figure 14).
QUICK scheme:
  • The scheme, stated in [37], is suitable mainly for the structured hexahedral meshes, but it can be used for the unstructured or hybrid meshes.
  • Using the hexahedral mesh, this scheme presents the most accurate results of all tested variants, regardless of the choice of the method for solving the transport quantity gradient.
  • The QUICK scheme, using the tetrahedral mesh, gives the results in terms of the size of the numerical diffusion comparable to the hexahedral mesh with the combination the Green–Gauss node-based or the least squares cell-based methods (Figure 12, Figure 13 and Figure 14), but there are slightly higher values of the temperature field value deflections. (Figure 16 and Figure 18).
  • The combination of the QUICK scheme with the Green–Gauss cell-based method for solving the transport quantity gradient is not suitable for the tetrahedral mesh; the results are very diffusive.
Third-order MUSCL:
  • The scheme has the potential to improve the spatial accuracy for all types of grids by reducing the numerical diffusion and it is available for all transport equations. This is confirmed only by the numerical calculations using the tetrahedral mesh in combination with the Green–Gauss node-based method. However, the occurrence of the values outside the correct solution is high (see Figure 13, Figure 14 or Figure 18), and the high deflections are also for the other methods.
  • This scheme shows the high deflections of the values of the transport quantity for the tetrahedral and the polyhedral meshes in all methods for solving the transport quantity gradient (see Figure 18 and Figure 19).
The recommended combinations of the calculation parameters are in Table 3. The unrecommended settings are listed in Table 4.

6. Conclusions

The presented work compares the physical accuracy of the calculation in the CFD code in the Ansys Fluent software using the offered discretization calculation schemes, the methods of the transport quantity gradients solving on the cell faces, and the influence of the mesh type. The sharp boundary of two areas with the different temperatures is created in the direction of the flow direction in the calculation area. The FVM simulates the 3D stationary flow of the fictitious gas so that only the advective transfer in the terms of the momentum and the heat arises. Ideally, the diffuse transmission should not occur. The level of the scattering of the temperature field (numerical diffusion) against the original sharp boundary of the two areas is monitored and also in which cases the values of the transport quantity (temperature) appear outside the range of the specified boundary conditions, i.e., outside the T ∈ range (300 K, 400 K). The frequencies of the deflections and the value deflections from the correct solution are evaluated.
The article offers the options for reducing of the numerical errors by setting the correct combination of the calculation parameters. The recommended combinations of the calculation parameters settings for the numerical modeling of the airflow effect on the buildings, including the partial results, are described in detail in the Results section. Their global summary is commented in the Discussion section.
The results of the presented study contribute to the development of the methodology for the numerical studies focused on the sustainable architecture. The conclusions will be used in solving specific problems of construction engineering practices, for example, in solving the velocity of substances in the porous domain of building materials and soils.
Final practical summary:
  • The coarse mesh is to be clearly more accurate.
  • The first-order upwind scheme does not depend on the choice of the methods for the solving of the transport quantity gradient, it produces the very diffusive results, but the calculation is stable, and it is suitable for starting calculations that are more complex. When calculating with the first-order upwind scheme, the values of the transport quantity Φ do not occur outside the input range.
  • The QUICK scheme shows the best results with the low diffusivity, even with the low values Φ outside the input range. The effect of the choice of the methods for solving the transport quantity gradient is manifested only on the tetrahedral mesh.
  • Although the third-order MUSCL is able to calculate the acceptable diffusivity, the values Φ outside the input range are significantly high compared to other discretization schemes.
  • The Green–Gauss cell-based method for the solving the transport quantity gradient is not suitable for the tetrahedral mesh; it shows the diffusive results for all discretization schemes except the first-order upwind.
  • The Green–Gauss node-based method for the solving of the transport quantity gradient is not suitable for the hexahedral mesh using the second-order upwind and the third-order MUSCL. It shows the diffusive results with these schemes.
  • The advantage of the polyhedral mesh with the low number of cells and, thus, less computational complexity, is negatively balanced by the higher diffusivity in all discretization schemes. The effect of the method for solving the transport quantity gradient option has no effect on the results on this mesh.

Author Contributions

V.M. performed the numerical simulations and analysis of results. V.M. and K.K. participated in the design of this study and drafted the manuscript. All authors have read and agreed to the published version of the manuscript.

Funding

This research was funded by VŠB-TUO by the Ministry of Education, Youth, and Sports of the Czech Republic.

Acknowledgments

Financial support from VSB-Technical University of Ostrava by means of the Czech Ministry of Education, Youth and Sports through the Institutional support for conceptual development of science, research, and innovations for the year 2020 and from the Scientific Grant Agency of the Ministry of Education of Slovak Republic and support from the Slovak Academy of Sciences the project VEGA 1/0374/19 are gratefully acknowledged.

Conflicts of Interest

The authors declare no conflict of interest.

References

  1. Zhong, W.; Zhang, T.; Tamura, T. CFD Simulation of Convective Heat Transfer on Vernacular Sustainable Architecture: Validation and Application of Methodology. Sustainability 2019, 11, 4231. [Google Scholar] [CrossRef] [Green Version]
  2. Ameer, S.A.; Chaudhry, H.N.; Agha, A. Influence of roof topology on the air distribution and ventilation effectiveness of wind towers. Energy Build. 2016, 130, 733–746. [Google Scholar] [CrossRef]
  3. Nejat, P.; Calautit, J.K.; Majid, M.Z.A.; Hughes, B.R.; Jomehzadeh, F. Anti-short-circuit device: A new solution for short-circuiting in windcatcher and improvement of natural ventilation performance. Build. Environ. 2016, 105, 24–39. [Google Scholar] [CrossRef] [Green Version]
  4. Michalcova, M.; Lausova, L. Numerical approach to determination of equivalent aerodynamic roughness of Industrial chimneys. Comput. Struct. 2018, 207, 187–193. [Google Scholar] [CrossRef]
  5. Michalcova, V.; Kuznetsov, S.; Pospisil, S. Numerical and experimental study of the load of an object due to the effects of a flow field in the atmospheric boundary layer. J. Math. Comput. Simul. 2014, 8, 135–140. [Google Scholar]
  6. Buske, D.; Vilhena, M.T.; Bodmann, B.; Tirabassi, T. Analytical Model for Air Pollution in the Atmospheric Boundary Layer. Air Pollut. Monit. Model. Health 2012, 1, 39–58. [Google Scholar]
  7. Michalcová, V.; Lausová, L.; Kološ, I. Numerical modelling of flow around thermally loaded object. MATEC 2017, 107, 00082. [Google Scholar] [CrossRef] [Green Version]
  8. Jenkins, M. Pedestrian Wind Comfort Around the World’s Tallest Church: Ulm Minster. 2020. Available online: https://www.simscale.com/blog/2020/09/ulm-minster-wind-comfort/ (accessed on 2 December 2020).
  9. Kotrasová, K. Dynamic Behavior of Fluid Rectangular Container. Int. J. Mech. 2018, 12, 170–177. [Google Scholar]
  10. Churazova, A. How to Optimize Pedestrian Wind Comfort: CFD Wind Analysis & Validation with Experiments. 2020. Available online: https://www.simscale.com/blog/2018/05/pedestrian-wind-comfort-validation/ (accessed on 2 December 2020).
  11. Kotrasová, K. Study of hydrodynamic pressure on wall of tank. Procedia Eng. 2017, 190, 2–6. [Google Scholar] [CrossRef]
  12. Kološ, I.; Michalcová, M.; Lausová, L. Numerical modeling of the pressure coefficient of the circular cylinder. Math. Methods Appl. Sci. 2019, 43, 7579–7594. [Google Scholar] [CrossRef]
  13. Kuznetsov, S.; Butova, A.; Pospíšil, S. Influence of placement and height of high-rise buildings on wind pressure distribution and natural ventilation of low-and medium-rise buildings. Int. J. Vent. 2016, 15, 253–266. [Google Scholar] [CrossRef]
  14. Almutairi, M.F.; Bourisli, R.I. Optimum orientation of a mutually shaded group of buildings with respect to external solar radiation. J. Therm. Eng. 2017, 3, 1065–1070. [Google Scholar]
  15. Calautit, J.K.; O’Connor, D.; Hughes, B.R. Determining the optimum spacing and arrangement for commercial wind towers for ventilation performance. Build. Environ. 2014, 82, 274–287. [Google Scholar] [CrossRef]
  16. Tominaga, Y. Computational fluid dynamics simulation of snowdrift around buildings: Past achievements and future perspectives. Cold Reg. Sci. Technol. 2018, 150, 2–14. [Google Scholar] [CrossRef]
  17. Mengmeng, L.; Qingwen, Z.; Feng, F.; Shizhao, S. Modelling of the Snowdrift in Cold Regions: Introduction and Evaluation of a New Approach. Appl. Sci. 2019, 9, 3393. [Google Scholar]
  18. Bell, J.N.B.; Honour, S.L.; Power, S.A. Effect of vehicle exhaust emission on urban wild plant species. Environ. Pollut. 2011, 159, 1984–1990. [Google Scholar] [CrossRef]
  19. Bhatia, A. HVAC-Natural Ventilation Principles. Available online: https://www.cedengineering.com/userfiles/HVAC%20-%20Natural%20Ventilation%20Principles%20.pdf (accessed on 2 October 2019).
  20. Hubova, O.; Veghova, I.; Kralik, J. Experimental and numerical investigation of in-line standing circular cylinders in steady and turbulent wind flow. IOP Conf. Ser.: Mater. Sci. Eng. 2019, 603, 032008. [Google Scholar] [CrossRef]
  21. Buljac, A.; Kozmar, H.; Pospíšil, S.; Macháček, M. Aerodynamic and aeroelastic characteristics of typical bridge decks equipped with wind barriers at the windward bridge-deck edge. Eng. Struct. 2017, 137, 310–322. [Google Scholar] [CrossRef]
  22. Hubova, O.; Macak, M.; Konecna, L.; Ciglan, G. External Pressure Coefficients on the Atypical High-Rise Building—Computing Simulation and Measurements in Wind Tunnel. Procedia Eng. 2017, 190, 488–495. [Google Scholar] [CrossRef]
  23. Karadimou, P.; Markatos, N.C. Numerical Simulations in Engineering and Science; IOL: London, UK, 2018; p. 391. [Google Scholar]
  24. Michálek, P.; Pospíšil, S.; Macháček, M.; Michalcová, V. Investigation of Flow Around and in Wake of a Heated Circular Cylinder at Moderate Reynolds Numbers. ASME J. Heat Transfer. 2020, 142, 111801. [Google Scholar] [CrossRef]
  25. Koldiz, O. Finite Volume Method. In Computational Methods in Environmental Fluid Mechanics; Springer: New York, NY, USA, 2002; p. 378. [Google Scholar]
  26. Giorgiani, G.; Bufferand, H.; Schwander, F.; Serre, E.; Tamain, P. A high-order non field-aligned approach for the discretization of strongly anisotropic diffusion operators in magnetic fusion. Comput. Phys. Commun. 2020, 254, 107375. [Google Scholar] [CrossRef]
  27. Barth, T.J.; Jespersen, D. The design and application of upwind schemes on unstructured meshes. In Proceedings of the Technical Report AIAA-89-0366. AIAA 27th Aerospace Sciences Meeting, Reno, NV, USA, 17 August 2012. [Google Scholar]
  28. Van Leer, B. Toward the Ultimate Concervative Difference Scheme. IV. A Second Order Sequel to Godunov’s Method. J. Comput. Phys. 1979, 32, 101–136. [Google Scholar] [CrossRef]
  29. Braun, M.P.; Mineto, A.T.; Navarro, H.A.; Cabezas-Gómez, L.; César da Silva, R. The effect of numerical diffusion and the influence of computational grid over gas–solid two-phase flow in a bubbling fluidized bed. Math. Comput. Model. 2010, 52, 1390–1402. [Google Scholar] [CrossRef]
  30. Loukili, M.; Kotrasova, K.; Dutykh, D. A computational Simulation of Steady Natural Convection in an H-Form Cavity. arXiv 2020, arXiv:2005.12687. [Google Scholar]
  31. Loukili, M.; Mordane, S. New contribution to stokes equations. Adv. Appl. Fluid Mech. 2017, 20, 107–116. [Google Scholar] [CrossRef]
  32. Holleman, R.; Fringer, O.; Stacey, M. Numerical diffusion for flow-aligned unstructured grids with application to estuarine modelling. Int. J. Number. Methods Fluids. 2013, 72, 1117–1145. [Google Scholar] [CrossRef]
  33. Leonard, B.P. The ULTIMATE conservative difference scheme applied to unsteady one-dimensional advection. Comput. Methods Appl. Mech. Eng. 1991, 88, 17–74. [Google Scholar] [CrossRef]
  34. Darwish, M.S.; Moukalled, F. TVD schemes for unstructured grids. Int. J. Heat Mass Transf. 2003, 46, 599–611. [Google Scholar] [CrossRef]
  35. Denner, F.; Berend van Wachem, G.M. TVD differencing on three-dimensional unstructured meshes with monotonicity-preserving correction of mesh skewness. J. Comput. Phys. 2015, 298, 466–479. [Google Scholar] [CrossRef] [Green Version]
  36. Hou, J.; Liang, Q.; Li, Z.; Wang, S.; Hinkelmann, R. Numerical error control for second-order explicit TVD scheme with limiters in advection simulation. Comput. Math. Appl. 2015, 70, 2197–2209. [Google Scholar] [CrossRef]
  37. ANSYS Fluent Theory Guide, Release R2 (ANSYS, Inc., 2020). Available online: https://support.ansys.com/portal/site/AnsysCustomerPortal/menuitem.ccf823d00ac41e5184090e10639c97a0/?vgnextoid=249cf8f55d886310VgnVCM10000036c9790aRCRD&vgnextfmt=default (accessed on 15 March 2020).
  38. Backer. Available online: http://www.bakker.org/dartmouth06/engs150/01-intro.pdf (accessed on 4 August 2006).
Figure 1. Illustration of air filtration and numerical simulation [3].
Sustainability 12 10173 g001
Figure 2. The Computational Fluid Dynamics (CFD) simulation of the wind around buildings [10].
Sustainability 12 10173 g002
Figure 3. The calculation domain scheme 1 × 1 × 0.25 m and the boundary conditions.
Sustainability 12 10173 g003
Figure 4. Three mesh types and axis scheme on which the transport quantities are evaluated; the coarse mesh: (a) hexahedral; (b) tetrahedral; (c) polyhedral.
Sustainability 12 10173 g004
Figure 5. Two different densities of the tetrahedral mesh: (a) coarse; (b) fine.
Sustainability 12 10173 g005
Figure 6. Hexahedral elements, influence of the mesh density on the temperature field scattering: (a) 25 cells/meter, first-order; (b) 100 cells/meter, first-order; (c) 25 cells/meter, second-order; (d) 100 cells/meter, second-order.
Sustainability 12 10173 g006
Figure 7. Coarse mesh, 25 cells/meter, second-order, influence of the grid type on the temperature field scattering: (a) hexahedral; (b) tetrahedral; (c) polyhedral; (d) the temperature diagram in the direction of horizontal axis (y = 0.5 m, z = 0.125 m). The legend is identical with legend in Figure 6.
Sustainability 12 10173 g007
Figure 8. Fine mesh, 100 cells/meter, second-order, influence of the grid type on the temperature field scattering: (a) hexahedral; (b) tetrahedral; (c) polyhedral; (d) the temperature diagram in the direction of horizontal axis (y = 0.5 m, z = 0.125 m). The legend is identical with legend in Figure 6.
Sustainability 12 10173 g008
Figure 9. Influence of the discretization scheme choice on the temperature field scattering, hexahedral elements, node-based method for the transport quantity gradients, y = 0.5 m, z = 0.125 m: (a) 25 points/meter; (b) 100 points/meter.
Sustainability 12 10173 g009
Figure 10. Influence of the discretization scheme choice on the temperature field scattering, tetrahedral elements, node-based method for the transport quantity gradients, 100 points/meter, z = 0.125 m: (a) y = 0.5 m; (b) y = 0.9 m.
Sustainability 12 10173 g010
Figure 11. First-order upwind scheme: influence of the method choice for the solving of the transport quantity gradients and the mesh type on the numerical diffusion; 100 cells/m; y = 0.9; z = 0.125 m.
Sustainability 12 10173 g011
Figure 12. Hexahedral mesh: influence of the method choice for the solving of the transport quantity gradients and the mesh type on the numerical diffusion; 100 cells/m; y = 0.9; z = 0.125 m.
Sustainability 12 10173 g012
Figure 13. Tetrahedral mesh: influence of the method choice for the solving of the transport quantity gradients and the mesh type on the numerical diffusion; 100 cells/m; y = 0.9; z = 0.125 m.
Sustainability 12 10173 g013
Figure 14. Percentage values of the error from the ideal sharp limit of the temperature field in the immediate vicinity of this limit: (a) combination of calculation parameters on specific meshes; (b) combination of calculation parameters for a specific upwind scheme; 100 cells/m; y = 0.9; z = 0.125 m.
Sustainability 12 10173 g014
Figure 15. Polyhedral mesh: influence of the method choice for the solving of the transport quantity gradients and the mesh type on the numerical diffusion; 100 cells/m; y = 0.9; z = 0.125 m.
Sustainability 12 10173 g015
Figure 16. Hexahedral mesh: the extreme values of the transport quantities outside the range of the correct solution: (a) coarse mesh; (b) fine mesh.
Sustainability 12 10173 g016
Figure 17. Frequency of the transport quantity deflections outside the range of input parameters (white field), fine mesh: (a) hexahedral, third-order MUSCL; (b) hexahedral, second-order; (c) tetrahedral; (d) polyhedral.
Sustainability 12 10173 g017
Figure 18. Tetrahedral mesh: the extreme values of the transport quantities outside the range of the correct solution: (a) coarse mesh; (b) fine mesh.
Sustainability 12 10173 g018
Figure 19. Polyhedral mesh: the extreme values of the transport quantities outside the range of the correct solution: (a) coarse mesh; (b) fine mesh.
Sustainability 12 10173 g019
Table 1. Number of cells in computational areas.
Mesh TypeHexahedralTetrahedralPolyhedral
Values in Thousands25 Cells100 Cells25 Cells100 Cells25 Cellstetra100 Cellstetra
Cells number3.825028.416605.9294
Faces number12.276558.9335538.82023
Nodes number4.72655.829432.91729
Table 2. The discretization schemes for the adventive flow calculation.
Flow Direction →Description of Discretization Schemes
Sustainability 12 10173 i001First-order upwind scheme is based on the assumption that the value of the quantity in the cell center corresponds to the average value in the whole control volume and the face value Φf is set equal to the cell-center value of Φ in the upstream cell. The first-order upwind scheme is not depended on the gradient Φ.
Sustainability 12 10173 i002Power law scheme is based on the analytical solution the one-dimensional advection-diffusion equation. The face value Φf is determined from the exponential profile by using the values of the cell in their center. The exponential profile is depended on the Peclet number Pe (ratio of the convection heat flow (advection) and the heat flow by the mechanism of the convection (diffusion)). The solution is the same with the first-order upwind scheme for |Pe| ≥ 10.
Sustainability 12 10173 i003Second-order upwind scheme: the face value Φf is determined from the cell values in the two cells upstream of the face. This scheme requires the determination of the gradient Φ in each cell. This is more accurate than the first-order upwind scheme, but in the regions with the strong gradients, it can result in the face values that are outside of the range of the correct cell values.
Sustainability 12 10173 i004Quadratic Upwind Interpolation for Convective Kinetics (QUICK) scheme. The quadratic curve is fitted with two upstream nodes and one downstream node. This scheme requires the determination of the gradient Φ in each cell. This is a very accurate scheme, but it can lead to stability problems in the calculation in the regions with strong gradients. QUICK scheme, documented in [37], is mainly suitable for the pro structured hexahedral meshes, but it can be used for the unstructured or the hybrid meshes.
-Third-order Monotone Upstream-centered Scheme for Conservation Laws (MUSCL). This third-order convection scheme was created from the original MUSCL [28], by mixing the central differentiation scheme and the second-order winding scheme. This scheme requires the determination of the gradient Φ in each cell. It is usable for all grid types.
Table 3. Recommended combinations of the calculation parameters settings for three mesh types.
Mesh TypeDiscretization SchemeMethod for Solving Transport Quantity GradientNumerical DiffusionOut Range Values
HexahedralQUICK schemeMethod does not affectLowest of all variantsSignificantly low
TetrahedralSecond-order and QUICK schemesGreen–Gauss node-based, or least squares cell-basedSmallLow
PolyhedralSecond-order and QUICK schemesMethod does not affectUnitedLow
Third-orderMethod does not affectAverageHigh
Table 4. Inappropriate combinations of the calculation parameter for hexahedral and tetrahedral meshes.
Mesh TypeDiscretization SchemeExplanation
HexahedralSecond-order schemeHigh diffusion, the largest for Green–Gauss node-based choice, values outside the input range are low, Figure 12, Figure 14, and Figure 16.
Third-order schemeHigh diffusion for Green–Gauss node-based choice, values outside the input range significantly high, Figure 12, Figure 14, and Figure 16.
TetrahedralAll schemesHeight diffusion for Green–Gauss cell-based choice, Figure 13 and Figure 14.
Publisher’s Note: MDPI stays neutral with regard to jurisdictional claims in published maps and institutional affiliations.