Article

The Impact of Flood Risk on the Activity of the Residential Land Market in a Polish Cultural Heritage Town

by
Małgorzata Dudzińska
1,
Barbara Prus
2,
Radosław Cellmer
3,
Stanisław Bacior
4,*,
Katarzyna Kocur-Bera
5,
Anna Klimach
1 and
Agnieszka Trystuła
1
1
Institute of Geography and Land Management, Faculty of Geoengineering, University of Warmia and Mazury in Olsztyn, Prawocheńskiego str. 15, 10-719 Olsztyn, Poland
2
Department of Land Management and Landscape Architecture, Faculty of Environmental Engineering and Land Surveying, University of Agriculture in Kraków, Balicka str. 253c, 30-149 Kraków, Poland
3
Department of Spatial Analysis and Real Estate Market, Faculty of Geoengineering, University of Warmia and Mazury in Olsztyn, Prawocheńskiego str. 15, 10-720 Olsztyn, Poland
4
Department of Geodesy, Cadastre and Photogrammetry, Faculty of Environmental Engineering and Land Surveying, University of Agriculture in Kraków, Balicka str. 253a, 30-149 Kraków, Poland
5
Institute of Geodesy and Civil Engineering, Faculty of Geoengineering, University of Warmia and Mazury in Olsztyn, Prawocheńskiego str. 15, 10-719 Olsztyn, Poland
*
Author to whom correspondence should be addressed.
Sustainability 2020, 12(23), 10098; https://doi.org/10.3390/su122310098
Submission received: 25 October 2020 / Revised: 21 November 2020 / Accepted: 1 December 2020 / Published: 3 December 2020

Abstract

:
The article attempts to determine the effect of perceived flood risk, based on identified flood hazard zones, on the level of activity in the market of land property designated for housing developments in the historical town of Sandomierz, Poland. The study employed graphical, analytical, quantitative methods, and spatial analyses with GIS tools. The proposed methodology, involving spatial interpolation of the phenomenon (Kernel Density Estimation (KDE) and Inverse Distance Weighting (IDW)) and an expert opinion survey, facilitates the assessment of the market activity in towns where transactions are scarce. Trade in property is lower in areas at risk of flooding than for the remaining parts of the town. The potential flood hazard zone affects both the activity of the property market and the average prices of land. The study demonstrated that both a flood and flood risk affect the levels of market activity and the prices of residential land. However, this impact differs at various times and locations and is greater immediately after a flood. Properties located in the most attractive location within an area are characterised by a greater sensitivity to this risk.

1. Introduction

One of the goals of sustainable development is to provide better and safer living conditions for inhabitants. For many years, among many threats, flooding has been an extreme and unpredictable phenomenon [1]. However, with the advent of expensive forms of permanent land development, this dangerous element became to be recognised in economic terms, the losses it causes included [2]. The losses were the reason for searching for methods to estimate the probability of the occurrence of a flood, or the scale of the hazard it entails [3,4]. In many countries, measures have been taken to force relevant authorities to determine flood hazard areas through such means as flood hazard maps [5,6,7]. This policy, which involves the determination of the location of hazards and demarcation of restricted use areas, is aimed at highlighting the potential risk based on historical information of flood events. This phenomenon may be referred to as ‘information pressure’. A multiplied and direct transfer of information may affect the awareness of various social groups [8]. The information pressure may be directed so that the individual’s awareness changes through education and promotion of attitudes related to flood protection. Undoubtedly, information on flood hazard also shapes the awareness of businesses operating in the property market [9].
Floods are one of the most common natural disasters in the world [10]. The global frequency and severity of natural disasters have increased over the past several decades; the trend is expected to continue [11]. Flood hazard can be considered as the most serious threat. It is, however, possible to determine the scale of flood risk, which depends on the following factors: the location, hydrological conditions, meteorological conditions, topography, and past flood types [12]. A spatial economic assessment of the environmental flood risk is important because of decision-making regarding public and private projects building infrastructure to reduce the negative impact of high water [11,13].
At the European Union level, measures have been taken to prepare the Member States for controlling flood disasters. On 26 November 2007, Directive 2007/60/EC of the European Parliament and Council on the assessment and management of flood risks, commonly referred to as the Floods Directive, entered into force [14,15]. Based on the Floods Directive 2007/60/EC, each member of the European Union should design flood hazard maps using different probabilities of flooding. This would make the information more obvious to the local authorities and understandable to the public, providing valuable spatial information regarding the degree of flood hazard [16,17].
The methodology for mapping flood hazard in Poland was set out in the regulation of 21 December 2012, on the preparation of flood hazard maps and flood risk maps, which implements the requirements of the Floods Directive. Flood hazard maps show the spatial range of floods, the water depth, and, where possible, the rate of water flow [18]. Flood hazard maps contain three scenarios of the range of flood. These maps show the spatial range of floodwater with three classes of probability: ten-year flood (Q10%, high probability), hundred-year flood (Q1%, medium probability), and five-hundred-year flood (Q0.2%, low probability). For example, a 100-year floodplain is an area where a flood has a 1% chance of occurring in any given year [19].
Moreover, in areas with flood protection infrastructure, zones at risk of being flooded in the event of a breach of a flood embankment, water overflow over the embankment crest, or damage to or destruction of damming structures have been designated [20]. Porter and Demeritt [14] report that maps are instruments not only for defining and communicating flood risks, but also for regulating them and for rationalizing the inevitable limits and failures of those controls. The purpose of flood maps is more than just providing information with which to assess and thereby reduce the probability and repercussions of flooding.
The common assumption of these policies is that the publication of geographic locations of hazards should increase people’s risk perception (perceived personal risk) so that they will take preventive measures to avoid risks. In the residential housing market, this means that residential properties in risk-prone areas would be less desirable and thus have lower values than equivalent units located elsewhere [21].
Many researchers investigated the flood hazard impact on house prices [21,22,23,24,25]. Zhang investigated heterogeneity in the flood hazard impact on the full conditional distribution of prices and found that the flood hazard impact on house prices varied across the conditional distribution of house prices. On the other hand, conditional lower-priced houses are more prone to be affected by flood risk. The price discount shows the owner’s willingness to pay to reduce the cost of flooding, which means the difference between the market value of a house located within a floodplain and the house located outside a floodplain [19]. Harrison et al. [25] examined the effect of flood risk on the value of houses in Florida. The results showed that the location within the floodplain lowers the value of a house. Similarly, according to Atreya et al. [22], prices of houses in Georgia (United States) located within a 100-year floodplain fell significantly after a major flood. Still, the effect disappeared between four and nine years after the flood. Flood risk trends can disappear over time, particularly when flooding events are infrequent [9]. Beltrán et al. [26] proposed similar conclusions. They noted that an immediate cut in property prices after flooding did not herald a permanent reduction. They employed the repeat-sales model, which investigates the sale price of properties sold multiple times.
Rajapaksa et al. [10] investigated the effects floods had on values of properties following a flood event in Brisbane, Australia. It was the first analysis of the effect a flood risk map publication had on a property market. The impact was then compared to the effect of an actual flood event on the market. It caused a significant decrease in property prices in the flood zone. Rajapaksa et al. [10] estimated the effect of temporal variations in flooding on property values. The results indicated that property values in affluent suburbs recovered faster than in poorer areas. This research also highlighted the importance of suburb characteristics for property values and the pace of recovery of property values after a flood event. Atreya and Czajkowski [27] assessed the flood risk in Galveston County, Texas, United States. Their results showed that properties located in high-risk flood areas command a price premium, compared with those located elsewhere. They found that housing market properties located in the highest-risk flood area, up to almost 400 metres from the nearest coastline, actually offered a price premium.
Most studies found that flooding and floodplain locations had a negative impact on residential properties [28]. The findings are inconsistent, but most studies suggest that natural hazards, such as flood events, have a negative effect [19,29], while others suggest no effect [30]. The occurrence of flood hazard areas also affects the level of activity of the property market and the behaviour in the property market—whether a developer’s, seller’s, or buyer’s. Eves and Wilkinson [31] approached the issue of flood impact on residential property markets by analysing the short-term behaviour of residential property market participants immediately after a flood event. This was achieved by assessing the change in the number of residential properties listed for sale or rent immediately before a major flood event and for 12 months following that event. Akbar et al. [32] also analysed property market activity before and after a flood. This study focused on identifying market vulnerability by comparing segments of the property market, that is, the number of total house (TH) sales (old and new houses), new house and land (HL) package sales, and land only (LO) sales before and after the 2011 floods. They demonstrated a lower level of the activity of the residential property market in areas that were flooded. The study was conducted immediately after the flood.
The objective of this paper is to determine the impact of perceived flood hazard (based on delineated flood risk zones) on the activity of the residential land market in Sandomierz. The authors determine the extent to which the awareness of flood risk areas shapes the residential property market and prices in the entire town. To this end, they developed a methodology to investigate this phenomenon in towns where the number of transactions is relatively small. The analysis was based on geoprocessing. It yielded thematic maps of the activity of the property market in the town. Neither literature nor practical guides propose this approach to space assessment, especially regarding Polish urban areas.

2. Materials and Methods
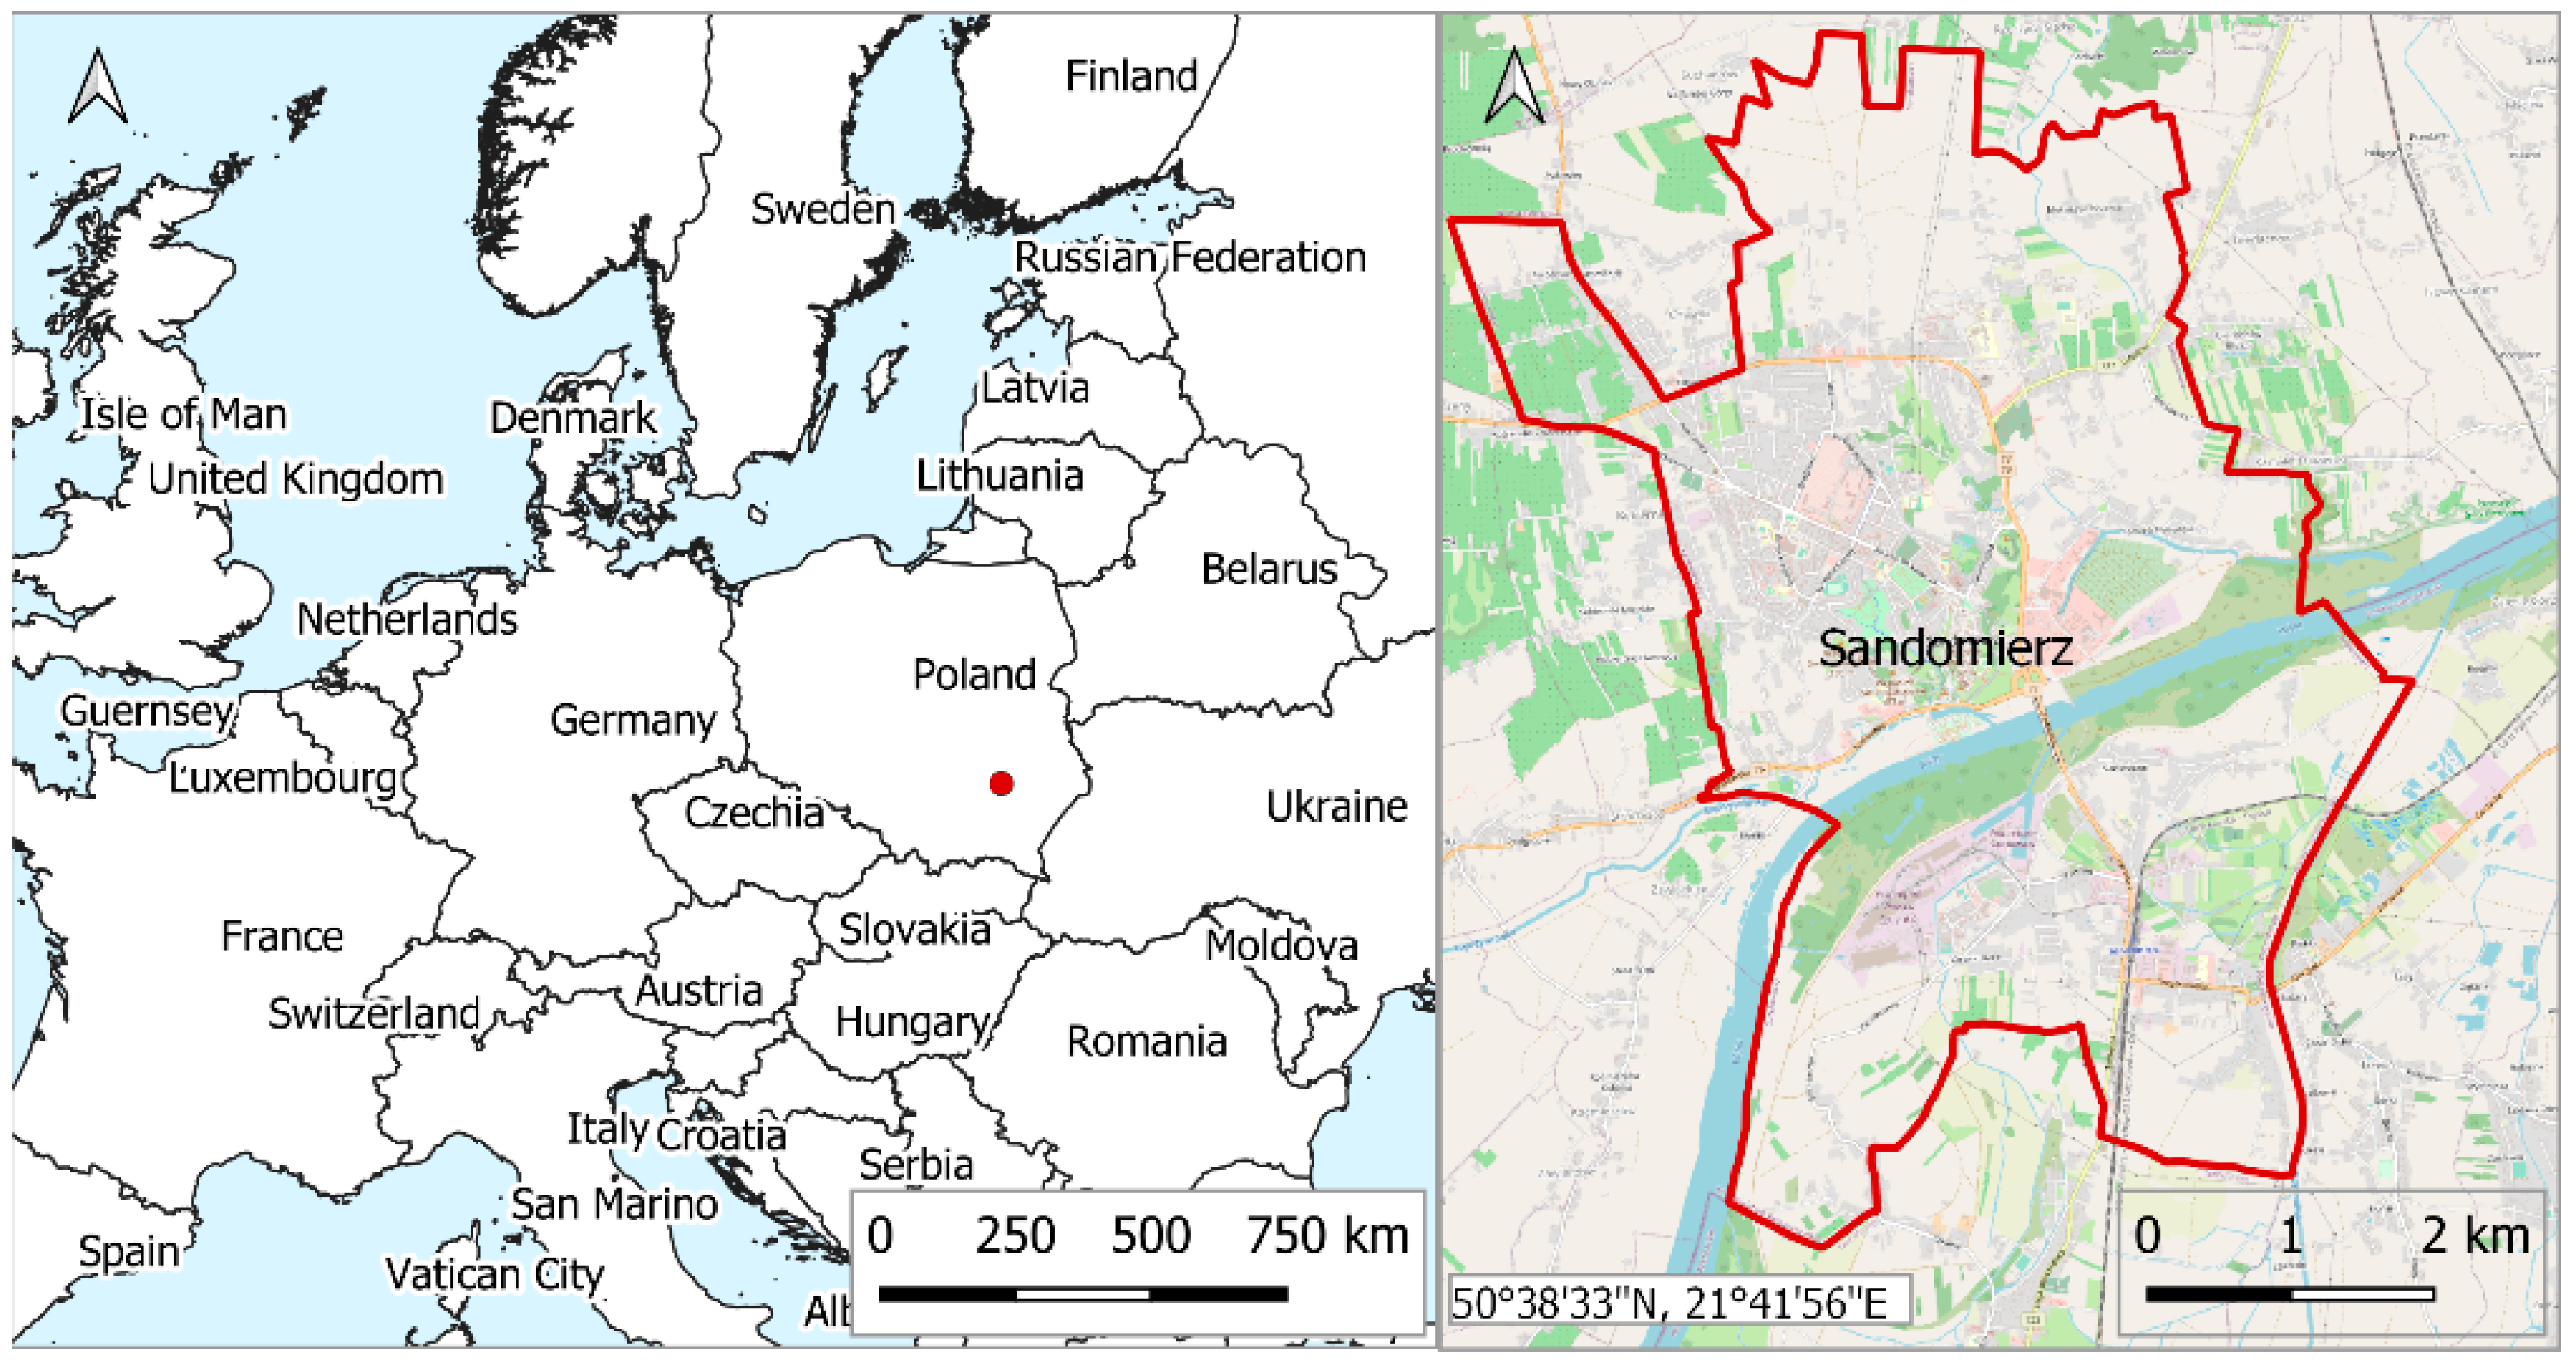
2.1. Study Area

Sandomierz is one of the oldest, and, historically, most important Polish towns located on the Vistula River (Figure 1). It’s stretched between 50°38′33″ N and 50°43′27″ N and 21°41′56″ E and 21°47′19″ E. The total area of the town is 28.69 km2, and the number of inhabitants is 24,600. The town is famous for its rich traditions and culture. The Vistula River divides the town in two: the northern part (on the left bank) is located on the Kielce–Sandomierz Upland, and the southern side (on the right bank) is situated in the area of the Sandomierz Valley. Each differs from the other in its nature and functions. The right bank part is of industrial character with single- and multi-family buildings. It has a glass factory, a manufacturer of fodder concentrates, and numerous warehouses and storages. The left bank part of Sandomierz has a historical, residential, and administrative services character. It has the majority of the town’s multi-family buildings. Single-family houses are located in peripheral districts and also in enclaves between blocks of flats. Only the public utility, a dairy, and a farmer’s market are situated in the areas at the foot of a slope.
The balance of areas with different functional and spatial use types in the town of Sandomierz indicates that 30% of the land is built-up areas. Approximately 50% of the surface area of this zone include housing developments, 25% is industrial, warehouse, and production facilities, and 15% is public service areas with housing and administration developments. In regard to the areas with developments, approximately 80% of them are single-family houses, and 20% of them are multi-family buildings. In 2010, the town was hit by a great flood called the Millennium Flood. It covered its entire southern part. Areas marked as floodplains were inundated.

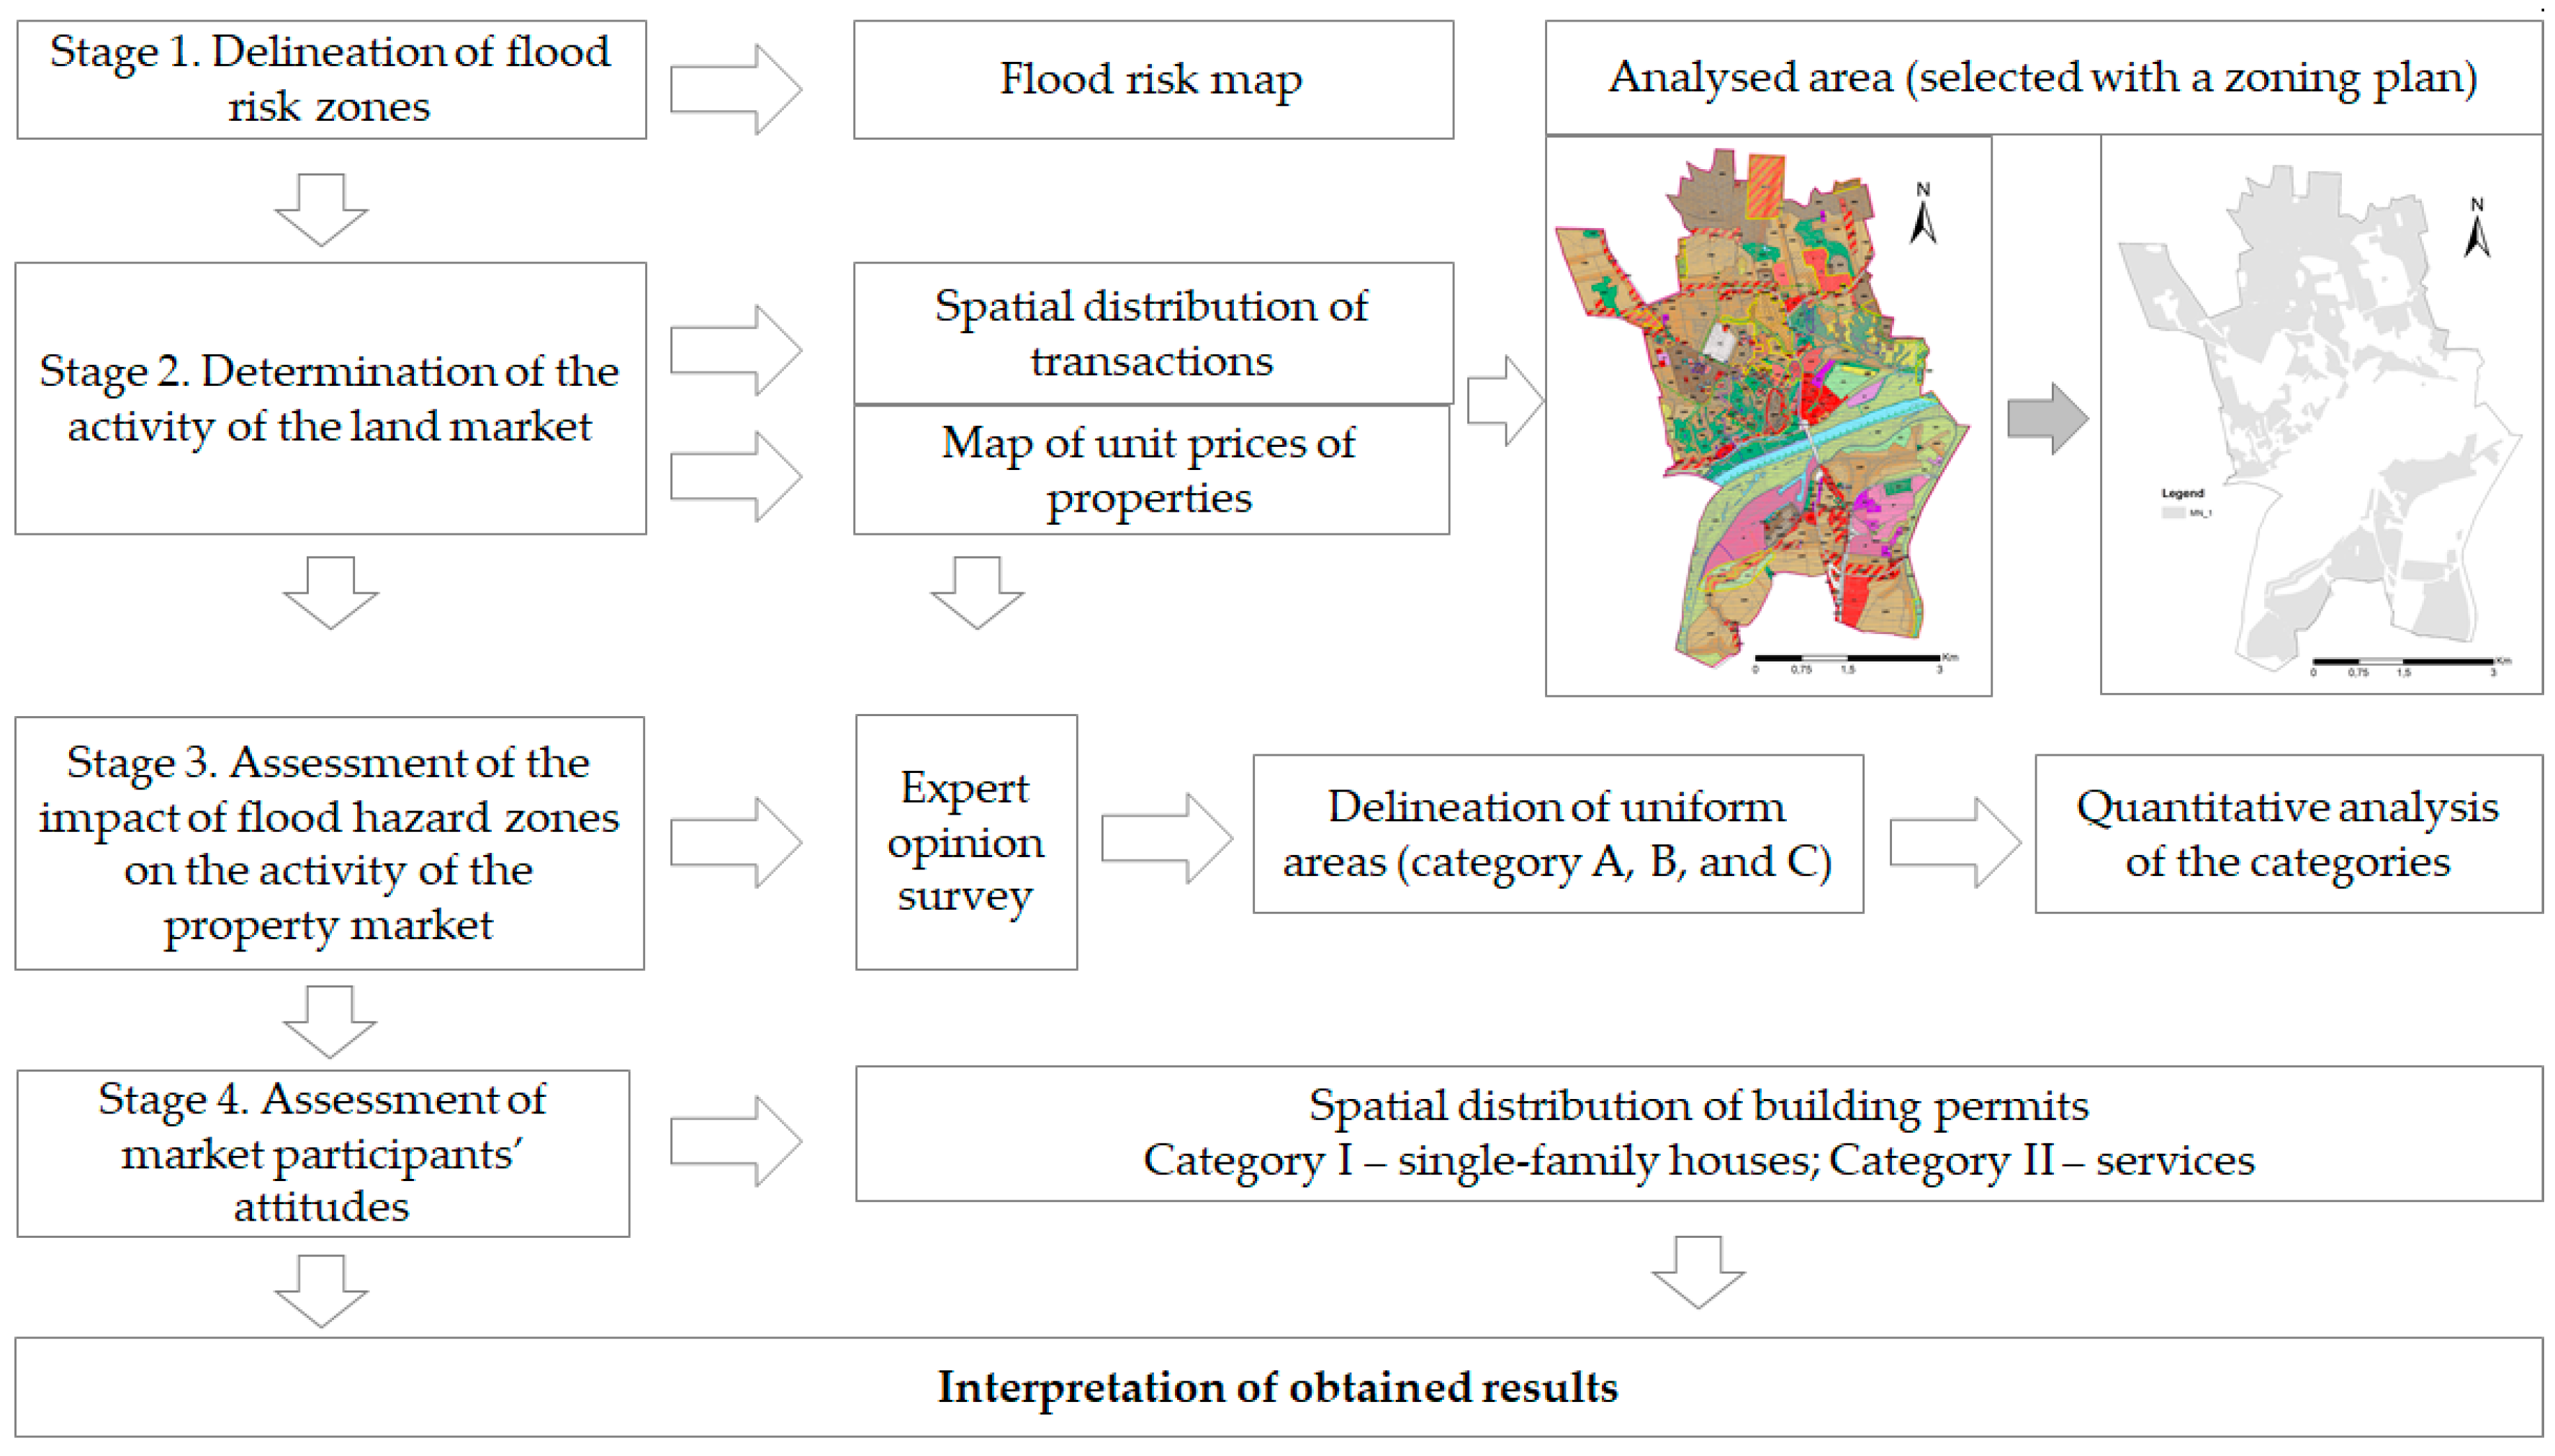
2.2. Research Methodology

The article shows the integrated results. The historical-statistical method, as well as the GIS spatial analysis (graphical and analytical) of hydrological risk maps, were used to analyse the real estate market in Sandomierz. The hedonic pricing price analysis, which is a widely used method to estimate the indirect flood risks [10], requires a very large sample of transactions in land properties. It is impossible to carry out such an analysis for smaller areas. The research on the town of Sandomierz was thus based on spatial analyses using GIS methods and technology, including Kernel Density Estimation (KDE), Inverse Distance Weighting (IDW), quantitative methods, and hierarchical linear modelling (HLM). Kernel Density Estimation (KDE) is a widely-used nonparametric method for density estimation. According to Cellmer et al. [33], the results of a spatial analysis of market processes, with their specific spatial intensity, are crucial for understanding the conditions of local property markets. They can be presented on a map with such information as the activity of the market expressed as a number of transactions. Kernel estimation can be used to determine the density. It facilitates taking spatial resolution into account. Both the Inverse Distance Weighting method and kriging are widely applied in spatial variation analyses of market pricing. Morillo et al. [34] noted that while both interpolators produced similar results, IDW turned out to be better at predicting variation in “unit prices”.
Hierarchical linear modelling (HLM) is a particular regression model designed to consider a hierarchical or nested structure of data. HLM is also known as the multi-level model, the linear mixed-effects model, or the covariance components model [35,36]. From a conceptual perspective, the hierarchical linear model (HLM) is a set of simultaneous equations describing dependent variables on consecutive levels of the hierarchy, which can be expressed as follows for a two-tier model [37,38]:
Y i j = β 0 j + β 1 j X i j + ε i j
β 0 j = γ 00 + γ 01 Z j + u 0 j ,   β 1 j = γ 10 + γ 11 Z j + u 1 j
ε i j ~ N ( 0 ,   σ ε 2 ) ,     u 0 j ~ N ( 0 ,   σ u 0 2 ) ,     u 1 j ~ N ( 0 ,   σ u 1 2 )
or, after substitution and rearrangement, as follows:
Y i j = γ 00 + γ 10 X i j + γ 01 Z j + γ 11 Z j X i j + u 1 j X i j + u 0 j + ε i j
where γ 00 is the global mean, γ 10 ,   γ 01 ,   γ 11 is the regression coefficient, X i j is the value of an individual-tier variable X for the ith object from the jth group, Z j is the value of a group-tier variable Z for the jth group, and expression Y i j = γ 00 + γ 10 X i j + γ 01 Z j + γ 11 Z j X i j is the intercept of the equation, while expression u 1 j X i j + u 0 j + ε i j is the random component.
Parameters of the model are estimated with the Maximum Likelihood Estimation method or optionally with the RML method (Restricted Maximum Likelihood). Parameter significance γ is assessed with the Wald chi-square test or the likelihood-ratio test [39]. Details of the methods for estimating and testing mixed models are available in the literature (such as [37,39]).
The study was divided into the following stages. At Stage 1, based on flood hazard maps, the graphical and analytical method was used to identify areas with a specific probability of flood occurrence. Here, floodplains with different return periods were delineated (high—ten-year flood, Q10%; medium—hundred-year flood, Q1%; and low—five-hundred-year flood, Q0.2%) and areas at risk of being flooded in the event of a breach of flood embankments with a probability of Q1% were pinpointed.
At Stage 2, the level of activity of the residential land market in the area of the town of Sandomierz was determined. The analysis was based on transactions recorded in the local land property market from 2009 to 2019. Kernel Density Estimation was applied to assess the activity of the property market, expressed as the number of transactions in spatial terms. Kernel Density Estimation, devised for estimating a smooth empirical probability function [40], is now a commonly applied spatial analysis technique to transform a geographically distributed set of points into a density surface in a GIS environment [41,42].
The authors decided that the spatial density of transactions should be considered only for the part of the town with low-rise residential buildings. The spatial distribution of low-rise residential buildings was determined with an urban planning document, Zoning Conditions and Directions for the Town of Sandomierz (Resolution of the Town Council No. XXII/236/2012, as amended) (Figure 2). The authors delineated potential low-intensity residential areas.
A map of unit prices of land property designated for housing developments was compiled with the Inverse Distance Weighting (IDW) method. It is one of the most frequently used deterministic models in spatial interpolation. Its general idea is based on the assumption that the attribute value of an unsampled point is a weighted average of known values in its neighbourhood [43]. This involves the process of assigning values to unknown points using values from a scattered set of known points. The value at the unknown point is a weighted sum of the values of N known points [44].
Stage 3 was to assess the impact of flood hazard zones on the activity of the property market in the town. The first step involved the delineation of uniform town zones in Sandomierz (categories A, B, and C) with an expert opinion survey. The next investigated aspect was the attitude of potential buyers. The authors looked into the level of interest in the area free from flood risk and parts of the town at risk of flooding. An indirect index of the number of issued building permits was employed. The selection of locations of residential projects is the primary gauge of the attitude of market participants.

3. Results

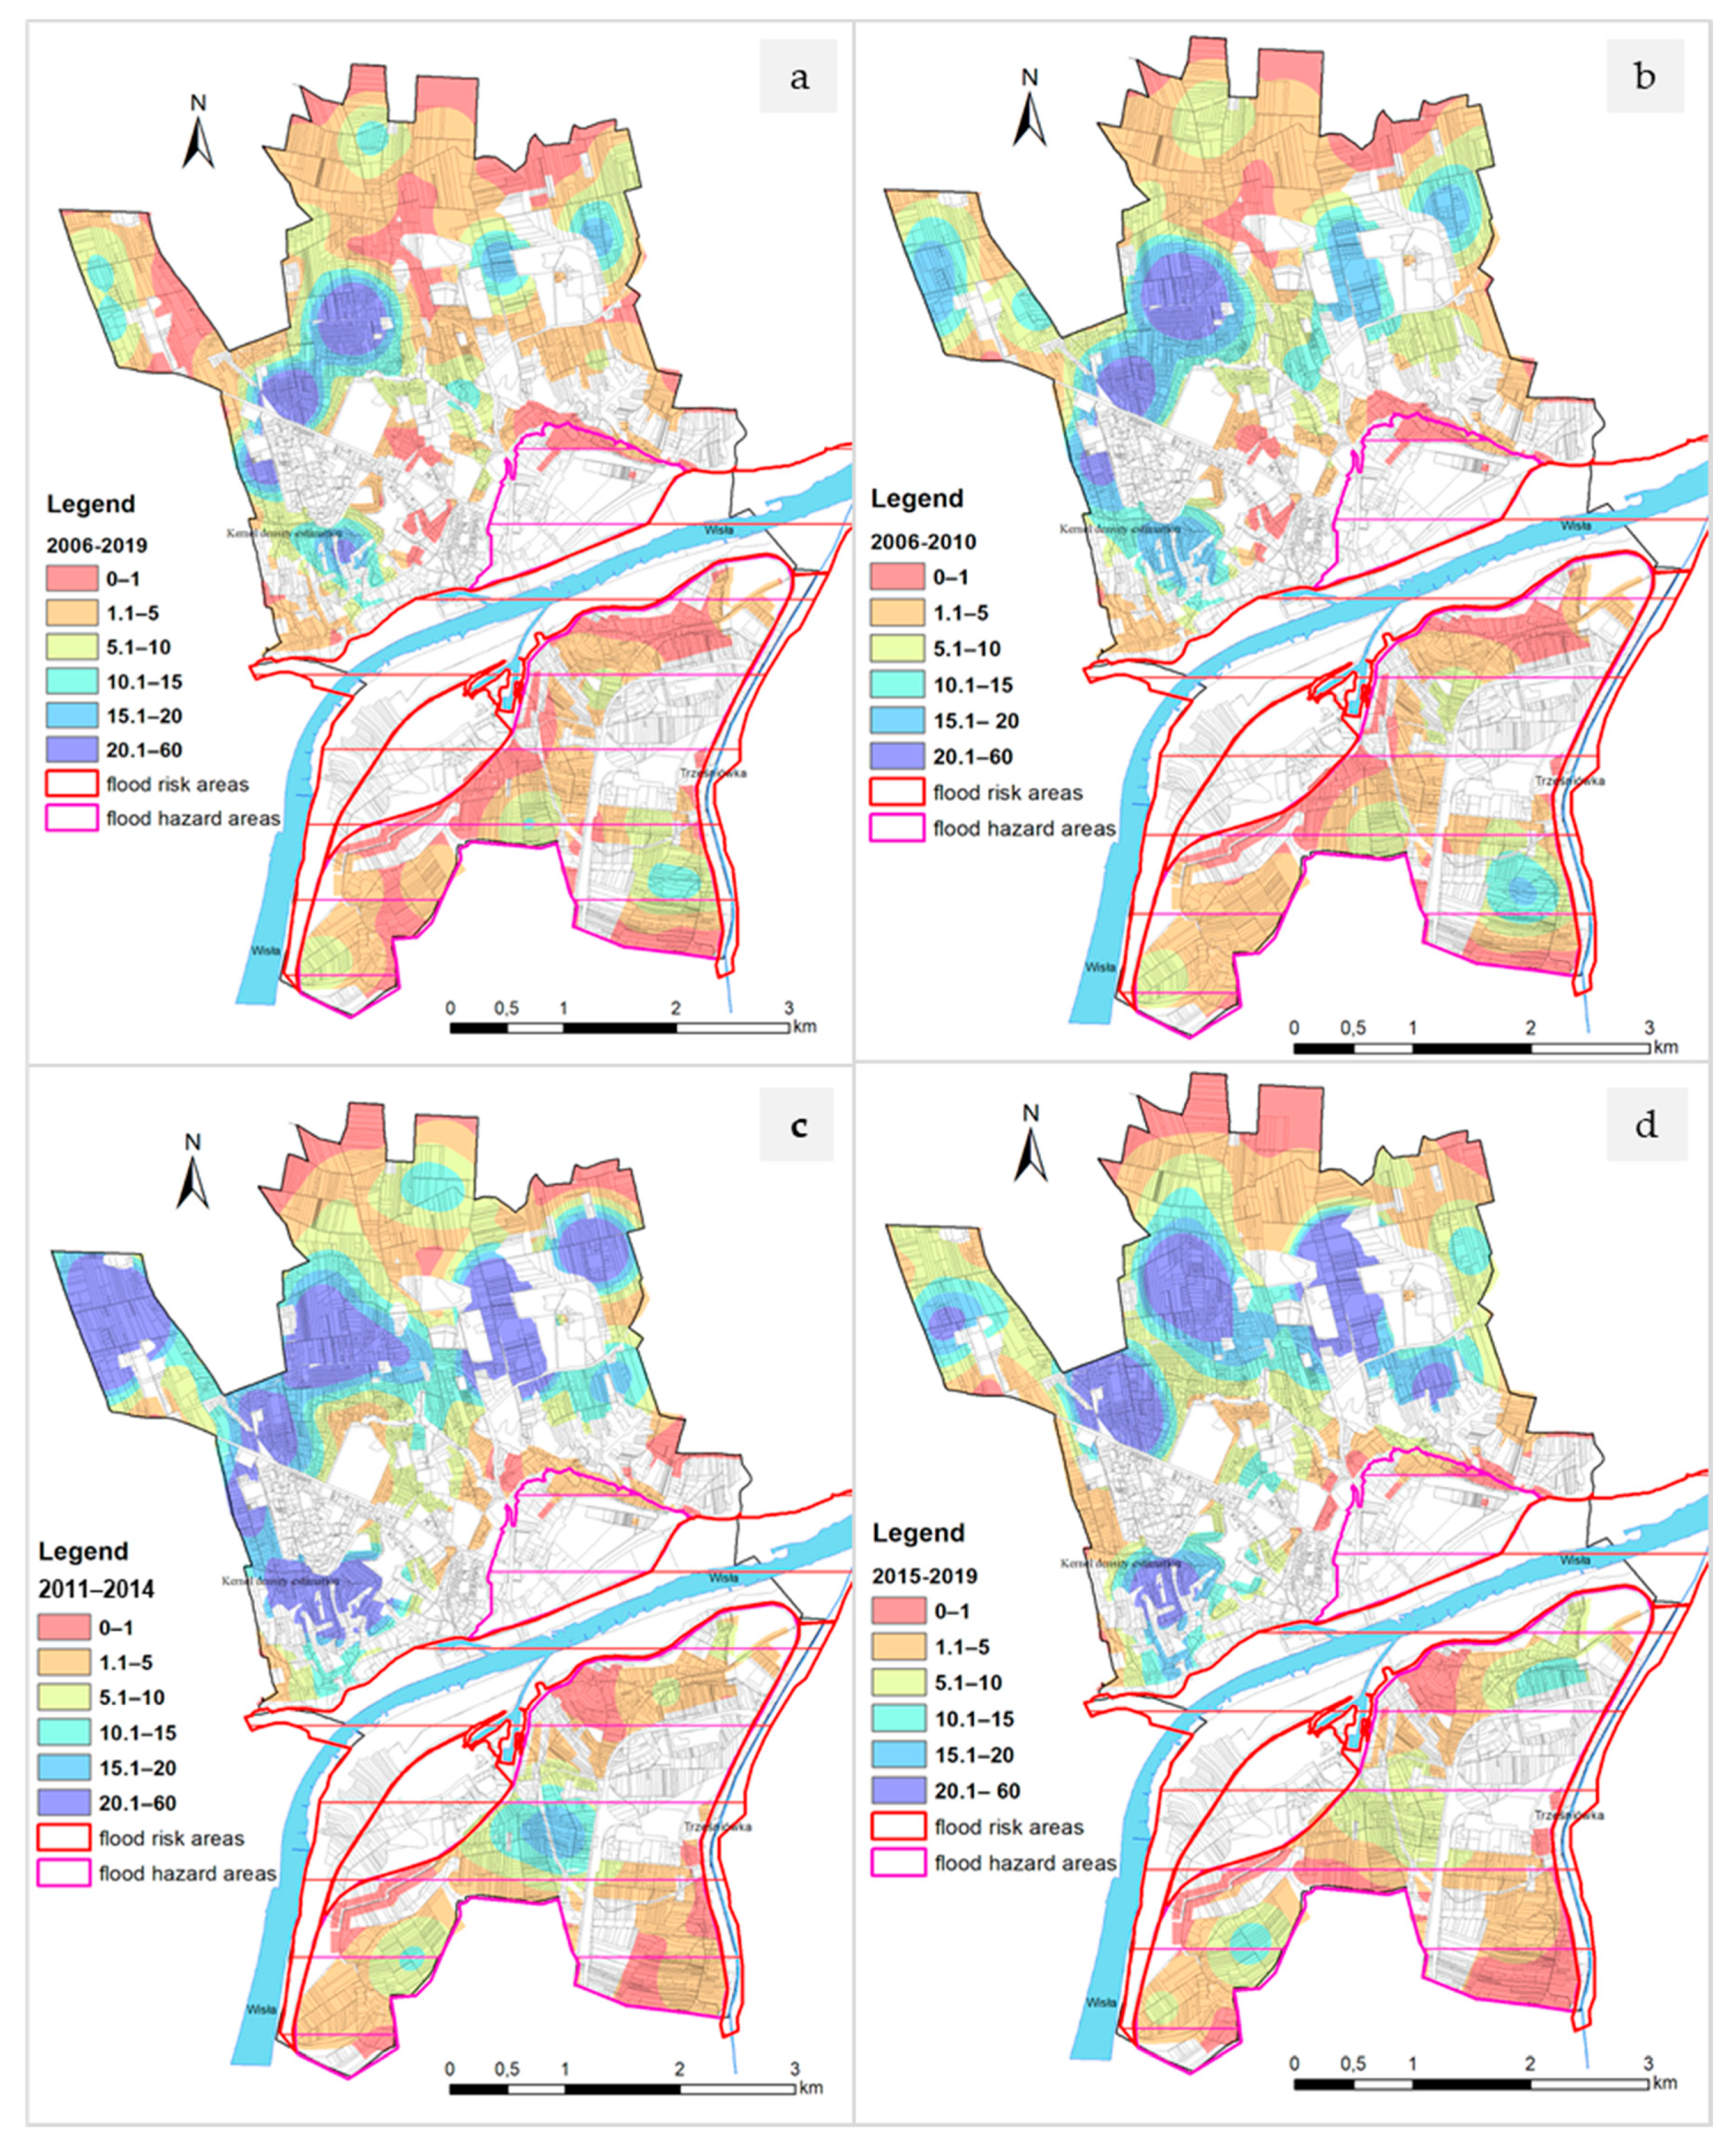
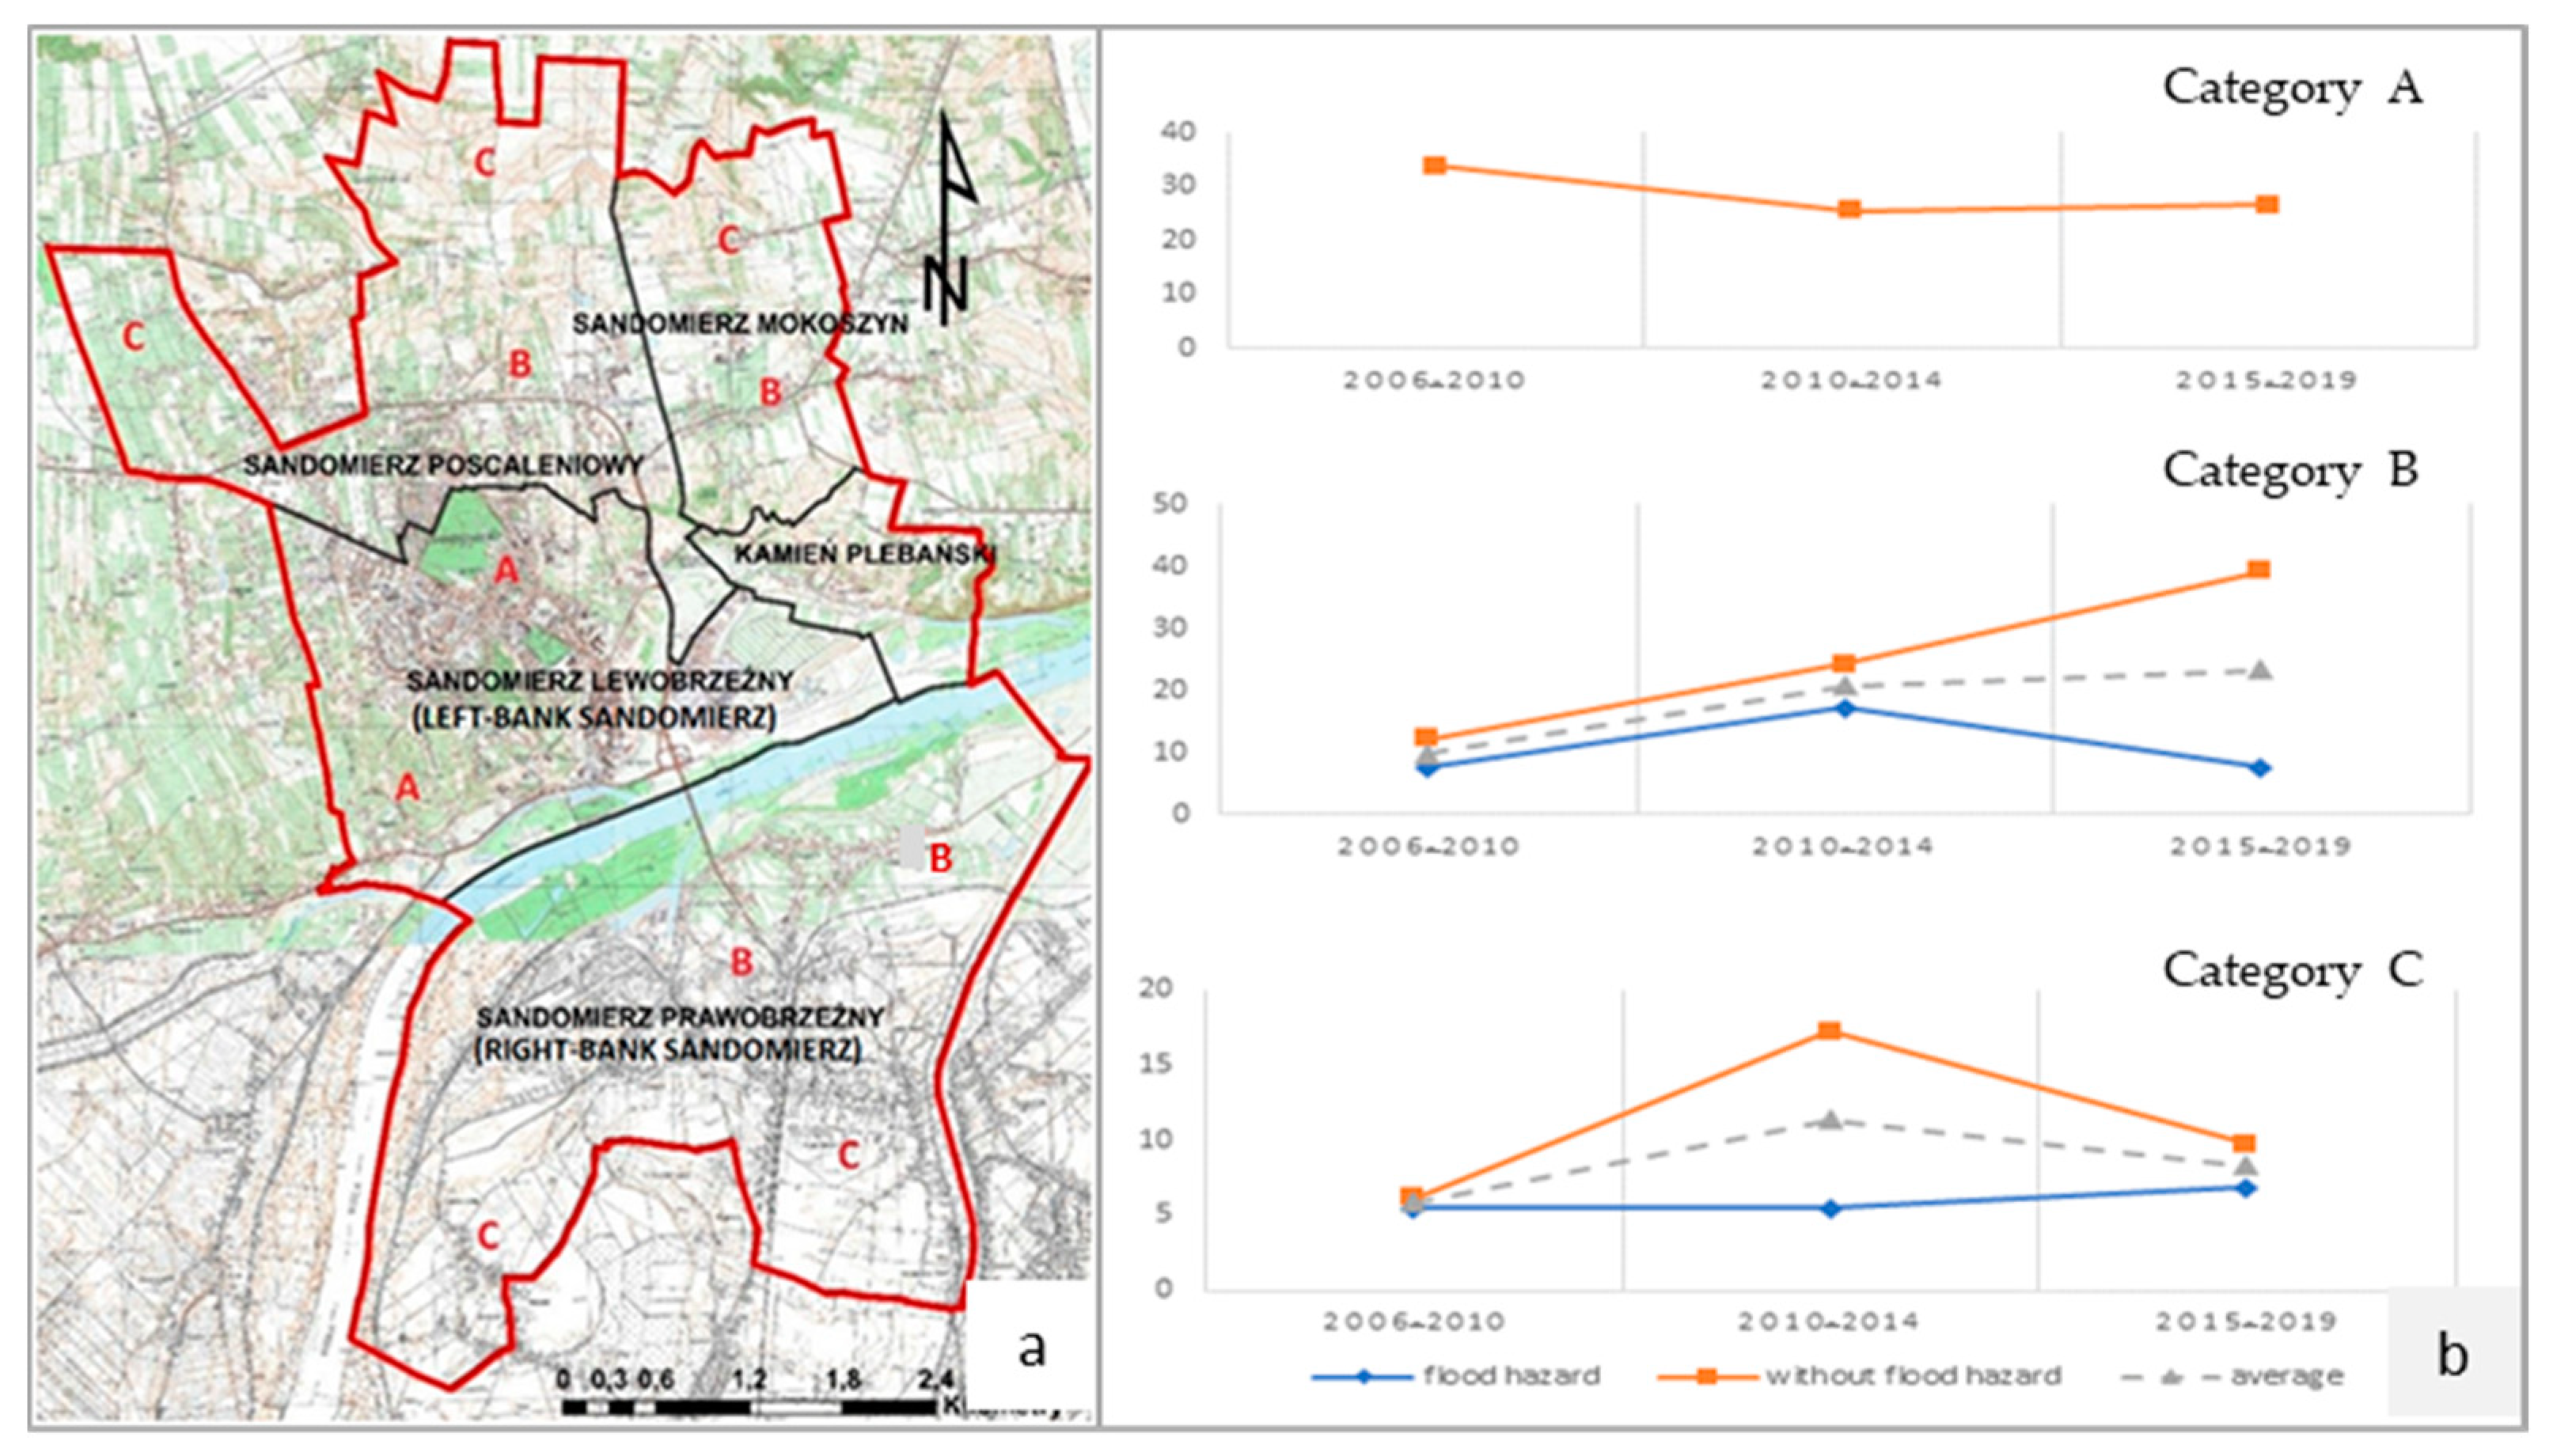
3.1. Stage 1: Identification and Location of Flood Hazard Areas in the Town of Sandomierz

Flood maps are indispensable sources of information about hazards, vulnerabilities, and risks in a particular area [45]. Flood hazard maps include crucial information for flood management, such as flood extent, water levels, and flow velocity, that provide the basis for flood risk management plans [16]. The present study determined the spatial range of the flood based on flood risk maps compiled by the National Water Management Authority. The town of Sandomierz was represented on four sheets of 1:10,000 flood hazard maps with markings, as in Figure 3 (M-34-44-C-d-4, M-34-44-D-c-3, M-34-56-A-b-2, M-34-56-B-a-1). Flood hazard areas with the probabilities of Q10%, Q1%, and Q0.2% have the same surface area for the town of Sandomierz (Figure 3).

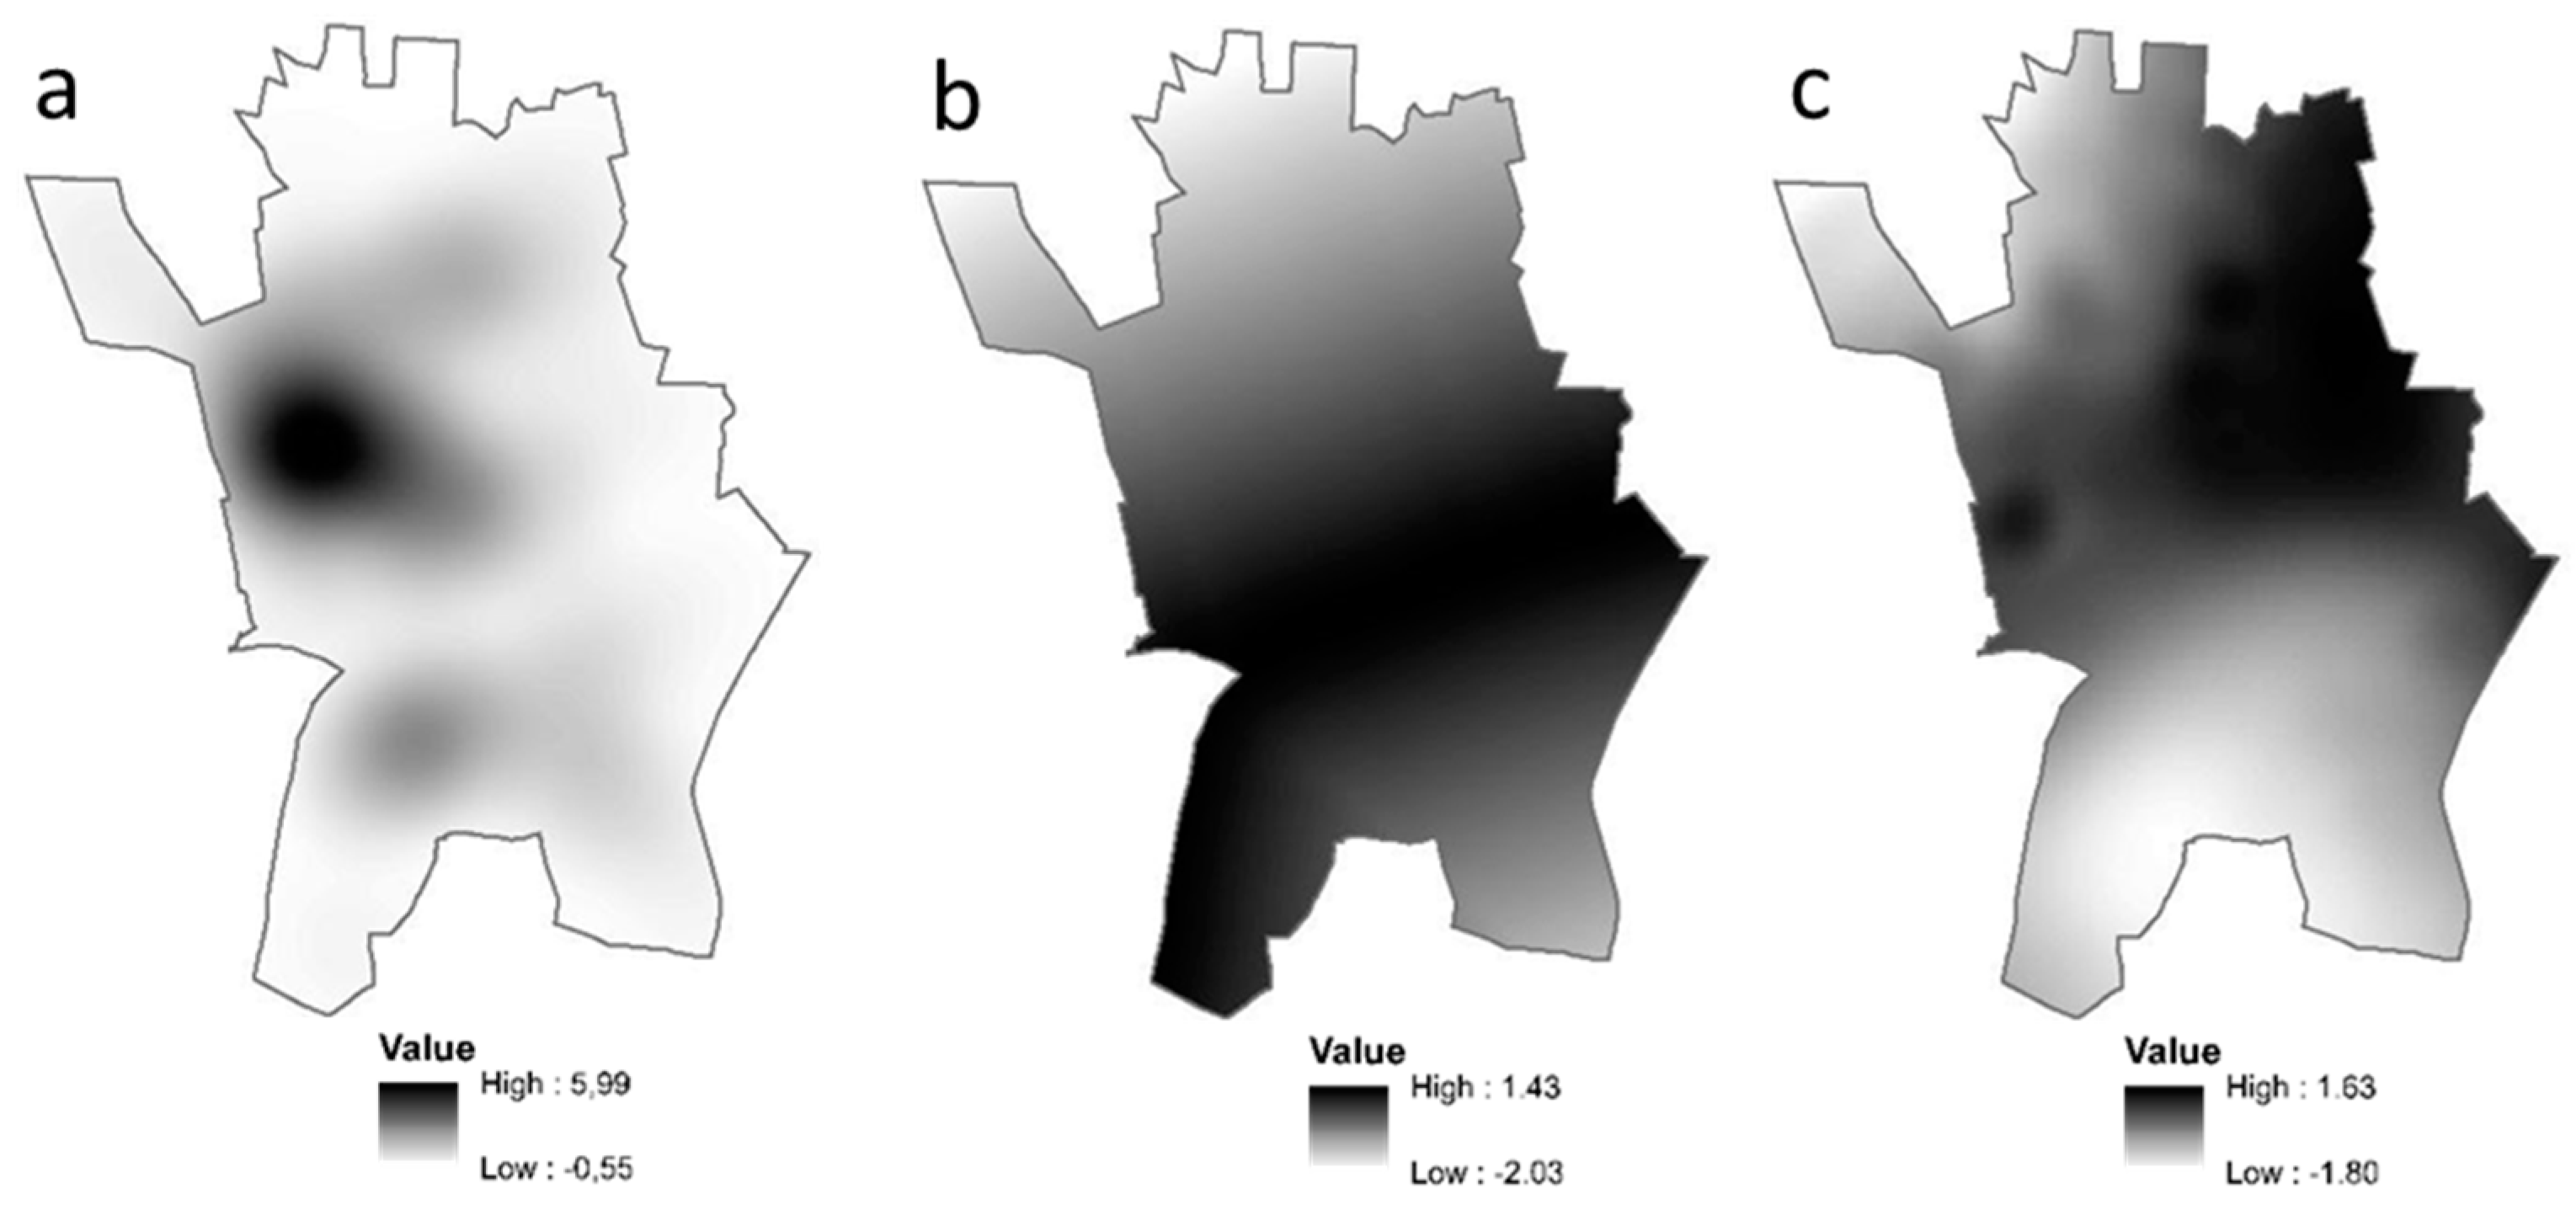
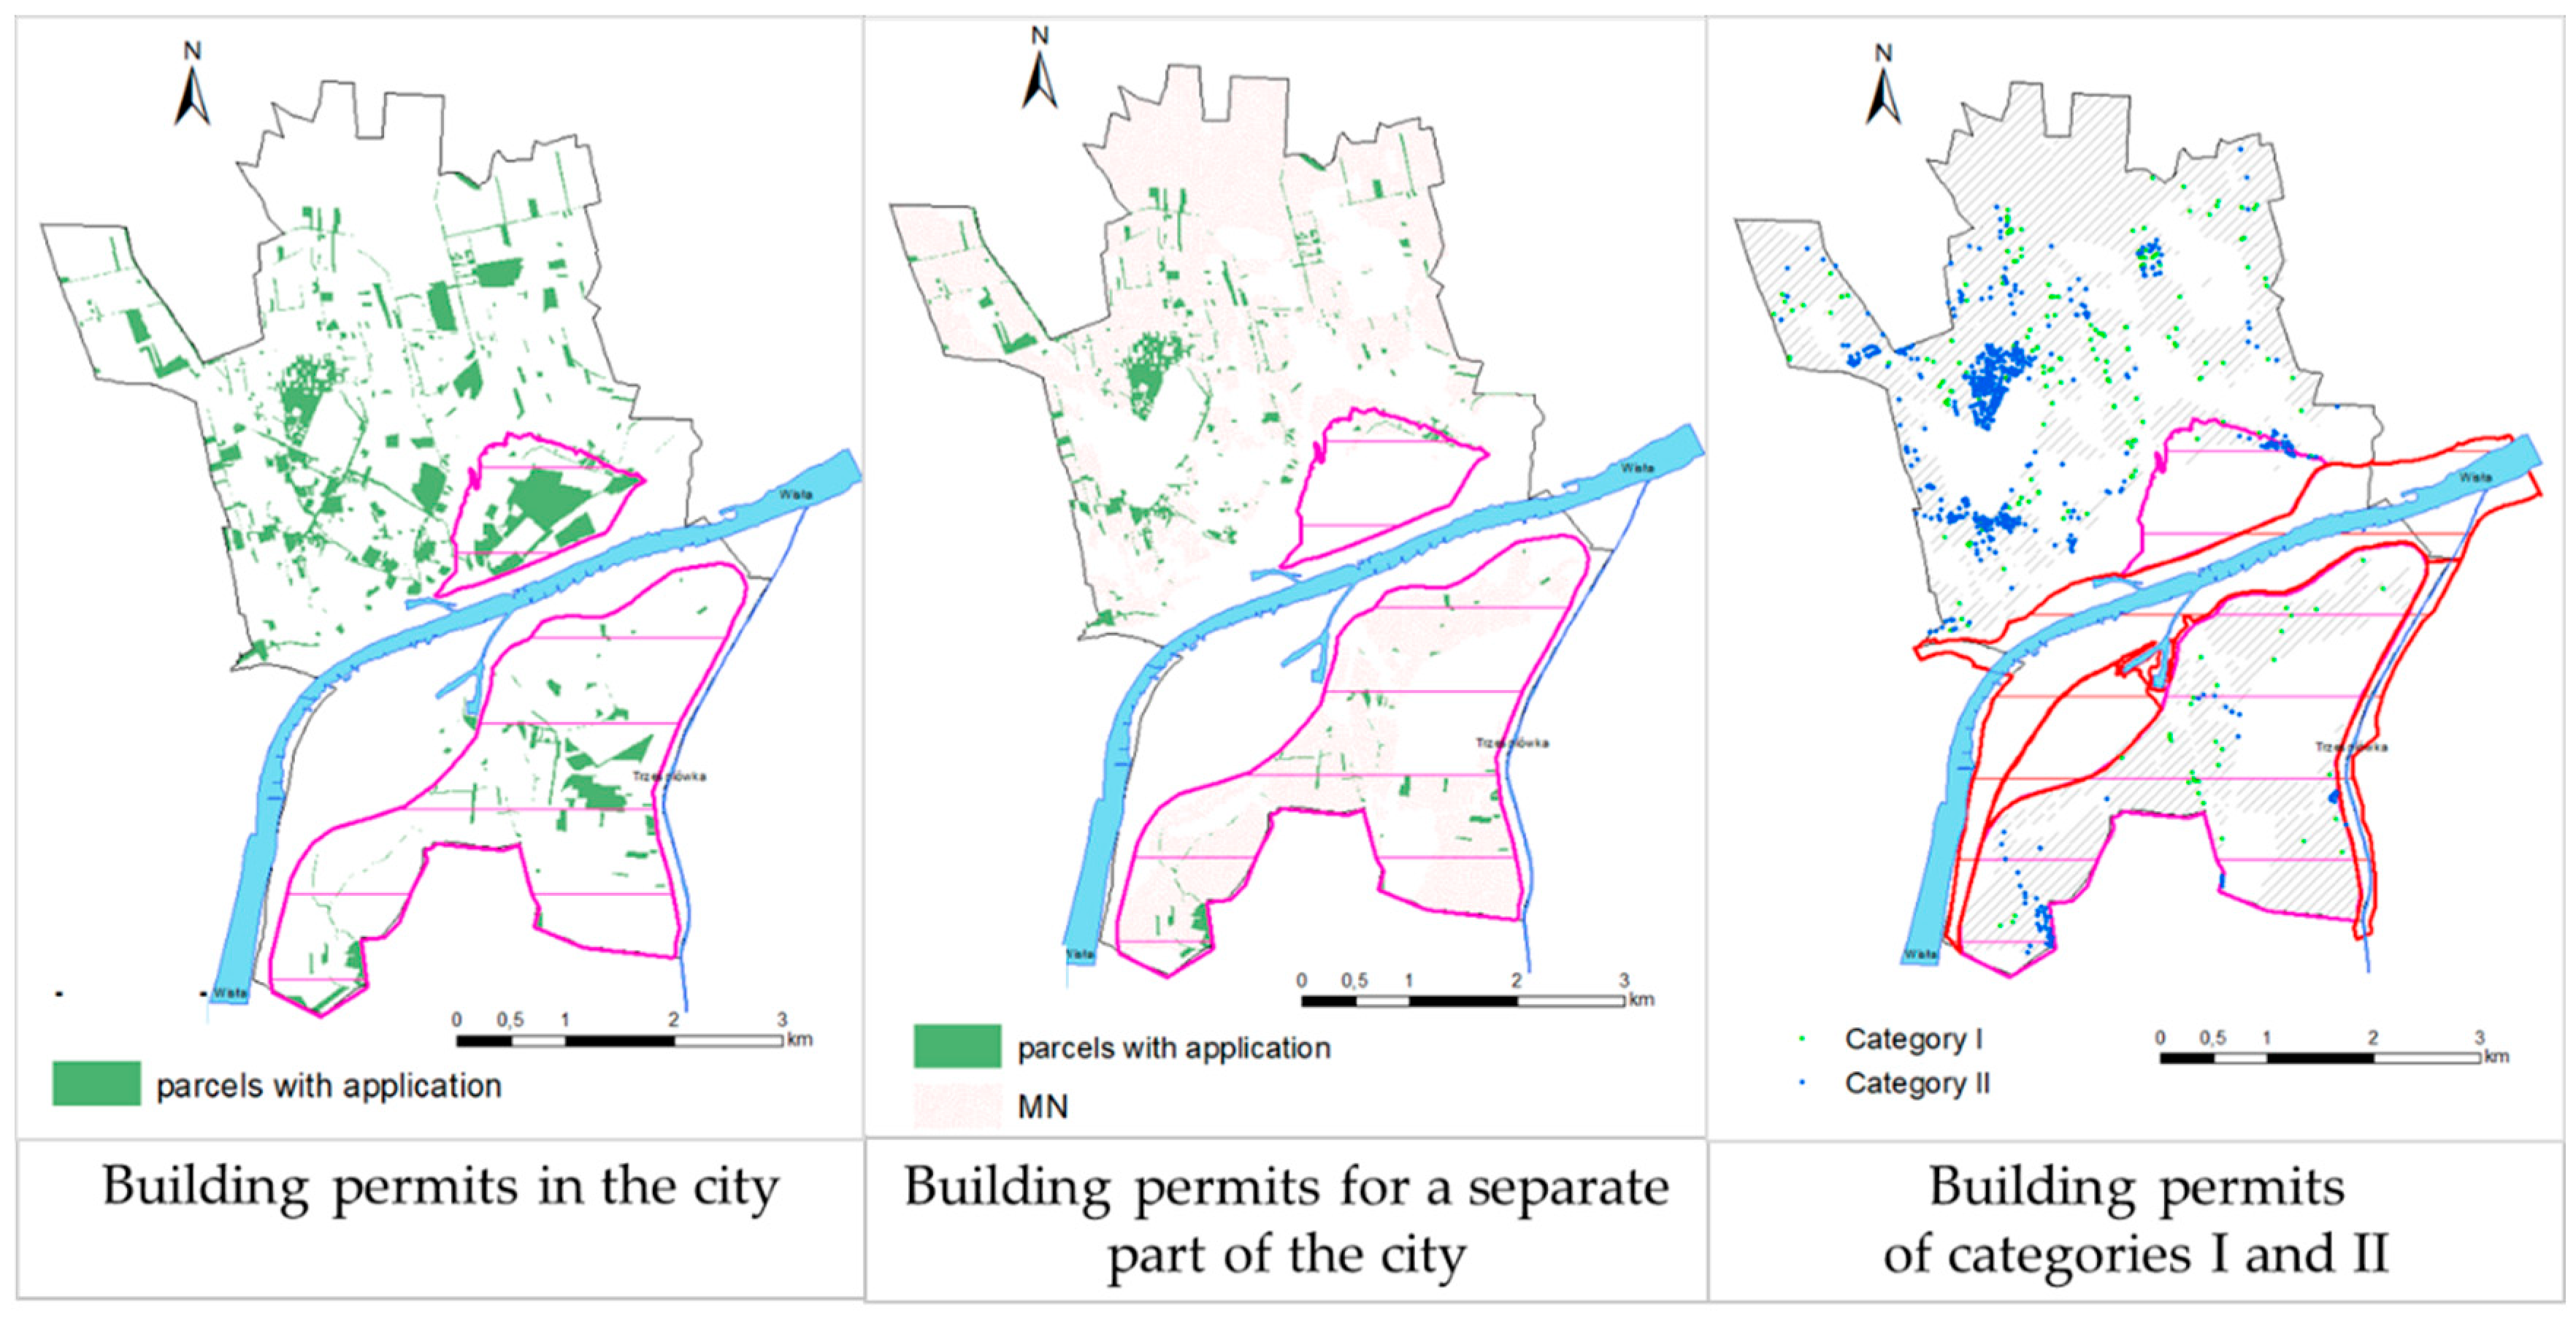
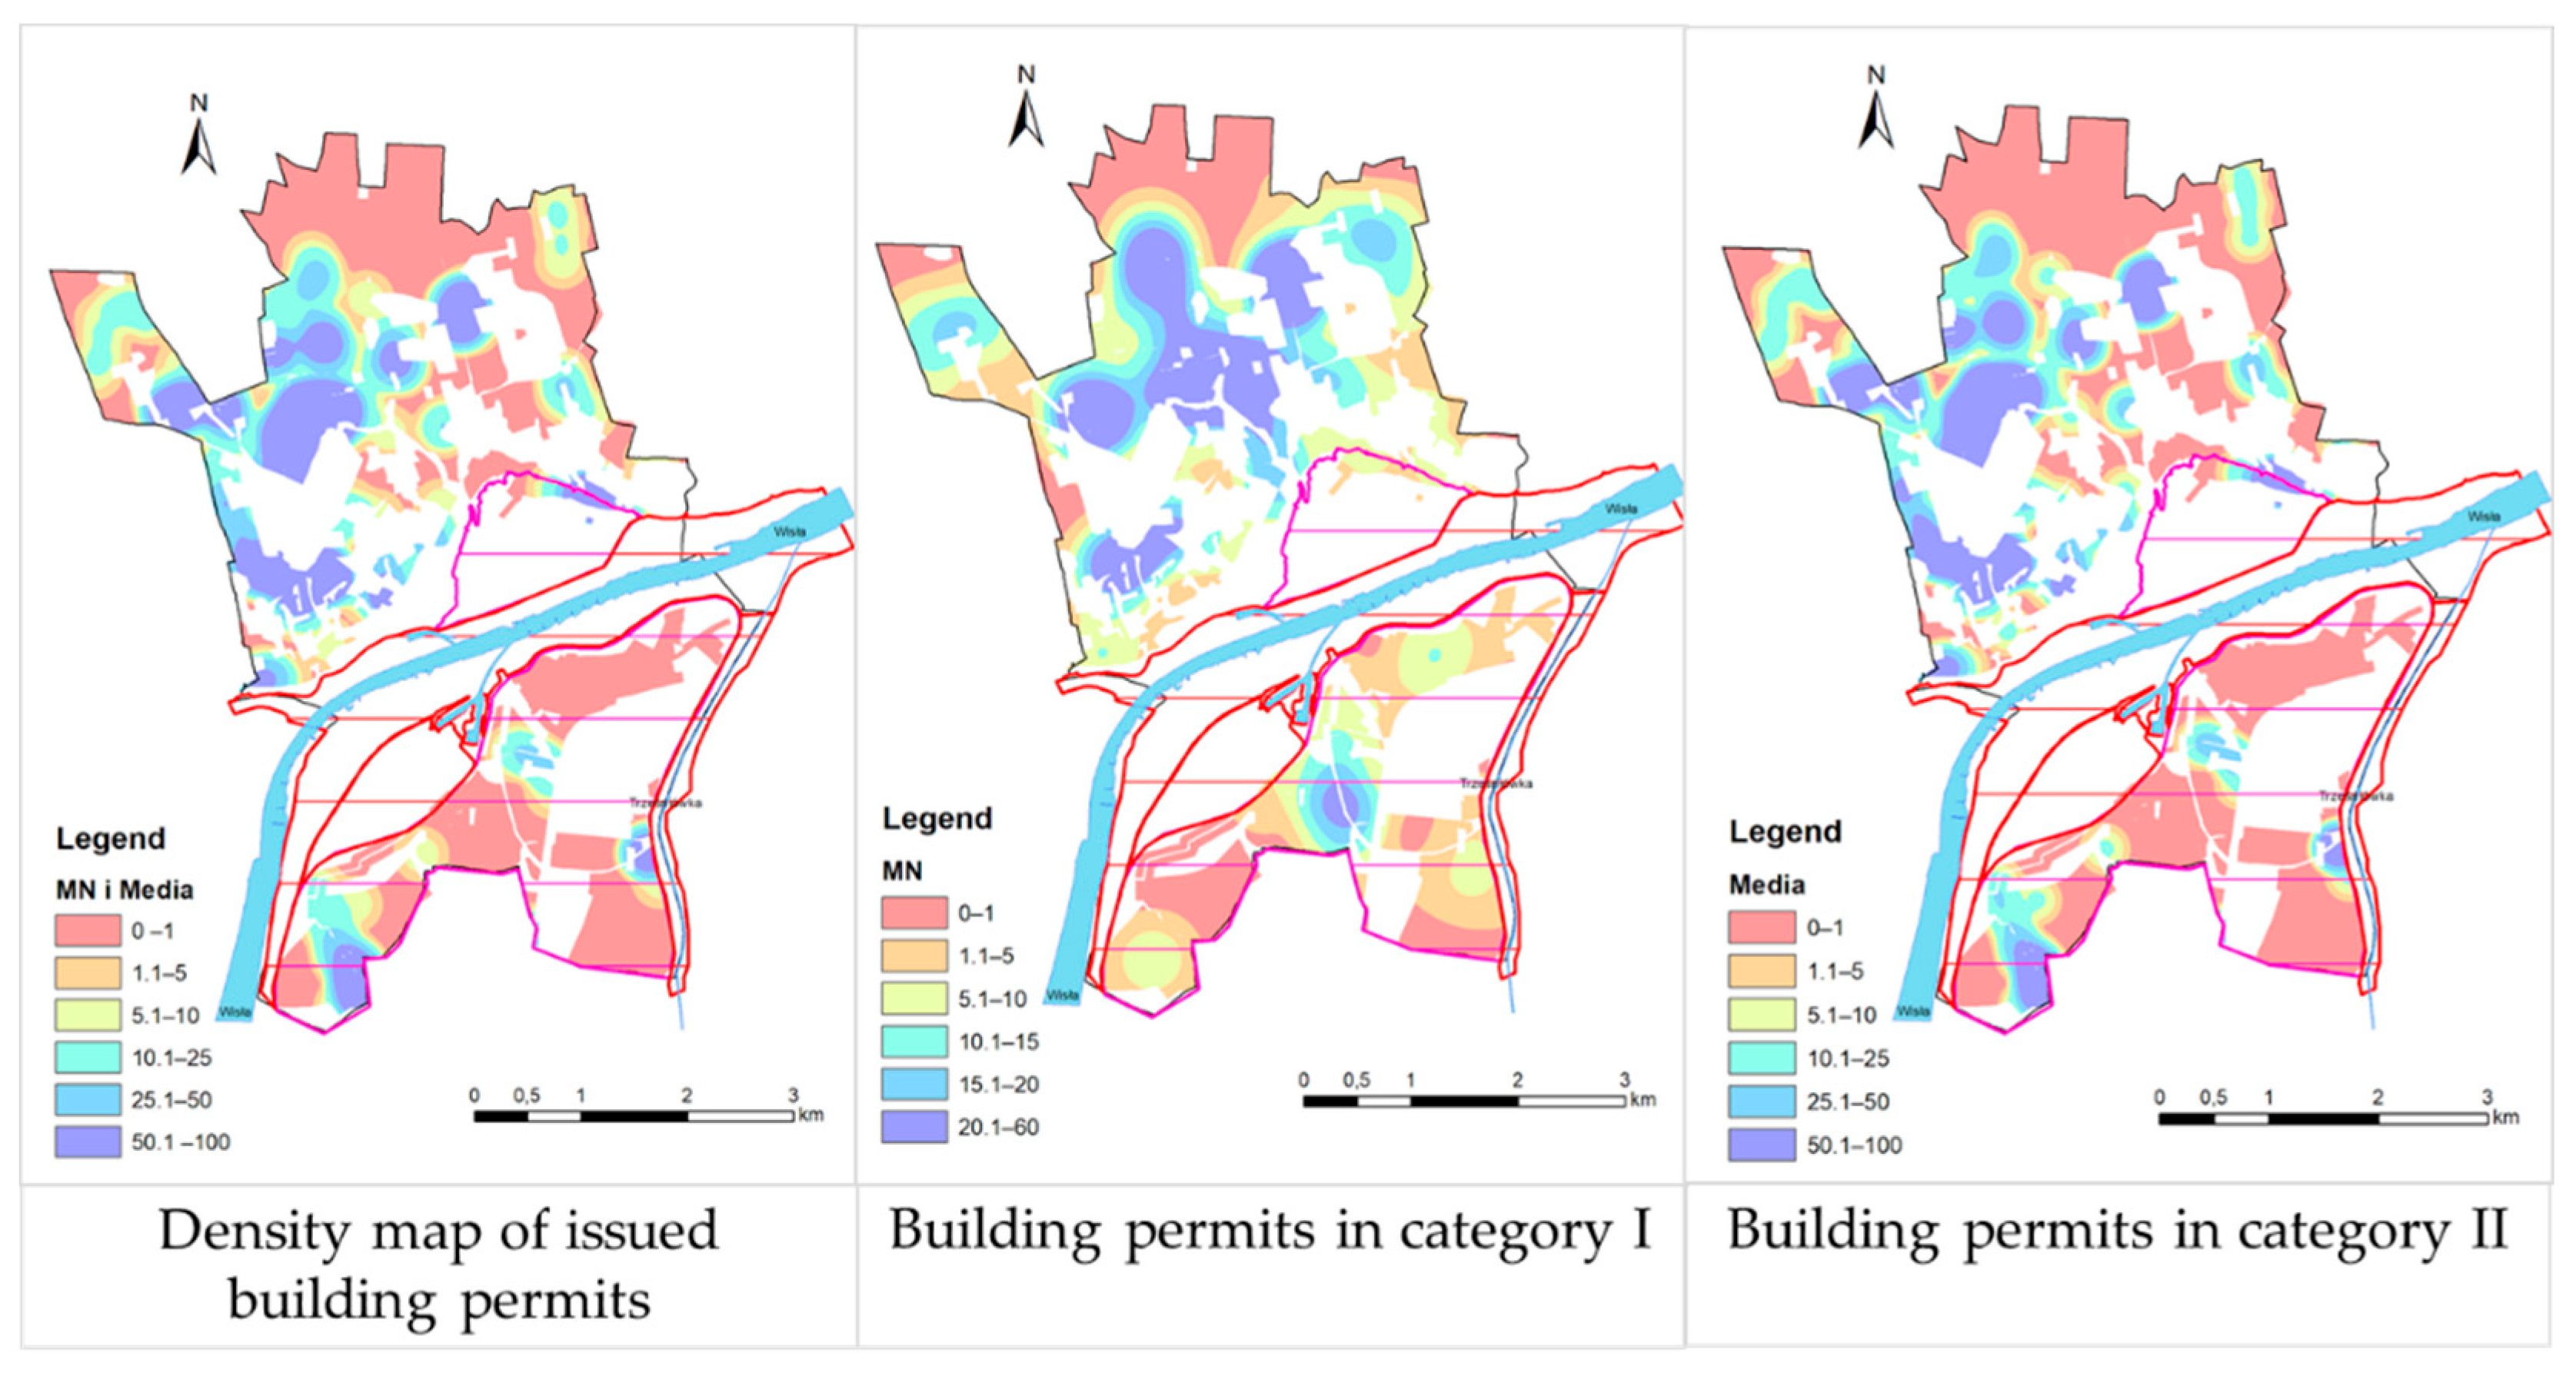
3.2. Stage 2: The Level of Activity in the Market of Land Property Designated for Low-Rise Housing Development in the Town of Sandomierz

The analysis of trade in undeveloped land properties designated for low-rise housing development in Sandomierz was based on materials originating from the Register of Property Prices and Values, provided by the County Office in Sandomierz. The data set included 474 market transactions concluded between 1 January 2006 and 31 December 2019, covering an area of 86.92 ha. A total of 647 plots were sold, with transactions concerning properties comprising from 1 to 11 plots. Most of the transactions concerned properties designated for low-rise housing developments. A total of 339 transactions were included in the analysis. The unit prices of properties designated for low-rise housing development ranged from 0.24 PLN (0.06 USD)/m2 to 504.41 PLN (132.51 USD)/m2. An average surface area per transaction was 0.1997 ha, while the average unit price during the analysed period was 52.58 PLN (13.81 USD)/m2. Most of the sale contracts were executed in the northern, historical part of the town. The smallest number of transactions, 14%, were done in the southern part of the town at risk of flooding. Natural persons made up 99% of the buyers of such properties. The highest density of transactions (the number of transactions per km2) was found in the northern part of the town and reached the level of 60 transactions per km2.
The activity of the market in the investigated intervals (2006–2010, 2010–2014, and 2015–2019) was the highest in the northern part of the town free of flood risk. It was the lowest in the southern part where hazard was identified (Figure 4). Using the transaction data and the Inverse Distance Weighting method, the authors created a map forecasting the unit prices of land properties designated for low-rise housing developments.
The lowest property prices were noted in the southern part of Sandomierz (the district on the right bank) and at the northern edges of the town, at a considerable distance from the centre. The highest prices of land properties were noted in the central part of the town, and they reached up to around PLN 300 (USD 80) per 1 m2. The spatial distribution of the prices was similar for each period, but their values were particularly stable in the southwestern part of the town (Figure 5).

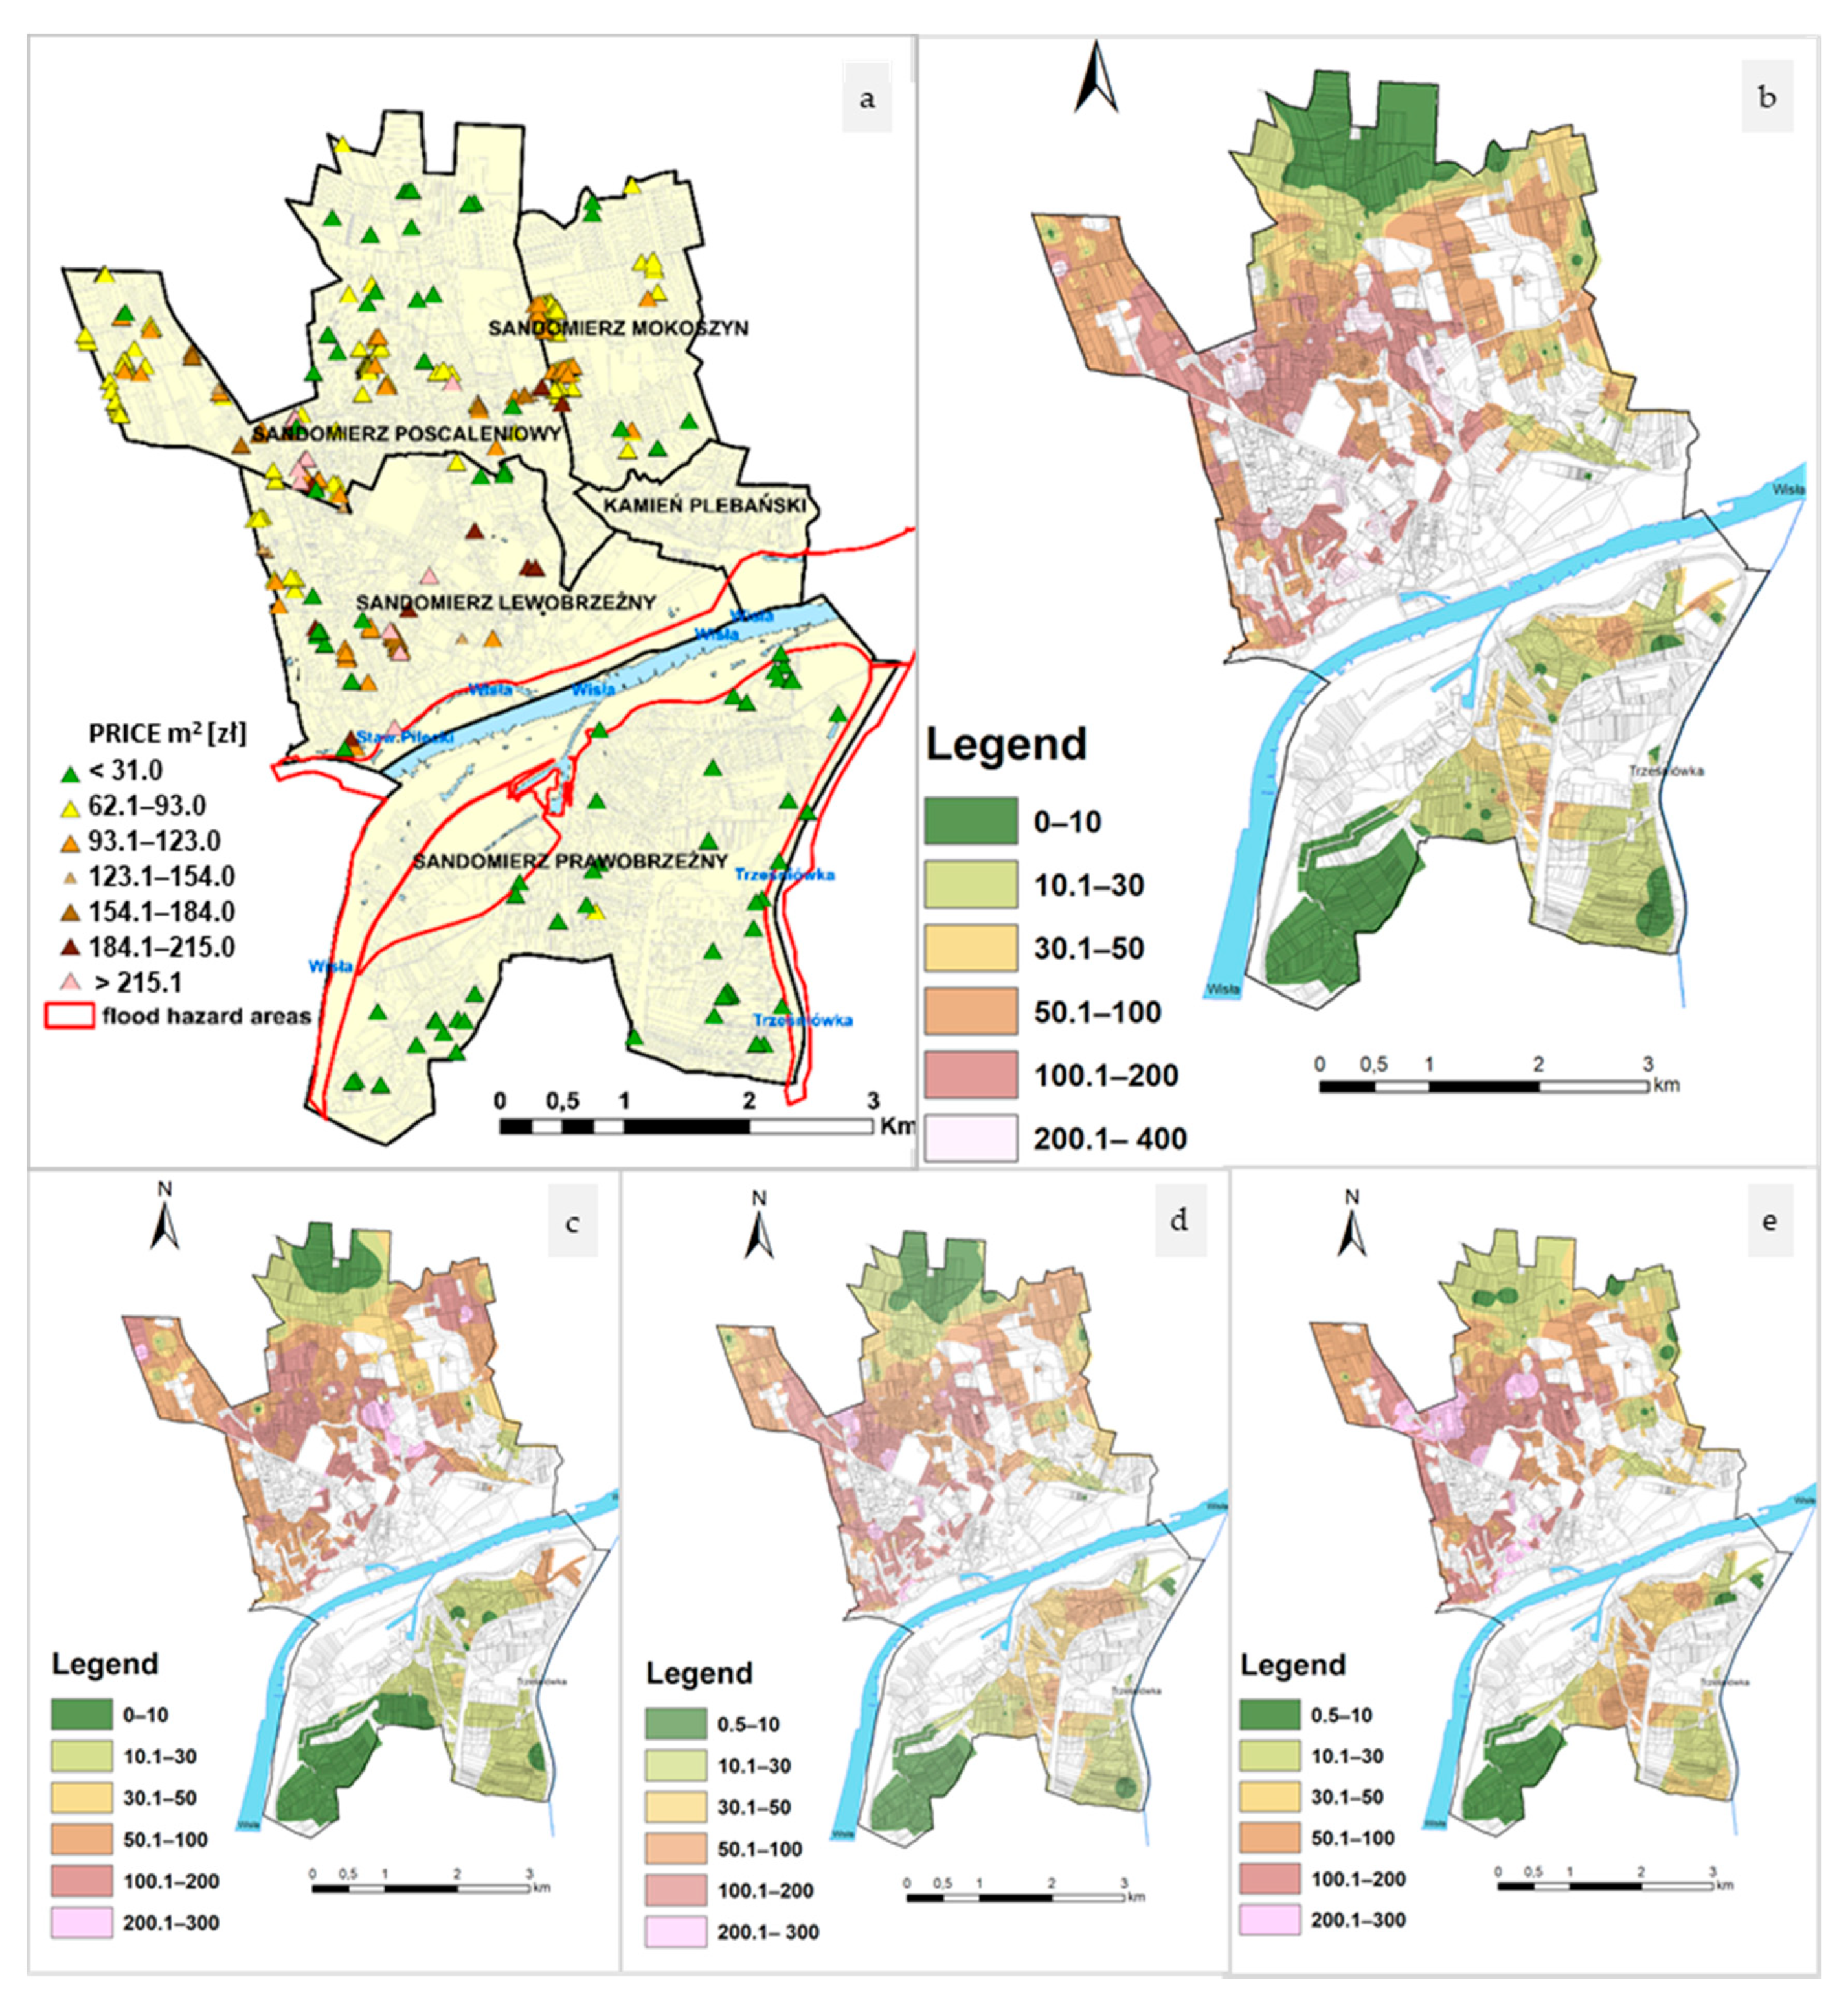
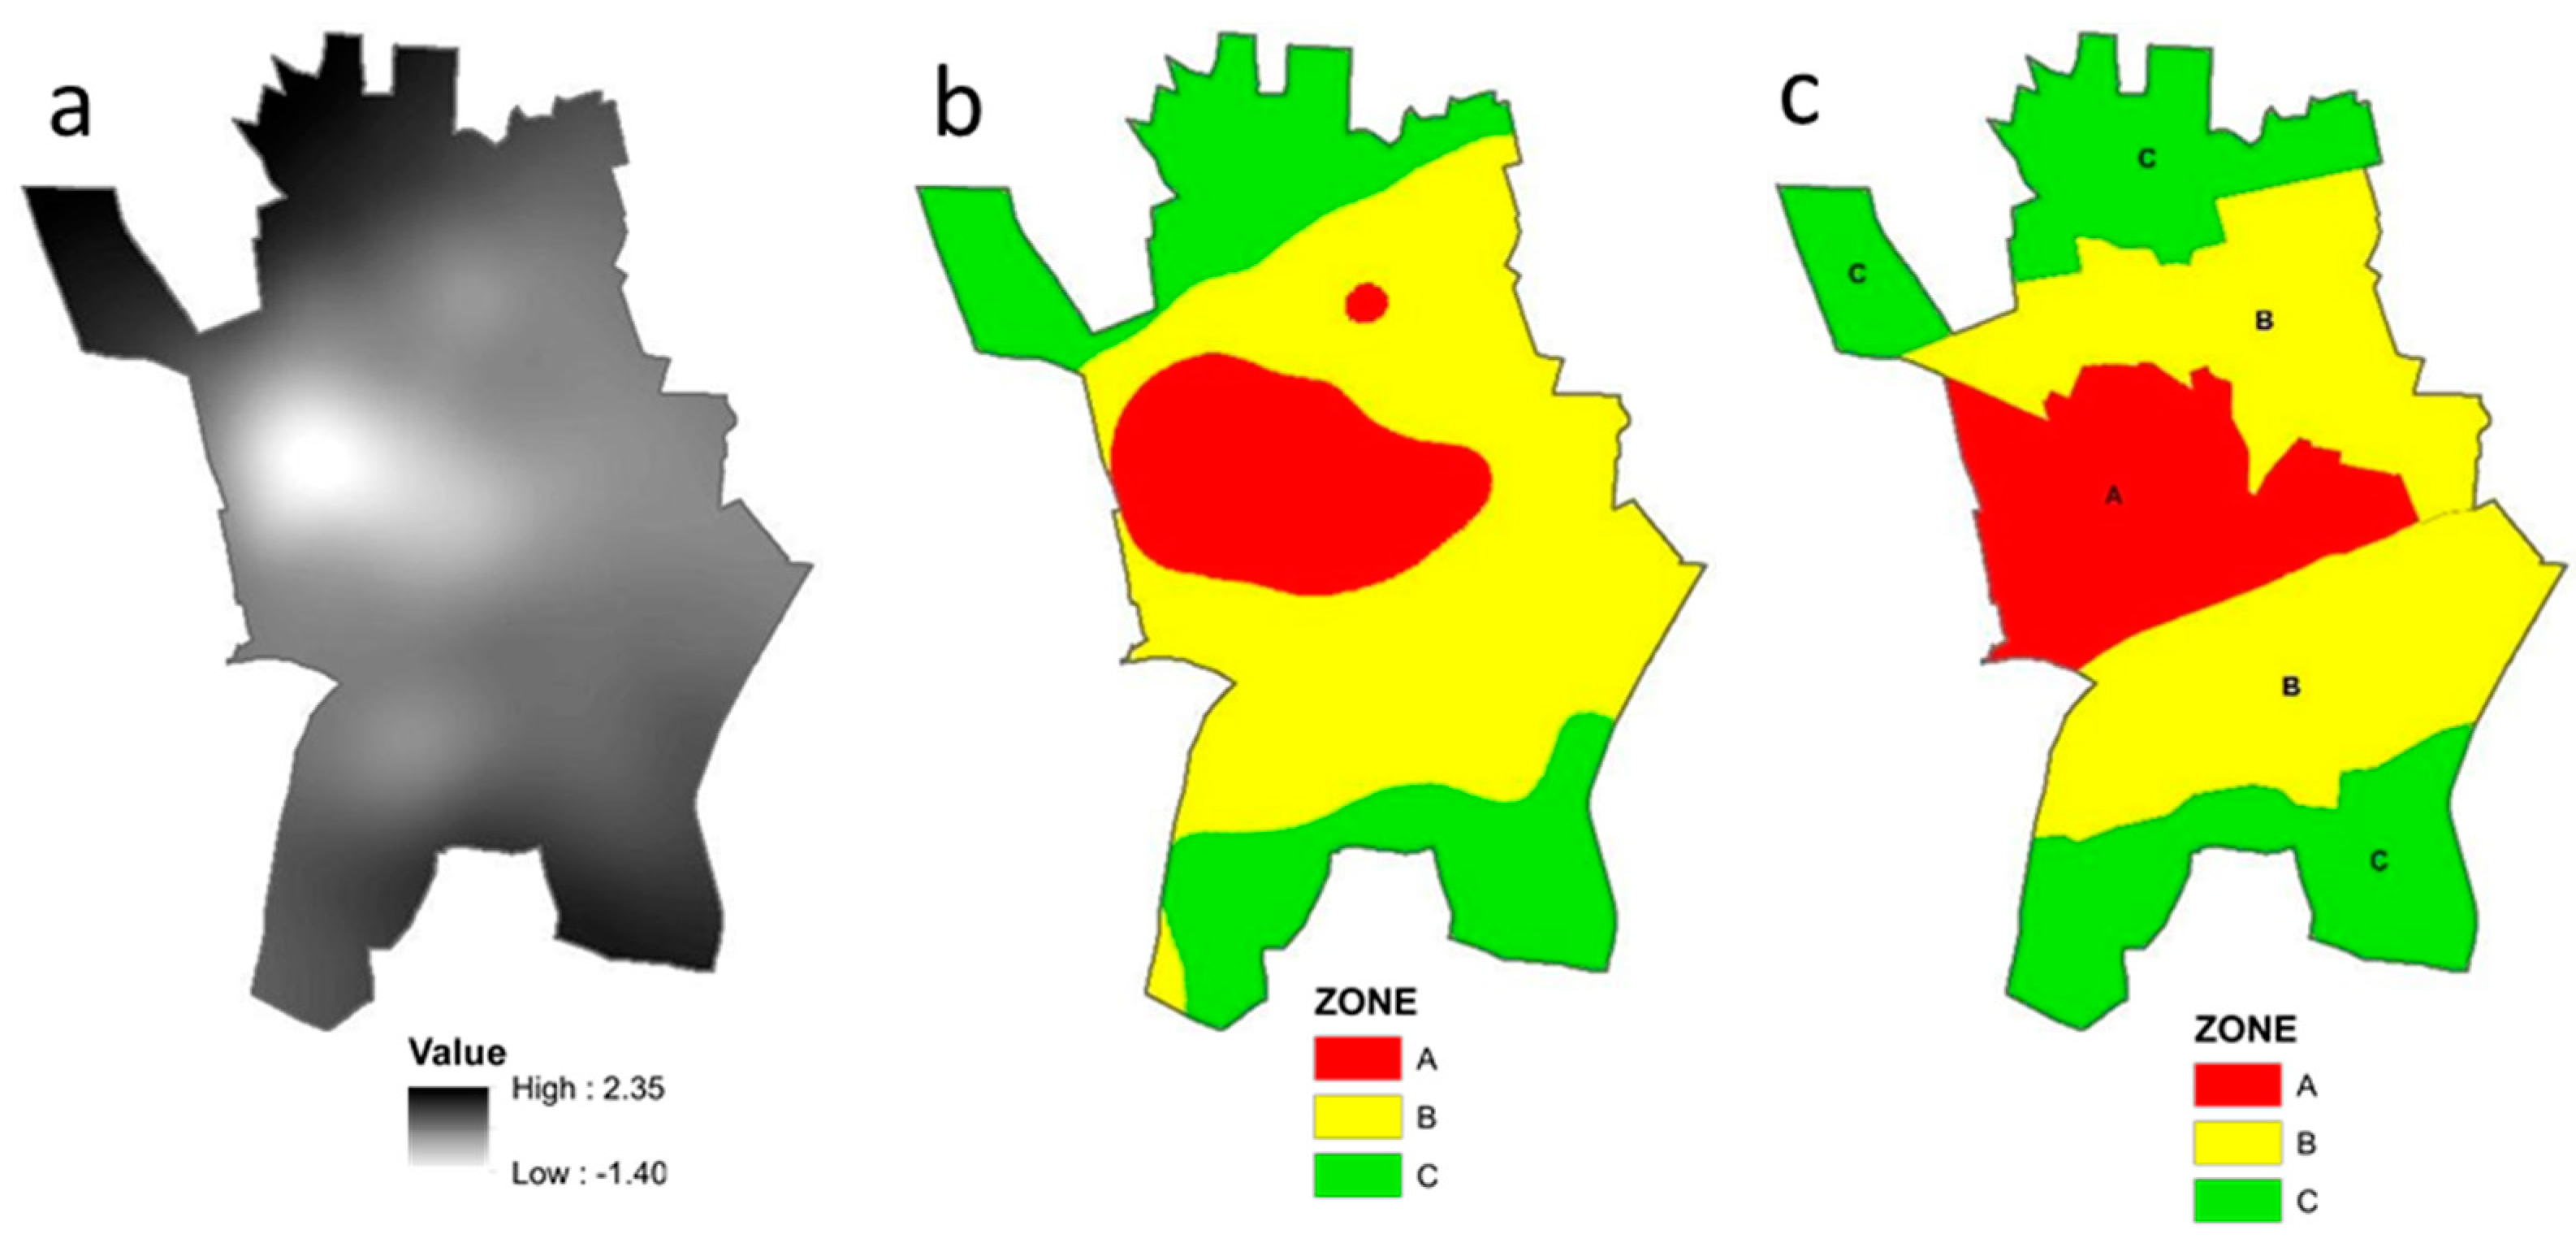
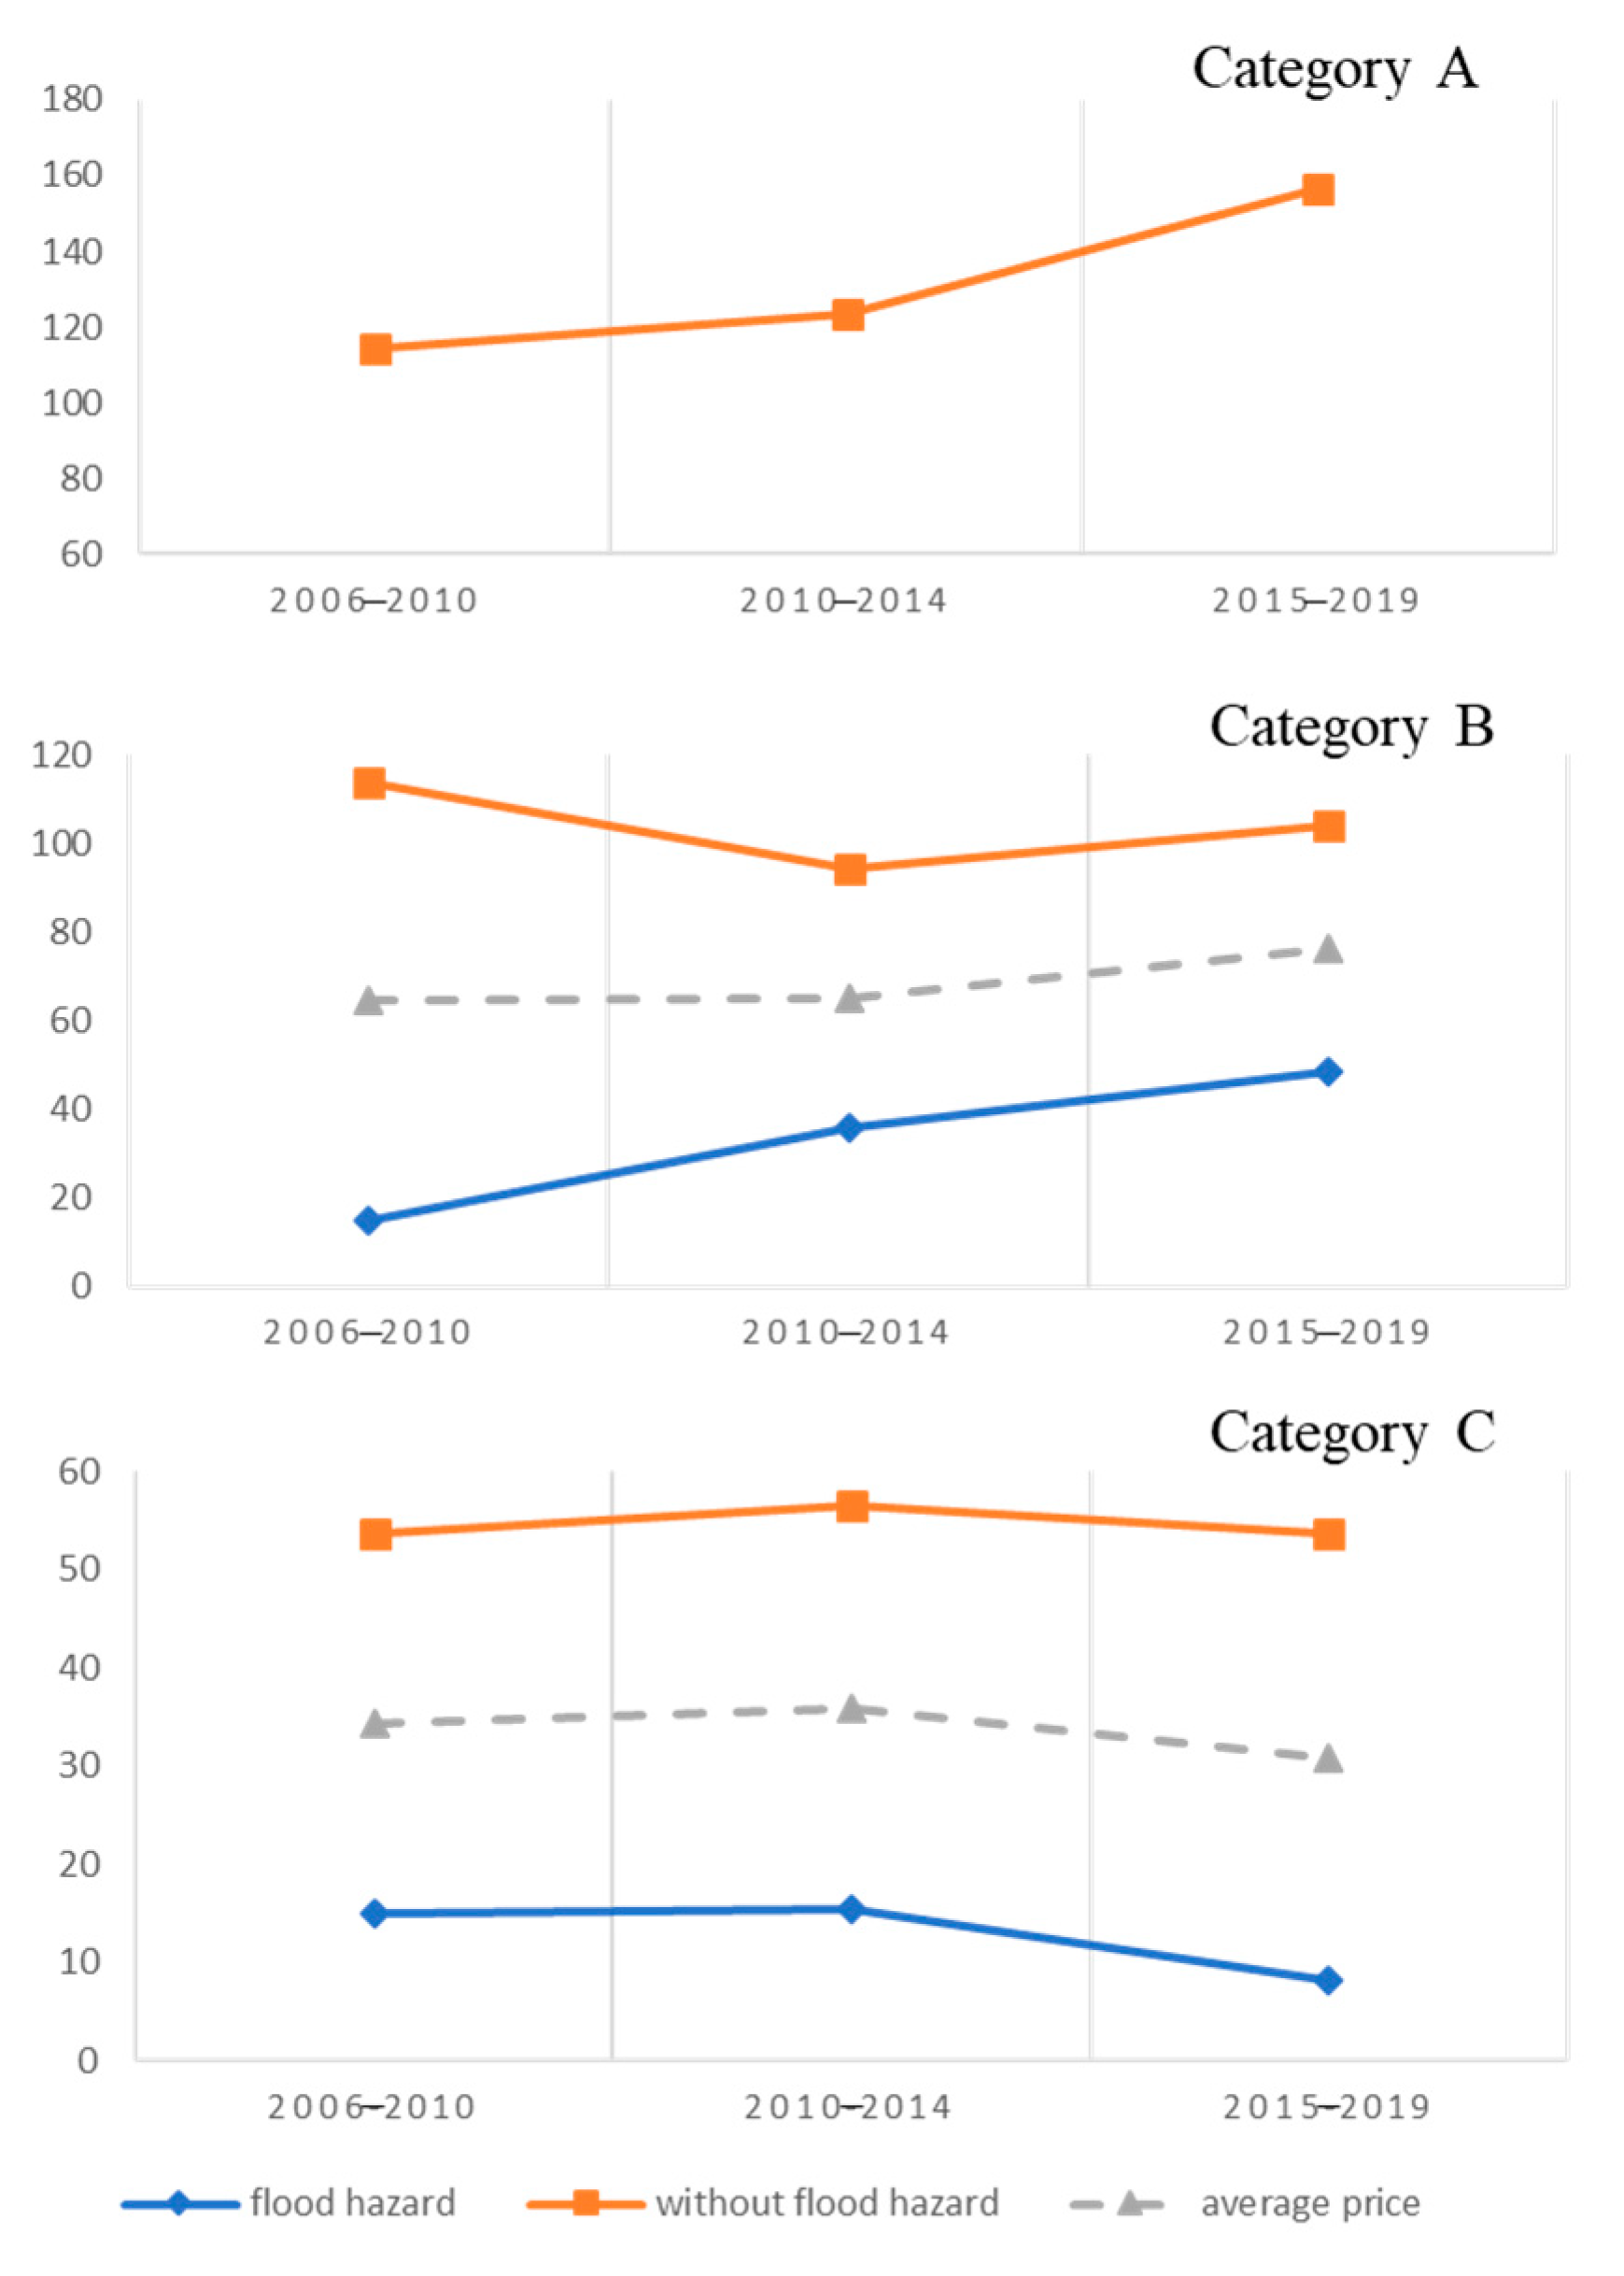
3.3. Stage 3: Assessment of the Effect of Flood Hazard Areas on the Activity of the Land Property Market, and on Prices

The spatial variability of the market activity is primarily related to socio-economic factors affecting the quality of life, income, or the condition of the local economy. In local markets, spatial variability is caused by such local factors as spatial and planning determinants as well as localisation aspects associated with the temporary trends, preferences, safety, and the image of a particular estate or district [46]. As Usman et al. [47] noted, a single method for segmenting a property market into submarkets that are internally homogeneous and heterogeneous among the submarkets is yet to be proposed and generally accepted. The property market is generally subdivided into two classes. They are segmentation-based on a priori knowledge of the submarkets and data-driven submarket classification. This recognised and popular research approach can be found, for example, in [48,49,50].
Given the spatial variability in particular parts (districts) of Sandomierz, the areas were classified based on the results of a field survey among local experts, and spatial data. Real estate surveyors and real estate brokers were accepted as experts to assess the homogeneous features of particular areas of Sandomierz. Only those experts who had at least five years of professional experience in real estate in Sandomierz were invited to participate. Five experts conforming to these requirements were found. The experts were shown the market activity and price forecast maps (Stage 2) as auxiliary materials for delineating categories of areas. Each of the interviewees was given a town map to mark categories of areas and characterise them. The survey divided the town into three categories of areas (Zones A, B, and C) with land property designated for low-rise residential buildings:
  • Very favourable—areas most frequently formed through the intensification (compacting) of the existing housing estates (Zone A)
  • Favourable—most commonly formed from rural settlement units (Zone B)
  • Moderate—including areas less favourable due to the neighbourhood, restricted access to services, etc. (Zone C).
The authors then determined the market activity in the categories of areas (Figure 6 and Figure 7) and delineated submarket categories based on spatial data. The subdivision into the three zones was based on three main criteria: development intensity, distance to the Vistula, and mean unit transaction prices. To determine the classification, we produced raster spatial distribution maps for the criteria. The development intensity map was drawn using the Kernel Density Estimation method (KDE), taking into account the total building area. The mean unit price map was developed with Inverse Distance Weighting (IDW). The problem with simultaneous presentation of the criteria was different units and orders of magnitude. The values, therefore, were standardised for the analysis. The spatial distribution of the standardised values for the criteria is shown in Figure 6.
The mean standardised value of the criteria was used to identify boundaries between the zones (Figure 7). The zone boundaries were approximated using the results of the final raster reclassification.
The results of both the methods were consistent, so they were used to determine the final boundaries between property market zones. The analysis was carried out separately for the parts exposed to flood hazard. To remove the influence of the differences in size of the area categories, the index of transaction density (a measure assigning transactions to areas) was employed. The transaction density (GT) index was proposed as the number of transactions concluded in a time unit per km2, according to the following formula (5):
GT = L T P
where LT is the number of transactions, and P is the area in km2.
Areas the experts believed to be the most valuable (Zone A) were located in parts of the town free from the risk of flooding. Real property in this category was the most expensive in the town with average levels of 114.36 PLN (30.04 USD), 123.25 PLN (32.38 USD), and 156.32 PLN (41.07 USD) per m2 in the intervals of 2006–2010, 2011–2014, and 2015–2019, respectively. The market activity was relatively constant in this category, at about 25 transactions per km2. This group takes up 24% of all transactions on the market (Figure 8).
The highest turnover was identified in Zone B with favourable conditions; 51% of transactions were done here. The average price in the area was 64.51 PLN (16.95 USD), 65.04 PLN (17.09 USD), and 76.28 PLN (20.04 USD) for respective intervals. There was a distinctive difference in prices for land situated in flood hazard zones versus outside of them; the largest was from 2006 to 2010, with the mean price of risk-free land being 87% higher. From 2011 to 2014, it was 62% higher, while from 2015 to 2019, it was 53% higher (Figure 9). A drop in market activity concerning areas at risk of flooding after 2010, when the Millennium Flood occurred, is apparent.
Real property in Zone C comprised 26% of all transactions on the market and exhibited a significant price variation for areas at risk of flooding and those free of risk. The difference was 72% to 85%. The authors note that the market activity in this category was similar for areas with and without the risk in two periods: from 2006 to 2009, and from 2014 to 2019. The activity clearly increased in risk-free areas in the period from 2010 to 2014. This may be related to the flood of 2010. Land in this area exhibited the lowest mean price, which was 34.33 PLN (9.02 USD), 36.00 PLN, and 30.94 PLN for the intervals, respectively.
The authors attempted to determine the impact of flood risk on property prices using statistical methods. To this end, they employed a particular model of regression, Hierarchical Linear Model (HLM). Zone A is free of flood risk. Zones B and C are at risk. Therefore, the study disregarded transactions in Zone A. The employed model had two levels with a grouping variable determining the assignment to the individual zone (B or C). Explanatory variables were transaction date, flood risk, utilities, area, and location qualities. It was assumed that random effects would affect the intercept and flood risk in the HLM. Results of the HLM estimation are presented in Table 1 and Table 2.
Fixed effects turned out to be insignificant with random effects being of key importance. The authors conducted a likelihood-ratio test for the likelihood functions for a classic multiple regression model and the HLM to investigate the significance of random effects. The difference between the likelihood function logarithms was −2.978. Assuming that the likelihood ratio conforms to the chi-square distribution ( χ 2 2 ), the authors found random effects to be significant at the level of significance of p = 0.05. The intercept for Zone B was 77.27 and for Zone C, 52.96. This confirms the proposition that property in Zone B commanded a premium compared to property in Zone C. The random effect representing the risk of flood was −10.34 for Zone B. This means that a risk of flood reduces the unit price by this amount (in PLN).

3.4. Stage 4: Buyers’ Attitude in the Time of Flood Information Pressure

An increasing number of studies shows that private buyers could probably take into consideration material risk when making investment decisions, leading to reduced capital in high-risk areas [51,52,53,54]. In their search for safe capital allocation possibilities, potential project owners assess the growth potential, risk levels, and market transparency related to it. Project owners should also evaluate the profitability of their projects by determining the profitability index (rate of return), taking into account all project costs, including (urban) planning fees or betterment levies for technical infrastructure [55], as well as tax on property function change, such as a conversion from agricultural to building parcel [56]. The present study looked into the willingness of buyers to invest in various locations in the town. The analysis focused on land designated for low-rise residential developments. The input data for this stage was the number and distribution of building permits in the area. This analysis focused on the period of 2016 to 2019. The data were acquired from the Chief Construction Supervision Authority of Poland. The authors reviewed the information and kept those permits that applied to the delineated part of the town (Figure 10). They were then classified as Category I or II.
The authors determined the density of these projects in the town. The division of permits into two categories represents two groups of project owners in the market. The first one consisted mainly of natural persons seeking to build or purchase single-family houses. In Polish towns, it is most commonly the future owners who build low-rise residential buildings. The other group were stakeholders that provide services, such institutions as the municipality, gasworks, power supplier, and so forth.
The largest number of building permits was issued for properties situated in the risk-free zone (Figure 11). It was true for both the construction of low-rise residential buildings and services. The smallest number of permits was issued for the part of the town at risk of flooding. Surprisingly, a relatively large number of building permits for services was issued for the southwestern part of the town. This fact could be indicative of a local government scheme to stimulate the development of the area [57] and a future increase in market activity there [58]; and [59]. The investigated area exhibited a link between the transaction density index and the number of low-rise residential building permits. More permits were issued for areas with higher prices.

4. Discussion

Urban structures shaped by historical factors face various challenges, including natural ones such as floods. The appreciation of the threats is evident in the way property markets operate, among other things. Basic property market data, such as the number of transactions and their spatial distribution, market prices, and attitudes of market participants, can be used to determine the property market activity. Historical market activity levels were determined with transaction volume and price data [32]. Market growth was inferred from participant attitudes. The market activity and residential property prices were lower in areas with flood risk than in areas free of risk. The authors are aware that property prices are affected by numerous factors [60,61], not only location or natural disasters. The results are consistent with the research by Rabassa and Zoloa [29], Samarasinghe and Sharp [62], and Bin and Landry [9]. They were convinced about the significant price discounting for properties in flood-prone areas. However, the findings vary due to the use of different methodologies and the nature of impacts [63], and discounted property values vary according to the country, location, and the type of analysed property.
Areas marked as Zone C exhibited an unambiguous and lasting price change. It reached over 72% for areas free of flood risk and those burdened with flood risk. Areas marked as Zone B also had a price difference, but it was not as spectacular as in Zone C. This was confirmed by Akbar et al. [32] who claim that there is potential for longer-term impacts of floods on housing markets, as residents reassess flood risks and the personal and economic disruption that they cause. It is not insignificant to note that Sandomierz is built up only to approximately 30%, and therefore no significant problems are encountered with finding land properties designated for residential purposes within its area. Our findings are not consistent with the research by Rajapaksa et al. [10], who demonstrated that the buy-to-sell period is shorter in affluent suburbs than in poorer ones.
The study shows that property prices decreased after the 2010 flood in areas at risk of flooding in Zone C. Many authors suggest that the price response is stronger immediately after a flood in the area [9,10,22,64,65]. According to Jung [66], results of analyses indicated that the impact of natural disasters on property prices could vary in time. This influences the sustainable development of areas affected by this phenomenon. The Millennium Flood of 2010 affected the market activity in the town. The property market in the northern part of the town, which is free from flood risk, was much more active, especially after the flood. The transaction density was considered very high for some locations. Local governments should make an effort to promote these areas and reduce the impact of the risk on the market to minimise the duration of the negative influence of disasters on the residential property market. Examples of such successful attempts can be found in Europe [2] and around the world [58]. The analysis has demonstrated that the promotion of buildable areas and stimulation of the land market through the construction of service networks has been implemented in a part of the southwestern district of the town. The authors confirm that flood risk maps are an irreplaceable tool for identifying areas and the potential level of impact of flooding on various elements distributed in the territory [67]. This information helps to analyse and make decisions related to flood risk management and planning, and also helps market participants to determine the risk of a project.

5. Conclusions

The occurrence of flood risk areas affects sustainable development of the town Sandomierz, because it influences, for example, residential land market activity. The impact varies by location: Zones B and C (with flood risk) exhibited lower transaction activity and property prices. The trade in these zones did not stop immediately after the flood when land prices were the lowest. The market activity and prices in this area changed over time. However, they did not reach the level for comparable areas that are not at flood risk. The study demonstrated that both a flood and a flood risk affect the levels of activity and the prices of residential land. However, this impact differs at various times and locations and is greater immediately after a flood.
The analyses have confirmed that the awareness of the risk of flood is great in the town of Sandomierz, and affects the level of market activity and the level of prices. The proposed methodology, involving spatial interpolation of the phenomenon (KDE and IDW) and an expert opinion survey, facilitates the assessment of the market activity in towns where transactions are scarce. Moreover, it is rather simple to apply, and very cost-effective (economically justifiable). An in-depth investigation with ArcGIS reveals the variability in market activity. Such studies help investors understand market patterns both regarding leasing and investment projects. This knowledge can be applied in urban planning to affect urban development policies, and in the sustainable management of natural disasters and urban resilience.

Author Contributions

Conceptualization, M.D. and B.P.; methodology, M.D.; software, M.D.; validation, M.D., B.P. and S.B.; formal analysis, M.D.; investigation, M.D., R.C.; resources, M.D. and B.P.; data curation, M.D.; writing—original draft preparation, M.D. and B.P.; writing—review and editing, B.P., M.D., A.K., K.K.-B., A.T.; visualization, M.D., R.C.; supervision, B.P.; project administration, S.B.; funding acquisition, B.P. All authors have read and agreed to the published version of the manuscript.

Funding

This research was funded by the Ministry of Science and Higher Education for the University of Agriculture in Kraków for 2020; Civil engineering and transport 030008-D018/KGPiAK/2020.

Acknowledgments

The authors would like to thank the anonymous reviewers for their thorough work with the manuscript and for providing constructive and insightful comments on this paper.

Conflicts of Interest

The authors declare no conflict of interest.

References

  1. Echendu, A.J. The impact of flooding on Nigeria’s sustainable development goals (SDGs). Ecosyst. Health Sustain. 2020, 6, 1–13. [Google Scholar] [CrossRef]
  2. Jonkman, S.N.; Bočkarjova, M.; Kok, M.; Bernardini, P. Integrated hydrodynamic and economic modelling of flood damage in the Netherlands. Ecol. Econ. 2008, 66, 77–90. [Google Scholar] [CrossRef]
  3. Smith, M.J. Sustainable development goals: Genuine global change requires genuine measures of efficacy. J. Maps. 2020, 16, 1–4. [Google Scholar] [CrossRef]
  4. Merz, A.; Kreibich, H.; Thieken, A.; Schmidtke, R. Estimation uncertainty of direct monetary flood damage to buildings. Nat. Hazards Earth Syst. Sci. 2004, 4, 153–163. [Google Scholar] [CrossRef] [Green Version]
  5. Dottori, F.; Salamon, P.; Bianchi, A.; Alfieri, L.; Hirpa, F.A.; Feyen, L. Development and evaluation of a framework for global flood hazard mapping. Adv. Water Resour. 2016, 94, 87–102. [Google Scholar] [CrossRef]
  6. Alfieri, L.; Salamon, P.; Bianchi, A.; Neal, J.; Bates, P.; Feyen, L. Advances in pan-European flood hazard mapping. Hydrol. Process. 2014, 28, 4067–4077. [Google Scholar] [CrossRef]
  7. Pappenberger, F.; Dutra, E.; Wetterhall, F.; Cloke, H.L. Deriving global flood hazard maps of fluvial floods through a physical model cascade. Hydrol. Earth Syst. Sci. 2012, 16, 4143–4156. [Google Scholar] [CrossRef] [Green Version]
  8. Jongman, B.; Hochrainer-Stigler, S.; Feyen, L.; Aerts, J.C.; Mechler, R.; Botzen, W.J.; Bouwer, L.M.; Pflug, G.; Rojas, R.; Ward, P.J. Increasing stress on disaster-risk finance due to large floods. Nat. Clim. Chang. 2014, 4, 264–268. [Google Scholar] [CrossRef]
  9. Bin, O.; Landry, C.E. Changes in implicit flood risk premiums. empirical evidence from the housing market. J. Environ. Econ. Manag. 2013, 65, 361–376. [Google Scholar] [CrossRef]
  10. Rajapaksa, D.; Wilson, C.; Shunsuke, M.; Hoang, V.; Lee, B. Flood risk information, actual floods and property values: A quasi-experimental analysis. Econ. Rec. 2016, 92, 52–67. [Google Scholar] [CrossRef]
  11. Daniel, V.E.; Florax, R.J.; Rietveld, P. Flooding risk and housing value: An economic assessment of environmental hazard. Ecol. Econ. 2009, 69, 355–365. [Google Scholar] [CrossRef] [Green Version]
  12. Ji, Z.; Li, N.; Xie, W.; Wu, J.; Zhou, Y. Comprehensive assessment of flood risk using the classification and regression three method. Stoch. Environ. Res. Risk Assess. 2013, 27, 1815–1828. [Google Scholar] [CrossRef]
  13. Halama, A. Zrównoważony rozwój małych miast w aspekcie zagrożenia powodziowego (Sustainable development of small towns in the aspect of flooding). Acta Univ. Lodz. Folia Geogr. Socio-Oecon. 2013, 15, 255–269. [Google Scholar]
  14. Porter, J.; Demeritt, D. Flood-risk management, mapping, and planning: The institutional politics of decision support in England. Environ. Plan. A 2012, 44, 2359–2378. [Google Scholar] [CrossRef] [Green Version]
  15. Kurczyński, Z. Mapy zagrożenia powodziowego i katalogów powodziowych, a Dyrektywa Powodziowa (Flood hazard maps and flood catalogs, according to the Floods Directive). Arch. Fotogram. Kartogr. I Teledetekcji 2012, 23, 209–217. [Google Scholar]
  16. Yannopoulos, S.; Eleftheriadou, E.; Mpouri, S.; Io, G. Implementing the requirements of the European flood directive: The Case of ungauged and poorly gauged watersheds. Environ. Process. 2015, 2, 191–207. [Google Scholar] [CrossRef] [Green Version]
  17. Kourgialas, N.N.; Karatzas, G.P. A national scale flood hazard mapping methodology: The case of Greece–Protection and adaptation policy approaches. Sci. Total. Environ. 2017, 601602, 441–452. [Google Scholar] [CrossRef]
  18. Riegert, A. Doraźne metody ochrony przed powodzią (Ad hoc methods of flood protection). Bezp. I Technika Pożar. 2014, 3, 139–147. [Google Scholar]
  19. Zhang, L. Flood hazards impact on neighborhood house prices: A spatial quantile regression analysis. Reg. Sci. Urban Econ. 2016, 60, 12–19. [Google Scholar] [CrossRef]
  20. Franczak, P.; Listwan-Franczak, K.; Działek, J.; Biernacki, W. Planowanie przestrzenne na obszarach zalewowych w zlewniach górskich różnego rzędu w dorzeczu górnej Wisły oraz górnej i środkowej Odry. Pr. I Stud. Geogr. 2016, 61, 24–45. [Google Scholar]
  21. Zhang, Y.; Hwang, S.N.; Lindell, M.K. Hazard proximity or risk perception? Evaluating effects of natural and technological hazards on housing values. Environ. Behav. 2010, 42, 597–624. [Google Scholar] [CrossRef]
  22. Atreya, A.; Ferreira, S.; Kriesel, W. Forgetting the flood? An analysis of the flood risk discount over time. Land. Econ. 2013, 89, 577–596. [Google Scholar] [CrossRef]
  23. Bin, O.; Kruse, J.B. Real estate market response to coastal flood hazards. Nat. Hazards Rev. 2006, 7, 137–144. [Google Scholar] [CrossRef]
  24. Eves, C. The long term impacts of flooding on residential property values. Prop. Manag. 2002, 20, 214–227. [Google Scholar] [CrossRef]
  25. Harrison, D.M.; Smerh, G.T.; Schwartz, A.L. Environmental determinants of housingprices: The impacts of flood zone status. J. Real Estate Res. 2001, 21, 3–20. [Google Scholar]
  26. Beltrán, A.; Maddison, D.; Elliott, R. The impact of flooding on property prices: A repeat-sales approach. J. Environ. Econ. Manag. 2019, 95, 62–86. [Google Scholar] [CrossRef]
  27. Atreya, A.; Czajkowski, J. Graduated flood risks and property prices in Galveston county. Real Estate Econ. 2019, 47, 807–844. [Google Scholar] [CrossRef]
  28. Rajapaksa, D.; Zhou, M.; Lee, B.; Hoang, V.; Wilson, C.; Managi, S. The impact of flood dynamics on property values. Land Use Policy 2017, 69, 317–325. [Google Scholar] [CrossRef]
  29. Rabassa, M.J.; Zoloa, J.I. Flooding risks and housing markets: A spatial hedonic analysis for La Plata City. Environ. Dev. Econ. 2016, 21, 464–489. [Google Scholar] [CrossRef] [Green Version]
  30. Cupal, M. Flood risk as a price-setting factor in the market value of real property. Procedia Econ. Financ. 2015, 23, 658–664. [Google Scholar] [CrossRef] [Green Version]
  31. Eves, C.; Wilkinson, S. Assessing the immediate and short-term impact of flooding on residential property participant behaviour. Nat. Hazards 2014, 71, 1519–1536. [Google Scholar] [CrossRef] [Green Version]
  32. Akbar, D.; Rolfe, J.; Small, G.; Hossain, R. Assessing flood impacts on the regional property markets in Queensland, Australia. Australas. J. Reg. Stud. 2015, 21, 160–177. [Google Scholar]
  33. Cellmer, R.; Trojanek, R. Towards increasing residential market transparency: Mapping local housing prices and dynamics. ISPRS Int. J. Geo-Inf. 2020, 9, 2. [Google Scholar] [CrossRef] [Green Version]
  34. Morillo, M.C.; García-Cepeda, F.; Martínez-Cuevas, S.; Molina, I.; García-Aranda, C. Geostatistical study of the rural property market applicable to the region of Murcia (Spain) by M. carmen morillo1 et al. Appl. Spat. Anal. Policy 2017, 10, 585–607. [Google Scholar] [CrossRef] [Green Version]
  35. Leyland, A.H.; Goldstein, H. (Eds.) Multilevel Modelling of Health Statistics; John Wiley & Sons: Hoboken, NJ, USA; Chichester, UK, 2001. [Google Scholar]
  36. Matsuyama, Y. Hierarchical linear modeling (HLM). In Encyclopedia of Behavioral Medicine; Gellman, M.D., Turner, J.R., Eds.; Springer: Berlin/Heidelberg, Germany; New York, NY, USA, 2013. [Google Scholar] [CrossRef]
  37. Goldstein, H. Multilevel Statistical Models, 4th ed.; Wiley: Chichester, UK; Hoboken, NJ, USA, 2011. [Google Scholar]
  38. Cellmer, R.; Cichulska, A.; Renigier-Biłozor, M.; Biłozor, A. Application of mixed-effect regression models for compiling a land value map. In Proceedings of the Baltic Geodetic Congress, Olsztyn, Poland, 21–23 June 2018. [Google Scholar] [CrossRef]
  39. Hox, J.J.; Roberts, J.K. Handbook of Advanced Multilevel Analysis; Routledge, Talyor & Francis: New York, NY, USA, 2011. [Google Scholar]
  40. Silverman, B.W. Density Estimation for Statistics and Data Analysis; Chapman & Hall: London, UK, 1986. [Google Scholar]
  41. Shultz, S.D.; Fridgen, P.M. Floodplains and property values: Implications for flood mitigation projects. J. Am. Water Resour. Assoc. 2001, 37, 595–603. [Google Scholar] [CrossRef]
  42. Nakaya, T.; Yano, K. Visualising crime clusters in a space–time cube: An exploratory data-analysis approach using space–time kernel density estimation and scan statistics. Trans. GIS 2010, 14, 223–239. [Google Scholar] [CrossRef]
  43. Lu, Y.; Wong, D.W. An adaptive inverse-distance weighting spatial interpolation technique. Comput. Geosci. 2008, 34, 1044–1055. [Google Scholar] [CrossRef]
  44. Chen, F.-W.; Liu, C.-W. Estimation of the spatial rainfall distribution using inverse distance weighting (IDW) in the middle of Taiwan. Paddy Water Environ. 2012, 10, 209–222. [Google Scholar] [CrossRef]
  45. Handbook on Good Practices for Flood Mapping in Europe. Available online: https://ec.europa.eu/environment/water/flood_risk/flood_atlas/pdf/handbook_goodpractice.pdf (accessed on 21 September 2020).
  46. Cellmer, R. Modelowanie Przestrzenne w Procesie Opracowywania Map Wartości Gruntów (Spatial Modeling in the Process of Preparing Land Value Maps); University of Warmia and Mazury: Olsztyn, Poland, 2014. [Google Scholar]
  47. Usman, H.; Lizam, M.; Adekunle, M.U. Property price modelling, market segmentation and submarket classifications: A review. Real Estate Manag. Valuat. 2020, 28, 24–35. [Google Scholar] [CrossRef]
  48. Ling, Z.; Hui, E.C.M. Structural change in housing submarkets in burgeoning real estate market: A case of Hangzhou, China. Habitat Int. 2013, 39, 214–223. [Google Scholar] [CrossRef]
  49. Hwang, S. Residential segregation, housing submarkets, and spatial analysis: St. Louis and Cincinnati as a case study. Hous. Policy Debate. 2015, 25, 91–115. [Google Scholar] [CrossRef]
  50. Levkovich, O.; Rouwendal, J.; Brugman, L. Spatial planning and segmentation of the land market: The case of the Netherlands. Land Econ. 2018, 94, 137–154. [Google Scholar] [CrossRef]
  51. Kousky, C.; Luttmer, E.F.; Zeckhauser, R.J. Private investment and government protection. J. Risk Uncertain. 2006, 33, 73–100. [Google Scholar] [CrossRef]
  52. Balvers, R.; Du, D.; Zhao, X. What Financial Markets Reveal About Global Warming? Department of Economics, West Virginia University: Morgantown, WV, USA, 2009. [Google Scholar]
  53. Hallegatte, S. How economic growth and rational decisions can make disaster losses grow faster than wealth. Policy Res. Work. Pap. Ser. 2011, 5617. [Google Scholar] [CrossRef] [Green Version]
  54. Husby, T.G.; Mechler, R.; Jongman, B. What if Dutch investors started worrying about flood risk? Implications for disaster risk reduction. Reg. Environ. Chang. 2016, 16, 565–574. [Google Scholar] [CrossRef] [Green Version]
  55. Battisti, F.; Campo, O. A methodology for determining the profitability index of real estate initiatives involving public-private partnerships. A case study: The integrated intervention programs in Rome. Sustainability 2019, 11, 1371. [Google Scholar] [CrossRef] [Green Version]
  56. Battisti, F.; Campo, O.; Forte, F. A methodological approach for the assessment of potentially buildable land for tax purposes: The Italian case study. Land 2020, 9, 8. [Google Scholar] [CrossRef] [Green Version]
  57. Malkowska, A.; Gluszak, M. Pro-investment local policies in the area of real estate economics-similarities and differences in the strategies used by communes. Oecon. Copernic. 2008, 7, 269–283. [Google Scholar] [CrossRef] [Green Version]
  58. Steinberg, F. Strategic urban planning in Latin America: Experiences of building and managing the future. Habitat Int. 2005, 29, 69–93. [Google Scholar] [CrossRef]
  59. Gaile, L. Improving rural-urban linkages through small town market-based development. Third World Plan. Rev. 1992, 14, 131–148. [Google Scholar] [CrossRef]
  60. Sklenicka, P.; Molnarowa, K.; Pixova, K.C. Factors affecting farmland prices in the Czech Republic. Land Use Policy 2013, 30, 130–136. [Google Scholar] [CrossRef]
  61. Wang, S.; Yang, Z.; Liu, H. Impact of urban economic openness on real estate prices: Evidence from thirty-five cities in China. China Econ. Rev. 2011, 22, 42–54. [Google Scholar] [CrossRef]
  62. Samarashinghe, O.; Sharp, B. Flood prone risk and amenity values: A spatial hedonic analysis. Aust. J. Agric. Resour. Econ. 2010, 54, 457–475. [Google Scholar] [CrossRef] [Green Version]
  63. Lamond, I. The Impact of Flooding on the Value of Residential Property in the UK; School of Engineering and the Built Environment, University of Wolverhampton: Wolverhampton, UK, 2008. [Google Scholar]
  64. Kousky, C. Learning from extreme events: Risk perceptions after the flood. Land Econ. 2010, 86, 395–422. [Google Scholar] [CrossRef]
  65. Naoi, M.; Seko, M.; Sumita, K. Earthquake risk and housing prices in Japan: Evidence before and after massive earthquakes. Reg. Sci. Urban Econ. 2009, 39, 658–669. [Google Scholar] [CrossRef] [Green Version]
  66. Jung, E.; Yoon, H. Is flood risk capitalized into real estate market value? A mahalanobis-metric matching approach to the housing market in Gyeonggi, South Korea. Sustainability 2018, 10, 4008. [Google Scholar] [CrossRef] [Green Version]
  67. Morales, P. Current status of the mapping of flood risk and its application in the land. The case of the region of Murcia. Bol. Asoc. Geógr. Esp. 2012, 58, 443–448. [Google Scholar]
Figure 1. Poland within Europe and the location of Sandomierz, EPSG 2180.
Sustainability 12 10098 g001
Figure 2. Research methodology diagram.
Sustainability 12 10098 g002
Figure 3. (a) The flood hazard map sheets for the area of Sandomierz. (b) Flood hazard areas in Sandomierz; (c) visual presentation of hazard areas in the town, purple areas are total destruction of the flood embankment areas, red areas are flood hazard areas. Source: our work is based on http://mapy.isok.gov.pl/imap/, which is a water data portal publishing flood hazard maps and flood risk maps.
Sustainability 12 10098 g003
Figure 4. A map of activity in the land property market (the number of transactions per km2) in the town of Sandomierz (a) from 2006 to 2019; (b) from 2006 to 2010; (c) from 2011 to 2014; (d) from 2015 to 2019.
Sustainability 12 10098 g004
Figure 5. (a) The distribution of land properties designated for housing developments, sold from 2006 to 2019; (b) a map forecasting unit prices of land properties designated for housing developments from 2006 to 2019, estimated with the IDW method; (c) forecast of unit prices based on prices from 2006 to 2010; (d) from 2011 to 2014; (e) from 2016 to 2019.
Sustainability 12 10098 g005
Figure 6. Spatial distribution maps for standardised values of the criteria for delineating market zones: (a) development intensity, (b) distance to the Vistula River, and (c) mean unit prices.
Sustainability 12 10098 g006
Figure 7. Delineation of market zones: (a) the spatial distribution of the mean standardised value, (b) raster reclassification results, (c) the final boundaries of the market zones.
Sustainability 12 10098 g007
Figure 8. (a) Study area with categories of areas overlaid; (b) the activity of the market of residential land property for Zones A, B, and C; on the Y-axis, the value of the density index for areas in Zones A, B, and C. The diagrams juxtapose areas with flood hazard and areas without flood hazard.
Sustainability 12 10098 g008
Figure 9. Average prices of land property designated for residential buildings in Zones A, B, and C.
Sustainability 12 10098 g009
Figure 10. Building permits—spatial distribution on the left and right bank of the Vistula; Category I—construction or alteration of a residential building; Category II—improvement of residential developments, construction and upgrade of services such as water supply, sewerage system, gas, etc.
Sustainability 12 10098 g010
Figure 11. Building permits in Categories I and II—a density map.
Sustainability 12 10098 g011
Table 1. HLM estimation results with fixed effects for the intercept and flood risk.
VariableEffectStandard Errort-Value
Date0.0980.0472.116
Utilities1.0501.9130.549
Area−0.7742.226−0.348
Location2.6833.3150.809
Table 2. HLM estimation results with random effects for the intercept and flood risk.
VariableZone BZone CVarianceStandard Deviation
Intercept77.26752.9574540.8067.385
Risk−10.3385.13690.3809.507
Publisher’s Note: MDPI stays neutral with regard to jurisdictional claims in published maps and institutional affiliations.

