Article

Carbon Footprint Assessment of Construction Waste Packaging Using the Package-to-Product Indicator

Department of Environmental Chemistry, Faculty of Environmental Technology, University of Chemistry and Technology Prague, Technická 5, 166 28 Prague, Czech Republic
*
Author to whom correspondence should be addressed.
Sustainability 2020, 12(23), 10094; https://doi.org/10.3390/su122310094
Submission received: 13 November 2020 / Revised: 27 November 2020 / Accepted: 29 November 2020 / Published: 3 December 2020
(This article belongs to the Special Issue Carbon Footprint and Sustainability Assessment)

Abstract

:
The environmental impacts of buildings are based on the construction products, which together with their packaging can be assessed as one product system. To reduce the environmental impacts of buildings, the products and their packaging need to be optimised and analysed using environmental assessment. The purpose of this study is to assess the packaging related to the product according to the Life Cycle Assessment method. The environmental assessment was performed using the Product Environmental Footprint methodology, version 3.0. To compare the primary, secondary, and tertiary packaging, the results of the climate change indicator were used as a base to calculate the Package-to-Product (PtP) indicator. Among the considered scenarios to handle the waste packaging (landfilling scenario, material recovery scenario, energy recovery scenario, and the mixed scenario), the material recovery scenario is the most preferable and, for most of the packaging materials, the scenario with the lowest impact. Following the PtP result, the secondary packaging in the roof tile system has a significant share of the impact of the whole system (16% for the energy recovery scenario). Moreover, the results confirm the PtP indicator as the appropriate indicator to analyse the environmental impacts of construction products.

1. Introduction

In the construction industry, the main effort is to reduce the environmental impacts of buildings using materials and structures which consume less non-renewable resources and cause low environmental impacts. Moreover, the production of packaging for these construction products causes damage to the environment, and so managing the construction waste packaging could lead to a reduction of the environmental impact.
Construction waste packaging is produced during construction works and the reconstruction of buildings, and its main function is to preserve the quality of construction products and simplify the transport of products. The ordinary approach to managing this waste on a construction site is described in the EU Construction and Demolition Waste Protocol [1]. One of the most important steps, which is recommended by this document, is to separate the packaging and sort it into types and materials directly on the building site. In addition, it is advisable to prepare a waste management plan before the construction works start, to manage the waste flow from the beginning. To manage the waste flows and increase the separation rate, it is important to understand the production patterns of packaging waste [2]. These activities, such as waste management and the separation of waste on the site, lead to the reduction of non-reusable waste flows, but this approach does not solve the environmental impacts caused by the production of packaging.
According to the hierarchy of waste management, waste prevention is the most favourable approach. Similarly, the packaging material, which will become a waste material, should be designed to reduce the amount of waste, which will be produced after the use phase of the packaging material. Although reaching a low amount of waste is important, the effort should be aimed at reducing all environmental impacts. Moreover, the environmental impacts should be considered not only in the use phase, but in the whole life cycle of packaging.
The environmental impacts of packaging can be affected by the type of material used. Some packaging materials are produced in energy-consuming processes (paper packaging) [3]. Besides, dangerous substances could be released during the life cycle of some materials (aluminium packaging) [4], and some materials are hard to recycle (composite materials) [5]. Furthermore, the end-of-life phase, including waste processing and possible avoided loads, influences the environmental impact [6].
The environmental impacts of construction products are assessed to reduce the impact of the whole building. For example, voluntary sustainable building certification systems such as LEED (Leadership in Energy and Environmental Design), BREEAM (Building Research Establishment Environmental Assessment Method), and SBToolCZ (Sustainable Building Tool—Czech) evaluate as beneficial the products with the environmental product declaration (EPD) [7,8]. For the processing of EPD, the data about package production are analysed. However, these systems do not assess the partial impact of packaging and are therefore unsuitable for the prevention of the environmental impact caused by the life cycle of packaging.
To analyse the environmental impacts of products and their packaging together, the Life Cycle Assessment method (LCA) is suitable as an analytical tool [9]. LCA studies have been conducted on alternative packaging materials, but the compared function unit and/or described system boundaries were different [10,11,12]. In addition, these studies are mainly focused on the packaging for the food processing industry [4,6]. In the construction industry, the environmental assessment for environmental product declarations is performed according to the EN 15 804 [13]. Besides, LCA studies in the construction industry are not only focused on construction materials [14] and products [15], but also on building elements [16,17] and the whole building [18,19]. Moreover, some of the construction products are made of secondary materials, and this fact is also considered in the studies [20,21].
Different types of construction products can be assessed using LCA, and it is possible to consider their specific properties or their specific production. For example, cement production was assessed concerning the impact of CO2 emissions [22]. Several impact categories, including the economic and social dimensions, were assessed for ceramic tiles [23]. Similarly, the decrease in the results of the environmental indicators was assessed in the system of brick production, in which organic waste was used in the cooking process [24]. The influence of the thermal process was also investigated for foam concrete, and the results of the environmental assessment were compared to those of ceramic bricks [25]. Besides the structure components, insulation materials [26] and other materials for interior and exterior [27,28,29] were assessed. Nevertheless, the comparison of these studies is limited, mainly due to differently defined system boundaries, considered functional units, and used impact assessment methods. Another limitation of the studies concerning the environmental assessment of packaging is their separate comparison of primary and secondary packaging. Moreover, studies about tertiary packaging, such as wooden pallets, were performed without relation to the product [10,11]. Besides this, the results of an environmental impact assessment for packaging is also affected by the different end-of-life scenarios [11,12]. Likewise, the whole waste management strategy for packaging could be compared [30,31]. For the reasons mentioned above, it is clear that there is no study that comprehensively assesses the environmental impacts of all types of packaging materials of construction products. Therefore, in this study, we focused on the assessment of the primary, secondary, and tertiary packaging of the most commonly used construction products. The environmental impacts of the types and materials of packaging can be compared using the Package-to-Product (PtP) indicator. This indicator allows us to assess the environmental impacts of the whole life cycle of packaging materials related to the environmental impacts of the product. Although this indicator was used for the environmental assessment of packaging used in the food processing industry, it can also be used for products and packaging in other industries [32,33]. As was proposed before [32], the climate change indicator can be used as an indicator for environmental impact assessment according to the Product Environmental Footprint methodology [34].
In this study, we combine the above-described approaches to analyse the environmental impacts of 10 construction products and their packaging using the LCA method. The life cycle of packaging materials is modelled using four end-of-life scenarios: the landfilling scenario, the scenario with material recovery, the scenario with energy recovery, and the mixed scenario. The compared functional unit for environmental assessment was defined as “1 kg of product packaged in primary, secondary, and tertiary packaging”. As an indicator for assessing impact, the climate change indicator was used, and the results of this indicator were analysed using the PtP indicator to identify the opportunities to reduce the environmental impact of ordinary construction products and their packaging.

2. Materials and Methods

The Life Cycle Assessment method and the PtP indicator were used as analytical tools for the environmental assessment of packaging waste produced by the following construction products: cement, aerated concrete block, clay brick, gypsum plasterboard, mineral reinforcement mortar, roof tile, mineral wool, ceramic facade panels, expanded polystyrene, and paint emulsion.

2.1. Construction Products

The considered construction products were chosen as examples of representative products and materials typically used in building constructions. The foundation structure and loadbearing structure, which are usually made of concrete, are represented by the cement, aerated concrete block, and or clay bricks. For interior constructions, gypsum plasterboard and mineral reinforcement mortar can be used. Common products as roof tiles, ceramic facade panels, mineral wool, expanded polystyrene, or paint are used for exterior constructions or roof constructions.
Each of these products is delivered on the building site in some form of packaging. The packaging of the considered products was estimated on the base of the market survey conducted by the authors for this study, using data from product producers and construction contractors. The considered products and their packaging are described in Table 1.

2.2. Packaging Materials and Types

Regarding the function of packaging, three main types are defined: primary, secondary, and tertiary. The main function of primary packaging is to protect a product, but it is possible to use it to inform a customer or for marketing purposes. In this study, different materials were considered as primary packaging, such as polypropylene (PP), high-density polyethylene (HDPE), paper, or cardboard.
On the contrary, secondary packaging is used for transporting several primary packages. As defined in Table 1, HDPE and low-density polyethylene (LDPE) were analysed as secondary packaging in this study.
Similarly, tertiary packaging is used for product transport. The typical example of this packaging type is a wooden pallet, which can be used in multiple forms.

2.3. Life Cycle Assessment

The environmental impact of construction products and their packaging was analysed using the Life Cycle Assessment method [9]. This method is mostly used for the assessment of environmental impacts caused by processes in the whole life cycle of a product or service, following the international standards ISO 14 040 and ISO 14 044 [35,36]. In this study, the LCA method was used as an analytical tool to evaluate all the inputs and outputs of the considered products and their packaging that affected the environment in the phases of raw resource acquisition, transport of resources to a factory, production of products and packaging, and end-of-life of packaging.
The environmental assessment is used to describe several impact categories using several environmental indicators, but in this study, the assessment was focused on the global warming category. Thus, the result of the impact in this category was evaluated using the indicators described in Table 2, which follows the Environmental Footprint method, version 3.0 [37].
To analyse the relationship between the environmental impact of the product and its packaging, the Package-to-Product (PtP) indicator was used.

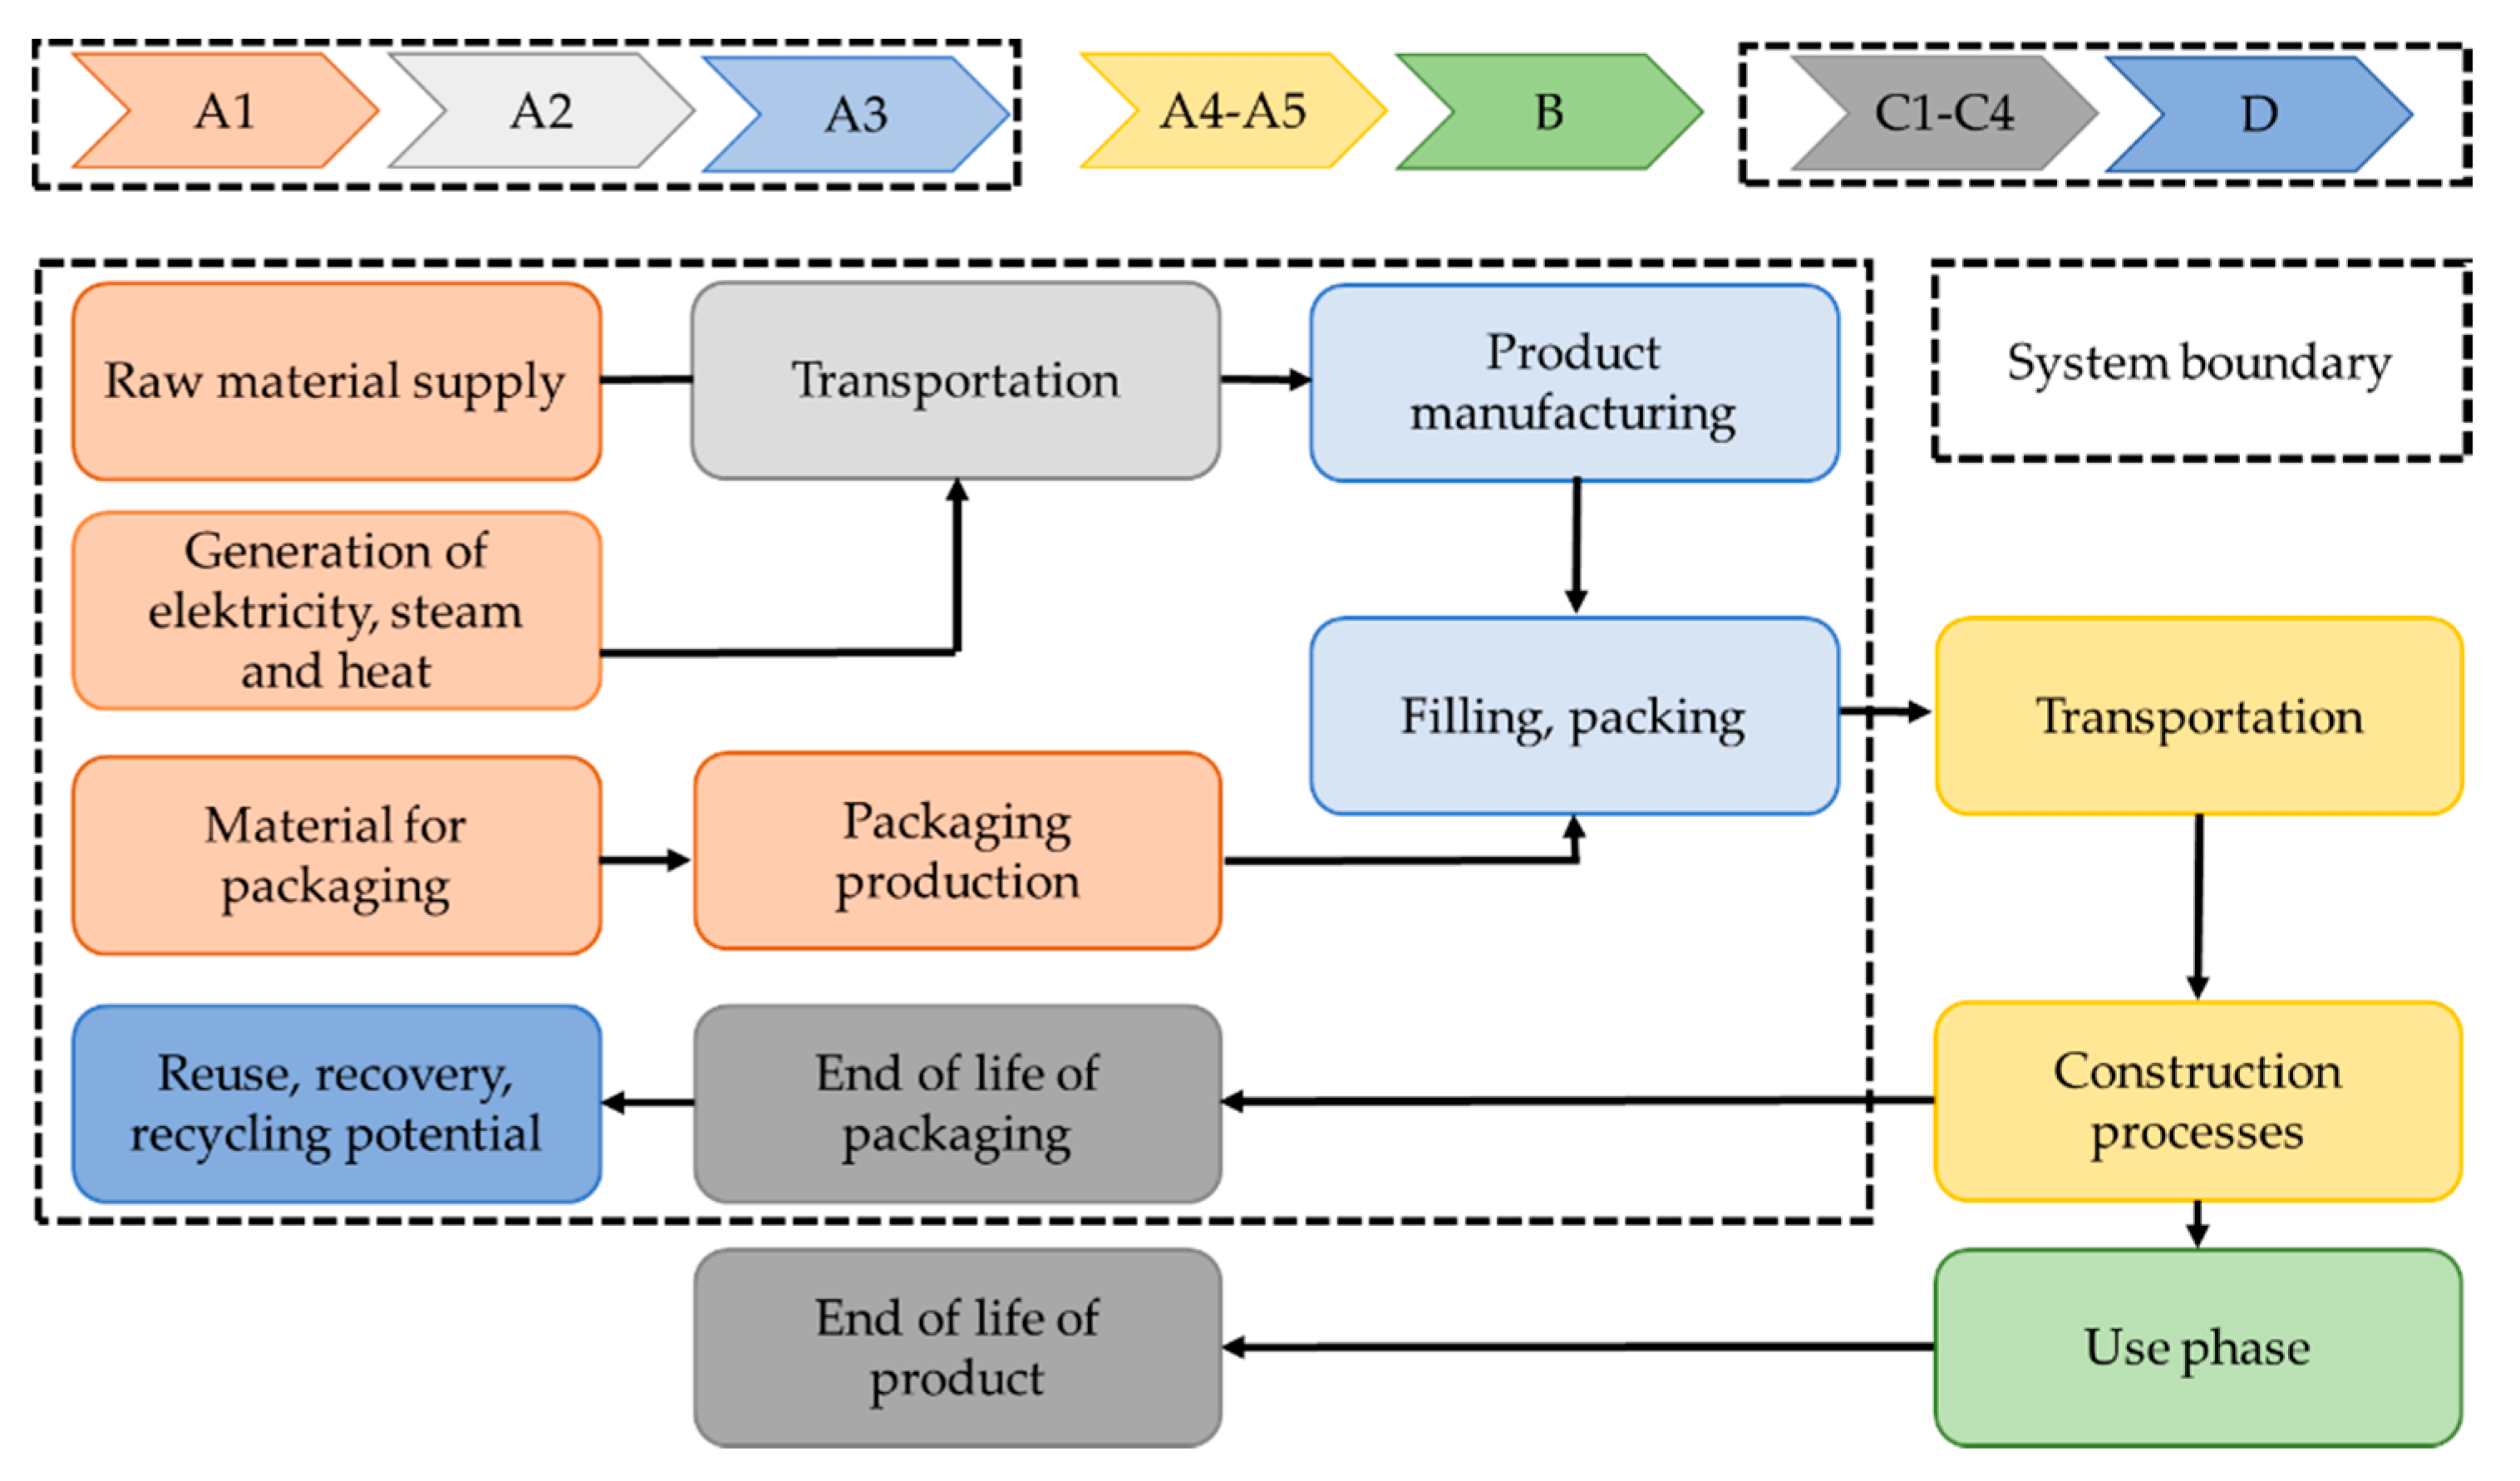
2.3.1. System Boundaries and Functional Unit

Environmental impacts were related to the functional unit of the study, which is defined as “1 kg of product packaged in primary, secondary, and tertiary packaging”.
The system boundaries of the considered products include raw material supply, transport of resources, manufacturing of products including the production of packaging, and energy and waste production. The use phase of the product or the package is excluded from the system boundaries because it is assumed that the considered products and packaging materials produce no environmental impact in this phase. The system boundaries also include the end-of-life (EoL) phase of packaging. On the contrary, the EoL phase of the product is not included. The investigated system boundaries are in Figure 1.

2.3.2. Assumption Accepted in the Study

  • The process describing the Czech energy mix was used according to data from reference year 2016.
  • Wooden pallets were assumed to be used 25 times.
  • Other materials such as straps, labels, and stickers were neglected for packaging.
  • Transport: the distance for transporting the packaging from the packaging manufacturer was set to 230 km, while the distance for the transporting of the packaging to the removal site was set in the scenarios as follows: 50 km for landfilling, 150 km for energy recovery, 250 km for material recovery.

2.3.3. Scenarios Modelling the End-of-Life Phase

The end-of-life phase of each packaging product can be modelled with different scenarios, which cause different environmental impacts. In this study, the end-of-life phase for packaging was modelled using the following scenarios: the landfilling scenario, the scenario with material recovery, the scenario with energy recovery, and the mixed scenario (CZ EoL mix).
In the first scenario, the end-of-life phase of packaging is modelled as the disposal on a landfill for all types of materials. The scenario with material recovery describes the assumptions that all materials are recovered. The third scenario, with energy recovery, is modelled as the utilization of all packaging materials in an incineration plant. The mixed scenario (CZ EoL mix) combines the other approaches and represents the real waste management situation in the Czech Republic, which is estimated as follows: 39 wt.% of waste material recovery, 18 wt.% of energy recovery, and 53 wt.% of waste disposed on a landfill. In this scenario, it is also assumed that 50 wt.% wooden pallets are expected to be recovered for energy and the other 50 wt.% are disposed on a landfill.

2.3.4. Life Cycle Inventory

Specific data were used to model the management of waste packaging, and generic data from the GaBi database [20] were used for describing the production of products. Moreover, processes of waste recycling and waste disposal were modelled using the mentioned generic data. Datasets and environmental modelling were managed in the GaBi software [38,39]. The considered processes, which were used for describing the product production processes, are described in Table 3.

2.4. Calculation of PtP Indicator Focused on Carbon Footprint

The PtP indicator was used for analysing the relation between the environmental impact caused by the product and its package. The PtP indicator was designed as the ratio of the result of the climate change indicator for the package (CCPa) and the result of the climate change indicator for the product (CCPr) [33]. Regarding the results of the climate change indicator, the PtPcc as indicator for the evaluation of the results of the climate change indicator is calculated according to Equation (1).
PtP CC ( % ) = CC Pa / CC Pr 100
Nevertheless, the PtP indicator can also be calculated for other impact categories and indicators. However, in this study, the PtP indicator is calculated based on a result of the climate change indicator (CC), which was selected as an indicator of the category representing the long-term impact of production and its emissions on the climate [40].
Considering different sources of carbon emissions, the PtP indicator was also calculated using the following indicators: Climate Change (biogenic carbon), Climate Change (fossil), Climate Change (land use change).
To evaluate the impact on climate change, indicators were calculated following the Product Environmental Footprint Methodology 3.0. This methodology is recommended by the European Commission [41].

2.5. Uncertainty Analysis

To ensure the minimum uncertainty of a study and its conclusions, the consistent data should be collected, and alternative scenarios should be considered. In this study, four scenarios are assessed. The scenarios assumed that material recovery, energy recovery, and/or landfilling for 100% of all packing materials are describing the situations with limit values. On the other hand, the mixed scenario assumed values which were estimated based on the real situation in the Czech Republic and will probably be changed in the following years.
Therefore, to evaluate the uncertainty of the results of the mixed scenario, the Monte Carlo analysis was used. This tool analyses the consequences and results of random uncertainties of the normal or uniform probability distribution for some selected and independent parameters. Using random numbers from a defined interval for parameters, the Monte Carlo simulation can produce a mean value of the result and its standard deviation. The lower the standard deviation simulated, the more certain and robust the results [39].
In this study, the Monte Carlo simulations were set to the normal distribution of numbers in parameters of packaging waste management. Random values of parameters were examined in the intervals defined as the value of a parameter in the mixed scenario ±10%. The simulation was run in 1000 steps [39].

3. Results

The following tables show the results of the environmental assessment for the considered construction products and their packaging in four scenarios. In each table, the results of climate change indicators are presented for the product and four scenarios of waste packaging management. Based on these results, the results of the PtP indicator are presented in figures for each construction products.

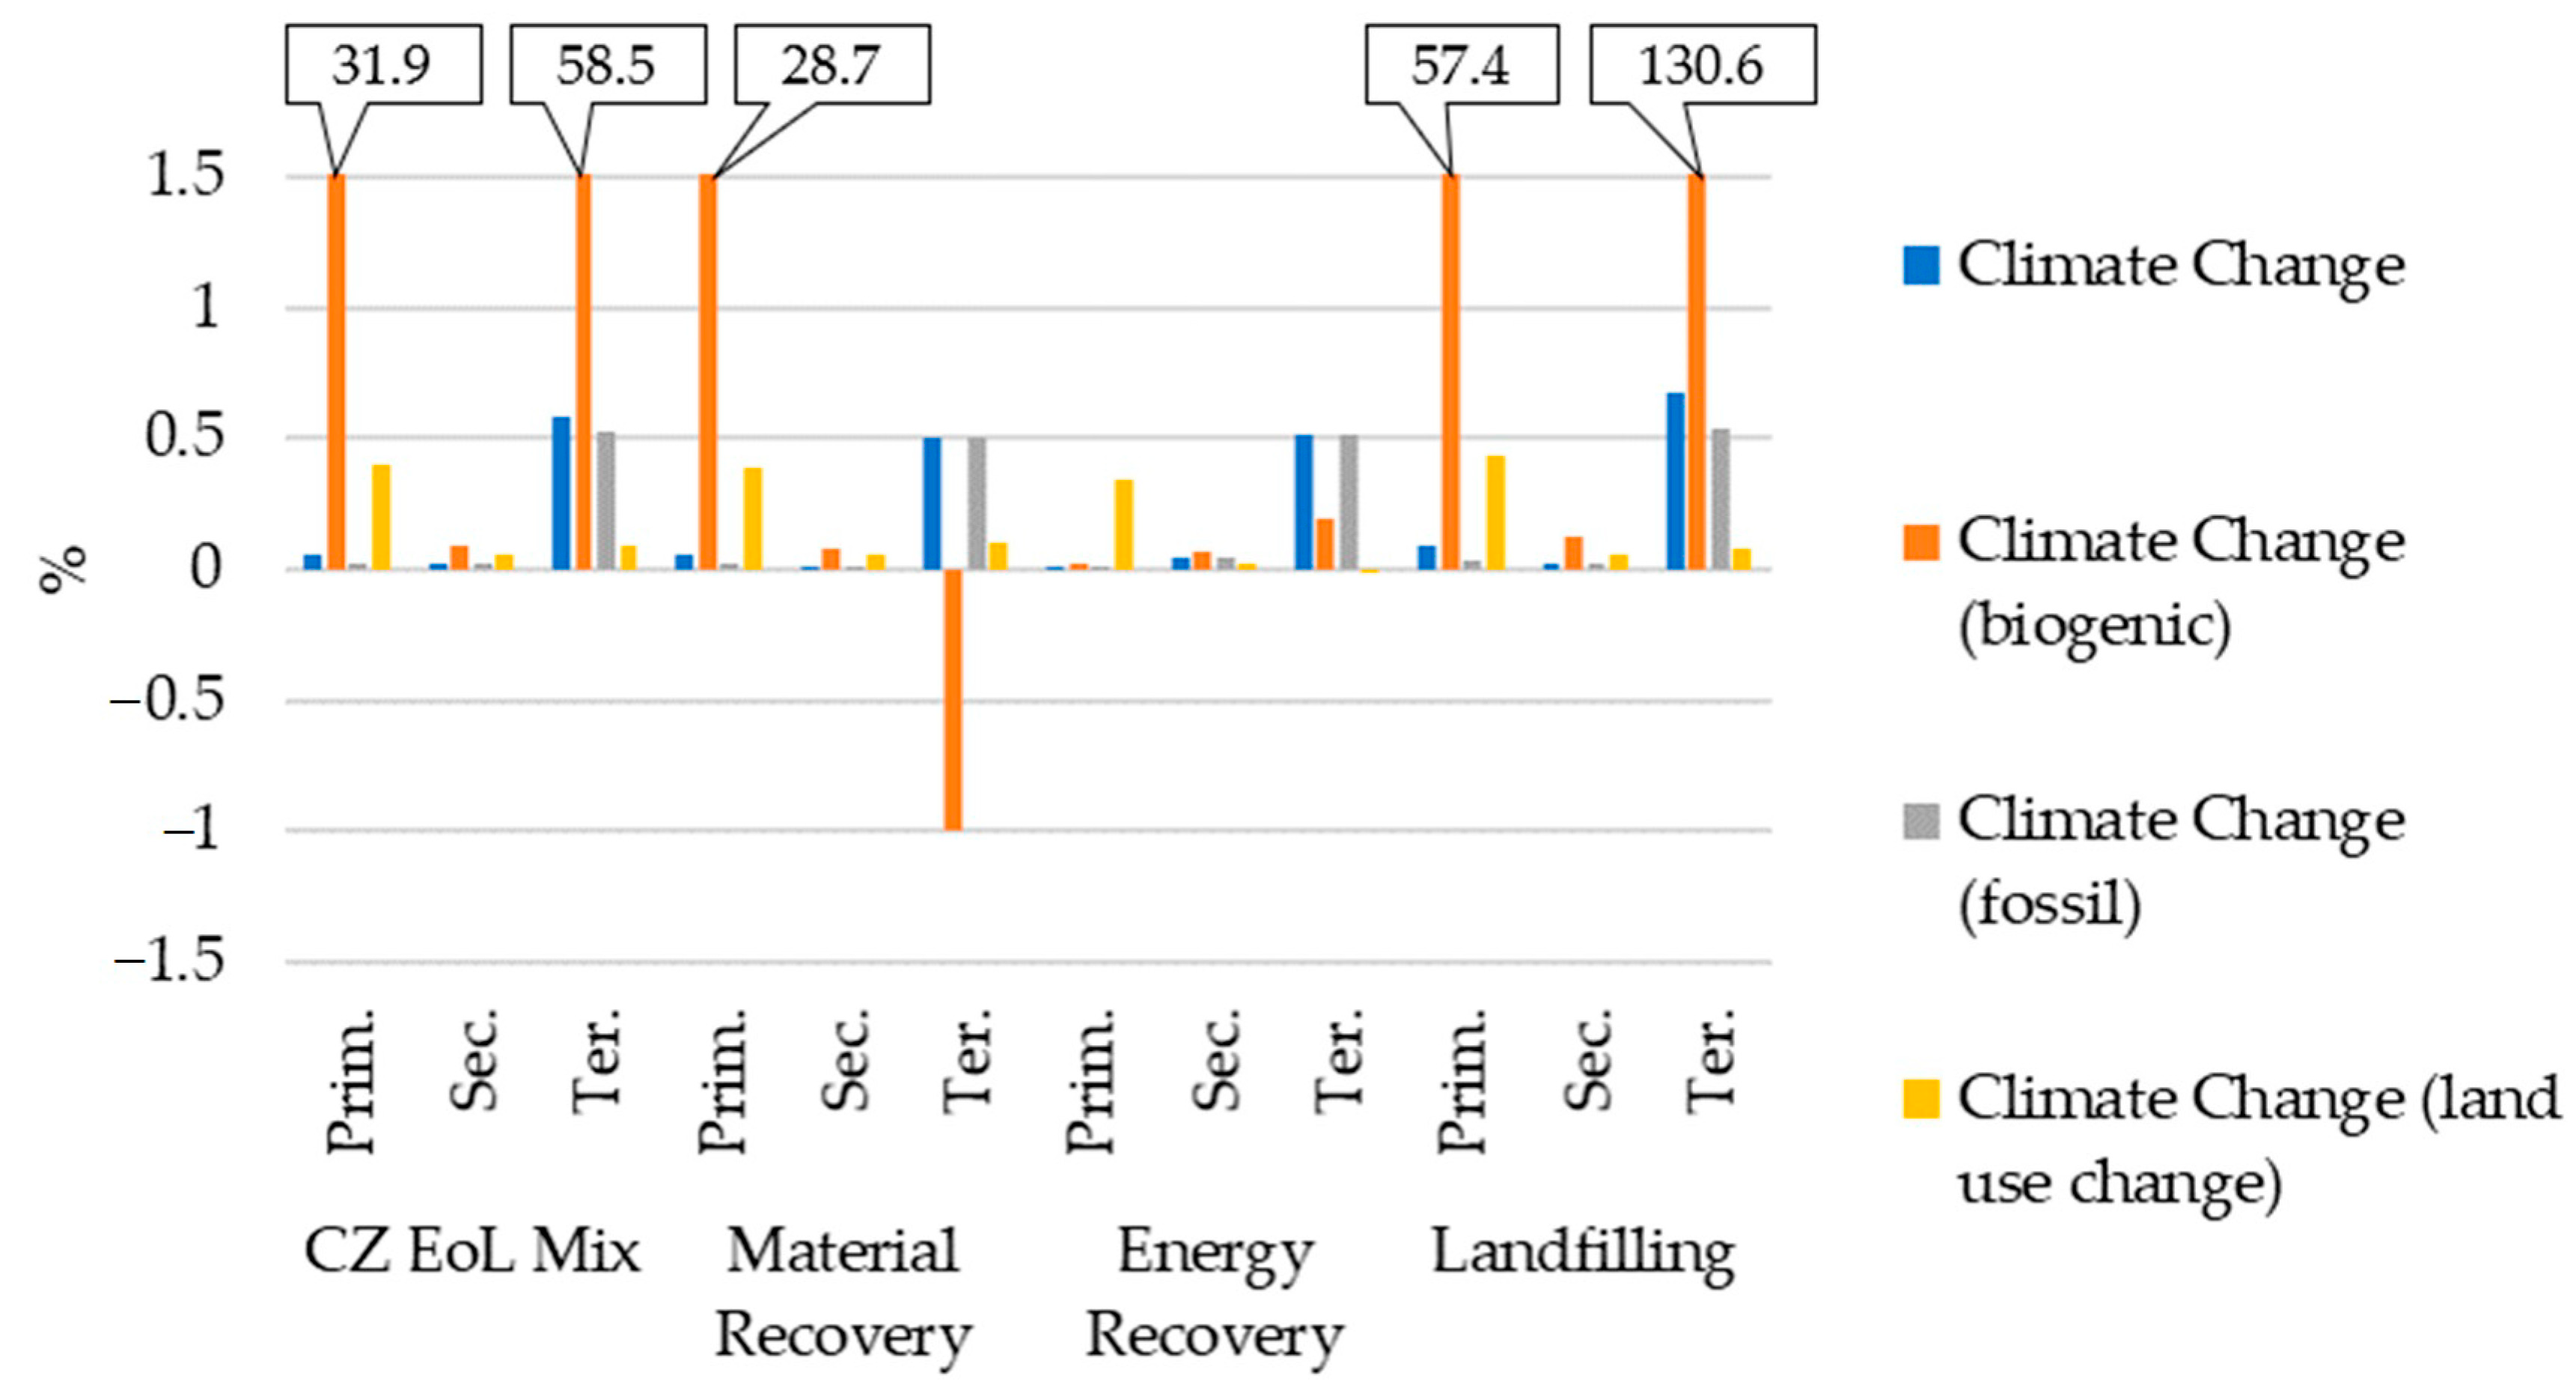
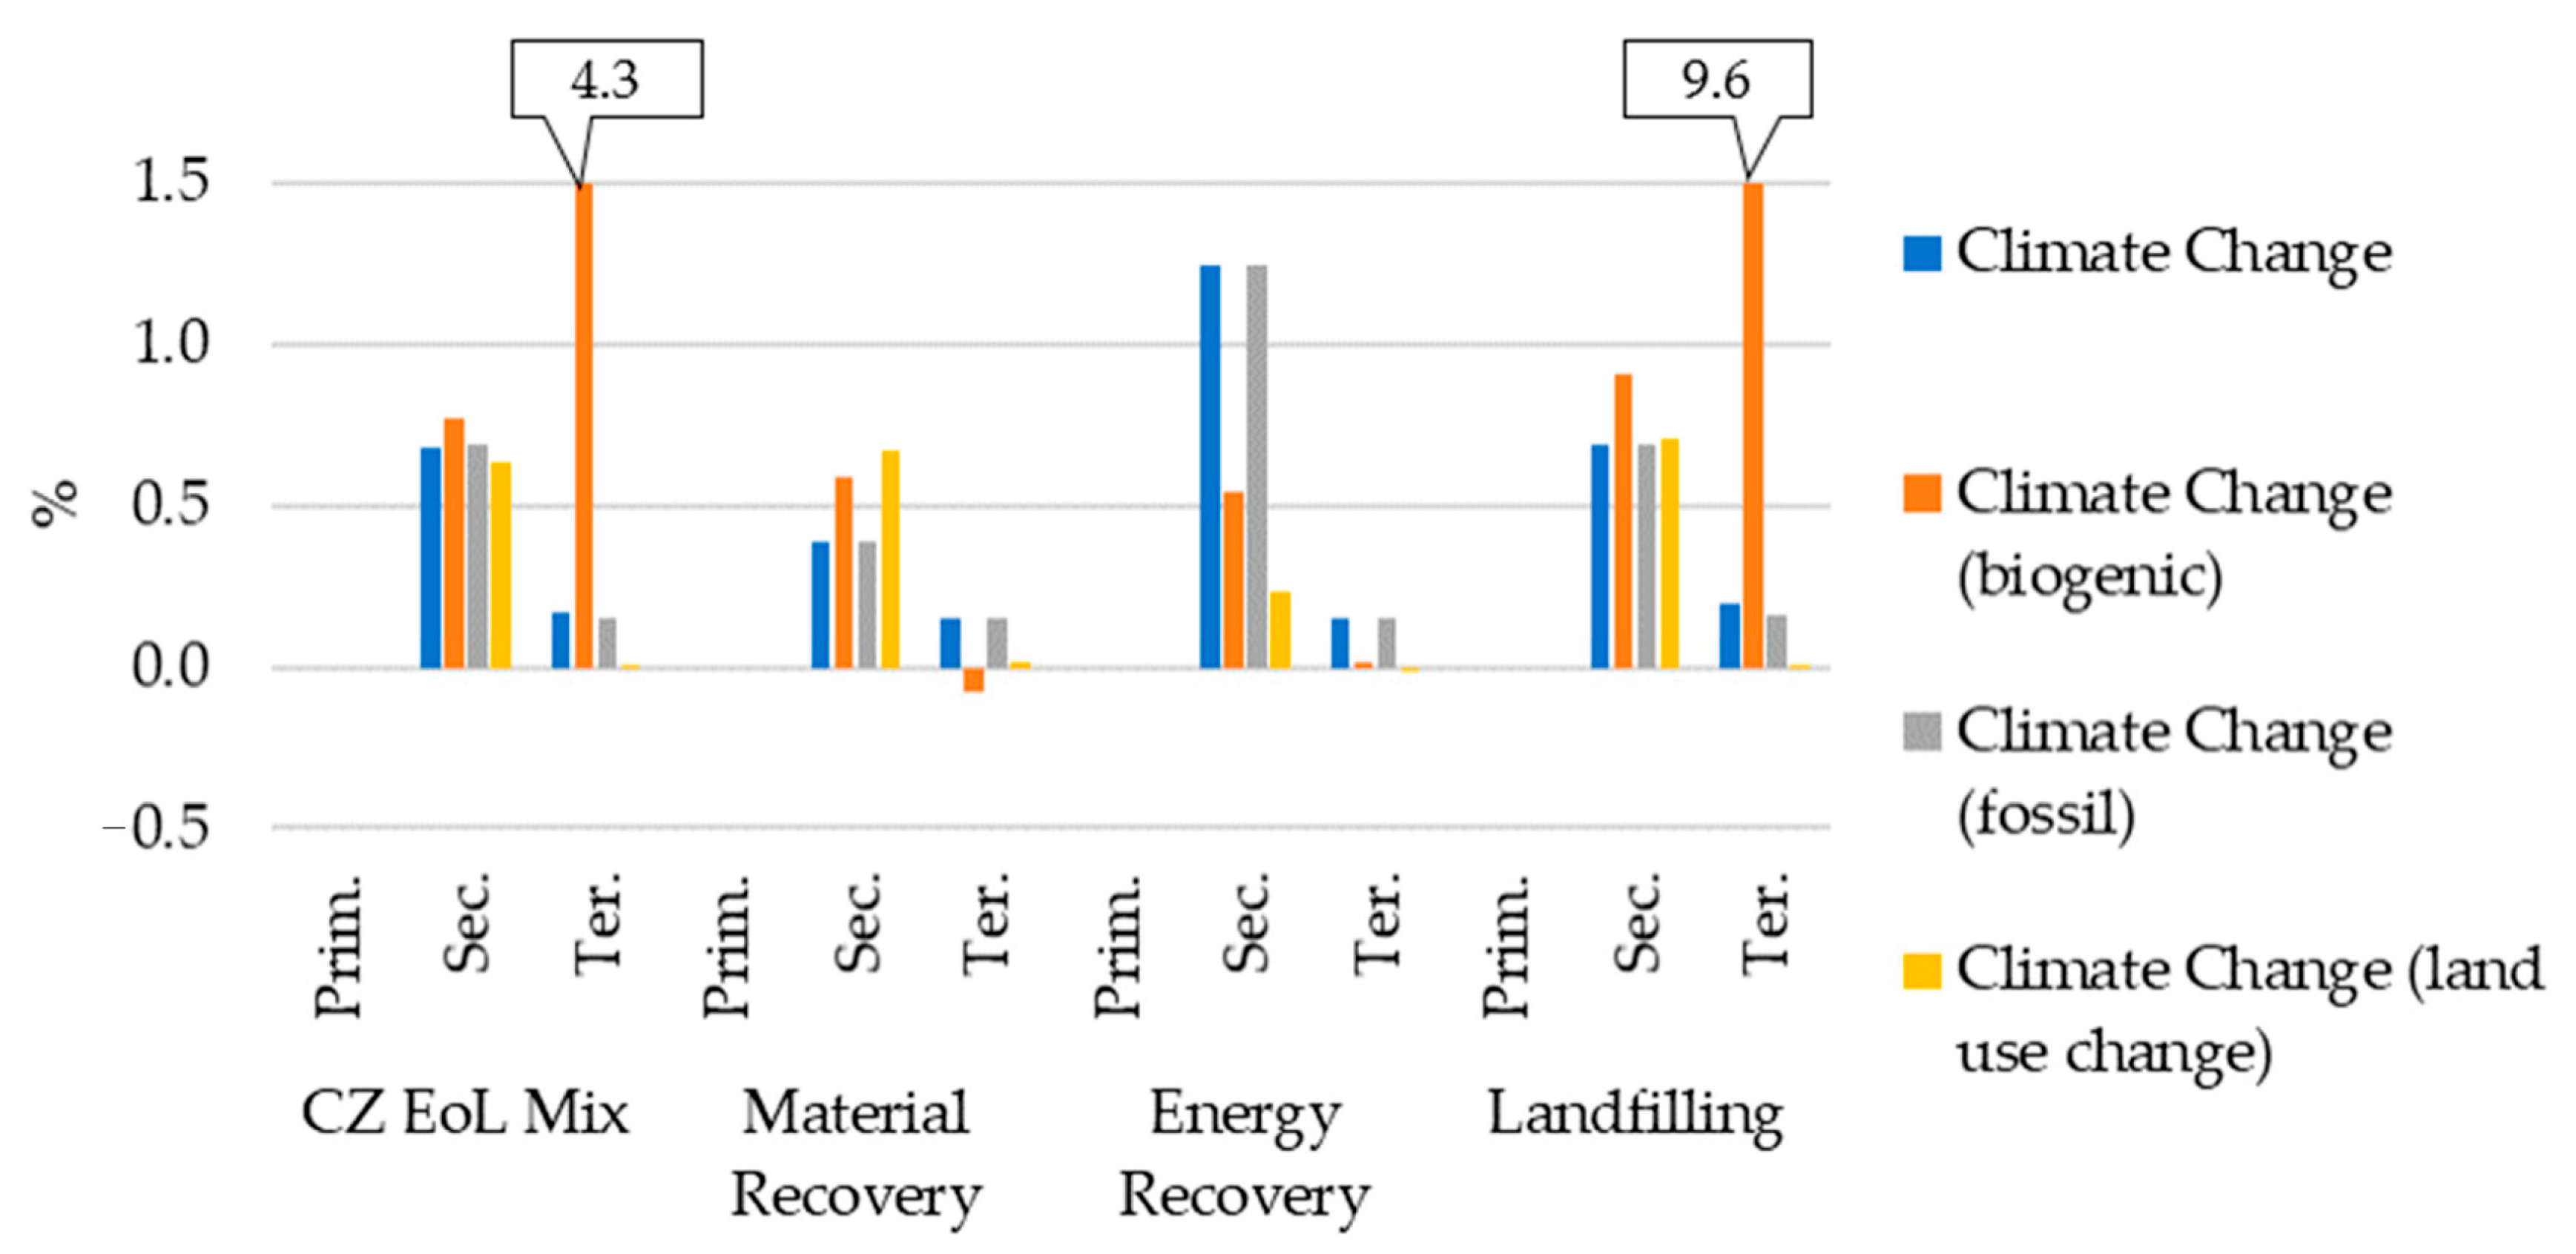
3.1. Aerated Concrete Block Element and Its Packaging

The results of the climate change indicator for the aerated concrete block are presented in Table 4, together with results for packaging in four scenarios. In this system, the primary packaging is not considered, but secondary and tertiary packaging caused impact according to this indicator. In all scenarios, HDPE foil as secondary packaging affects the impact more than tertiary packaging. The material recovery is the scenario with the lowest impact, even lower than the impact of the mixed scenario.
The total result of the climate change indicator for the aerated concrete block is 0.487 kg CO2 eq. The highest impact of packaging following this indicator is caused by secondary packaging in the scenario with energy recovery. The results of this packaging are influenced by the incineration of material.
On the other hand, the highest PtP result for the biogenic climate change is reached by tertiary packaging in the landfilling scenario (12.99%), followed by the PtP result of tertiary packaging in the mixed scenario (5.83%), as shown in Figure 2. Regarding the PtP results of biogenic carbon, the tertiary packaging in the material recovery scenario causes a beneficial impact (−0.09%). This beneficial impact presents the influence of growing wood for the wooden pallet, which absorbs atmospheric carbon by the growing of biomass.
The results of PtP for the total, fossil, and land use climate change indicators are below 1%.

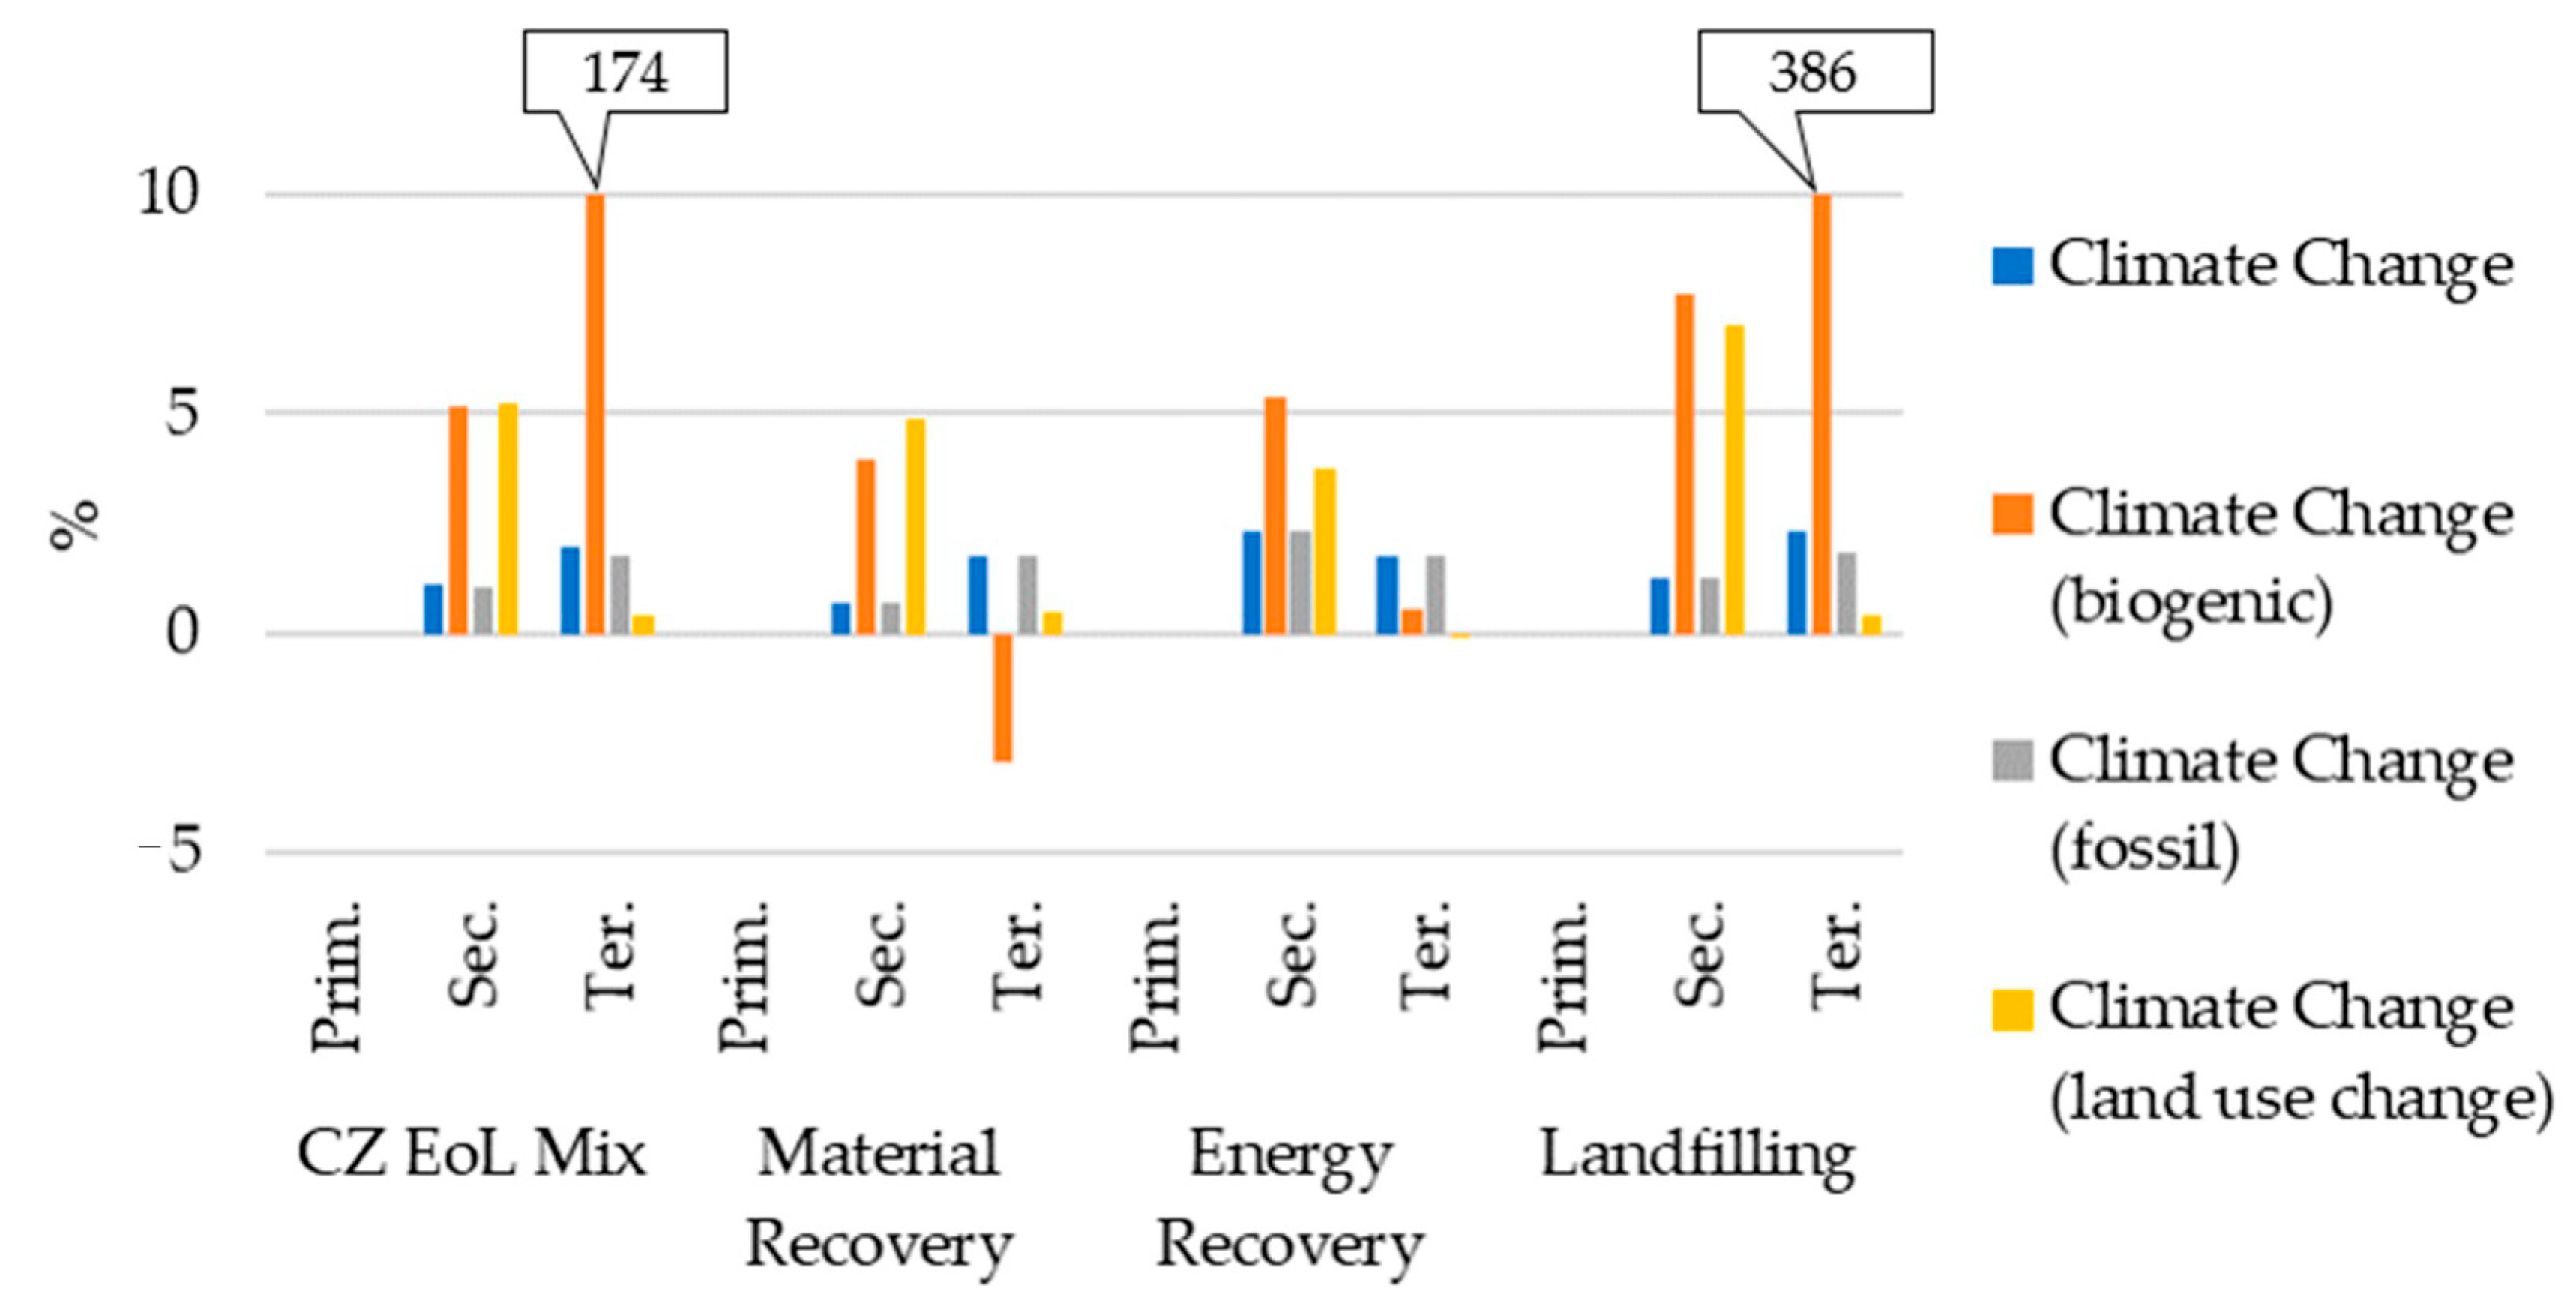
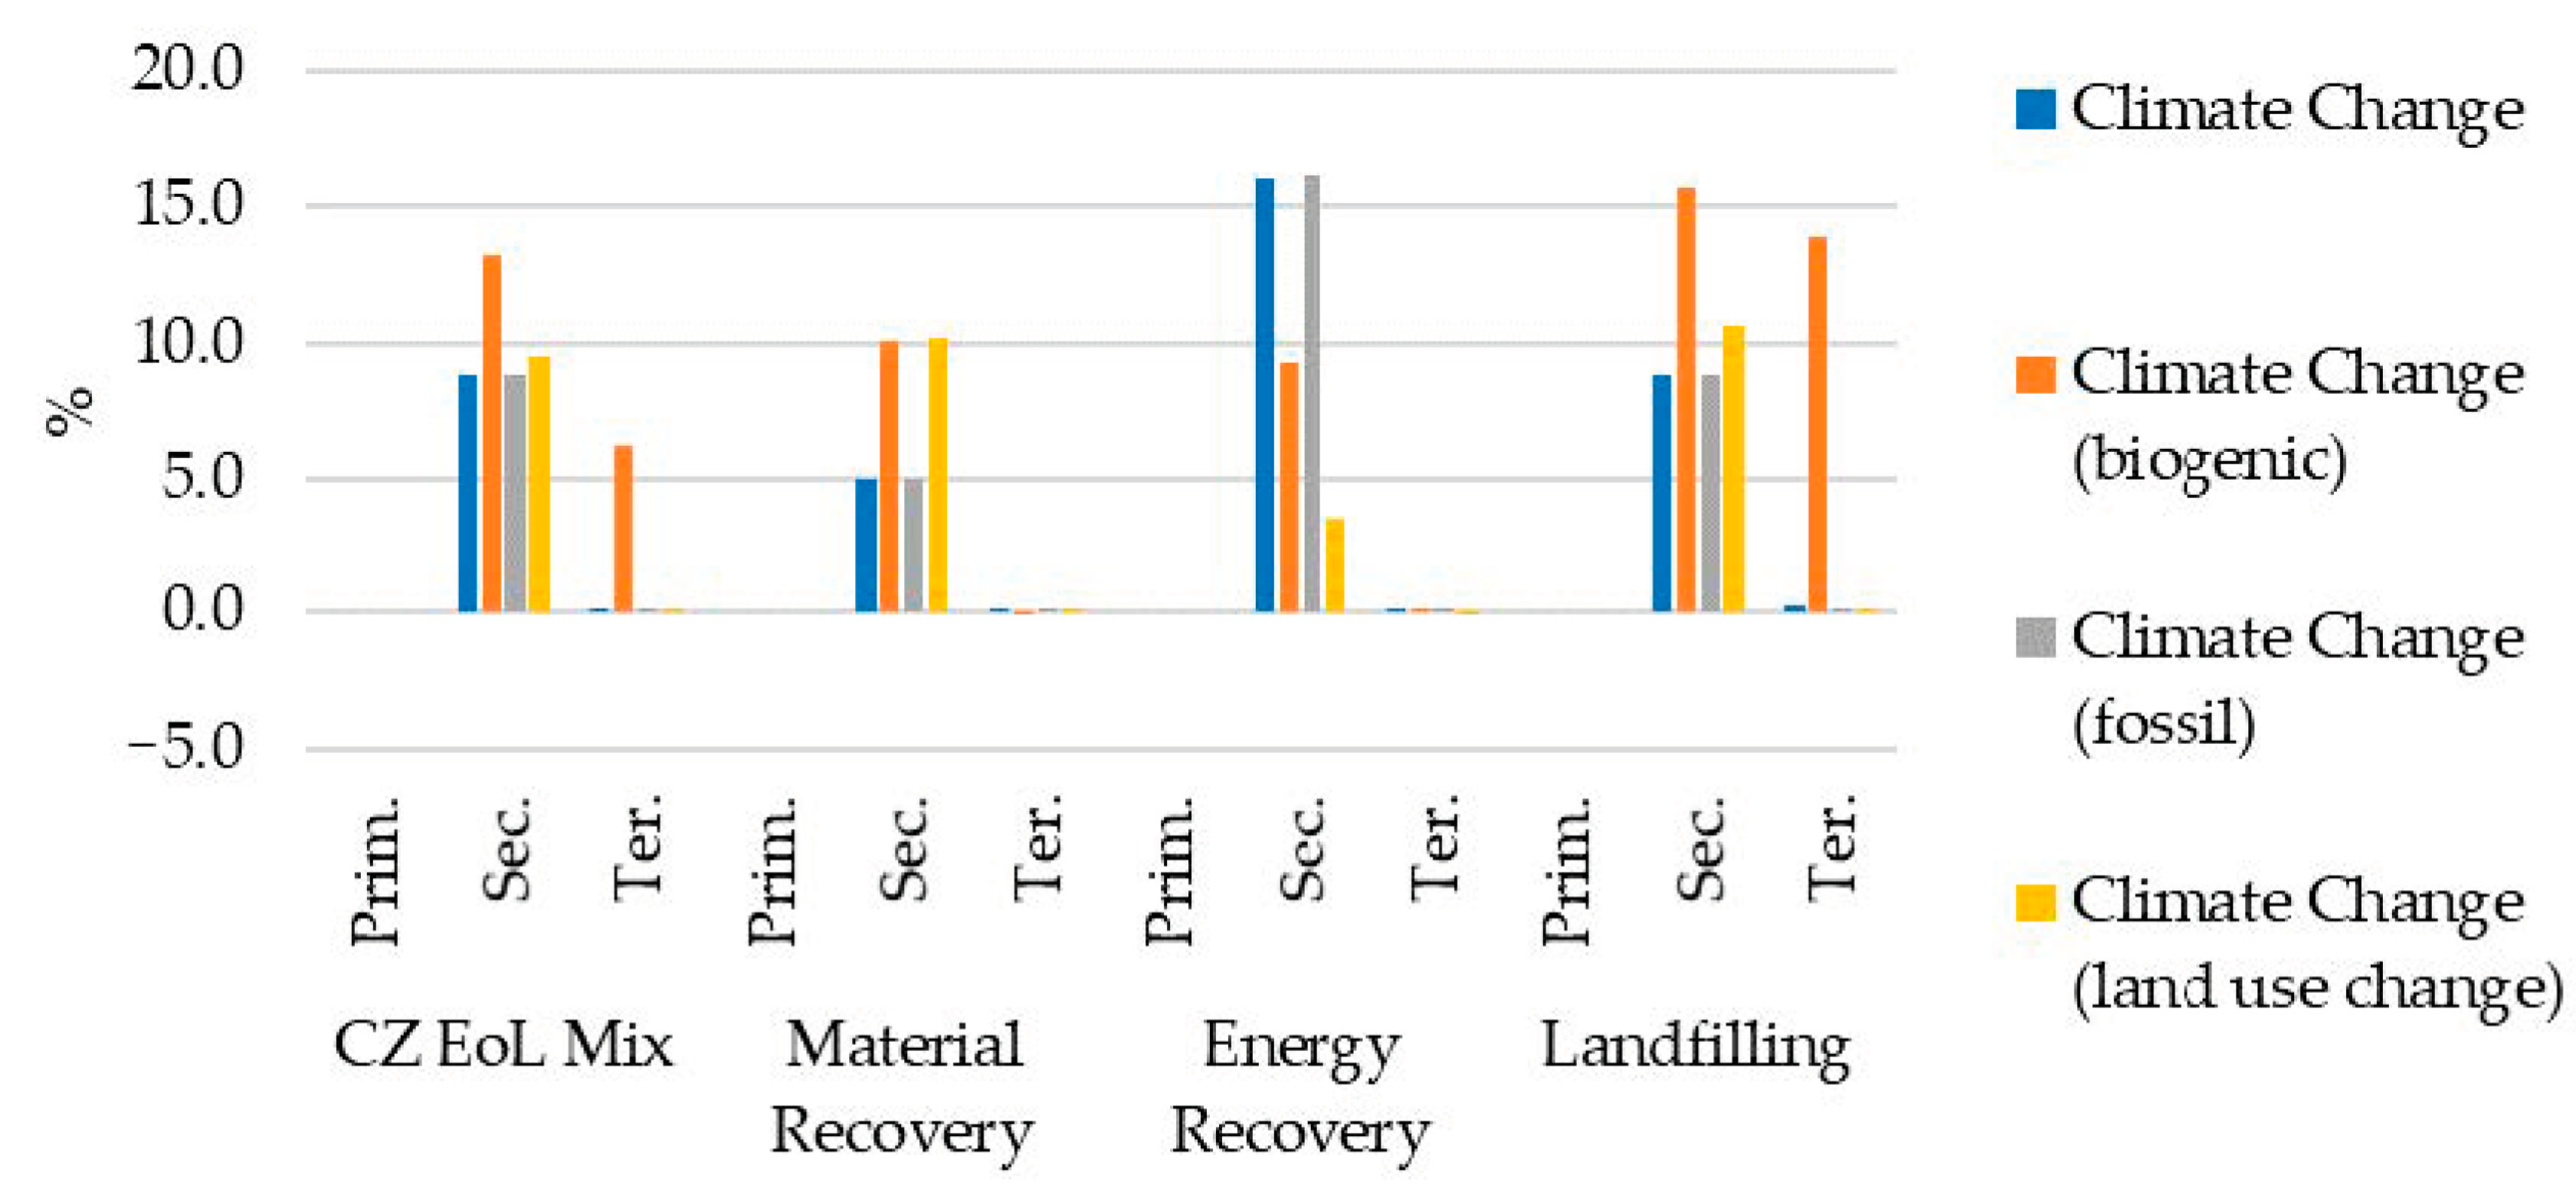
3.2. Expanded Polystyrene and Its Packaging

Expanded polystyrene is a product that uses primary, secondary, and tertiary packaging. Primary and secondary packaging (HDPE foil) are handled in the material recovery scenario with the lowest impact in the total climate change indicator, as shown in Table 5. Following the total climate change indicator, tertiary packaging (wooden pallet) is managed in the material recovery scenario, with a low but beneficial impact (−4.77 × 10⁻⁴ kg CO2 eq.). On the contrary, the highest impact according to the total climate change indicator is caused by packaging materials in the landfilling scenario. Meanwhile, the material recovery scenario is, for the considered packaging, the most preferable scenario.
Regarding the biogenic carbon, the landfilling scenario also has the highest value of the PtP indicator (705%), which is affected by emissions of biogenic processes in the landfill. Similarly, the mixed scenario reached a high value (317%), which corresponds to the proportion of waste disposed on a landfill in this mixed scenario. The results of the PtP indicators for expanded polystyrene are in Figure 3.
The beneficial result of PtP for the biogenic climate change indicator was reached by the wooden pallet in the material recovery scenario. Likewise, the beneficial result of PtP for the land use climate change indicator was reached by the wooden pallet in the energy recovery scenario. Both of these results represent the influence of wood as a material, which is assessed as beneficial for the bonding of carbon from the atmosphere.

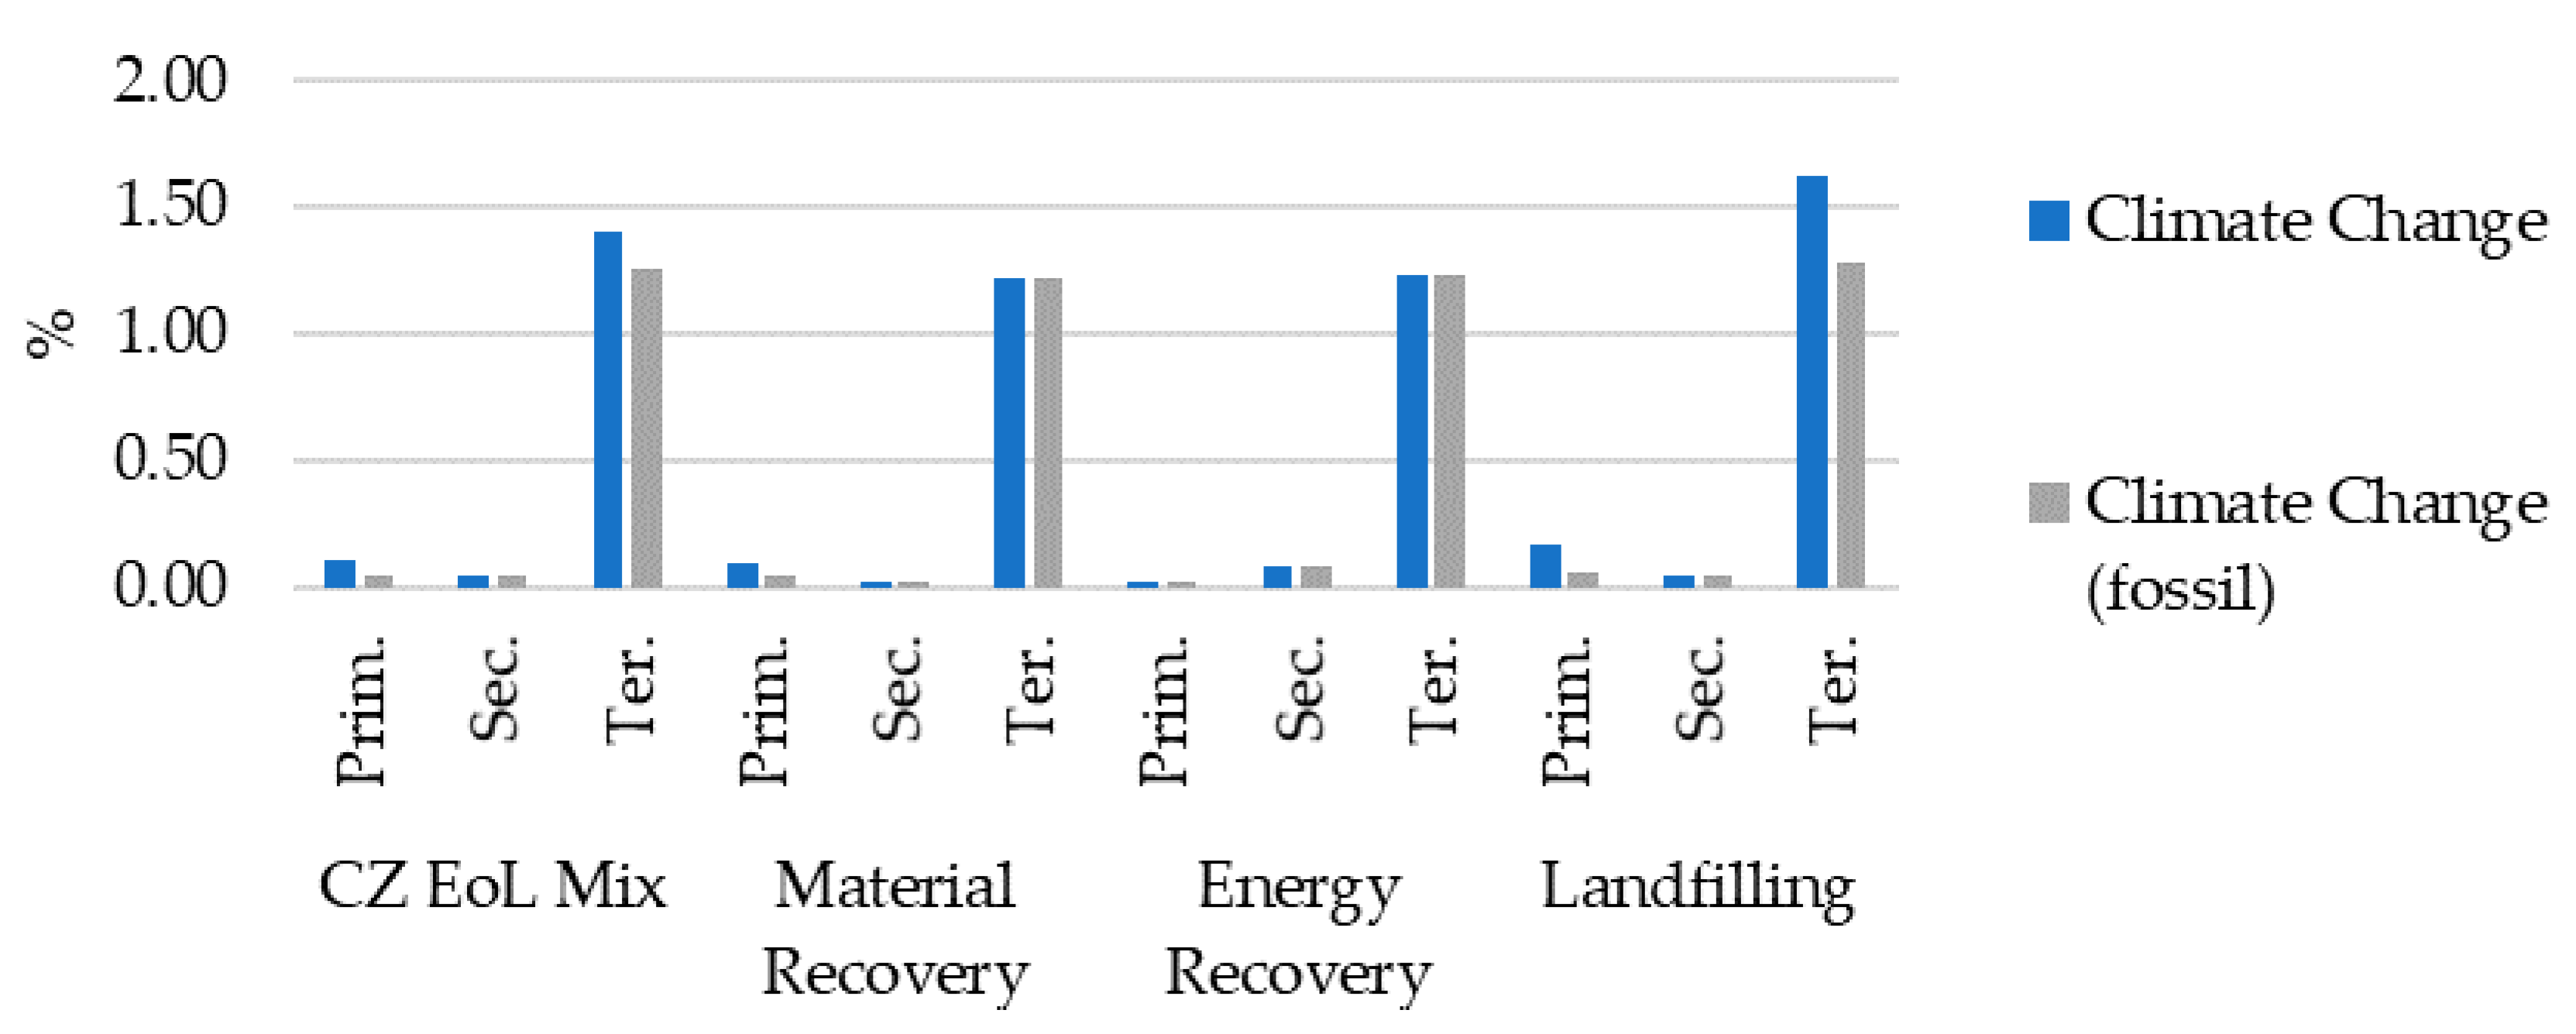
3.3. Gypsum Plasterboard and Its Packaging

The results of the assessment of packaging for the gypsum plasterboard are in Table 6. In this system, only the tertiary packaging (wooden pallet) is assumed. Thus, the results for primary and secondary packaging are not calculated.
As in the previous results, the effect of wood as material bonded biogenic carbon is described here. For this packaging material, the material recovery scenario is the most preferable scenario according to the total climate change indicator. The same effect is represented by the results of PtP, which are shown in Figure 4.

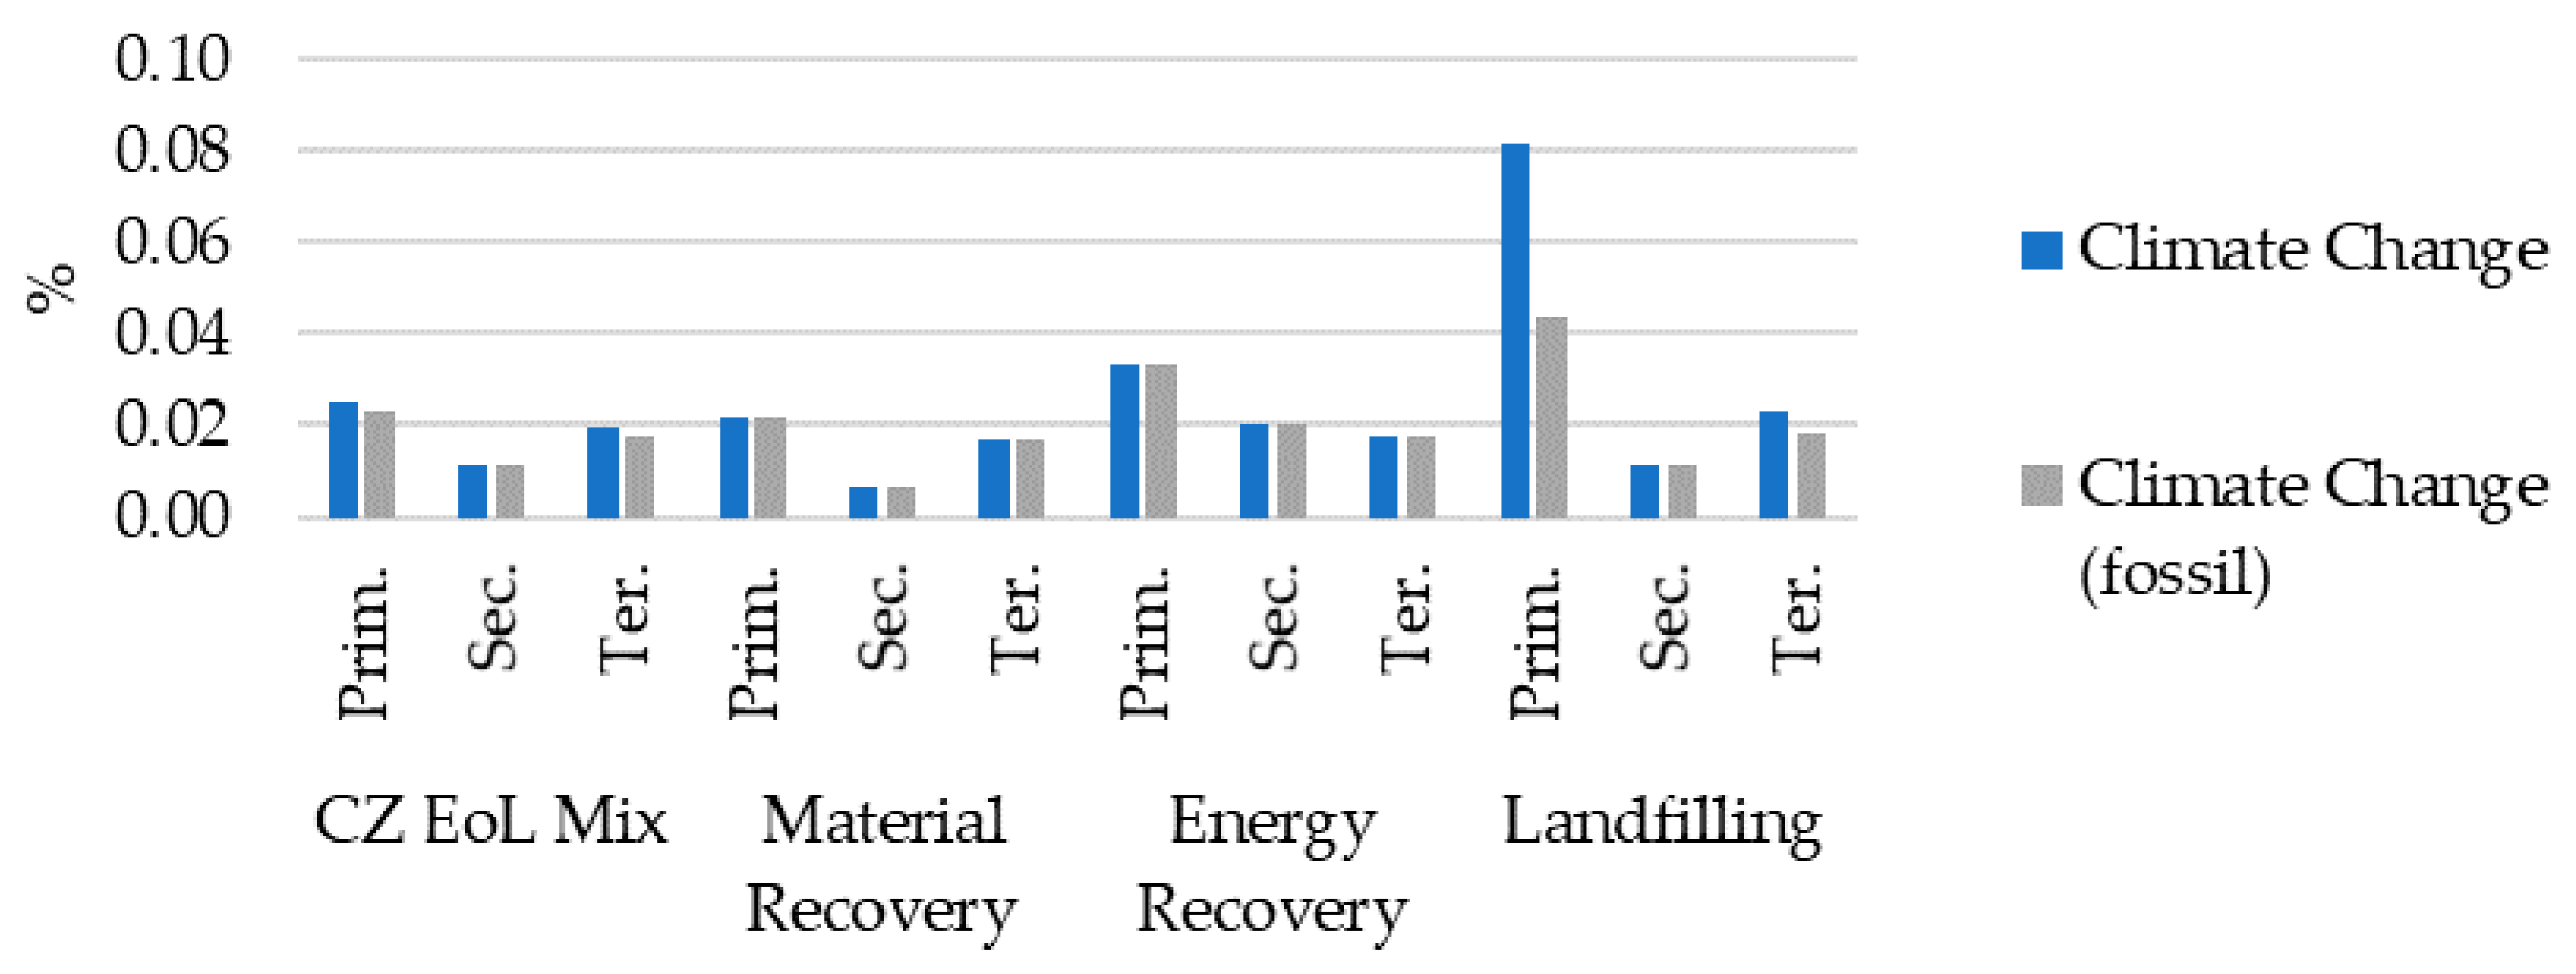
3.4. Cement and Its Packaging

Cement, as a product of calcination, of clinker, is produced with a high amount of emissions of carbon dioxide. In this system, the following packaging materials are considered: paper bag, HDPE foil, wooden pallet. The result of the total climate change indicator for 1 kg of cement is 0.82 kg CO2 eq. The major source of this carbon dioxide is fossil carbon, according to the fossil climate change indicator, as shown in Table 7. The result of the fossil climate change indicator is affected mostly by the emission of carbon dioxide from calcination.
On the other hand, the impact of biogenic carbon is almost marginal in the comparison with the emission of fossil carbon dioxide. Therefore, as shown in Figure 5, the result of the PtP indicator for biogenic carbon is relatively high for primary and tertiary packaging. In the landfilling scenario, the PtP (biogenic) result for the wooden pallet is 130% and for the paper bag is 57%. Also in the mixed scenario, the wooden pallet reached 57%, and the PtP (biogenic) result for the paper bag is 31%.
Regarding the total climate change indicator, the energy recovery scenario is the most favourable for the removal of primary packaging. Contrary to this, secondary and tertiary packaging should be handled by the material recovery scenario. In the comparison of the summarized impact of packaging, these two scenarios have the lowest impact. The mixed scenario, which represents the combination of the removal approaches, caused higher summarized damage to the environment and is thus not appropriate for this system.

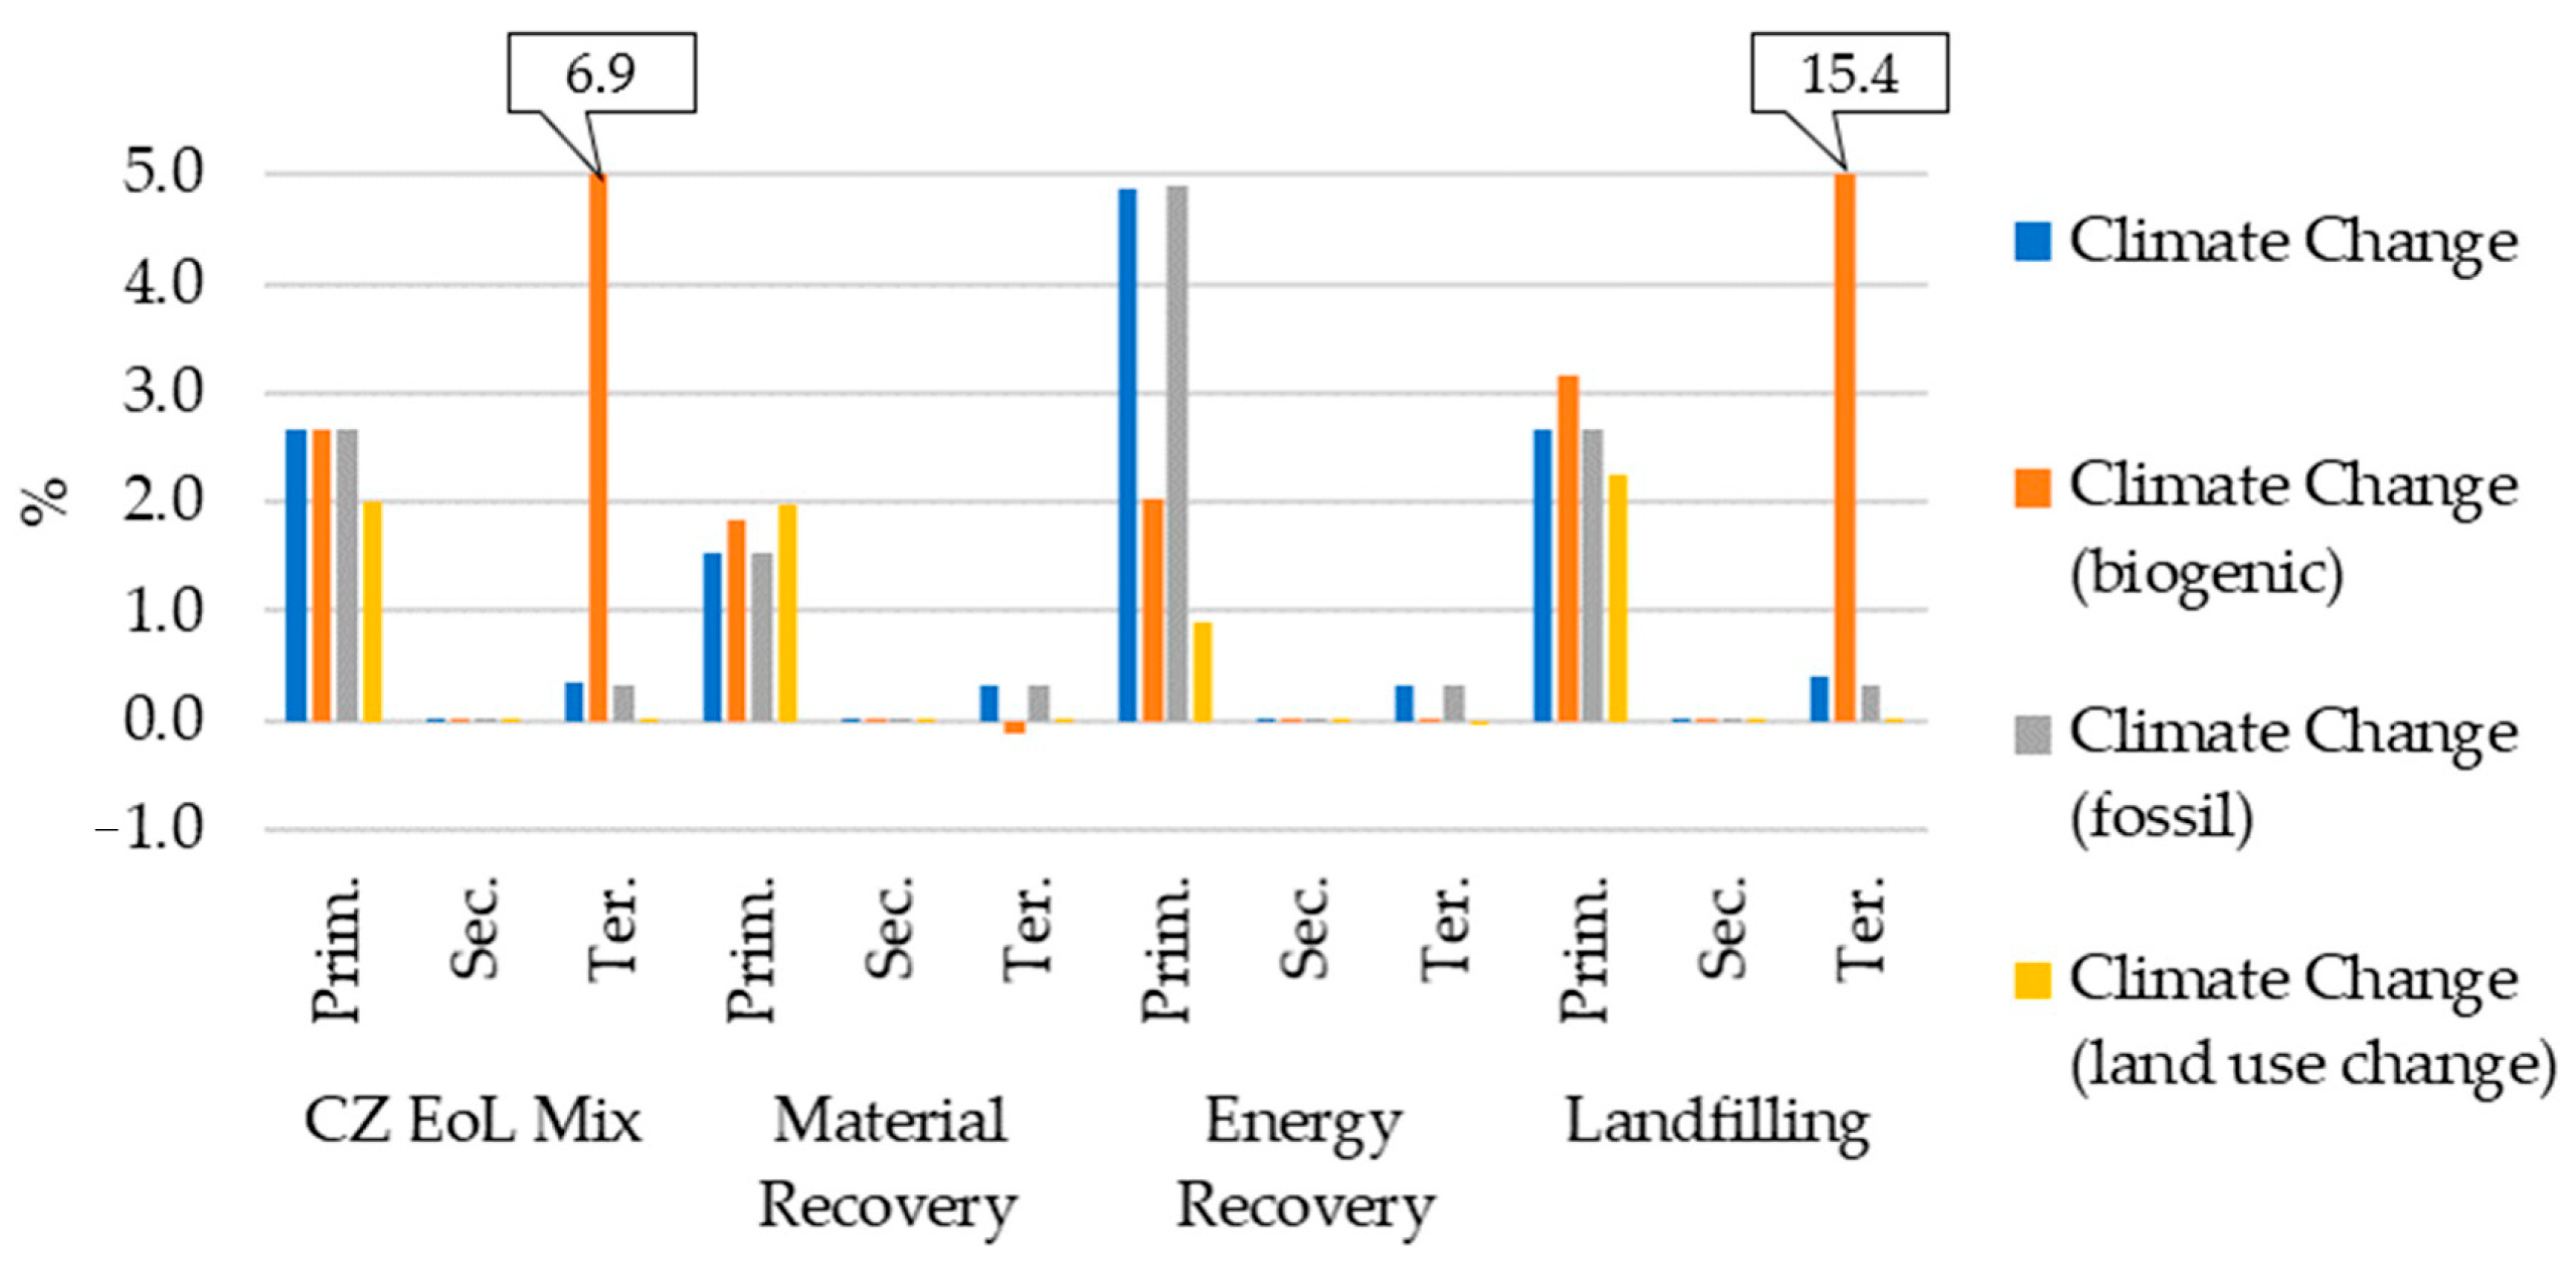
3.5. Clay Brick and Its Packaging

The clay brick is packed with LDPE, and wooden pallets are used as tertiary packaging. Primary packaging is not considered in this system. The results of the impacts are shown in Table 8.
The LDPE foil was handled in four scenarios, and the energy recovery scenario has the highest impact according to the total climate change indicator (0.00543 kg CO2 eq.). Following this indicator, the managing of wooden pallets reached the highest impact in the landfilling scenario (0.00542 kg CO2 eq.). However, in the summarized results of these two packaging materials, the energy recovery scenario caused the highest impact.
The results of the PtP indicators are shown in Figure 6. As in the previous results, the PtP (biogenic) result is high for a wooden pallet in the landfilling scenario (386%) and the mixed scenario (174%).

3.6. Ceramic Facade Panel and Its Packaging

Ceramic facade panels are protected by cardboard and HDPE foil and transported on a wooden pallet. The results of the impacts for the ceramic facade panels and their packaging are shown in Table 9. For calculation of impacts, the model of Ceramic facade panel from GaBi database was used [38]. In this model, neither the emissions from a biogenic source of carbon dioxide nor carbon dioxide emissions from land use are assumed. Therefore, only the results of PtP for the total climate change indicator and fossil climate change are expressed in Figure 7.
According to the climate change (total) indicator, carboard as primary packaging is managed with the lowest impact in the material recovery scenario (2.42 × 10⁻⁴ kg CO2 eq.). On the contrary, the landfilling scenario causes the highest impact (9.23 × 10⁻⁴ kg CO2 eq.). These results are affected by the cardboard containing the carbon from biomass, as well as by the wooden pallet and the paper bag. The material recovery scenario also reached the lowest summarized impact for all packaging materials in this system.
The cardboard handled in the landfilling scenario reached the highest results of the PtP indicator (0.08%), but the contribution of all packaging in this system is rather marginal. This is also affected by the weight of packaging materials, which were assumed for ceramic facade panels. The weight of packaging materials per 1 kg of product is the lowest among the considered construction products.

3.7. Paint Emulsion and Its Packaging

The PP foil, HDPE foil, and wooden pallet were assumed as packaging materials for the paint emulsion. The comparison of their impacts is presented in Table 10. The result of the climate change (fossil) indicator for 1 kg of paint emulsion is 1.94 kg CO2 eq., and it represents the main contribution to the climate change (total) indicator (1.95 kg CO2 eq.).
According to the climate change (total) indicator, primary packaging has the highest effect on the impact of each scenario. Thus, the energy recovery scenario reached the highest impact, because it is the worse approach to handle the waste PP foil. On the contrary, the material recovery scenario is the most favourable scenario for this system, because it is also the most favourable way to remove the PP foil. The influence of the PP foil is based on the amount of foil needed for packaging (20.2 g per 1 kg of product).
Regarding the PtP (biogenic) indicator, the wooden pallet reached the highest result in the landfilling scenario (15.4%) and the mixed scenario (6.9%). Following the climate change (total) indicator, the primary packaging caused 4.8% of the result of the product in the energy recovery scenario. The results of the PtP indicator are expressed in Figure 8.

3.8. Mineral Wool and Its Packaging

In this study, the HDPE foil was assumed as secondary packaging for the mineral wool, combined with wooden pallet as tertiary packaging. The primary packaging was not considered in this study. The results of the impacts of mineral wool and its packaging are in shown in Table 11.
Following the results of the climate change (total) indicator, secondary packaging caused a higher impact than tertiary packaging in this system. According to the summarized results of this indicator, the energy recovery scenario is the worst, and the material recovery scenario is the most preferable.
The wooden pallet as tertiary packaging reached the highest results of the PtP (biogenic) indicators, i.e., in the landfilling scenario (9.6%) and in the mixed scenario (4.3%). The other results of the PtP indicators are expressed in Figure 9.

3.9. Roof Tile and Its Packaging

As in the packaging system of mineral wool, roof tiles are packaged using HDPE foil and a wooden pallet. The results of this system are shown in Table 12. In this system, the summarized result of the climate change (total) indicator confirms that the energy recovery scenario caused the highest impact and the material recovery scenario is suitable for this system.
In this system, the packaging materials reached a high value of the PtP indicators (total, biogenic, fossil, and land use change) and are expressed in Figure 10. The contribution of HDPE foil was calculated as 8–15% (based on the selected indicator) in the mixed scenario and the landfilling scenario. In the energy recovery scenario, HDPE foil contributes 8–16% (based on the selected indicator). Furthermore, the effect of the wooden pallet cannot be neglected. Tertiary packaging reached almost 14% using the climate change (biogenic) indicator.

3.10. Mineral Reinforcement Mortar and Its Packaging

The considered system with the mineral reinforcement mortar assumed the paper bag as primary packaging, HDPE foil as secondary packaging, and the wooden pallet as tertiary packaging. The results of the impacts are described in Table 13. The model of mortar from the GaBi database [38] was used. In this model, no sources of biogenic carbon and carbon oxide emissions from land use change were assumed. Thus, the results of climate change (biogenic, land use change) were not calculated.
Following the results of the climate change (total) indicator, the wooden pallet caused the highest impact in each scenario. Regarding the summarized results of this indicator, packaging materials are handled with the highest impact in the landfilling scenario, and the material recovery scenario causes the lowest impact.
The influence of the wooden pallet is also notable in the results of the PtP indicators, which are shown in Figure 11. In the landfilling scenario, the wooden pallet reached 1.6% as a result of the PtP (total) indicator and 1.3% as a result of the PtP (fossil) indicator. In other scenarios, the PtP (total) results of the wooden pallet were calculated in the range 1.2–1.6%.

3.11. Results of Monte Carlo Analysis

To test the robustness of the study, the Monte Carlo Analysis was performed focusing on the mixed scenario. This scenario was selected as a scenario representing the estimated state in the Czech Republic and also includes other waste management strategies.
For each production system, the mean value of the climate change indicator was calculated, and the standard deviations were estimated. The mean values and standard deviations are presented in Table 14. The mean values represent the results of the production systems, which include the production of 1 kg of product and the production and removal of its packaging materials.
The standard deviation for most of the scenarios is below 0.1%. This shows that the consequence of the change of input data about packaging materials in range ±10% can be neglected.
Only in the roof tile production system was the standard deviation higher (0.13%). This reflects the high impact of used packaging per 1 kg of product. In addition, the results of the PtP indicators are high in different scenarios. However, this probable consequence of the parameter change will not affect the conclusions of this study. On the other hand, it points to the production system, in which the packaging materials have a relatively higher influence on the impact of the whole system.

4. Discussion

The report published by WRAP in the field of building waste management compares different scenarios for the removal of this type of waste. However, it also estimates that 34% (vol.) of the waste on a building site is waste packaging, and that 60% of wooden pallets are removed as unusable waste [42]. This waste management approach was also tested in this paper for wooden pallets and other products.
In this paper, the environmental impacts of 10 construction products and their packaging were assessed using four end-of-life scenarios for packaging: the landfilling scenario, the scenario with material recovery, the scenario with energy recovery, and the mixed scenario. Although the impact of the waste management scenario is relatively low regarding the impact of the production of 1 kg of the construction product, the most preferable approach can be found for each considered system. Regarding the results of the climate change (total) indicator, the most preferable approach for the most considered system is the material recovery scenario. On the other hand, the landfilling scenario causes the highest impact of packaging in most cases, and the results of the incineration scenario represent the highest impact in the waste management of packaging in four systems (aerated concrete block, paint emulsion, mineral wool, roof tile), which are assumed to use HDPE foil and wooden pallet as packaging materials. Furthermore, the mixed scenario as a combination of these approaches is neither the most favourable nor the worst scenario for any of the considered products. Mostly, it is affected by the high proportion of landfilling in this scenario.
Each material has its preferable scenario, in which its impact is the lowest. The environmental impacts of packaging can be compared regarding their material composition. Such an approach was used for the packaging materials in the previous study [43]. Following the results of the climate change (total) indicator, the best scenario for the wooden pallet is the material recovery scenario. On the contrary, energy recovery was proposed in previous studies as a removal with low impact [11]. Besides, the landfilling scenario reached the highest impacts for this packaging material. In the waste management of the HDPE foil, the material recovery scenario causes the lowest impact, and the impact of the energy recovery scenario is the highest for this material. Paper and cardboard are used in three production systems (cement, ceramic facade panel, and mineral mortar). Paper bags are removed with the lowest impact in the energy recovery scenario, and the material recovery scenario is the most suitable approach for the removal of cardboard. LDPE foil and PP packaging are preferentially handled in the material recovery scenario.
The impact of packaging is expressed using the PtP indicator, which is related to the impact of packaging on the impact of the production of 1 kg of the product. In the comparison with the previous study focusing on the PtP indicator for the food processing industry, the results of the PtP indicator for construction products are relatively lower. This is affected by the high impact caused by 1 kg of construction product and the low weight of the packaging. For example, the maximal load of a wooden pallet is in the range of 1500 to 2000 kg of construction products, and it can be used multiple times. Despite this, the wooden pallet reached high results of the PtP (biogenic) indicator mainly in the landfilling scenario for several construction products (expanded polystyrene, gypsum plasterboard, cement, clay brick). These products were modelled with low impact in the climate change (biogenic) indicator.
The use of the PtP indicator was appropriate for the systems with roof tiles, mineral mortar, and paint emulsion, where the packaging materials are associated with a relatively higher impact. In these systems, the results of the PtP indicator can be used to reduce the environmental impact of the production system using suitable waste management. For example, the material recovery of waste from packaging in the system with roof tile will reduce the impact of all considered systems, as shown in Figure 10. Furthermore, the PtP result can be used to determine the packaging, whose further optimization should be performed to reduce the environmental impacts. For example, in the paint emulsion system, the primary packaging caused a significantly higher impact than the other kinds of packaging. According to these results, the PtP can be appropriate to certain construction products.

Study Limitation

The study may be limited by the data about the production processes of products and by the input data about packaging. General production processes from the Gabi database [38] were used, and input data about packaging were estimated based on the market research. The study and its conclusions and results should be interpreted in light of this limitation.
For the purpose of tracking the source of carbon dioxide emissions, the Environmental Footprint methodology, version 3.0, was used, and the study focused on the results of the climate change indicator as a representative indicator, which attracts a great deal of attention nowadays. The conclusions of the study are limited by this indicator, and further research is needed on other impact categories.

5. Conclusions

The LCA was performed, and the PtP indicator was calculated for 10 construction products and their packaging. The environmental impacts expressed using the climate change indicator were modelled using four scenarios. For most products, the material recovery scenario was the most suitable. Compared to that, the landfilling scenario reached the highest impact for most of the products. The scenario with energy recovery was preferable for handling the paper bag packaging. As a combination of these three scenarios, the mixed scenario was modelled to represent the estimated state of removal in the Czech Republic. Considering the results of the impacts for each packaging material, it can be concluded that it is appropriate to manage packaging materials in different scenarios.
The Monte Carlo analysis was used to test the robustness of the study, and it also shows that roof tiles are products whose packaging has a significant influence on the impact of the whole system.
The conclusions of this study are limited by the Product Environmental Footprint Methodology, version 3.0, which was used to analyse the impacts of using the climate change indicator as a base to calculate the PtP indicator. However, the results of the PtP indicators point to packaging materials in the considered system, which should be further investigated to reduce the environmental impacts of waste packaging management on a building site. Moreover, the PtP indicator was confirmed as a useful indicator to analyse the environmental impacts of construction products.

Author Contributions

Conceptualization, J.P. and M.Š.; methodology, J.P. and M.Š.; investigation, J.P. and M.Š.; writing—original draft preparation, J.P.; supervision, V.K.; project administration, J.P. All authors have read and agreed to the published version of the manuscript.

Funding

This research received no external funding.

Acknowledgments

This work was supported by the grant of Specific university research—Grant No. A1_FTOP_2020_004 and the grant of Specific university research—Grant No. A2_FTOP_2020_008, and received the institutional support of the University of Chemistry and Technology of Prague, with the project Innovative and additive manufacturing technology—New technological solutions for 3D printing of metals and composite materials, reg. no. CZ.02.1.01/0.0/0.0/17_049/0008407, financed by the Structural Founds of the European Union.

Conflicts of Interest

The authors declare no conflict of interest.

References

  1. EU Construction and Demolition Waste Protocol and Guidelines. Available online: https://ec.europa.eu/growth/content/eu-construction-and-demolition-waste-protocol-0_en (accessed on 10 January 2020).
  2. Pericot, N.G.; Sáez, P.V.; Merino, M.D.R.; Carrasco, O.L. Production patterns of packaging waste categories generated at typical Mediterranean residential building worksites. Waste Manag. 2014, 34, 1932–1938. [Google Scholar] [CrossRef] [PubMed]
  3. Muthu, S.S.; Li, Y.; Hu, J.Y.; Mok, P.Y. An Exploratory Comparative Study on Eco-Impact of Paper and Plastic Bags; Textile Bioengineering and Informatics Symposium Proceedings, Vols 1 and 2; Hong Kong Polytechnic University: Kowloon, Hong Kong, 2009; ISBN 977-1-94234-300-5. [Google Scholar]
  4. Tichá, M. Environmental Assessment of The Milk Life Cycle: The Effect of Packaging Selection and The Variability of Milk Production Data. Porovnání evironmentálních dopadů nápojových obalů v ČR metodou LCA. 2009. Available online: https://is.muni.cz/el/1431/jaro2015/Bi6920/um/LCA_napojove_obaly_zaverecna_zprava.pdf (accessed on 10 October 2020).
  5. Xie, M.H.; Qiao, Q.; Sun, Q.H.; Zhang, L.L. Life cycle assessment of composite packaging waste management-a Chinese case study on aseptic packaging. Int. J. Life Cycle Assess. 2013, 18, 626–635. [Google Scholar] [CrossRef]
  6. Meneses, M.; Pasqualino, J.; Castells, F. Environmental assessment of the milk life cycle: The effect of packaging selection and the variability of milk production data. J. Environ. Manag. 2012, 107, 76–83. [Google Scholar] [CrossRef] [PubMed]
  7. Cole, R.J.; Valdebenito, M.J. The importation of building environmental certification systems: International usages of BREEAM and LEED. Build. Res. Informat. 2013, 41, 662–676. [Google Scholar] [CrossRef]
  8. Tencar, J.; Vonka, M. Practical Experience With Sbtoolcz Certification; Sustainable Building and Refurbishment for Next Generations; Czech Technical University Prague: Prague 6, Czech Republic, 2013; ISBN 978-80-247-5015-6. [Google Scholar]
  9. Guinee, J. Handbook on life cycle assessment—Operational guide to the ISO standards. Int. J. Life Cycle Assess. 2001, 6, 255. [Google Scholar] [CrossRef]
  10. Tornese, F.; Carrano, A.L.; Thorn, B.K.; Pazour, J.A.; Roy, D. Carbon footprint analysis of pallet remanufacturing. J. Clean Prod. 2016, 126, 630–642. [Google Scholar] [CrossRef]
  11. Koci, V. Comparisons of environmental impacts between wood and plastic transport pallets. Sci. Total Environ. 2019, 686, 514–528. [Google Scholar] [CrossRef]
  12. Accorsi, R.; Baruffaldi, G.; Manzini, R.; Pini, C. Environmental Impacts of Reusable Transport Items: A Case Study of Pallet Pooling in a Retailer Supply Chain. Sustainability 2019, 11, 13. [Google Scholar] [CrossRef] [Green Version]
  13. CEN EN 15804:2012+A2:2019 Sustainability of Construction Works—Environmental Product Declarations—Core Rules for the Product Category of Construction Products. Available online: https://standards.cen.eu/dyn/www/f?p=204:110:0::::FSP_PROJECT:70014&cs=1CFE7BDC38149F238F05C4C13E0E3B4C2 (accessed on 27 November 2020).
  14. Yang, D.; Fan, L.; Shi, F.; Liu, Q.; Wang, Y.J. Comparative study of cement manufacturing with different strength grades using the coupled LCA and partial LCC methods-A case study in China. Resour. Conserv. Recycl. 2017, 119, 60–68. [Google Scholar] [CrossRef]
  15. Werner, F.; Richter, K. Wooden building products in comparative LCA. Int. J. Life Cycle Assess. 2007, 12, 470–479. [Google Scholar] [CrossRef]
  16. Islam, H.; Jollands, M.; Setunge, S.; Ahmed, I.; Hague, N. Life cycle assessment and life cycle cost implications of wall assemblages designs. Energy Build. 2014, 84, 33–45. [Google Scholar] [CrossRef]
  17. Pesta, J.; Pavlu, T.; Fartova, K.; Koci, V. Sustainable Masonry Made from Recycled Aggregates: LCA Case Study. Sustainability 2020, 12, 1581. [Google Scholar] [CrossRef] [Green Version]
  18. Monteiro, H.; Freire, F. Life-cycle assessment of a house with alternative exterior walls: Comparison of three impact assessment methods. Energy Build. 2012, 47, 572–583. [Google Scholar] [CrossRef] [Green Version]
  19. Abd Rashid, A.F.; Idris, J.; Yusoff, S. Environmental Impact Analysis on Residential Building in Malaysia Using Life Cycle Assessment. Sustainability 2017, 9, 329. [Google Scholar] [CrossRef] [Green Version]
  20. Marinkovic, S.; Habert, G.; Ignjatovic, I.; Dragas, J.; Tosic, N.; Brumaud, C. Life Cycle Analysis of Recycled Aggregate Concrete with Fly Ash as Partial Cement Replacement. Expand. Boundaries Syst. Think. Built Environ. 2016, 2016, 390–396. [Google Scholar]
  21. Jiang, M.H.; Chen, X.J.; Rajabipour, F.; Hendrickson, C.T. Comparative Life Cycle Assessment of Conventional, Glass Powder, and Alkali-Activated Slag Concrete and Mortar. J. Infrastruct. Syst. 2014, 20, 9. [Google Scholar] [CrossRef]
  22. Huntzinger, D.N.; Eatmon, T.D. A life-cycle assessment of Portland cement manufacturing: Comparing the traditional process with alternative technologies. J. Clean. Prod. 2009, 17, 668–675. [Google Scholar] [CrossRef]
  23. Ferrari, A.M.; Volpi, L.; Pini, M.; Siligardi, C.; Enrique Garcia-Muina, F.; Settembre-Blundo, D. Building a Sustainability Benchmarking Framework of Ceramic Tiles Based on Life Cycle Sustainability Assessment (LCSA). Resources-Basel 2019, 8, 11. [Google Scholar] [CrossRef] [Green Version]
  24. Lozano-Miralles, J.A.; Hermoso-Orzaez, M.J.; Martinez-Garcia, C.; Rojas-Sola, J.I. Comparative Study on the Environmental Impact of Traditional Clay Bricks Mixed with Organic Waste Using Life Cycle Analysis. Sustainability 2018, 10, 17. [Google Scholar] [CrossRef] [Green Version]
  25. Zimele, Z.; Sinka, M.; Korjakins, A.; Bajare, D.; Sahmenko, G. Life Cycle Assessment of Foam Concrete Production in Latvia. Environ. Clim. Technol. 2019, 23, 70–84. [Google Scholar] [CrossRef] [Green Version]
  26. Llantoy, N.; Chàfer, M.; Cabeza, L.F. A comparative life cycle assessment (LCA) of different insulation materials for buildings in the continental Mediterranean climate. Energy Build. 2020, 225, 110323. [Google Scholar] [CrossRef]
  27. Grabois, T.M.; Caldas, L.R.; Julião, N.R.; Toledo Filho, R.D. An Experimental and Environmental Evaluation of Mortars with Recycled Demolition Waste from a Hospital Implosion in Rio de Janeiro. Sustainability 2020, 12, 8945. [Google Scholar] [CrossRef]
  28. Onn, C.C.; Mo, K.H.; Radwan, M.K.H.; Liew, W.H.; Ng, C.G.; Yusoff, S. Strength, Carbon Footprint and Cost Considerations of Mortar Blends with High Volume Ground Granulated Blast Furnace Slag. Sustainability 2019, 11, 8945. [Google Scholar] [CrossRef] [Green Version]
  29. Quintana-Gallardo, A.; Alba, J.; del Rey, R.; Crespo-Amorós, J.E.; Guillén-Guillamón, I. Life-Cycle Assessment and Acoustic Simulation of Drywall Building Partitions with Bio-Based Materials. Polymers 2020, 12, 1965. [Google Scholar] [CrossRef]
  30. Carrano, A.L.; Thorn, B.K.; Woltag, H. Characterizing the Carbon Footprint of Wood Pallet Logistics. For. Prod. J. 2014, 64, 232–241. [Google Scholar] [CrossRef]
  31. Gasol, C.M.; Farreny, R.; Gabarrell, X.; Rieradevall, J. Life cycle assessment comparison among different reuse intensities for industrial wooden containers. Int. J. Life Cycle Assess. 2008, 13, 421–431. [Google Scholar] [CrossRef]
  32. Šerešová, M.; Kočí, V. Methodics PtP (Package-to-Product); Poznan University of Technology: Poznan, Poland, 2019. [Google Scholar]
  33. Šerešová, M.; Kočí, V. Proposal of Package-to-Product Indicator for Carbon Footprint Assessment with Focus on the Czech Republic. Sustainability 2020, 12, 3034. [Google Scholar] [CrossRef] [Green Version]
  34. He, B.; Shao, Y.W.; Wang, S.; Gu, Z.C.; Bai, K.J. Product environmental footprints assessment for product life cycle. J. Clean Prod. 2019, 233, 446–460. [Google Scholar] [CrossRef]
  35. ISO Environmental Management—Life Cycle Assessment—Principles and Framework (ISO 14040:2006). Available online: https://www.iso.org/standard/37456.html (accessed on 1 October 2020).
  36. ISO Environmental management—Life Cycle Assessment—Requirements and guidelines (ISO 14044:2006). Available online: https://www.iso.org/standard/38498.html (accessed on 1 October 2020).
  37. Product Environmental Footprint (PEF) Guide. Available online: https://ec.europa.eu/environment/archives/eussd/pdf/footprint/PEF%20methodology%20final%20draft.pdf (accessed on 7 October 2020).
  38. Life Cycle Assessment LCA Software: Gabi Software. Available online: http://www.gabisoftware.com/ (accessed on 30 October 2020).
  39. GaBi Database and Modelling Principles. Available online: http://www.gabi-software.com/fileadmin/gabi/Modelling_Principles/Modeling_Principles_-_GaBi_Databases_2020_2.pdf (accessed on 1 December 2020).
  40. Watkiss, P.; Downing, T. The Impacts and Costs of Climate Change. Available online: https://ec.europa.eu/clima/sites/clima/files/strategies/2020/docs/final_report2_en.pdf (accessed on 10 October 2020).
  41. Fazio, S.; Secchi, M.; Castellani, V.; Sala, S.; Schau, E.M.; Diaconu, E.; Zampori, L. Supporting Information to the Characterisation Factors of Recommended EF Life Cycle Impact Assessment Method. Available online: https://publications.jrc.ec.europa.eu/repository/bitstream/JRC109369/jrc109369_final.pdf (accessed on 1 October 2020).
  42. WRAP Reusable Packaging in Construction. Available online: http://www.wrap.org.uk/sites/files/wrap/RTP%20briefing%20note%20for%20suppliers%20-%20Final.pdf (accessed on 10 January 2020).
  43. Huang, C.C.; Ma, H.W. A multidimensional environmental evaluation of packaging materials. Sci. Total Environ. 2004, 324, 161–172. [Google Scholar] [CrossRef]
Figure 1. System boundaries of considered Package-to-Product systems.
Sustainability 12 10094 g001
Figure 2. Results of the PtP indicator for 1 kg of aerated concrete block element and its packaging systems considering four scenarios for the handling of packaging material at the end-of-life (EoL) cycle, namely the expected EoL mix in the Czech Republic, material recovery, energy recovery, and landfilling.
Sustainability 12 10094 g002
Figure 3. Results of the PtP indicator for 1 kg of expanded polystyrene and its packaging systems considering four scenarios for the handling of packaging material at the end-of-life cycle, namely the expected EoL mix in the Czech Republic, material recovery, energy recovery, and landfilling.
Sustainability 12 10094 g003
Figure 4. Results of the PtP indicator for 1 kg of gypsum plasterboard and its packaging systems considering four scenarios for the handling of packaging material at the end-of-life cycle, namely the expected EoL mix in the Czech Republic, material recovery, energy recovery, and landfilling.
Sustainability 12 10094 g004
Figure 5. Results of the PtP indicator for 1 kg of cement and its packaging systems considering four scenarios for the handling of packaging material at the end-of-life cycle, namely the expected EoL mix in the Czech Republic, material recovery, energy recovery, and landfilling.
Sustainability 12 10094 g005
Figure 6. Results of the PtP indicator for 1 kg of clay brick and its packaging systems considering four scenarios for handling packaging material at the end-of-life cycle, namely the expected EoL mix in the Czech Republic, material recovery, energy recovery, and landfilling.
Sustainability 12 10094 g006
Figure 7. Results of the PtP indicator for 1 kg of ceramic facade packaging and its packaging systems considering four scenarios for the handling of packaging material at the end-of-life cycle, namely the expected EoL mix in the Czech Republic, material recovery, energy recovery, and landfilling.
Sustainability 12 10094 g007
Figure 8. Results of the PtP indicator for 1 kg of paint emulsion and its packaging systems considering four scenarios for the handling of packaging material at the end-of-life cycle, namely the expected EoL mix in the Czech Republic, material recovery, energy recovery, and landfilling.
Sustainability 12 10094 g008
Figure 9. Results of the PtP indicator for 1 kg of mineral wool and its packaging systems considering four scenarios for the handling of packaging material at the end-of-life cycle, namely the expected EoL mix in the Czech Republic, material recovery, energy recovery, and landfilling.
Sustainability 12 10094 g009
Figure 10. Results of the PtP indicator for 1 kg of roof tiles and their packaging systems considering four scenarios for the handling of packaging material at the end-of-life cycle, namely the expected EoL mix in the Czech Republic, material recovery, energy recovery, and landfilling.
Sustainability 12 10094 g010
Figure 11. Results of the PtP indicator for 1 kg of mineral reinforcement mortar and its packaging systems considering four scenarios for the handling of packaging material at the end-of-life cycle, namely the expected EoL mix in the Czech Republic, material recovery, energy recovery, and landfilling.
Sustainability 12 10094 g011
Table 1. Construction products and their packaging.
Construction ProductPrimary PackagingSecondary PackagingTertiary Packaging
MaterialWeight of Pack. Per 1 kg of Product [g]MaterialWeight of Pack. Per 1 kg of Product [g]MaterialWeight of Pack. Per 1 kg of Product [g]
Cement (CEM I 32.5)Paper bag0.46HDPE foil0.07Wooden pallet0.69
Mineral reinforcement mortarPaper bag4.00HDPE foil0.07Wooden pallet0.80
Clay brick LDPE1.11Wooden pallet0.67
Roof Tile HDPE foil11.20Wooden pallet0.09
Mineral wool HDPE foil3.79Wooden pallet0.36
Ceramic facade panels Cardboard0.39HDPE foil0.05Wooden pallet0.03
Expanded Polystyrene (PS 30)HDPE foil7.26HDPE foil7.41Wooden pallet37.0
Aerated concrete block element HDPE foil0.97Wooden pallet0.10
Paint emulsion (building, exterior, white)PP foil20.2HDPE foil0.04Wooden pallet1.00
Gypsum plasterboard Wooden pallet0.79
Table 2. Used indicators to evaluate impact in the climate change category according to the Environmental Product footprint, version 3.0 [19].
IndicatorUnitDescription
Climate Changekg CO2 eq.This indicator describes the impact on climate change caused by emissions of greenhouse gases (GHGs).
Climate Change (biogenic)kg CO2 eq.Carbon is removed from the atmosphere because of the process of growing biomass. This indicator described the impact on climate change, which is allocated to the carbon released from the biomass (for example by the burning of biomass) and the carbon removed from the atmosphere due to the growth of biomass.
Climate Change (fossil)kg CO2 eq.The result of this indicator corresponds to the impact of emissions from fossil sources, such as the burning of fossil fuels. It also includes removals of carbon from the atmosphere.
Climate Change (land use change)kg CO2 eq.The land use and land use change influence the carbon stock in the land. This indicator represents the impact of carbon, which is released to the atmosphere because of the change of carbon stocks in the land.
Table 3. Processes from the GaBi database describing the production of the considered construction products [20].
Construction ProductDescription of Considered Processes
Cement (CEM I 32.5)The process includes the excavation of primary resources, the production of clinker, and the grinding of cement. The cement is marked according to EN 197-1.
Mineral reinforcement mortarThe process includes the life cycle stages of the production of primary products, mining, processing operations and input secondary materials (e.g., recycling processes), their transport to the factory, and the production itself, including the provision of all supplies and materials, energy, and the complete waste treatment or landfilling of residual waste during the production stage.
Clay BricksBricks made of clay with the following production steps: extraction of clay, processing and moulding of clay, drying, and firing in a furnace.
Roof TileRoof tile production covers the cradle-to-gate phase, that is, the production of raw and auxiliary materials as well as the production of the roof tiles, including plant operation. The main raw material is clay.
Mineral woolDatasets describe mineral wool and glass fibre production using sedimentary or igneous rocks and various recycled materials. These materials are melted and then fibres are made.
Ceramic facade panelsThis dataset represents the production of ceramic facade panels, which includes material and energy production, the transportation of raw materials and the actual production phase of the ceramic wall plate.
Expanded Polystyrene (PS 30)The production of expanded polystyrene (EPS) takes place with the following steps: frothing of the granulate, treatment in a block foaming machine in dimensions for various products, post-foaming, cutting, and piling.
Aerated concrete block elementThe dataset represents the following process steps: preparation, mixing of primary materials, production and installation of the corrosion protective reinforcement (for reinforced components), casting, driving, rubbing and cutting of the block, hardening using steam
Paint emulsion (building, exterior, white)The dataset includes the manufacturing of raw and auxiliary materials as well as the processing at the construction site (solvent emissions).
Gypsum plasterboardThe dataset represents the pre-processing of the gypsum feedstock, the thermal process of calcination, mixing stucco with water and casting it together with paperboards. It also includes the cutting of boards.
Table 4. Environmental impacts on the climate change category caused by 1 kg of aerated concrete block element and its packaging evaluated in four scenarios of packaging waste management.
Aerated Concrete Block ElementCZ EoL MixMaterial Recovery
Prim.Sec.Ter.Prim.Sec.Ter.
Climate Change [kg CO2 eq.]4.87 × 10−10.002.55 × 10−36.86 × 10−40.001.45 × 10−35.97 × 10⁻⁴
Climate Change (biogenic)
[kg CO2 eq.]
1.27 × 10−30.001.24 × 10−57.41 × 10−50.009.46 × 10−6−1.26 × 10⁻⁶
Climate Change (fossil)
[kg CO2 eq.]
4.85 × 10−10.002.54 × 10−36.12 × 10−40.001.43 × 10−35.98 × 10⁻⁴
Climate Change
(land use change)
[kg CO2 eq.]
3.02 × 10−40.001.63 × 10−62.76 × 10−80.001.75 × 10−63.13 × 10⁻⁸
Energy RecoveryLandfilling
Prim.Sec.Ter.Prim.Sec.Ter.
Climate Change [kg CO2 eq.] 0.004.64 × 10−36.05 × 10−40.002.57 × 10−37.93 × 10⁻⁴
Climate Change (biogenic)
[kg CO2 eq.]
0.008.73 × 10−62.45 × 10−70.001.47 × 10−51.65 × 10⁻⁴
Climate Change (fossil)
[kg CO2 eq.]
0.004.64 × 10−36.05 × 10−40.002.55 × 10−36.29 × 10⁻⁴
Climate Change
(land use change)
[kg CO2 eq.]
0.006.09 × 10−7−3.96 × 10−90.001.83 × 10−62.58 × 10⁻⁸
Table 5. Environmental impacts on the climate change category caused by 1 kg of expanded polystyrene and its packaging evaluated in four scenarios of packaging waste management.
Expanded PolystyreneCZ EoL MixMaterial Recovery
Prim.Sec.Ter.Prim.Sec.Ter.
Climate Change [kg CO2 eq.]2.861.91 × 10−21.95 × 10−22.60 × 10−11.08 × 10−21.10 × 10−22.26 × 10⁻¹
Climate Change (biogenic)
[kg CO2 eq.]
8.84 × 10−39.31 × 10−59.50 × 10−52.81 × 10−27.08 × 10−57.22 × 10−5−4.77 × 10⁻⁴
Climate Change (fossil)
[kg CO2 eq.]
2.851.90 × 10−21.94 × 10−22.32 × 10−11.07 × 10−21.10 × 10−22.27 × 10⁻¹
Climate Change
(land use change)
[kg CO2 eq.]
4.16 × 10−41.22 × 10−51.25 × 10−51.05 × 10−51.31 × 10−51.33 × 10−51.19 × 10⁻⁵
Energy RecoveryLandfilling
Prim.Sec.Ter.Prim.Sec.Ter.
Climate Change [kg CO2 eq.] 3.48 × 10−23.55 × 10−22.30 × 10−11.92 × 10−21.96 × 10−23.01 × 10−1
Climate Change (biogenic)
[kg CO2 eq.]
6.54 × 10−56.67 × 10−59.30 × 10−51.10 × 10−41.12 × 10−46.24 × 10−2
Climate Change (fossil)
[kg CO2 eq.]
3.47 × 10−23.54 × 10−22.30 × 10−11.91 × 10−21.95 × 10−22.39 × 10−1
Climate Change
(land use change)
[kg CO2 eq.]
4.56 × 10−64.66 × 10−6−1.50 × 10−61.37 × 10−51.40 × 10−59.78 × 10−6
Table 6. Environmental impacts on the climate change category caused by 1 kg of gypsum plasterboard and its packaging evaluated in four scenarios of packaging waste management.
Gypsum PlasterboardCZ EoL MixMaterial Recovery
Prim.Sec.Ter.Prim.Sec.Ter.
Climate Change [kg CO2 eq.]2.08 × 10−10.000.005.52 × 10−30.000.004.80 × 10−3
Climate Change (biogenic)
[kg CO2 eq.]
1.02 × 10−30.000.005.96 × 10−40.000.00−1.01 × 10⁻⁵
Climate Change (fossil)
[kg CO2 eq.]
2.07 × 10−10.000.004.93 × 10−30.000.004.81 × 10−3
Climate Change
(land use change)
[kg CO2 eq.]
2.65 × 10−40.000.002.22 × 10−70.000.002.52 × 10−7
Energy RecoveryLandfilling
Prim.Sec.Ter.Prim.Sec.Ter.
Climate Change [kg CO2 eq.] 0.000.004.87 × 10−30.000.006.39 × 10−3
Climate Change (biogenic)
[kg CO2 eq.]
0.000.001.97 × 10−60.000.001.32 × 10−3
Climate Change (fossil)
[kg CO2 eq.]
0.000.004.87 × 10−30.000.005.06 × 10−3
Climate Change
(land use change)
[kg CO2 eq.]
0.000.00−3.19 × 10−80.000.002.07 × 10−7
Table 7. Environmental impacts on the climate change category caused by 1 kg of cement and its packaging evaluated in four scenarios of packaging waste management.
CementCZ EoL MixMaterial Recovery
Prim.Sec.Ter.Prim.Sec.Ter.
Climate Change [kg CO2 eq.]8.28 × 10−14.82 × 10−41.63 × 10−44.82 × 10−34.47 × 10−41.07 × 10−44.19 × 10⁻³
Climate Change (biogenic)
[kg CO2 eq.]
8.88 × 10−42.83 × 10−47.99 × 10−75.20 × 10−42.55 × 10−47.02 × 10−7−8.82 × 10⁻⁶
Climate Change (fossil)
[kg CO2 eq.]
8.27 × 10−11.98 × 10−41.62 × 10−44.30 × 10−31.91 × 10−41.06 × 10−44.20 × 10⁻³
Climate Change
(land use change)
[kg CO2 eq.]
2.25 × 10−48.91 × 10−71.19 × 10−71.94 × 10−78.80 × 10−71.30 × 10−72.20 × 10⁻⁷
Energy RecoveryLandfilling
Prim.Sec.Ter.Prim.Sec.Ter.
Climate Change [kg CO2 eq.] 1.25 × 10−43.45 × 10−44.25 × 10−37.68 × 10−41.90 × 10−45.57 × 10−3
Climate Change (biogenic)
[kg CO2 eq.]
1.94 × 10−76.48 × 10−71.72 × 10−65.10 × 10−41.09 × 10−61.16 × 10−3
Climate Change (fossil)
[kg CO2 eq.]
1.24 × 10−43.44 × 10−44.25 × 10−32.57 × 10−41.89 × 10−44.42 × 10−3
Climate Change
(land use change)
[kg CO2 eq.]
7.76 × 10−74.52 × 10−8−2.78 × 10−89.84 × 10−71.36 × 10−71.81 × 10−7
Table 8. Environmental impacts on the climate change category caused by 1 kg of clay brick and its packaging evaluated in four scenarios of packaging waste management.
Clay BrickCZ EoL MixMaterial Recovery
Prim.Sec.Ter.Prim.Sec.Ter.
Climate Change [kg CO2 eq.]2.35 × 10−10.002.57 × 10−34.69 × 10−30.001.67 × 10−34.08 × 10⁻³
Climate Change (biogenic)
[kg CO2 eq.]
2.90 × 10−40.001.50 × 10−55.06 × 10−40.001.15 × 10−5−8.58 × 10⁻⁶
Climate Change (fossil)
[kg CO2 eq.]
2.35 × 10−10.002.55 × 10−34.18 × 10−30.001.65 × 10−34.08 × 10⁻³
Climate Change
(land use change)
[kg CO2 eq.]
4.32 × 10−50.002.28 × 10−61.89 × 10−70.002.10 × 10−62.14 × 10⁻⁷
Energy RecoveryLandfilling
Prim.Sec.Ter.Prim.Sec.Ter.
Climate Change [kg CO2 eq.] 0.005.43 × 10−34.13 × 10−30.003.05 × 10−35.42 × 10⁻³
Climate Change (biogenic)
[kg CO2 eq.]
0.001.57 × 10−51.67 × 10−60.002.25 × 10−51.12 × 10⁻³
Climate Change (fossil)
[kg CO2 eq.]
0.005.41 × 10−34.13 × 10−30.003.03 × 10−34.30 × 10⁻³
Climate Change (land use change) [kg CO2 eq.] 0.001.62 × 10−6−2.71 × 10−80.003.02 × 10−61.76 × 10⁻⁷
Table 9. Environmental impacts on the climate change category caused by 1 kg of ceramic facade panel and its packaging evaluated in four scenarios of packaging waste management.
Ceramic Facade PanelCZ EoL MixMaterial Recovery
Prim.Sec.Ter.Prim.Sec.Ter.
Climate Change [kg CO2 eq.]1.132.81 × 10−41.26 × 10−42.22 × 10−42.42 × 10−47.15 × 10−51.93 × 10⁻⁴
Climate Change (biogenic)
[kg CO2 eq.]
0.002.07 × 10−56.16 × 10−72.40 × 10−5−9.20 × 10−74.68 × 10−7−4.07 × 10⁻⁷
Climate Change (fossil)
[kg CO2 eq.]
1.132.61 × 10−41.26 × 10−41.98 × 10−42.44 × 10−47.10 × 10−51.94 × 10⁻⁴
Climate Change
(land use change)
[kg CO2 eq.]
0.00−8.55 × 10−78.09 × 10−88.95 × 10⁻⁹−9.38 × 10−78.64 × 10−81.01 × 10⁻⁸
Energy RecoveryLandfilling
Prim.Sec.Ter.Prim.Sec.Ter.
Climate Change [kg CO2 eq.] 3.78 × 10−42.30 × 10−41.96 × 10−49.23 × 10−41.27 × 10−42.57 × 10−4
Climate Change (biogenic)
[kg CO2 eq.]
−7.10 × 10−74.32 × 10−77.93 × 10−84.31 × 10−47.27 × 10−75.33 × 10−5
Climate Change (fossil)
[kg CO2 eq.]
3.79 × 10−42.29 × 10−41.96 × 10−44.92 × 10−41.26 × 10−42.04 × 10−4
Climate Change
(land use change)
[kg CO2 eq.]
−1.13 × 10−73.02 × 10−8−1.28 × 10−96.26 × 10−89.04 × 10−88.34 × 10−9
Table 10. Environmental impacts on the climate change category caused by 1 kg of paint emulsion and its packaging evaluated in four scenarios of packaging waste management.
Paint EmulsionCZ EoL MixMaterial Recovery
Prim.Sec.Ter.Prim.Sec.Ter.
Climate Change [kg CO2 eq.]1.955.21 × 10−21.05 × 10−47.03 × 10−33.00 × 10−25.96 × 10−56.11 × 10⁻³
Climate Change (biogenic)
[kg CO2 eq.]
1.10 × 10−22.91 × 10−45.13 × 10−77.59 × 10−42.02 × 10−43.90 × 10−7−1.29 × 10⁻⁵
Climate Change (fossil)
[kg CO2 eq.]
1.945.17 × 10−21.05 × 10−46.27 × 10−32.97 × 10−25.92 × 10−56.13 × 10⁻³
Climate Change
(land use change)
[kg CO2 eq.]
1.87 × 10−33.73 × 10−56.74 × 10−82.83 × 10−73.69 × 10−57.20 × 10−83.21 × 10⁻⁷
Energy RecoveryLandfilling
Prim.Sec.Ter.Prim.Sec.Ter.
Climate Change [kg CO2 eq.] 9.53 × 10−21.92 × 10−46.20 × 10−35.19 × 10−21.06 × 10−48.13 × 10−3
Climate Change (biogenic)
[kg CO2 eq.]
2.24 × 10−43.60 × 10−72.51 × 10−63.48 × 10−46.06 × 10−71.69 × 10−3
Climate Change (fossil)
[kg CO2 eq.]
9.50 × 10−21.91 × 10−46.20 × 10−35.16 × 10−21.05 × 10−46.44 × 10−3
Climate Change
(land use change)
[kg CO2 eq.]
1.69 × 10−52.51 × 10−8−4.06 × 10−84.23 × 10−57.53 × 10−82.64 × 10−7
Table 11. Environmental impacts on the climate change category caused by 1 kg of mineral wool and its packaging evaluated in four scenarios of packaging waste management.
Mineral WoolCZ EoL MixMaterial Recovery
Prim.Sec.Ter.Prim.Sec.Ter.
Climate Change [kg CO2 eq.]1.460.009.98 × 10−32.52 × 10−30.005.65 × 10−32.19 × 10⁻³
Climate Change (biogenic)
[kg CO2 eq.]
6.31 × 10−30.004.86 × 10−52.72 × 10−40.003.69 × 10−5−4.62 × 10⁻⁶
Climate Change (fossil)
[kg CO2 eq.]
1.450.009.93 × 10−32.25 × 10−30.005.61 × 10−32.20 × 10⁻³
Climate Change
(land use change)
[kg CO2 eq.]
1.01 × 10−30.006.39 × 10−61.02 × 10−70.006.82 × 10−61.15 × 10⁻⁷
Energy RecoveryLandfilling
Prim.Sec.Ter.Prim.Sec.Ter.
Climate Change [kg CO2 eq.] 0.001.81 × 10−22.23 × 10−30.001.00 × 10−22.92 × 10⁻³
Climate Change (biogenic)
[kg CO2 eq.]
0.003.41 × 10−59.00 × 10−70.005.74 × 10−56.05 × 10⁻⁴
Climate Change (fossil)
[kg CO2 eq.]
0.001.81 × 10−22.22 × 10−30.009.96 × 10−32.31 × 10⁻³
Climate Change
(land use change)
[kg CO2 eq.]
0.002.38 × 10−6−1.46 × 10−80.007.14 × 10−69.48 × 10⁻⁸
Table 12. Environmental impacts on the climate change category caused by 1 kg of roof tiles and their packaging evaluated in four scenarios of packaging waste management.
Roof TileCZ EoL MixMaterial Recovery
Prim.Sec.Ter.Prim.Sec.Ter.
Climate Change [kg CO2 eq.]3.33 × 10−10.002.94 × 10−26.27 × 10−40.001.66 × 10−25.45 × 10⁻⁴
Climate Change (biogenic)
[kg CO2 eq.]
1.08 × 10−30.001.43 × 10−46.77 × 10−50.001.09 × 10−4−1.15 × 10⁻⁶
Climate Change (fossil)
[kg CO2 eq.]
3.31 × 10−10.002.92 × 10−25.60 × 10−40.001.65 × 10−25.46 × 10⁻⁴
Climate Change
(land use change)
[kg CO2 eq.]
1.98 × 10−40.001.88 × 10−52.53 × 10−80.002.01 × 10−52.86 × 10⁻⁸
Energy RecoveryLandfilling
Prim.Sec.Ter.Prim.Sec.Ter.
Climate Change [kg CO2 eq.] 0.005.34 × 10−25.53 × 10−40.002.95 × 10−27.25 × 10⁻⁴
Climate Change (biogenic)
[kg CO2 eq.]
0.001.00 × 10−42.24 × 10−70.001.69 × 10−41.50 × 10⁻⁴
Climate Change (fossil)
[kg CO2 eq.]
0.005.33 × 10−25.53 × 10−40.002.93 × 10−25.75 × 10⁻⁴
Climate Change
(land use change)
[kg CO2 eq.]
0.007.01 × 10−6−3.62 × 10−90.002.10 × 10−52.36 × 10⁻⁸
Table 13. Environmental impacts on the climate change category caused by 1 kg of mineral reinforcement mortar and its packaging evaluated in four scenarios of packaging waste management.
Mineral Reinforcement MortarCZ EoL MixMaterial Recovery
Prim.Sec.Ter.Prim.Sec.Ter.
Climate Change [kg CO2 eq.]4.00 × 10−14.19 × 10−41.90 × 10−45.63 × 10−33.88 × 10−41.07 × 10−44.89 × 10⁻³
Climate Change (biogenic)
[kg CO2 eq.]
0.002.46 × 10−49.23 × 10−76.07 × 10−42.22 × 10−47.02 × 10−7−1.03 × 10⁻⁵
Climate Change (fossil)
[kg CO2 eq.]
4.00 × 10−11.72 × 10−41.89 × 10−45.02 × 10−31.66 × 10−41.06 × 10−44.90 × 10⁻³
Climate Change
(land use change)
[kg CO2 eq.]
0.007.75 × 10−71.21 × 10−72.26 × 10−77.65 × 10−71.30 × 10−72.57 × 10⁻⁷
Energy RecoveryLandfilling
Prim.Sec.Ter.Prim.Sec.Ter.
Climate Change [kg CO2 eq.] 1.09 × 10−43.45 × 10−44.96 × 10−36.68 × 10−41.90 × 10−46.50 × 10−3
Climate Change (biogenic)
[kg CO2 eq.]
1.69 × 10−76.48 × 10−72.01 × 10−64.43 × 10−41.09 × 10−61.35 × 10−3
Climate Change (fossil)
[kg CO2 eq.]
1.08 × 10−43.44 × 10−44.96 × 10−32.23 × 10−41.89 × 10−45.15 × 10−3
Climate Change
(land use change)
[kg CO2 eq.]
6.75 × 10−74.52 × 10−8−3.25 × 10−88.55 × 10−71.36 × 10−72.11 × 10−7
Table 14. Results of the Monte Carlo Analysis for the mixed scenario (CZ EoL mix).
Product System
(Including Packaging)
Mean Value of the
Climate Change (Total) Indicator [kg CO2 eq.]
Standard Deviation [%]
Aerated concrete block element0.490.009
Expanded polystyrene3.160.093
Gypsum plasterboard0.210.030
Cement0.830.008
Clay brick0.240.041
Ceramic facade panel1.130.002
Paint emmulsion2.010.042
Mineral Wool1.470.011
Roof tile0.360.130
Mineral reinforcement mortar0.410.018
Publisher’s Note: MDPI stays neutral with regard to jurisdictional claims in published maps and institutional affiliations.

