Article

Techno-Economic Assessment of Rooftop PV Systems in Residential Buildings in Hot–Humid Climates

by
Ammar Hamoud Ahmad Dehwah
1,2,
Muhammad Asif
2,*,
Ismail Mohammad Budaiwi
2 and
Adel Alshibani
3
1
Building Systems Program, Department of Civil, Environmental and Architectural Engineering, University of Colorado, Boulder, CO 80309, USA
2
Department of Architectural Engineering, King Fahd University of Petroleum & Minerals, Dhahran 31261, Saudi Arabia
3
Construction Engineering and Management, King Fahd University of Petroleum & Minerals, Dhahran 31261, Saudi Arabia
*
Author to whom correspondence should be addressed.
Sustainability 2020, 12(23), 10060; https://doi.org/10.3390/su122310060
Submission received: 7 November 2020 / Revised: 27 November 2020 / Accepted: 30 November 2020 / Published: 2 December 2020
(This article belongs to the Special Issue Buildings and Sustainable Energy: Technologies, Policies, and Trends)

Abstract

:
The application of renewable energy has been an integral part of the sustainability drive in the building sector and solar photovoltaic (PV) is one of the most effective technologies in this respect. The present study aims to investigate the prospects of solar PV in residential buildings in the hot–humid climatic conditions. The study discusses the utilization of building roofs for the application of PV in terms of potential hurdles and utilization factor (UF). Technical performance of PV systems has also been investigated in terms of power output as well as the energy saved as a result of the shading impact of panels for two types of residential units, apartments and villas. Investigation of 70 sample residential buildings reveals the average UF of 0.21 and 0.28 for apartments and villas, respectively. For the case study of apartment and villa residential units, roof UF has been found to be 13% and 15% with a respective PV output of 6079 kWh/year and 6162 kWh/year. Potential PV output at the city level has also been estimated. A sensitivity analysis has been conducted to evaluate the impact of various cost and design parameters on the viability of PV systems.

1. Introduction

Given the current energy and environmental challenges, countries around the world are actively pursuing sustainable use of energy and natural resources. Through the Paris Agreement, 196 countries have adopted a universally legally binding deal to tackle climate change by controlling global warming to a temperature rise of below 2 °C. Recent findings by the Intergovernmental Panel on Climate Change (IPCC) however, indicate that the situation is quite alarming as the world is actually overrunning this target and is heading towards a considerably higher temperature rise. It is suggested that the four major global systems—land use, energy, cities and industry—need to be revamped. IPCC warns that to limit the global warming to the desired level of 1.5 °C, annually around US Dollars (USD) 2.4 trillion is needed to be invested sustainable energy measures including renewable and energy efficiency through 2035 [1,2]. The building sector, being responsible for around 40% of the total energy consumption and over one-third of greenhouse gas (GHG) emissions in the world has to play an important role in addressing these challenges [3,4]. Buildings across the world, especially in advanced countries, are having a tremendous transformation in terms of improving their energy and environmental performance. Application of renewable energy has been an integral part of these efforts [5,6,7,8,9]. Solar photovoltaic (PV) is one of most successfully used renewables technology in the building sector around the world [10]. Solar PV can significantly help buildings improve their energy self-sufficiency and reduce environmental emissions with cost effectiveness.
The Kingdom of Saudi Arabia (KSA), one of the largest countries in Middle East, has a predominantly hot–humid climate. The building sector in KSA has a heavy energy and environmental footprint [11,12]. The country is experiencing a rapid growth in energy demand—with electricity demand growing at annual rate of over 8%—due to factors like rising population, infrastructure development and modernization [13,14]. Such a fast growth in energy demand is being mainly dictated by the building sector as it consumes nearly 80% of the total electricity consumption [15]. To address the mounting energy and environmental stresses, KSA is seeking to improve the sustainability standards in buildings. It has set a target of having 58 GW of renewables by the year 2030 [16]. Solar energy is clearly the most promising renewable option for the country with annual average solar radiation level of over 6 kWh/m2/day [17] and clear sky days in a range of 80–90%. KSA has announced a net-metering policy to promote the uptake of renewables in buildings. Solar PV is an important technology to benefit from such policy drives. PV has experienced huge success in building applications across the globe and has been an active topic for researchers accordingly [18,19,20,21,22]. PV can be incorporated into buildings as roof mounted/integrated, wall mounted/integrated and integrated or coated on glazing systems. Currently, most PV building applications worldwide have PV modules installed on rooftops. The reason behind this is that the built environment in cities offers vast areas of unused rooftop spaces. Rooftops usually provide an optimal and suitable location for capturing solar light with minimum shade interruptions compared to other building elements. In KSA, however, PV has yet to make an impact especially in the building sector, as is also evident from a limited scholarship on the subject. Khan et al. studied the application of solar PV in residential buildings in KSA [23]. Asif investigated the potential of PV in different types of buildings in an urban environment [6]. Dehwah et al. and Dehwah and Asif studied the utilization of residential buildings’ rooftops for PV application [24,25]. Given the recent policy trends, there is a need to investigate the viability of PV systems in different types of buildings taking into account wider technical and economic parameters.
This paper aims to investigate the technical and economic aspects of the application of solar PV in the residential sector of KSA taking into account the local roof conditions that pose hurdles to the use of the technology. It has focused on two main types of residential units, apartments and villas. A sample unit has been selected from each type describing its key characteristics. Discussing different types of potential hurdles towards the use of PV, the suitability of the rooftops of the selected residential units in terms of their utilization factor (UF) has been examined. PV systems have been designed for both buildings and power output has been estimated. The indirect energy benefit of PV systems in terms of reduced cooling load due to their shading impact has also been investigated. The paper also evaluates the economic viability of the designed PV systems with the help of the levelized cost of electricity (LCOE) and discounted payback period (DPBP) assessments. It is the first study that undertakes a comprehensive technical and economic analysis of solar PV’s application in two types of residential buildings in KSA. Given the architectural, climatic and cultural similarities, the findings of the study will also be applicable to the regional Gulf Cooperation Council (GCC) countries. While the study carries significance for researchers working in the broader areas of sustainable buildings and application of renewable energy in buildings, it will be of particular interest to those working on developing countries that have unregulated rooftops.

2. Materials and Methods

This paper adopted a three-stage approach to evaluate the technical and economic viability of PV in the residential buildings. The research began by assessing the technical viability in terms of availability of roof area and PV system performance. Next, economic analysis was conducted to evaluate the feasibility of PV given the economic conditions of KSA. The study area was the city of Al-Khobar in the Eastern Province of KSA. The key to promote PV applications is through policy intervention which can include a wide range of direct and indirect incentives. Direct incentives include rebates and feed-in-tariffs while indirect incentives include tax and carbon reduction credits. Incentives can encourage building owners to think about adopting this technology and hence will create a demand for PV allowing the PV market to develop. Regulations can also contribute to enhance the feasibility by means of reducing payback period. These include building regulations such as dedicating part of the roof area for PV applications, and energy regulation as to escalate electricity tariffs. Awareness about energy and its environmental impacts can help in community adoption for PV technology. An environmental assessment is also conducted as part of the study to evaluate the opportunities for greenhouse gas (GHG) emissions reductions. A framework for evaluating the feasibility of PV applications in residential buildings is depicted in Figure 1.

3. Utilization of Roofs for PV Applications

As the first step of evaluating the techno-economic feasibility of PV, the available area for PV utilization on rooftops has been estimated. The literature reports three main approaches used to estimate the potential of rooftop PV for large-scale applications. These include the constant value, manual selection and GIS-based methods [26]. The constant value method is the simplest and relies on various assumptions. The GIS-based approach is detailed and can be replicated but it is time and resource intensive as it requires availability of high-resolution data such as Light Detection and Ranging (LiDAR) that is usually not available for public use. The manual selection approach has been adopted in this study since it is more accurate compared to the constant method and less time and computer intensive compared to the GIS-based approach [24]. Although the manual selection approach can offer precise and accurate estimates, it is time consuming and not easily replicable making this approach a challenge when considering large scale applications (countrywide) [27]. In this study, geographic information system (GIS) software, i.e., ArcMap (version 10, Esri, Redlands, CA, USA) and satellite imaging techniques are utilized to extrapolate the assessment to the city-scale level encompassing an area of 100 square kilometers. Furthermore, 70 sample buildings from different neighborhoods were selected to account for the variation in rooftop characteristics. Majority of the selected sample buildings are located in relatively densely populated areas. All sample buildings are investigated with regards to their roof conditions and relevant surrounding parameters. Site visits have been conducted to observe the roof features in detail and to undertake concerned measurements for the validation purposes.
Diversity is observed in the samples according to three main aspects: roof size, height of parapet walls and rooftop features (hurdles). All roofs are flat and walkable with majority having a rectangular shape. The gross roof area for apartment building samples ranged from 184 m2 to 708 m2 with an average of 303 m2 while, for villas, it ranged from 126 m2 to 423 m2 with an average of 248 m2. With regards to parapet walls, the height ranged from 0.3 m to 2 m with an average of 1.3 m for apartments and from 1 m to 1.8 m with an average of 1.7 m for villas. It is worth noting that all investigated sample buildings are located in residential designated zones where buildings have similar heights. In addition, green areas are rare within residential zones and trees do not extend beyond the building height and hence do not pose any shading challenges. The main hurdles for PV installation are broadly categorized into five groups: architectural and structural, building services, accessibility and maintenance, shading and others. The main structural hurdles involved parapet walls, staircase, annexes, and elevator rooms and roof geometry as shown in Table 1. Examples of the service hurdles include water tanks, dish antennas, condenser units, and water heaters/boilers. Examples of maintenance hurdles are the areas near walls and doors, areas needed for undertaking maintenance of building services on roof and the PV inter-row spacing. Rooftops are also found to be used for socializing (open-air sitting space). The shadow cast by different types of structures and services/components situated on roofs also significantly affect the power output. It is noteworthy that the roof features pertinent to the use of PV, for example structural and services restrictions, can significantly vary from building to building. A utilization factor (UF) is typically used as an indicator for PV area availability. It represents the ratio of the available area for PV utilization to the total roof area [24]. The UF is calculated for each of the sample building after quantifying the area restricted by the hurdles. These are described under five types of restriction coefficients: structural (Cstr), services coefficient (Cser), maintenance coefficient (Cacc), shading coefficient (Csh), and other coefficient (Coth). It should be noted that factors such as PV module type, tilt angel and orientation can influence the UF calculations. The restriction coefficients are reported in Section 7.1. After determining the UFs for the 70 sample buildings, a linear regression model has been developed to estimate the total available area based on available GIS data and managed with the help of ArcGIS software.

4. Weather Data and Building Model Description

The present paper considers the city of Al-Khobar covering 100 km2 as the study area. The city has a desert climate with hot and humid summers and mild winters. The local temperature profile based upon a 38-year data set has been highlighted in Figure 2a. It can be observed that the average highest temperature, 44 °C, is experienced in July, though it can also go up to 49 °C. January is the coldest month, recording an average low temperature of 11 °C. Summers see the higher average relative humidity (RH) ranging between 61% and 90% as shown in Figure 2b. It has predominantly clear sky conditions throughout the year with rare dust storms [28]. The optimum tilt angle for solar PV is 24° at which it receives an irradiation of 6.5 kWh/m2/day. Detailed irradiation data for the city have been provided in Table 2 [29]. The present study considers the latest meteorological year (TMY3) weather data, typically based on long periods of time reaching 30 years. It is worth noting that the type of weather data used in any building energy simulation tool could considerably impact the results and the conclusions of a study [30].
For a detailed evaluation of the PV performance, the study has examined an apartment and a villa residential building as case studies. The selected case study buildings represent the typical apartment and villa dwellings in the neighborhood in terms of construction, size and age. The apartment residence is part of a three-story building having four apartments at each floor with two further apartments on the roof as annexes. With a rectangular shape, the roof has a gross area of 254 m2 and 1.7 m high parapet wall. Taking into account its concerned features, the PV utilization factor for the roof has been calculated to be 0.13. The examined villa has a rectangular-shaped roof of 240 m2 gross area and a parapet wall of 3 m height. The utilization factor (UF) for the roof has been calculated to be 0.15. Table 3 highlights some of the important features of the two case study buildings. Table 3 shows the rooftops of the two buildings occupied by different types of hurdles towards the use of PV. The impact of PV panels, as shading surfaces, on the annual cooling energy use has been investigated for the villa case study. As-built drawings including architectural, structural and electrical plans were collected from the owner to gather as much data required for the simulation. Other characteristics related to internal loads such as occupancy and operational schedule of appliances, lighting and air condition (AC) systems were obtained through inspections as well as interviews with the owner. The single-family villa has an insulated flat concrete roof while the walls are made of concrete blocks which represents typical constructions of KSA homes. In addition, the house has single pane windows with a window-to-wall ratio of 8%. Each floor is modeled as a separate thermal zone reflecting the actual scenario. Given the extremely hot climate of Al-Khobar city, cooling is required throughout the year with no heating requirements. With regards to internal gains, the house has 6 occupants, an average lighting power density (LPD) of 16 W/m2 and an equipment power density of (EPD) of 4 W/m2. With regards to occupancy, given the local cultural practices, the house is typically occupied round the clock. Table 4 summarizes the main characteristics and specifications of the studied villa.

5. Net Energy Contribution by Solar PV System

The net energy contribution from a PV system on a building’s rooftop consists of the power generation and the energy savings resulting from the shading effect of PV panels on the roof structure. This section describes the PV electricity production and its influence on thermal loads at the individual building level as well as the total power production at the macro level.

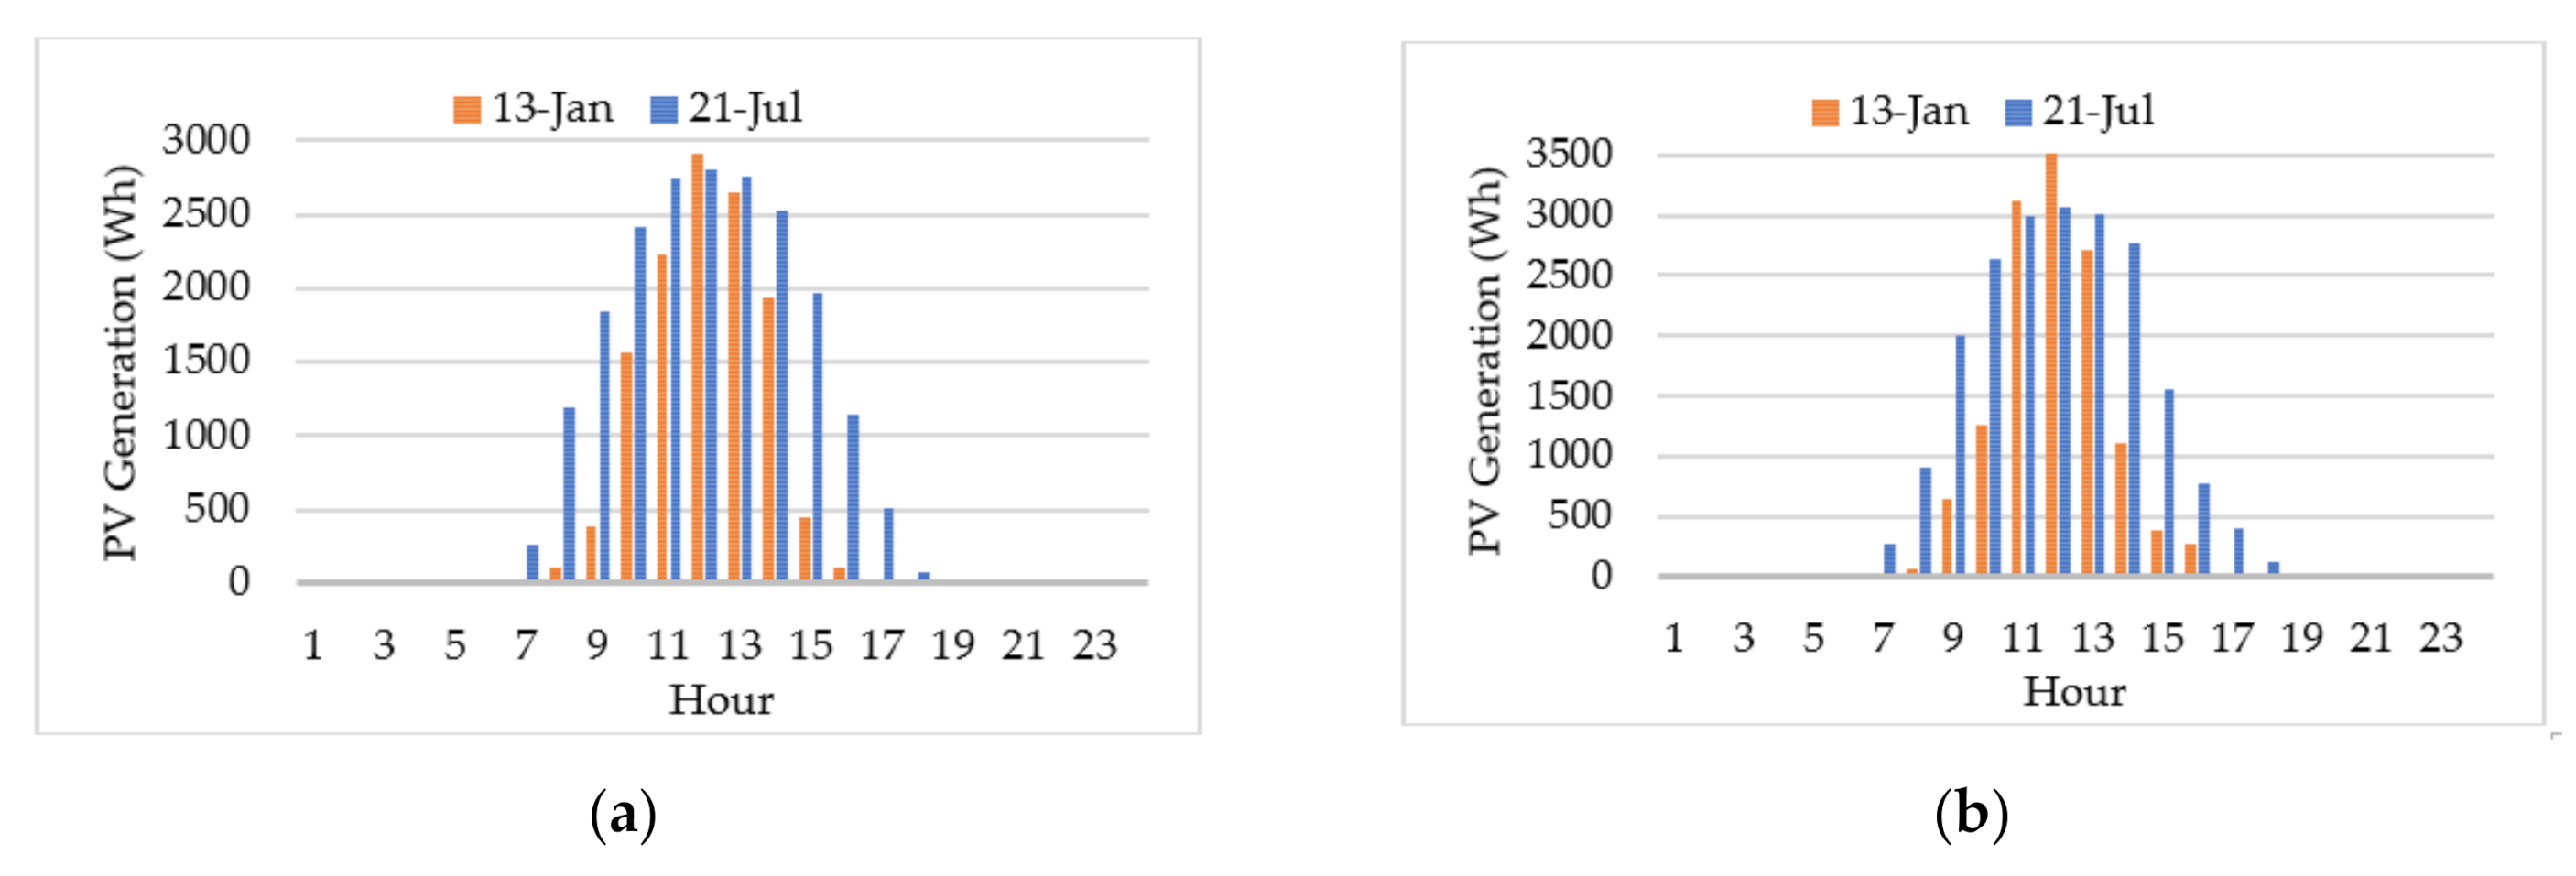
5.1. Energy Production

Energy production from PV systems is calculated with the help of PVSOL [31]. Two mounting scenarios are investigated: south facing at the optimum tilt angle (typically equals to the site latitude or slightly lower) of 24° and flat (horizontal). The selected PV module is monocrystalline silicon (m-si). With a module area of 1.25 m2, its peak capacity and efficiency values are 190 W and 15.2%, respectively, as highlighted in Table 5 [32].
The PVSOL software has the ability to optimize the inter-row spacing in accordance with the shading analysis as of 21 December (winter solstice) when the sun is at the lowest altitude. The optimum inter-row distance has been figured out to be 0.40 m for the tilted panels to avoid self-shading from the PV panels. The software also helps undertake shading frequency assessment to estimate the impact of shading on the received solar radiation. The present analysis excludes the modules that have 20% or more reduction in irradiance as a result of shading. Module configuration for optimum output is figured out with the help of the software. Finally, the average PV output from the sample buildings is used to determine the potential PV electricity generation at city scale for flat and tilted PV panels.

5.2. Energy Savings

Rooftop solar PV’s contribution to buildings, especially in harsh climatic conditions, is through not only the generated power but also the shading effect to the roof surface. In hot climatic conditions, incident solar radiation on roofs significantly add to a building’s cooling load. PV panels on a building’s roof can help cut the cooling load by providing a shade to the roof blocking the direct penetration of solar radiation to it. Energy saving in the studied villa due to the shading effect of PV panels has been modeled with the help of EnergyPlus. The cooling energy saving potential has been explored for a range of utilization factors when the PV system is tilted at 24°. Specifically, the analysis is conducted for UFs of 0.15, 0.25 and 0.40 as shown in Figure 3.

6. Environmental and Economic Analysis

6.1. Environmental Analysis

An important advantage of PV technology is that it can assist in reducing the GHGs emissions that would be otherwise generated by burning fossil fuels. The equivalent GHGs are calculated and estimated based on the available data in the literature [33]. The values obtained from the literature are as follows:
  • The conversion factor for carbon dioxide is 0.796 (tonCO2/MWh).
  • The conversion factor for methane is 0.02375 (kgCH4/MWh).
  • The conversion factor for nitrous oxide is 0.00409 (kgN2O/MWh).
The impact of GHGs savings can also contribute to economic savings when considering the profit from the sale of CO2 credits.

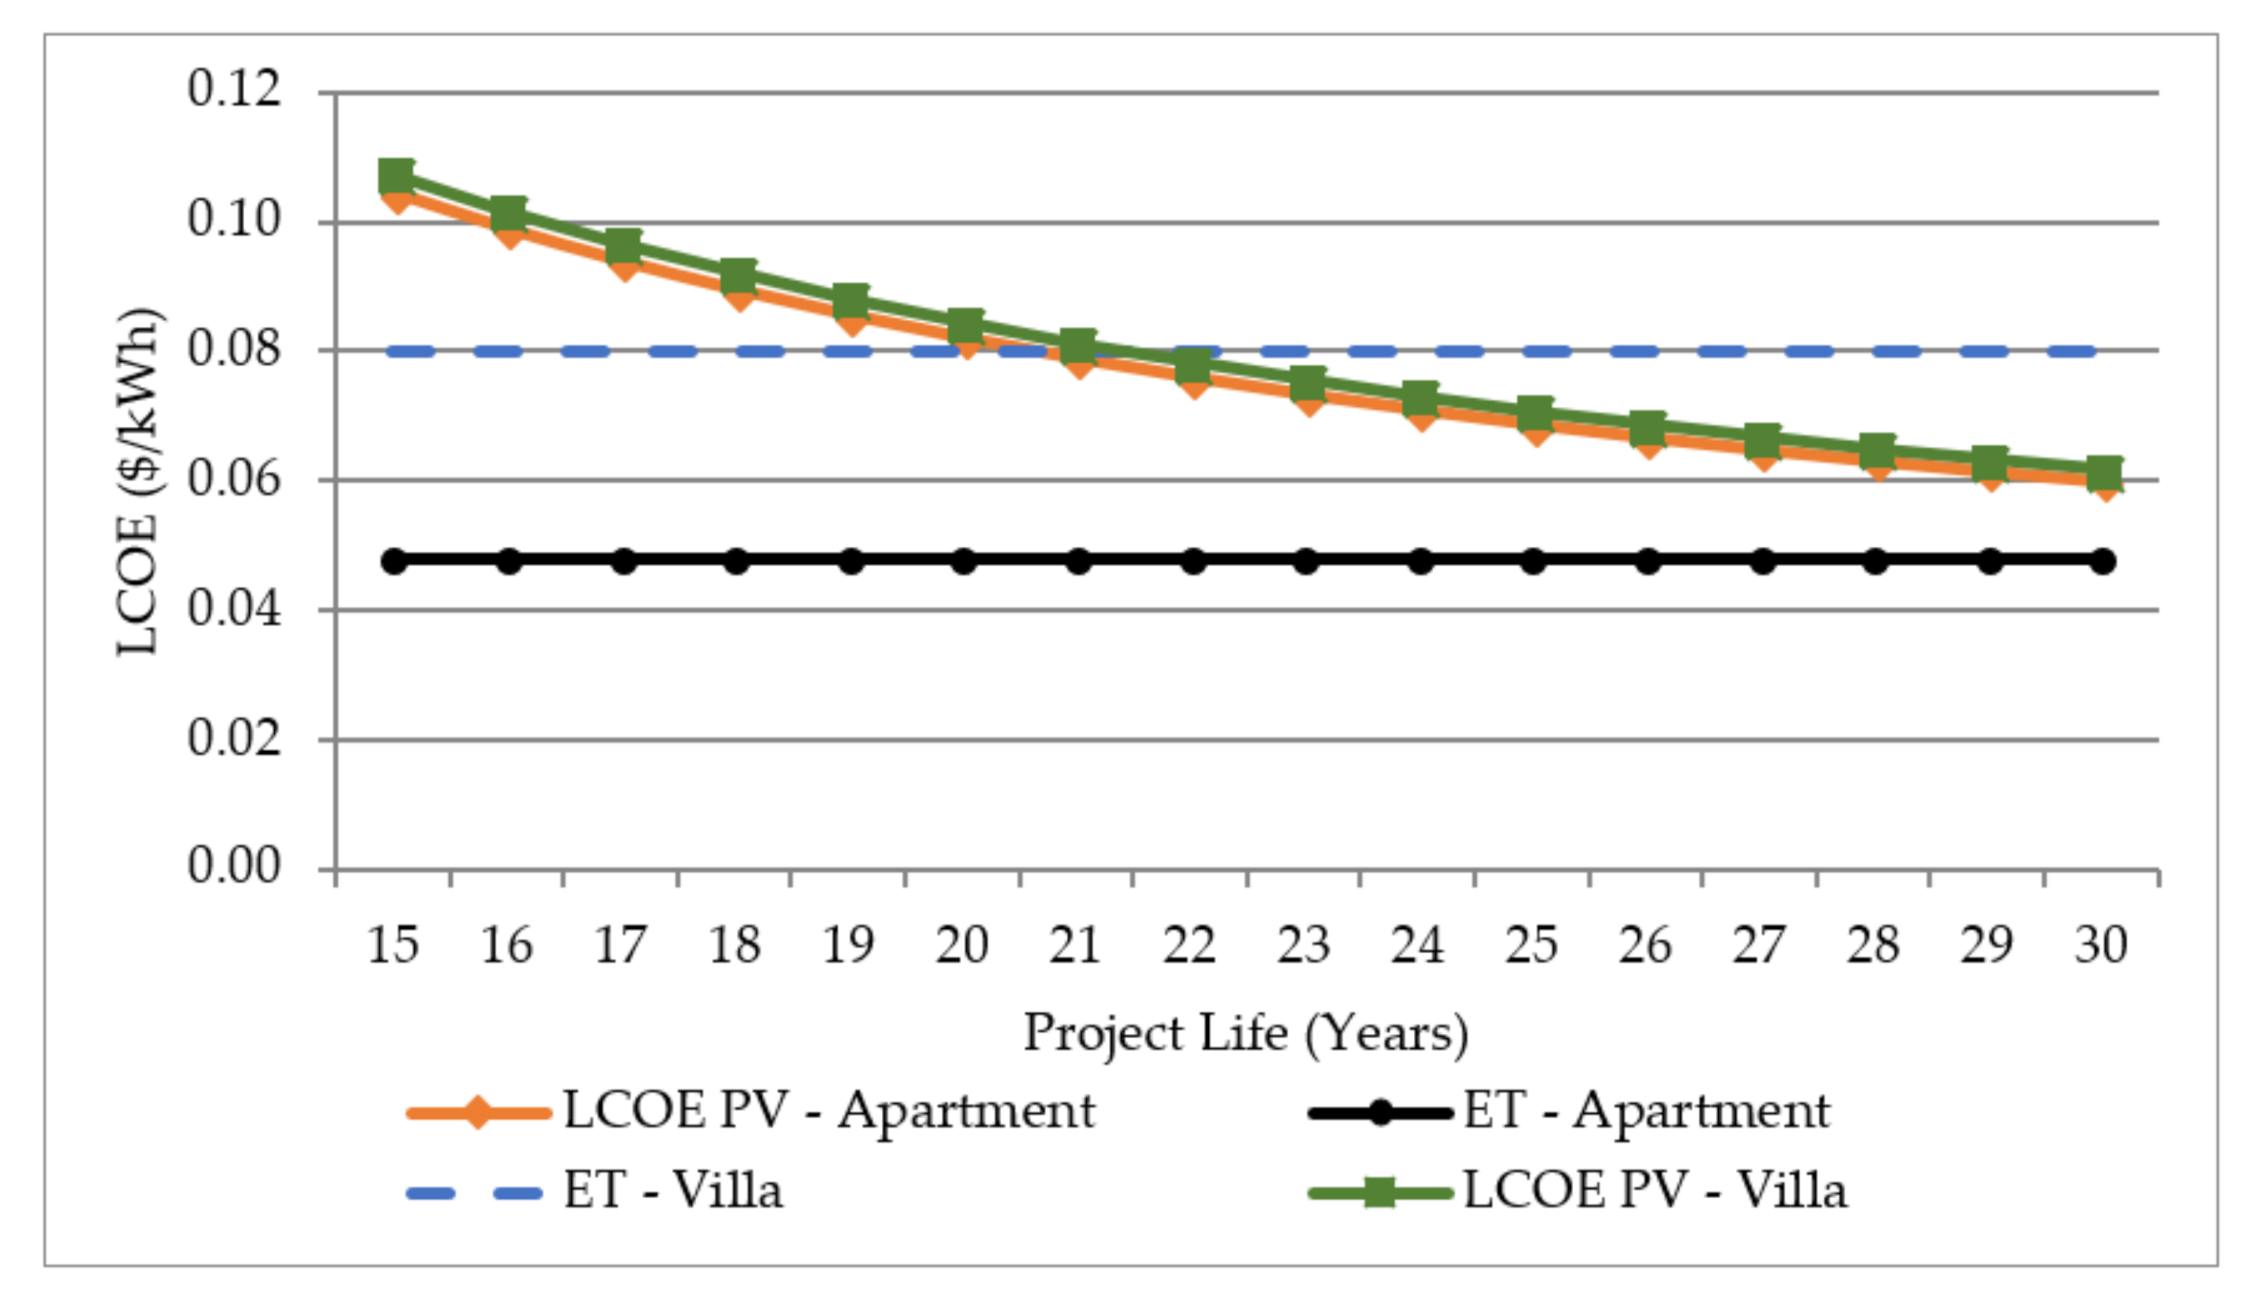
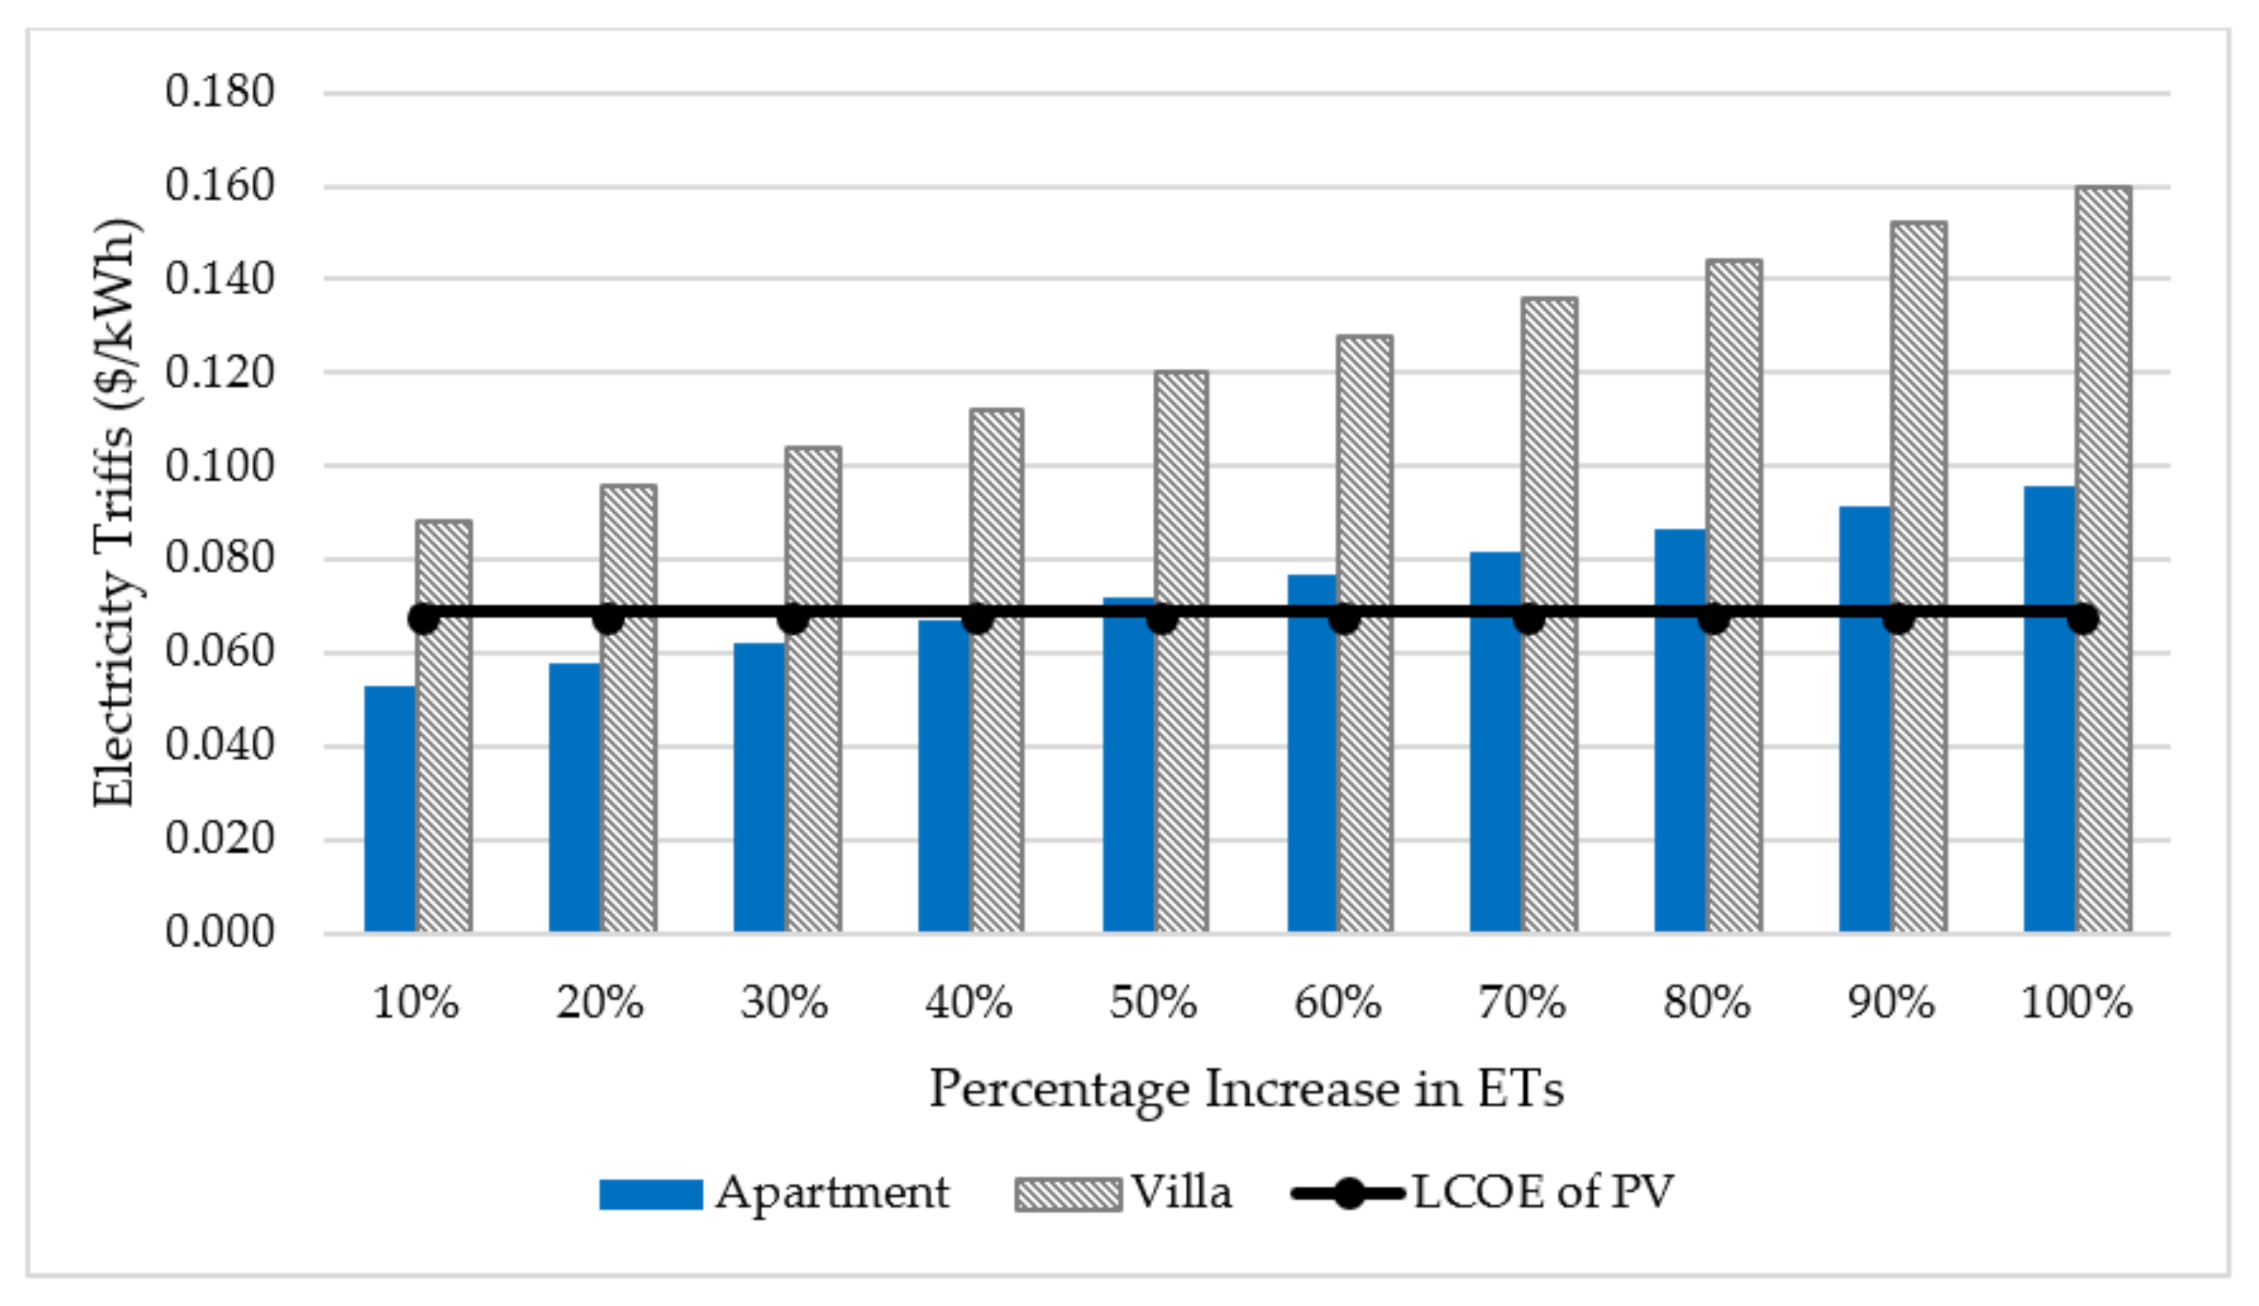
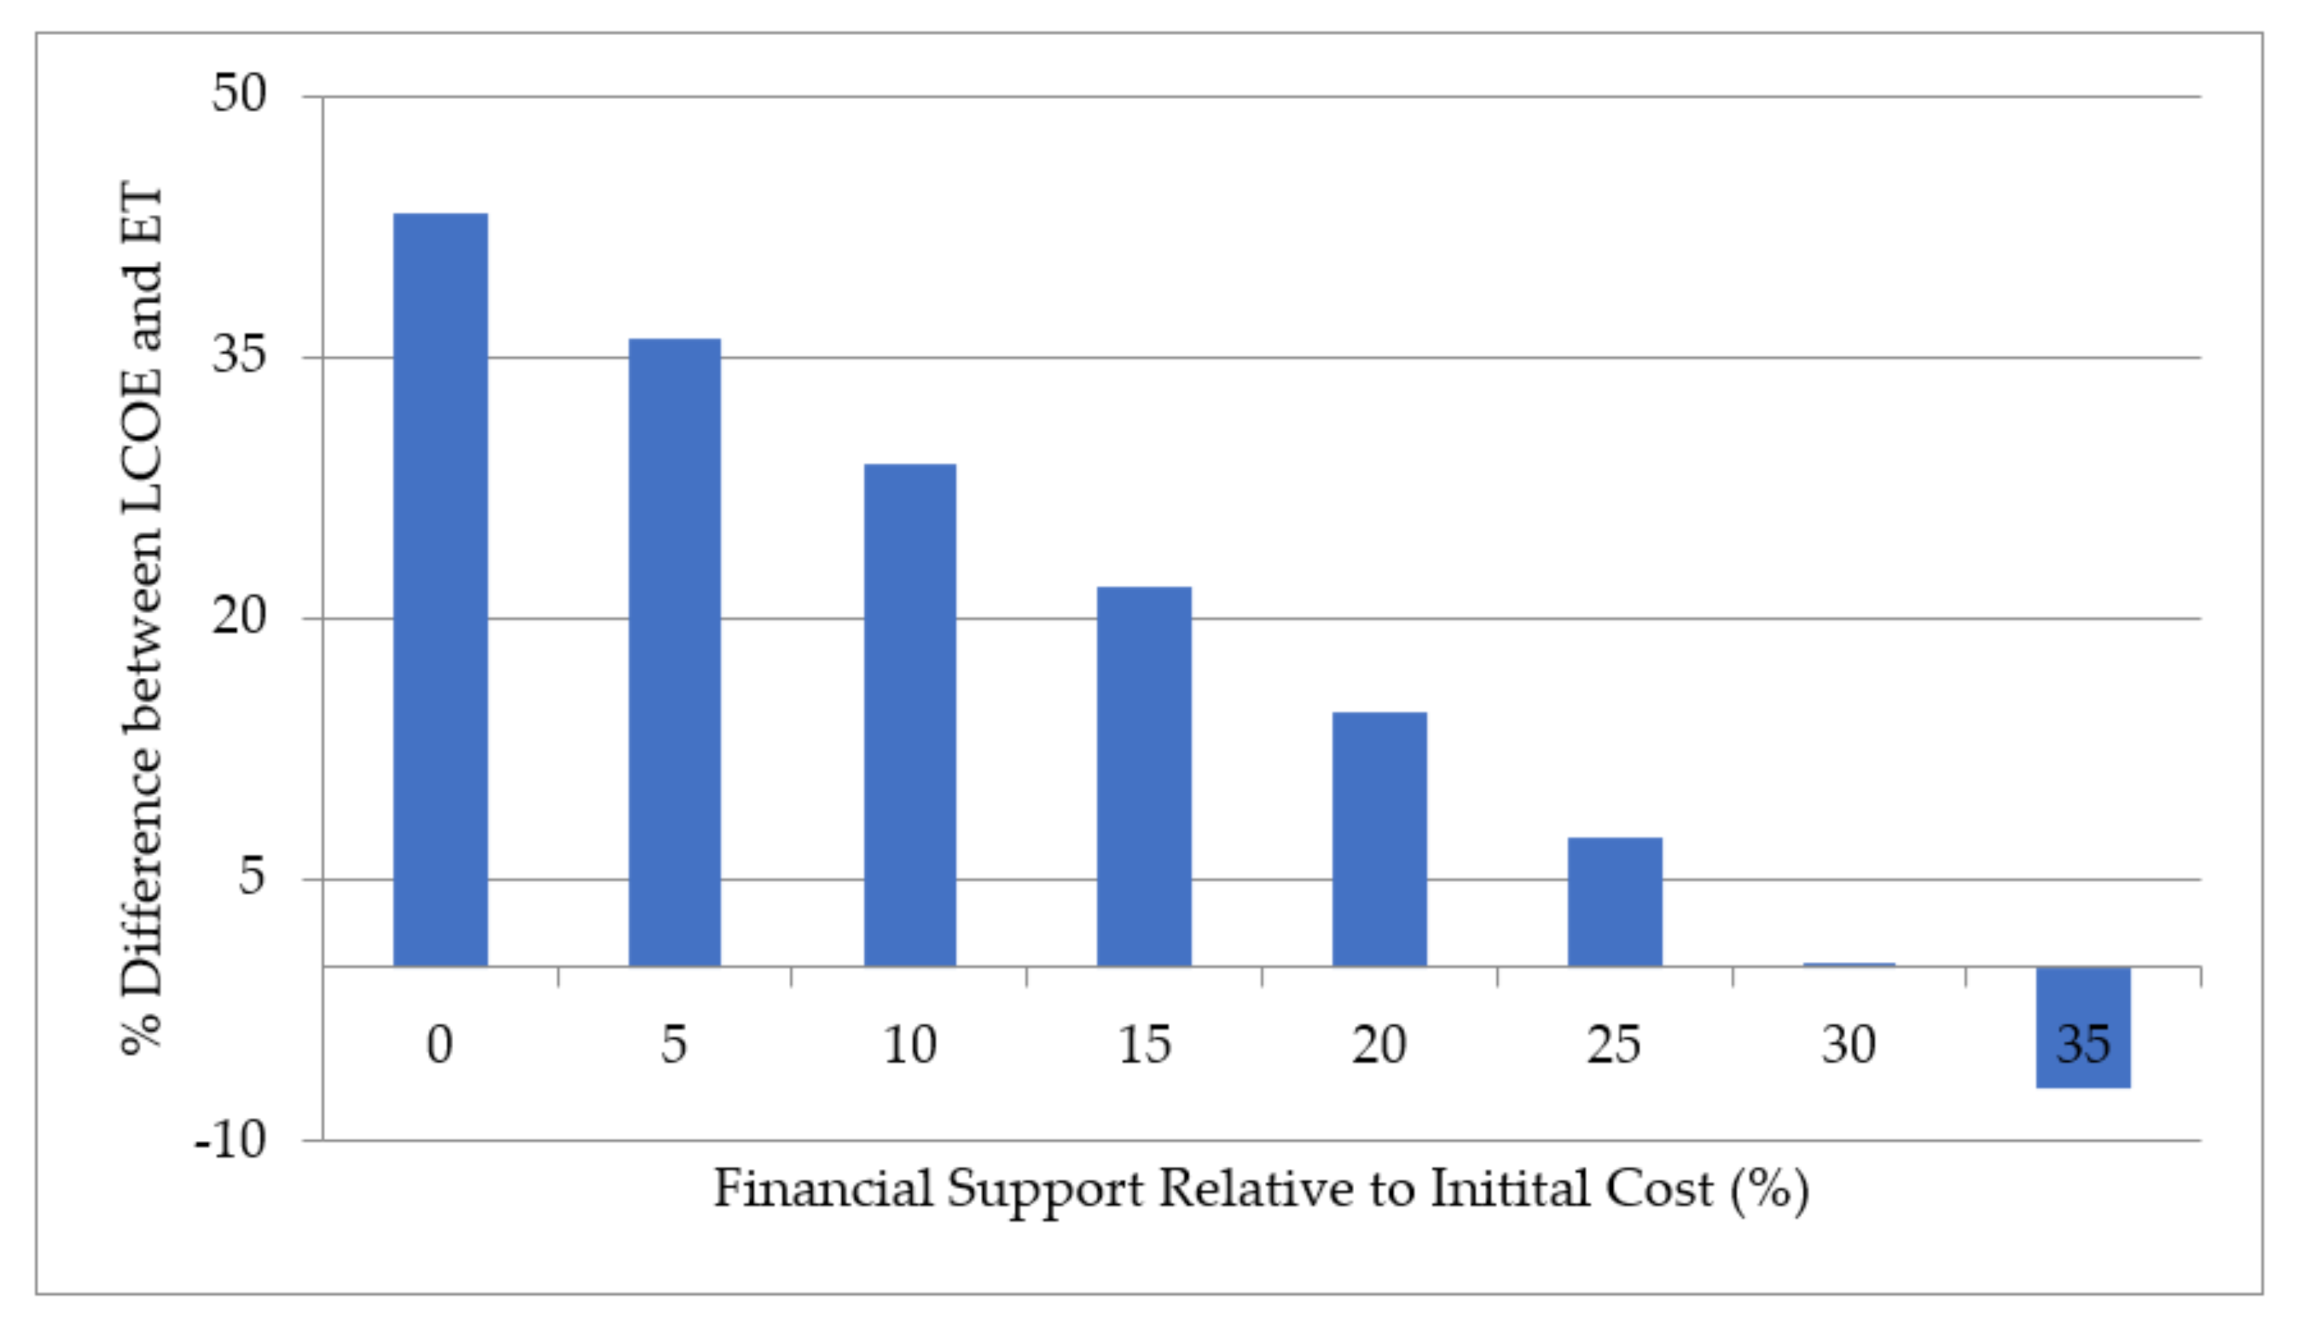
6.2. Economic Analysis

Implementation of rooftop PV requires an economic feasibility analysis to determine if it is worthy of investment. Researchers have identified several approaches to evaluate the profitability and the economic aspects of products and services. Some of the most commonly used of these techniques are: net present worth (NPW), annual worth (AW), simple payback period (SPP), discounted payback period (DPBP) and internal rate of return (IRR) [34]. The economic evaluation of rooftop PV systems should be considered in a case by case scenario. The assessment cannot be generalized due to the factors like buildings energy load profile, available solar resource, roof utilization factor and PV system design mechanics. Economic analysis has been undertaken for PV systems designed for the apartment and villa buildings described in Section 4. The main approach used to assess the feasibility of rooftop PV systems in this study is the levelized cost of electricity (LCOE). LCOE, in which its value is constant over the lifetime, is the most common approach used to compare electricity generation technologies [35,36,37,38,39]. LCOE calculations require an estimation of the annual energy production from PV as well as its total cost that includes capital as well as operation and maintenance (running) cost as shown in Equations (1) and (2) [40]. The numerator in Equation (1) represents the life cycle cost (LCC) of the PV system. The cash flow diagram of the PV system over its lifetime includes its initial cost, O&M cost and the two replacements costs for the inverter as shown in Figure 4. LCOE of the PV system is calculated and compared to the electricity tariff (ET) to verify the feasibility of the system.
L C O E =   C A   +   C O & M a E A
C A =   C I × C R F i , n
where C A is the annual investment cost ($), C O & M a is the annual operation and maintenance cost ($), E A is the PV annual energy production (kWh), C I is the cost of investment ($), C R F is the capital recovery factor, i is the interest rate and n is the system service life (years).
The following factors are considered for the economic analysis:
  • The life expectancy of PV models is over 25 years [5,35].
  • The initial cost considers the following elements: system cost including PV panels, inverters, support and integration and installation cost. These were collected from local practitioners.
  • The operating and maintenance (O&M) cost of the system incorporates replacements costs. Inverter life has been considered to be 10 years [41]. The overall maintenance cost has been considered to be 1% of the initial cost [40].
  • The Performance Ratio (PF) for mono-crystalline PV is commonly between 75% and 85%.
  • Degradation which is the reduction in output over time is considered in a linear manner. Manufactures guarantee a minimum power output of 93% and 85% over 12 and 25 years respectively. This can be seen as an average degradation number of 0.6%/year.
  • Interest rate has been assumed to be 2% considering the average value over the previous decade [42].
Based on the aforementioned points, the economic and cost parameters used for the feasibility assessment in the current study are summarized in Table 6.
Another useful indicator is SPP which is the simplest form of economic indicators. It can be defined as the time required to repay the up-front cost of the investment. This method is simple because the time value of money is not considered and hence an interest rate value is not required. The SPP can be calculated by dividing the investment cost by the cost savings from PV electricity production ( E S A ) as shown Equation (3).
S P P =   C I E S A
However, as an additional indicator, a discounted payback period approach is used. This indicator considers life cycle cost and hence the time value of money is accounted for in contrast to the SPP. The discounted payback period (DPBP) referred to in this study is expressed in Equation (4) [43].
D P B P = l n 1 1 C I × i C F A ÷   l n 1 + i
where C F A is the annual net cash inflows, assumed to be consistent every year throughout the PV system’s life. KSA uses a slab-based tariff structure in which each range of consumption (kWh/month) relates to a different price. The current tariffs system is shown in Table 7 for different building types [44]. A villa typically consumes more electricity in terms of kWh/month compared to an individual apartment unit. Therefore, tariff rates of USD 0.08/kWh (SAR 0.30/kWh) and USD 0.048/kWh (SAR 0.18/kWh) are considered for villas and apartments, respectively.
A sensitivity analysis has been conducted to better evaluate the impact of various cost and design parameters on the feasibility of PV systems. These parameters include capital cost, O&M costs, interest rate, percentage of utilizable area and electricity prices. The variables are changed one at a time based on an error range of ±50%. The NPV indicator is used for the sensitivity analysis. NPV can be calculated by comparing the present value of expenditures (outgoing cash flows) and benefits (incoming cash flows) over the investigated period as indicated in Equation (5) where C 0 is the capital cost. The sum of all cash flows at their present value is called NPV such that if the NPV is positive then the investment is worthy.
N P V =   y = 1 n C F A 1 + i y C 0  
Several scenarios are considered to investigate the viability of PV systems. Recently, the KSA government has started restructuring the energy sector through subsidy reform. The energy prices have seen major changes since 2016 starting with a 45% increase in electricity tariffs (ETs) in a single go. The government plans to remove over SAR 200 billion of subsidies from the utility sector by the end of 2020 [23]. Hence, one of the scenarios reflects the escalation of the ETs to mimic future scenarios. In addition, direct incentive approach in terms of providing financial support relative to the initial cost is also considered. Other scenarios such as considering CO2 credits and increasing the rooftop PV area are also examined. The impact of each scenario is investigated separately to find the breakeven points. The discounted payback period (DPBP) is presented to view an indication of the time needed to recover the cost of the investment. Net metering is a policy that has been adopted across the world to export the surplus electricity produced by PV to the grid at the local tariff rate. The Saudi Electricity and Cogeneration Regulatory Authority (ECRA) have announced the first framework of net metering for small scale project (<2000 kW) [45]. Owing to the infrastructural requirements, the policy is yet to be formally implemented.

7. Results and Discussion

The main results of this study involve technical, environmental and economic assessments of rooftop PV systems. The technical assessment includes area availability as well as net generation from PV systems. The following subsections present the technical and environmental assessments at the building and city levels. In addition, a detailed economic assessment is discussed for the representative buildings described in Section 4.

7.1. Rooftop Area Availability

As mentioned in Section 3, 70 samples of combined apartment buildings and villas have been investigated for their rooftop area availability for PV applications. The average values of the five rooftop restriction coefficients are summarized in Table 8. These restriction coefficients are used to estimate the UF of each sample building. The study found that the net UF can range from 0 to 0.40 for apartment buildings with an average of 0.21 while the net UF for villas is found to range from 0.15 to 0.44 with an average of 0.28. Figure 5 shows the frequency distribution of the UFs for the seventy sample buildings. Utilizing ArcGIS software, and using a linear regression model, the total area available for PV application at the city level, encompassing 100 km2 and 33,000 buildings, is found to be equivalent to 1,460,350 m2 and 2,323,070 m2 for apartments and villas, respectively.

7.2. Net Energy Contribution

7.2.1. PV Power Production

The PV power generation has been estimated using PVSOL software. Figure 6 shows the daily PV power outputs when the tilted panels are installed on apartment and villa rooftops for a summer and winter days. It can be seen that the daily power production is fairly the same for apartment and villas since they have almost similar PV system capacity. However, there are still few differences due to various factors including system capacity, shading and system losses. In particular, during a hot summer day (i.e., 21 July), the total PV power production is around 20.3 kWh/day while it is 13 kWh/day during a cold winter day of 13 January. Furthermore, Table 9 provides an overview of the performance of PV systems on the two case study buildings. PV system has been modeled both for tilted (at the optimum angle of 24) and horizontal application of panels. It can be observed that in the case of horizontal application of panels, apartment and villa buildings can have 33% and 58% higher installed capacity, respectively. Horizontally applied PV panels, however, receive 8% lower level of solar radiation compared to the tilted ones. Accordingly, tilted application of PV appears to be delivering 9.8% and 5.4% higher kWh/kWp for apartment and villa buildings, respectively. The decision about the tilted or horizontal application of PV panels therefore depends upon the project priority, maximum installed capacity or optimum system performance. Furthermore, the percent reduction in annual irradiance due to shading on the PV modules is found to be 20% and 18% for apartment and villa buildings, respectively, as shown in Table 9.
Extrapolation of the results at the city-level has been conducted by calculating the power output in terms of per unit area of PV panels. The annual output from the tilted application of PV is 207 kWh/m2 and 213 kWh/m2 for the apartment and villa residential units, respectively. The total energy produced from the PV systems in the two buildings is summarized in Table 10. Based on the average electricity production and the total available area for PV installation at the city level, the total energy production for tilted PV is found to be 302 GWh/y and 495 GWh/y for apartment building and villa buildings, respectively. On the other hand, the output from horizontally installed PV panels is 296 GWh/y and 461 GWh/y respectively for apartment and villa buildings.

7.2.2. Impact on Thermal Loads

The output from tilted PV panels on roof with a UF of 0.15 has been modeled to offset 10% of the building’s total energy requirements. It is noteworthy that dwellings in Saudi Arabia have considerably high level of energy consumption as compared to the global average [11]. It is found that improving the UF from 0.15 to 0.25 can enhance the PV contribution to the building’s energy requirements from 10% to 19%. A 40% UF can help PV meet 29% of the total energy load. For the three discussed scenarios, the annual contribution from the PV is 13 kWh/m2, 24 kWh/m2 and 37 kWh/m2 as shown in Table 11. It has been figured out that the shading effect of PV panels can help reduce the building’s cooling load by 1.0%, 2% and 3% for utilization factors of 0.15, 0.25 and 0.40, respectively. While PV panels have been observed to have a bit of positive impact on the energy performance of the building in summer, it can also have a slight negative impact in winter due to greater heating load. In the case of this study, the incremental impact of heating load is insignificant as compared to that of the reduced cooling load.

7.3. Environmental and Economic Assessments

The environmental analysis has been carried out in terms of the saved GHGs emissions. The GHGs emissions reduction as a result of installing PV on the rooftop of the investigated villa and apartment building was found to be 5 CO2 tons for both building types. Extrapolating the GHG emissions reduction to the urban context shows the significance of the savings, hence it was extrapolated to the city as presented in Table 12. Installing PV systems on residential rooftops of the city can generate 675.1 GWh of electricity which corresponds to 537.4 kt of CO2 emissions reduction. Emissions reductions in terms of methane and nitrous oxide are presented in Table 12 as well.
The economic analysis of the PV system in the study is mainly based upon the LCOE. The sensitivity of the LCOE for PV system’s service life between 15 years and 30 years has been shown in Figure 7. It can be observed that the LCOE decreases from USD 0.105/kWh to USD 0.060/kWh and from USD 0.108/kWh to USD 0.062/kWh as the lifetime increases from 15 years to 30 years for the apartment and villa, respectively. This can be translated into a 43% reduction in the LCOE over the considered lifetime period. Specifically, for a service life of 25 years, the cost of energy is found to be USD 0.069/kWh (SAR 0.258/kWh) and USD 0.071/kWh (SAR 0.265 kWh) for the apartment and villa, respectively. The respective values of the DPBP for the apartment building and villa are found to be 27 years and 15 years. The significant difference between the two payback periods is attributed to the difference in the annual energy savings that depends on the electricity tariffs. This indicates that economically, PV is more viable in villas as compared to apartments. However, it is found infeasible for the apartment building as the LCOE is significantly higher (44%) than the corresponding electricity tariff. Hence, purchasing electricity from the grid is a better option than installing PV for this case. Given the high number of flats within the apartment building, the electricity produced by the comparatively small rooftop PV system is only a small fraction of the total electricity consumption of the entire building.
A sensitivity analysis is undertaken for a total of five technical and economic parameters to understand their influence on the viability of PV systems. It can be observed that electricity tariff is the most important factor that influences the economic viability of PV systems, followed by interest rate and initial cost as shown in Figure 8. The O&M costs and PV area have minimal influence on the economic viability of PV system. Further scenarios involving some of these parameters are investigated to determine the viability of the PV system for the apartment building.
Since, presently, PV system is found to be viable only for the villa, four possible options are considered based on policies and incentives adopted from the literature to improve its viability for the apartment building. These options include ETs escalation, direct financial incentives, avoided carbon cost and availability of larger rooftop area. Figure 9 shows the impact of increasing the electricity tariffs up to 100% of the current prices for both building types. It can be observed that economic viability will support PV system for apartment buildings in case of a 50% jump in ETs.
The impact of direct financial incentive in terms of a percentage of initial cost on the LCOE of PV has been investigated. Figure 10 depicts the results of the analysis and shows that as the support increases, the gap between the LCOE and the ET decreases. Parity can be achieved with support of 35% of the capital cost from the government funding. The LCOE of PV in this case is found to be USD 0.0447/kWh which is 7% lower than that of the ET of the apartment building. In addition, the DPBP can drop from 27 years (typical scenario) to 16 years with this incentive. To boost the profitability of the PV system, incentives in terms of carbon credit is accounted for based on the avoided CO2 emissions cost. This cost is added to the calculations of the LCOE for the apartment building case. Figure 11 shows the LCOE results when the equivalent cost of CO2 emissions varies from USD 5/tCO2 to USD 45/tCO2. It is evident from Figure 11 that the PV system can be feasible if the avoided cost of CO2 emissions is set at USD 30/tCO2. The LCOE is found to be USD 0.045/kWh and the investment can be recovered in 16 years. Finally, the impact of the utilizable area (or availability of area for PV application) on the economy of PV has been also investigated. The cost of the PV system reduces as the capacity increases due to the economy of scale. Figure 12 presents the LCOE for the PV system when the percentage of utilizable area is increased from 13% (i.e., existing scenario) to 90%. According to Figure 12, increasing the PV available area is not helpful unless a cost of avoided carbon incentive is considered. When considering a USD20/tCO2 cost of carbon, the breakeven point occurs at 50% utilizable area.
Based on the sensitivity analyses, a combination of policy measures and incentives can help in reducing the burden on the government as well as investors. For instance, a combination of financial support and avoided cost of carbon emissions can help in reducing the LCOE of PV. Specifically, considering only 15% of initial cost support in addition to USD 15/tCO2 for carbon cost can achieve an LCOE of USD 0.0465/kWh and a DPBP of 17 years. Other possible scenarios can also be deduced from the sensitivity analyses that can enhance the profitability of PV systems for apartment building applications. The economic analysis showed the importance of different types of incentives. Saudi Arabia should benefit from the policies undergoing in developed nations. Removal of subsidies on electricity tariffs can significantly improve the economic viability of PV systems in buildings. The fact that Saudi Arabia has started a subsidy reform program in which it is targeting to increase electricity tariffs gradually [46], will help in promoting PV market. Net metering policy may not be very attractive for the residential sector in KSA for a couple of reasons; firstly, given the low UF of roofs, PV systems would hardly produce surplus electricity to be exported to grid; and secondly, the export tariff may not be promising enough.

8. Conclusions

The study aimed to investigate the technical and economic viability of rooftop PV systems for residential buildings in hot–humid climates focusing on the city of Al-Khobar in KSA as the study area. The analysis was performed for the two common types of residential buildings in the country: villas and apartments. The technical assessment mainly focused on three areas: calculation of utilization factor of roofs, estimation of power production form PV systems and the assessment of the indirect effect of PV panels on building’s thermal loads. Different types of roof features hindering the application of PV have been classified into five main categories: structural, building services, accessibility, shading and others. The overall utilization factor (UF) is found to range from 0 to 0.40 for apartment buildings with an average of 0.21, and from 0.15 to 0.44 for villas with an average of 0.28. The case study apartment and villa residential units have 13% and 15% of their roof area available for PV, producing 6079 kWh and 6162 kWh of electricity per year, respectively. At the city-level, encompassing 100 km2 and 33,000 buildings, the combined PV output from apartment and villa buildings has been estimated to be 797 GWhGWh and 757 GWh for tilted and horizontal installment of PV panels, respectively. It has been figured out that the shading effect of PV panels can help reduce the building’s cooling load by up to 3% when the villa has a UF of 0.40. For the villa, the LCOE of the PV system is found to be USD 0.071/kWh with a discounted payback period of 15 years considering a service life of 25 years. A sensitivity analysis has been carried out to determine the influence of various parameters on the economic viability of PV systems. Several scenarios are considered to improve the economic viability of PV application. For instance, considering a 35% support towards the initial cost, the LCOE of PV can be reduced to USD 0.0447/kWh and the upfront cost can be recovered within 16 years. Moreover, the PV system can be feasible if the avoided cost of CO2 emissions is set at USD 30/tCO2. A combination of financial support and avoided cost of carbon emissions can further improve the economics of PV systems. It is thus concluded that PV system is still a relatively expensive option in the residential sector of KSA. There is need for financial incentives to improve the economic viability of PV systems for residential consumers.

Author Contributions

Conceptualization, M.A.; investigation, A.H.A.D.; methodology, A.H.A.D., M.A., I.M.B. and A.A.; project administration, A.H.A.D.; resources, A.H.A.D.; supervision, A.H.A.D., M.A., I.M.B. and A.A.; validation, A.H.A.D.; visualization, A.H.A.D.; writing—original draft, A.H.A.D.; writing—review and editing, A.H.A.D., M.A. and I.M.B. All authors have read and agreed to the published version of the manuscript.

Funding

Authors acknowledge the financial support from the King Fahd University of Petroleum and Minerals.

Conflicts of Interest

The authors declare no conflict of interest.

References

  1. Intergovernmental Panel on Climate Change (IPCC). Global Warming of 1.5 °C, Special Report for Policy Makers; IPCC: Geneva, Switzerland, 2018. [Google Scholar]
  2. Landberg, R. Climate Crisis Spurs UN Call for $2.4 Trillion Fossil Fuel Shift, Bloomberg. 2018. Available online: https://www.bloomberg.com/news/articles/2018-10-08/scientists-call-for-2-4-trillion-shift-from-coal-to-renewables (accessed on 1 December 2020).
  3. Alawneh, R.; Ghazali, F.; Ali, H.; Asif, M. A new index for assessing the contribution of energy efficiency in LEED 2009 certified green buildings to achieving UN sustainable development goals in Jordan. Int. J. Green Energy 2019, 16, 490–499. [Google Scholar] [CrossRef]
  4. Alawneh, R.; Mohamed, F.E.; Ali, H.; Asif, M. Assessing the contribution of water and energy e ffi ciency in green buildings to achieve United Nations Sustainable Development Goals in Jordan. Build. Environ. 2018, 146, 119–132. [Google Scholar] [CrossRef]
  5. Asif, M.; Hassanain, M.A.; Nahiduzzaman, K.M.; Sawalha, H. Techno-economic assessment of application of solar PV in building sector. Smart Sustain. Built Environ. 2019, 8, 34–52. [Google Scholar] [CrossRef]
  6. Asif, M. Urban scale application of solar PV to improve sustainability in the building and the energy sectors of KSA. Sustainability 2016, 8, 1127. [Google Scholar] [CrossRef] [Green Version]
  7. Mbungu, N.T.; Naidoo, R.M.; Bansal, R.C.; Siti, M.W.; Tungadio, D.H. An overview of renewable energy resources and grid integration for commercial building applications. J. Energy Storage 2020, 29. [Google Scholar] [CrossRef]
  8. Liu, J.; Wang, M.; Peng, J.; Chen, X.; Cao, S.; Yang, H. Techno-economic design optimization of hybrid renewable energy applications for high-rise residential buildings. Energy Convers. Manag. 2020, 213, 112868. [Google Scholar] [CrossRef]
  9. Nicholls, A.; Sharma, R.; Saha, T.K. Financial and environmental analysis of rooftop photovoltaic installations with battery storage in Australia. Appl. Energy. 2015, 159, 252–264. [Google Scholar] [CrossRef]
  10. Muhaimin, A.; Ramirez-iniguez, R.; Asif, M.; Bakar, A.; Muhammad-sukki, F. Progress of solar photovoltaic in ASEAN countries: A review. Renew. Sustain. Energy Rev. 2015, 48, 399–412. [Google Scholar] [CrossRef]
  11. Alrashed, F.; Asif, M. Trends in residential energy consumption in Saudi Arabia with particular reference to the Eastern province, J. Sustain. Dev. Energy. Water Environ. Syst. 2014, 2, 376–387. [Google Scholar] [CrossRef] [Green Version]
  12. Al-qawasmi, J.; Asif, M.; Abd, A.; Fattah, E.; Babsail, M.O. Water Efficiency and Management in Sustainable Building Rating Systems: Examining Variation in Criteria Usage. Sustainability 2019, 11, 2416. [Google Scholar] [CrossRef] [Green Version]
  13. Al Fardan, A.S.; Al Gahtani, K.S.; Asif, M. Demand side management solution through new tariff structure to minimize excessive load growth and improve system load factor by improving commercial buildings energy performance in Saudi Arabia. In Proceedings of the 2017 IEEE International Conference on Smart Energy Grid Engineering (SEGE), Oshawa, ON, Canada, 14–17 August 2017; pp. 302–308. [Google Scholar] [CrossRef]
  14. Alrashed, F.; Asif, M. An exploratory of residents ’ views towards applying renewable energy systems in Saudi dwellings. Energy Procedia 2015, 75, 1341–1347. [Google Scholar] [CrossRef] [Green Version]
  15. Ahmed, W.; Fardan, H.; Asif, M. Integration of building energy modeling in the design process to improve sustainability standards in the residential sector—Case study of the Eastern Province of Saudi Arabia. In Proceedings of the 2017 IEEE International Conference on Smart Energy Grid Engineering (SEGE), Oshawa, ON, Canada, 14–17 August 2017; pp. 309–314. [Google Scholar] [CrossRef]
  16. Saudi Arabia Targets 60 GW of Renewables by 2030—Report, Renewablesnow. 2019. Available online: https://renewablesnow.com/news/saudi-arabia-targets-60-gw-of-renewables-by-2030-report-639430/ (accessed on 1 December 2020).
  17. Alnaser, W.E.; Alnaser, N.W. The status of renewable energy in the GCC countries. Renew. Sustain. Energy Rev. 2011, 15, 3074–3098. [Google Scholar] [CrossRef]
  18. Ban-Weiss, G.; Wray, C.; Delp, W.; Ly, P.; Akbari, H.; Levinson, R. Electricity production and cooling energy savings from installation of a building-integrated photovoltaic roof on an office building. Energy Build. 2013, 56, 210–220. [Google Scholar] [CrossRef]
  19. Zhang, W.; Lu, L.; Peng, J. Evaluation of potential benefits of solar photovoltaic shadings in Hong Kong. Energy 2017, 137, 1152–1158. [Google Scholar] [CrossRef]
  20. Rosales-Asensio, E.; de Simón-Martín, M.; Borge-Diez, D.; Blanes-Peiró, J.J.; Colmenar-Santos, A. Microgrids with energy storage systems as a means to increase power resilience: An application to office buildings. Energy 2019, 172, 1005–1015. [Google Scholar] [CrossRef]
  21. Hong, T.; Lee, M.; Koo, C.; Jeong, K.; Kim, J. Development of a method for estimating the rooftop solar photovoltaic (PV) potential by analyzing the available rooftop area using Hillshade analysis. Appl. Energy 2017, 194, 320–332. [Google Scholar] [CrossRef]
  22. Buffat, R.; Grassi, S.; Raubal, M. A scalable method for estimating rooftop solar irradiation potential over large regions. Appl. Energy 2018, 216, 389–401. [Google Scholar] [CrossRef]
  23. Khan, M.M.A.; Asif, M.; Stach, E. Rooftop PV potential in the residential sector of the kingdom of Saudi Arabia. Buildings 2017, 7, 46. [Google Scholar] [CrossRef]
  24. Dehwah, A.H.A.A.; Asif, M.; Rahman, M.T. Prospects of PV Application in Unregulated Building Rooftops in Developing Countries: A Perspective from Saudi Arabia. Energy Build. 2018, 171, 76–87. [Google Scholar] [CrossRef]
  25. Dehwah, A.H.A.; Asif, M. Assessment of net energy contribution to buildings by rooftop photovoltaic systems in hot-humid climates. Renew. Energy 2019, 131, 1288–1299. [Google Scholar] [CrossRef]
  26. Melius, J.; Margolis, R.; Ong, S. Estimating Rooftop Suitability for PV: A Review of Methods, Patents, and Validation Techniques. NREL Tech. Rep. 2013, 35. Available online: www.nrel.gov/publications (accessed on 1 December 2020).
  27. Gagnon, P.; Margolis, R.; Melius, J.; Phillips, C.; Elmore, R. Rooftop Solar Photovoltaic Technical Potential in the United States: A Detailed Assessment. Nrel 2016, 82. Available online: https://www.nrel.gov/docs/fy16osti/65298.pdf (accessed on 1 December 2020).
  28. Baras, A.; Jones, R.K.; Alqahtani, A.; Alodan, M.; Abdullah, K. Measured soiling loss and its economic impact for PV plants in central Saudi Arabia. In Proceedings of the 2016 Saudi Arabia Smart Grid (SASG), Jeddah, Saudi Arabia, 6–8 December 2016; pp. 1–7. [Google Scholar] [CrossRef]
  29. Joint Research Centre (JRC). Photovoltaic Geographical Information System (PVGIS). 2012. Available online: http://re.jrc.ec.europa.eu/pvgis (accessed on 1 December 2020).
  30. Costanzo, V.; Evola, G.; Infantone, M.; Marletta, L. Updated typical weather years for the energy simulation of buildings in mediterranean climate. A case study for sicily. Energies 2020, 13, 4115. [Google Scholar] [CrossRef]
  31. Valentin-Software, PV*SOL Premium. 2020. Available online: https://valentin-software.com/en/products/pvsol-premium/ (accessed on 1 December 2020).
  32. BP Solar, 190 W Photovoltaic Module—BP 4190T, (n.d.). Available online: http://smdelectricalservices.co.uk/ESW/Files/BP4190T_datasheet.pdf (accessed on 29 May 2018).
  33. Brander, M.; Sood, A.; Wylie, C.; Haughton, A.; Lovell, J. Electricity-Specific Emission Factors for Grid Electricity; Ecometrica: Boston, MA, USA, 2011; p. 21. [Google Scholar]
  34. Rodríguez, L.R.; Lissén, J.M.S.; Ramos, J.S.; Jara, E.Á.R.; Domínguez, S.Á. Analysis of the economic feasibility and reduction of a building’s energy consumption and emissions when integrating hybrid solar thermal/PV/micro-CHP systems. Appl. Energy 2016, 165, 828–838. [Google Scholar] [CrossRef]
  35. Dehwah, A.H.A.; Krarti, M. Optimal Hybrid Power Energy Systems for Residential Communities in Saudi Arabia. J. Sol. Energy Eng. 2019, 141, 1–10. [Google Scholar] [CrossRef]
  36. Sadati, S.M.S.; Jahani, E.; Taylan, O.; Baker, D.K. Sizing of Photovoltaic-Wind-Battery Hybrid System for a Mediterranean Island Community Based on Estimated and Measured Meteorological Data. J. Sol. Energy Eng. Trans. 2018, 140, 1–12. [Google Scholar] [CrossRef]
  37. Tervo, E.; Agbim, K.; DeAngelis, F.; Hernandez, J.; Kim, H.K.; Odukomaiya, A. An economic analysis of residential photovoltaic systems with lithium ion battery storage in the United States. Renew. Sustain. Energy Rev. 2018, 94, 1057–1066. [Google Scholar] [CrossRef]
  38. Patel, M.T.; Khan, M.R.; Sun, X.; Alam, M.A. A worldwide cost-based design and optimization of tilted bifacial solar farms. Appl. Energy 2019, 247, 467–479. [Google Scholar] [CrossRef] [Green Version]
  39. Al-Sharafi, A.; Sahin, A.Z.; Ayar, T.; Yilbas, B.S. Techno-economic analysis and optimization of solar and wind energy systems for power generation and hydrogen production in Saudi Arabia. Renew. Sustain. Energy Rev. 2017, 69, 33–49. [Google Scholar] [CrossRef]
  40. Adaramola, M.S. Techno-economic analysis of a 2.1 kW rooftop photovoltaic-grid-tied system based on actual performance. Energy Convers. Manag. 2015, 101, 85–93. [Google Scholar] [CrossRef]
  41. Zweibel, K. Should solar photovoltaics be deployed sooner because of long operating life at low, predictable cost? Energy Policy 2010, 38, 7519–7530. [Google Scholar] [CrossRef]
  42. Saudi Arabia Interest Rate. 2020. Available online: https://tradingeconomics.com/ (accessed on 1 December 2020).
  43. Zhang, C.; Campana, P.E.; Yang, J.; Yan, J. Economic performance of photovoltaic water pumping systems with business model innovation in China. Energy Convers. Manag. 2017, 133, 498–510. [Google Scholar] [CrossRef]
  44. Saudi Electricity Company (SEC). Tariffs and Connection Fees. 2020. Available online: https://www.se.com.sa/en-us/customers/Pages/TariffRates.aspx (accessed on 1 December 2020).
  45. Khashman, A. The Weekend Read: The Untapped Potential of the MENA Region. 2019. Available online: https://www.pv-magazine.com/2019/02/02/the-weekend-read-the-untapped-potential-of-the-mena-region/ (accessed on 1 December 2020).
  46. Sarrakh, R.; Renukappa, S.; Suresh, S.; Mushatat, S. Impact of subsidy reform on the kingdom of Saudi Arabia’s economy and carbon emissions. Energy Strateg. Rev. 2020, 28, 100465. [Google Scholar] [CrossRef]
Figure 1. Framework for evaluating the feasibility of solar photovoltaic (PV) in building applications.
Sustainability 12 10060 g001
Figure 2. Average high and low weather conditions in Al-Khobar: (a) Temperature and (b) Relative humidity.
Sustainability 12 10060 g002
Figure 3. 3D views of modeled villa for a utilization factor (UF) of (a) 0.15, (b) 0.25 and (c) 0.40.
Sustainability 12 10060 g003
Figure 4. Cash flow diagram for the PV system.
Sustainability 12 10060 g004
Figure 5. UF frequency distribution for the 70 sample buildings.
Sustainability 12 10060 g005
Figure 6. PV power output during 21 July and 13 January for (a) villa and (b) apartment buildings.
Sustainability 12 10060 g006
Figure 7. Sensitivity of levelized cost of electricity (LCOE) to PV system service life.
Sustainability 12 10060 g007
Figure 8. Sensitivity analysis of the PV system.
Sustainability 12 10060 g008
Figure 9. Sensitivity of LCOE to electricity tariffs.
Sustainability 12 10060 g009
Figure 10. LCOE and electricity tariff as a function of financial support.
Sustainability 12 10060 g010
Figure 11. Sensitivity of LCOE to cost of avoided carbon emissions.
Sustainability 12 10060 g011
Figure 12. Sensitivity of LCOE to utilizable PV area.
Sustainability 12 10060 g012
Table 1. Classification of hurdles on residential rooftops.
ClassificationExamples
Structural restrictions
  • Roof geometry
  • Parapet walls
  • Staircases
  • Annexes
  • Atrium shafts
  • Columns and rebars
Service restrictions
  • AC package units
  • AC condensers
  • Water tanks
  • Dish antennas
  • Water heaters/boilers
Accessibility restrictions
  • Inter-row spacing
  • 1 m adjacent to walls
  • Nearby access
Shading restrictionsShadows of:
  • Parapet walls
  • Annexes
  • Staircase
  • Service components
  • Atrium shafts walls
Other restrictions
  • Courtyard
  • Clothesline
Table 2. Monthly solar irradiation data for the investigated city.
MonthIrradiation on Horizontal Plane
(kWh/m2/day)
Irradiation on Optimally Inclined Plane
(kWh/m2/day)
Direct Normal Irradiation
(kWh/m2/day)
January3.85.14.3
February4.85.84.8
March6.16.75.5
April6.66.75.5
May7.87.36.7
June8.37.57.7
July7.97.36.8
August7.57.36.6
September6.97.56.9
October5.86.96.3
November4.25.34.4
December3.75.04.4
Year6.16.55.8
Table 3. Key features of the case study buildings.
VillaApartment
Roof details Sustainability 12 10060 i001 Sustainability 12 10060 i002
No. of floors23 + Annex
No. of flats-14
Area of roof (m2)240254
Height of parapet wall (m)1.7 and 3.01.7
Utilization factor, UF0.150.13
Annual energy consumption (kWh)63,757188,740
Table 4. Base case model characteristics.
Description
LocationAl-Khobar
Lat: 26.2° N; Long: 50.2° E
OrientationMain elevation facing east
Floor-to-floor height3.5 m
Floor areaTotal: 504 m2
Ground floor: 264 m2; First floor: 240 m2
WindowsSingle glazed with aluminum frame
WWR: 8%
No shading devices
Exterior Walls13 mm plaster/100 mm concrete block (medium)/30 mm extruded polystyrene/100 mm concrete block (medium)/13 mm plaster
U-Value: 0.58 W/m2 k
Roof30 mm terrazzo tiles/30 mm extruded polystyrene/200 mm reinforced concrete/13 mm plaster
U-Value: 0.97 W/m2 k
LightingGround floor: 20 W/m2; First floor: 12 W/m2
Equipment4 W/m2
ACPackaged DX unit
Setpoint = 22 °C
Infiltration0.5 ach
Table 5. Specifications of PV modules.
ParameterDescription
Cell typeMonocrystalline
ModelBP 4190 T
Module area1.25 m2
Efficiency15.2%
Output at STC190 W
Output at NOCT137 W
Table 6. Cost and economic parameters.
ParametersDescriptionReference
Initial cost of system (including PV, inverter, cabling and installation)USD 1200/kWpPractitioners
Maintenance cost1% of the initial cost; inverters replacements in years 9 and 18 with 9% of initial cost
Interest rate2%[42]
Lifetime25 years[5,35]
Table 7. Current electricity consumption tariffs for all sectors in Kingdom of Saudi Arabia (KSA).
Consumption Categories
(kWh)
Residential
USD/kWh
(SAR/kWh)
Commercial
USD/kWh
(SAR/kWh)
Agriculture and Charities
USD/kWh
(SAR/kWh)
Governmental
USD/kWh
(SAR/kWh)
Private Educational Facilities, Private Medical Facilities
USD/kWh
(SAR/kWh)
≤6000 kWh0.0480.0530.0430.085
(0.32)
0.048
(0.18)
(0.18)(0.20)(0.16)
>6000 kWh0.080.080.0530.085
(0.32)
0.048
(0.18)
(0.30)(0.30)(0.20)
Table 8. Average restriction coefficients.
Type of CoefficientVillaApartment
Structural (Cstr)0.910.85
Services (Cser)0.590.57
Accessibility (Cacc)0.470.67
Shading (Csh)0.910.9
Other (Coth)0.930.75
Table 9. Performance of PV systems in the two case study buildings.
ApartmentVilla
Tilted 24°FlatTilted 24°Flat
PV capacity (kWp)5.16.85.38.4
PV modules Area (m2)34453555
Solar radiation (kWh/m2)1983184319891838
Electricity output (kWh/year)6079738061629191
Specific annual output (kWh/kWp)1185107911581099
Reduction in PV output due to shading (%/year)20.121.418.218.8
Table 10. Summary of city-level technical assessment.
TypeNet PV Area
(km2)
Energy Output—Titled 24°
(GWh/y)
Energy Output—Flat
(GWh/y)
Apartment1.46302296
Villa2.32495461
Total3.78797757
Table 11. Energy contribution from tilted rooftop PV installed on a typical villa with various UFs.
UF = 0.15UF = 0.25UF = 0.40
PV output (kWh/y)655112,00818,550
Annual PV output per unit of conditioned space area (kWh/m2)132437
Proportion of building’s total energy consumption being met be PV (%)101929
Saving in cooling load (%)123
Table 12. Greenhouse gas (GHG) emissions analysis.
TypeTotal Energy Produced—Tilted 24°
(MWh)
Reductions in CO2 Emissions (tons)Reductions in CH4 Emissions (kg)Reductions in N2O Emissions (kg)
Total675,066537,35316,0332761
Villa413,811329,39498281693
Apartment247,001196,61358661010
Publisher’s Note: MDPI stays neutral with regard to jurisdictional claims in published maps and institutional affiliations.

