Article

Consumer Motivation and Environmental Impact of Laundry Machine-Sharing: Analysis of Surveys in Tokyo and Bangkok

Department of Chemical System Engineering, The University of Tokyo, 7-3-1 Hongo, Bunkyo-ku, Tokyo 113-8656, Japan
*
Author to whom correspondence should be addressed.
Sustainability 2020, 12(22), 9756; https://doi.org/10.3390/su12229756
Submission received: 9 October 2020 / Revised: 20 November 2020 / Accepted: 20 November 2020 / Published: 23 November 2020
(This article belongs to the Section Environmental Sustainability and Applications)

Abstract

:
A sharing economy is an alternative system that enables pro-environmental behavior by improving efficiency through product-sharing. However, some motivations and requirements for doing laundry can increase the environmental burden, which suggests that the laundry machine (LM) sharing is not necessarily sustainable. This study clarifies consumer motivations for laundry usage and assesses the feasibility of environmentally sustainable laundry behavior through LM-sharing. Consumer surveys were conducted in Tokyo and Bangkok with different LM-ownership proportions. Single-person households were targeted, reflecting Tokyo’s demographic situation. A scenario analysis was conducted to evaluate the effect of routine laundry behavior changes on greenhouse gas (GHG) emissions. Three main results emerged. First, Tokyo respondents used a coin-operated laundry machine (CL) for convenience, which private washers cannot provide, while Bangkok respondents used it for basic laundry needs. Consequentially, the Tokyo respondents, who used CLs, were responsible for more than three times the GHG emissions of Bangkok respondents. Second, the group using both private LM and CL was the least GHG-efficient group, regardless of region. Third, laundry behavior can reduce GHG emissions if consumer requirements are decreased. The results show that there is environmental significance in adopting LM-sharing for sustainable consumption and production systems that reflect regional characteristics.

1. Introduction

Laundry is a fundamental household chore. Since the invention of laundry machines (LMs), such as washers and tumble-dryers, they have been labor-saving appliances. While LMs are convenient, laundry behavior related to LMs eventually increases the burden on the environment. Therefore, it is crucial that we understand how to use LMs sustainably.
Many studies have been conducted to investigate the impact of technological improvements in LMs on accelerating sustainable laundry practices. Supplying energy-efficient washing machines is one method to reduce environmental load. For example, Stamminger et al. and Yamaguchi et al. evaluated different types of LMs and noted that replacing old products with energy-saving LMs could reduce energy consumption [1,2]. Similarly, Golden et al. and Lin and Iyer assessed the effect of various LM technologies, such as the Japanese impeller type (vertical-axis loader), European drum type (horizontal-axis loader), and American agitator type (vertical-axis loader), on energy and water use [3,4]. They concluded that consumers’ technology choices (considering individual lifestyles and cultural practices) could improve the energy efficiency of LMs and thus affect the environment. Considering the continuous development of new energy-efficient technologies in LMs, the quantity of energy and water consumed can be reduced [5]. Nevertheless, the contribution of energy-efficient LMs in reducing environmental impact can also depend significantly on consumer behavior, stemming from the socio-cultural context.
Previous studies on consumer behavior highlighted the challenges in cultivating sustainable behavior by examining laundry behavior in different regions. In these studies, cultivating sustainable consumer behavior using LMs is seen from two perspectives: energy efficiency and clothing maintenance. First, Kruschwitz et al., Pakula and Stamminger, and Schmitz and Stamminger examined the possibility of optimizing energy-efficient LM usage by investigating the energy and water-saving factors and regional characteristics in laundry behavior [6,7,8,9]. Furthermore, Pakula and Stamminger found that 50% of energy consumption and 30% of water use can be reduced in the laundry process by increasing the load-size, decreasing the water temperature and frequency, and improving the energy and water efficiency of LMs [8]. Second, Jack, Laitala et al., and Miilunpalo and Räisänen suggested that consumers can shift their laundry behaviors in a sustainable direction while still maintaining the cleanliness established by social norms and values [10,11,12,13]. In these studies, LM usage factors, such as water temperature, detergent dosage, loading amount, and frequency, determined the laundry behavior characteristics by region. Moreover, these factors were used to present directions to increase consumer awareness about sustainable laundry behavior, such as what to launder, when to launder, and how to launder [14,15,16]. However, these studies were based on the premise that laundry behaviors are exhibited when people are using their own LMs (private ownership). Laundry behavior based on private ownership has limited potential to reduce the environmental burden because a fixed amount of resources and energy is required to make products that support individual ownership. Recently, research has emphasized the necessity of a new business structure, that is, a sharing economy, as an alternative to private ownership.
A sharing economy is regarded as an enabling system that promotes pro-environmental behavior by improving the efficiency of product usage through product-sharing [17,18,19]. Recent studies on LM-sharing have also examined the potential of energy-saving effects [20,21,22,23]. For instance, Haapala et al. found that laundry services, one of the offshoots of LM-sharing, could reduce the environmental impact of home-based clothes washing by almost 50%, despite a ten-fold increase in laundry expenditure [21]. In the use of coin-operated LMs in a laundromat (CL), Amasawa et al. and Wasserbaur et al. assessed the reduction in greenhouse gas (GHG) emissions based on a model that was developed to reflect the behavioral shift from ownership of LMs to LM-sharing [20,23]. These studies suggest the conceptual possibility of an increase in energy and water efficiency through LM-sharing, such as decreasing LM production and increasing the laundry’s load-size. However, laundry behavior characteristics that may arise due to LM-sharing, such as changes in LM capacity and machinery drying ratio, are not reflected. As seen in previous studies on consumer behavior regarding LMs, it can be assumed that consumer behavior can vary depending on the individual’s surroundings, such as the regional context [7,11,24,25]. It is necessary to identify the current status of laundry behavior in regions where LM-sharing is prevalent, as part of the empirical verification of conceptual possibilities to propose appropriate consumption transitions tailored to regional needs. Moon et al. attempted to define the regional characteristics and environmental impact on Bangkok by identifying survey respondents’ motivations for using a private-washing machine (PW) and CL [26]. Moreover, a detailed region-wise study of consumer behavior and environmental impacts based on the motivation for adopting LM-sharing is required [27,28]. It could also be possible to clarify laundry behavior characteristics and regional differences in LM-sharing.
This study aims to clarify consumer motivation impacting laundry behavior and assess the feasibility of environmentally sustainable laundry behavior through LM-sharing. It examines the conditions under which LM-sharing can reduce environmental impact when laundry behavior shifts from ownership to sharing. In particular, the Asian cities of Tokyo and Bangkok, which show different LM ownership rates, were chosen to explore the laundry behaviors related to having a PW and using CL. A consumer survey was conducted among residents in the two regions, and the survey analysis targeted single-person households in line with Tokyo’s current demographic features. Furthermore, we examined motivations and laundry behaviors for using CL in connection with regional characteristics surrounding LM-sharing. Moreover, GHG emissions were estimated to assess each region’s environmental impact through their laundry activities. Finally, a scenario analysis was conducted to evaluate the effect of using CL instead of PW, with existing laundry behaviors, on GHG emissions.

2. Theoretical Background

Understanding consumer behavior can contribute to reducing environmental impact and improving the quality of human life [29]. Previous studies on laundry behavior have emphasized that consumer behavior is determined by consumer intentions, motivations, and complex surroundings, rather than personal preferences. Three theoretical models explain the consumer behavior process: the Fishbein-Ajzen Theory of Reasoned Action (TRA), the Motivation-Opportunities-Abilities (MOA) model, and the Needs-Opportunities-Abilities (NOA) model [30,31,32]. Through these models, behavior can be defined as a movement that is exhibited in response to an intention affected by internal or external influencing factors such as attributes, norms, and control. Thus, behavior, which includes motivational intention, is different from habit, which proceeds unconsciously without being adjusted by behavioral intention [33]. In MOA and NOA, consumer motivation is explained as an influencing factor in embodying behavioral intention [31,32]. According to the NOA model, consumer motivation is essential in influencing consumer behavior formation [32]. Consumer motivation is constituted by consumer needs and opportunities originating from a regional context such as technology, economy, demography, institutions, and culture. Moreover, consumer motivation influences consumer intention and behavior, eventually affecting the environment and quality of life. A significant aspect of the NOA model theory is that it includes regional context as a defining element for the formation of consumer behaviors. Many studies that deal with consumer behavior related to energy and water consumption in everyday life (such as laundry behavior) recognize the impact of regional contexts. However, few studies have used cultural characteristics as an explanatory variable for consumer behavior [15,25]. Indeed, the NOA model is a pragmatic framework for describing consumer behavior and environmental impacts across countries because it takes into consideration the flow of consumer behavioral decisions through connections to the regional context, consumer motivations, and consumer behaviors. As explained above, this study demonstrated the characteristics of consumer behaviors and the environmental impact of LM-sharing by exploring consumer motivations and considering regional contexts in Tokyo and Bangkok. The NOA model, which shows the relationship between consumer behavior and behavioral motivations impacted by regional characteristics, is thus used as the theoretical framework for this study.

3. Regional Backgrounds of Tokyo and Bangkok

3.1. Target Regions: Tokyo, Japan, and Bangkok, Thailand

Tokyo and Bangkok are the capitals of Japan and Thailand, respectively. Both cities are the largest and most populated in each country owing to the concentration of economy, culture, political activities, and other vital state functions. Tokyo is the most populated city in Japan, but many who live near the region commute daily. Therefore, neighboring regions such as Kanagawa, Chiba, and Saitama prefectures are generally included in “the Greater Tokyo area (Tokyo).” Its population is approximately 36 million as of 2015 [34]. Similarly, Bangkok has a population of 8.3 million, within the basic boundary of 50 districts, as of 2010 [35]. By including commuter areas, the population of the “Bangkok Metropolitan Region” is over 14 million, including the five neighboring areas of Nonthaburi, Samut Prakan, Pathum Thani, Samut Sakhon, and Nakhon Pathom. This figure is close to double that of Bangkok city’s population and represents the target region of this study [36].

3.2. Laundry Machine Circumstances in Tokyo and Bangkok

Laundry is one of the most common household chores in the world [7]. The act of doing laundry includes a series of processes such as collecting, washing, wringing-out, drying, bringing-in, folding, and storing. These processes may be the same regardless of country. However, washers or mechanical-dryers can replace specific steps in the process, which can vary according to the current status of demand and supply of PW and CL in each country. The state of penetration of LMs can directly affect differences in laundry behavior by region.
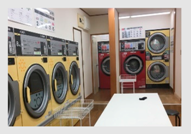
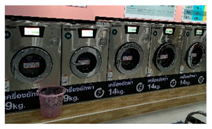
According to the Cabinet Office’s statistical data in Japan, the PW ownership rate had already passed 90% of total households in 1970 and reached over 99% in 2004 [37]. Therefore, Tokyo is among the cities where washers have become necessary household items, with an almost 100% PW ownership rate. In Thailand, by contrast, PW ownership accounted for 59.2% of total households in 2015 [38]. There are two types of CLs in Japan and Thailand: conventional and advanced (Table A1) [20,26,39]. In Japan, vertical-axis (V-axis) washers with capacities similar to PWs were mainly installed in conventional shops. Advanced shops featured horizontal-axis (H-axis) commercial washers, washer-dryers and tumble-dryers, and amenities for convenience, such as chairs and vending machines. These facilities are also much larger than conventional shops and are currently preferred by Japanese consumers. In Thailand, V-axis PWs are commonly installed next to buildings or on the street and are classified as conventional shops. In the advanced style, which has recently gained popularity in Thailand, H-axis commercial washers and tumble-dryers that are larger than the PWs are installed inside buildings. Despite some differences in PW ownership and CL installation conditions, laundry behaviors when using room-temperature water without choosing temperature-changing programs, when using LMs, are similar [7]. Furthermore, natural clothes drying, such as on a balcony, is still the predominant method in both countries.

4. Materials and Methods

4.1. Consumer Survey in Tokyo and Bangkok

A consumer survey was conducted to estimate GHG emissions quantitatively, and to understand laundry behaviors using LM-sharing qualitatively, in Tokyo and Bangkok. A web-based questionnaire was administered to Tokyo residents who were doing their laundry by themselves from 27 to 30 November in 2017, through the research company’s request (Table A2). A face-to-face questionnaire was also administered to Bangkok residents who engaged in laundry activities from 22 to 24 October 2018 (Table A2). Additionally, qualitative data related to consumer laundry behavior and motivations, and the CLs operation, which cannot be obtained from the questionnaire, were collected through interviews with questionnaire respondents and CL business executives. The questionnaires attempted to obtain a sample count of CL-only users in order to explore their laundry behavior using LM-sharing. The demographic distributions of the respondents are reported in Table 1. According to the Tokyo survey, CL-only users who did not personally own washers (CL-only w/o) were characterized by demographics. In Tokyo, the total number of respondents in the CL-only w/o were single-male households. This result reflects Tokyo’s current demographic features: that the majority of CL-only users came from single-households. While in Bangkok, there were no evident demographic characteristics in the CL-only w/o respondents. Based on the characteristics of CL-only consumers, single-person households were used for reliable analysis in line with the Tokyo survey to describe the motivations and laundry behavior of LM-sharing in both countries without demographic restrictions. Since the sample sizes from Tokyo and Bangkok were relatively small at 82 and 43, respectively, a representation of the results may be dubious. However, the analysis is significant for understanding the behaviors of the CL-only w/o respondents, which are a small proportion of all real consumers, compared with other respondents.

4.2. Segmentation of Respondents

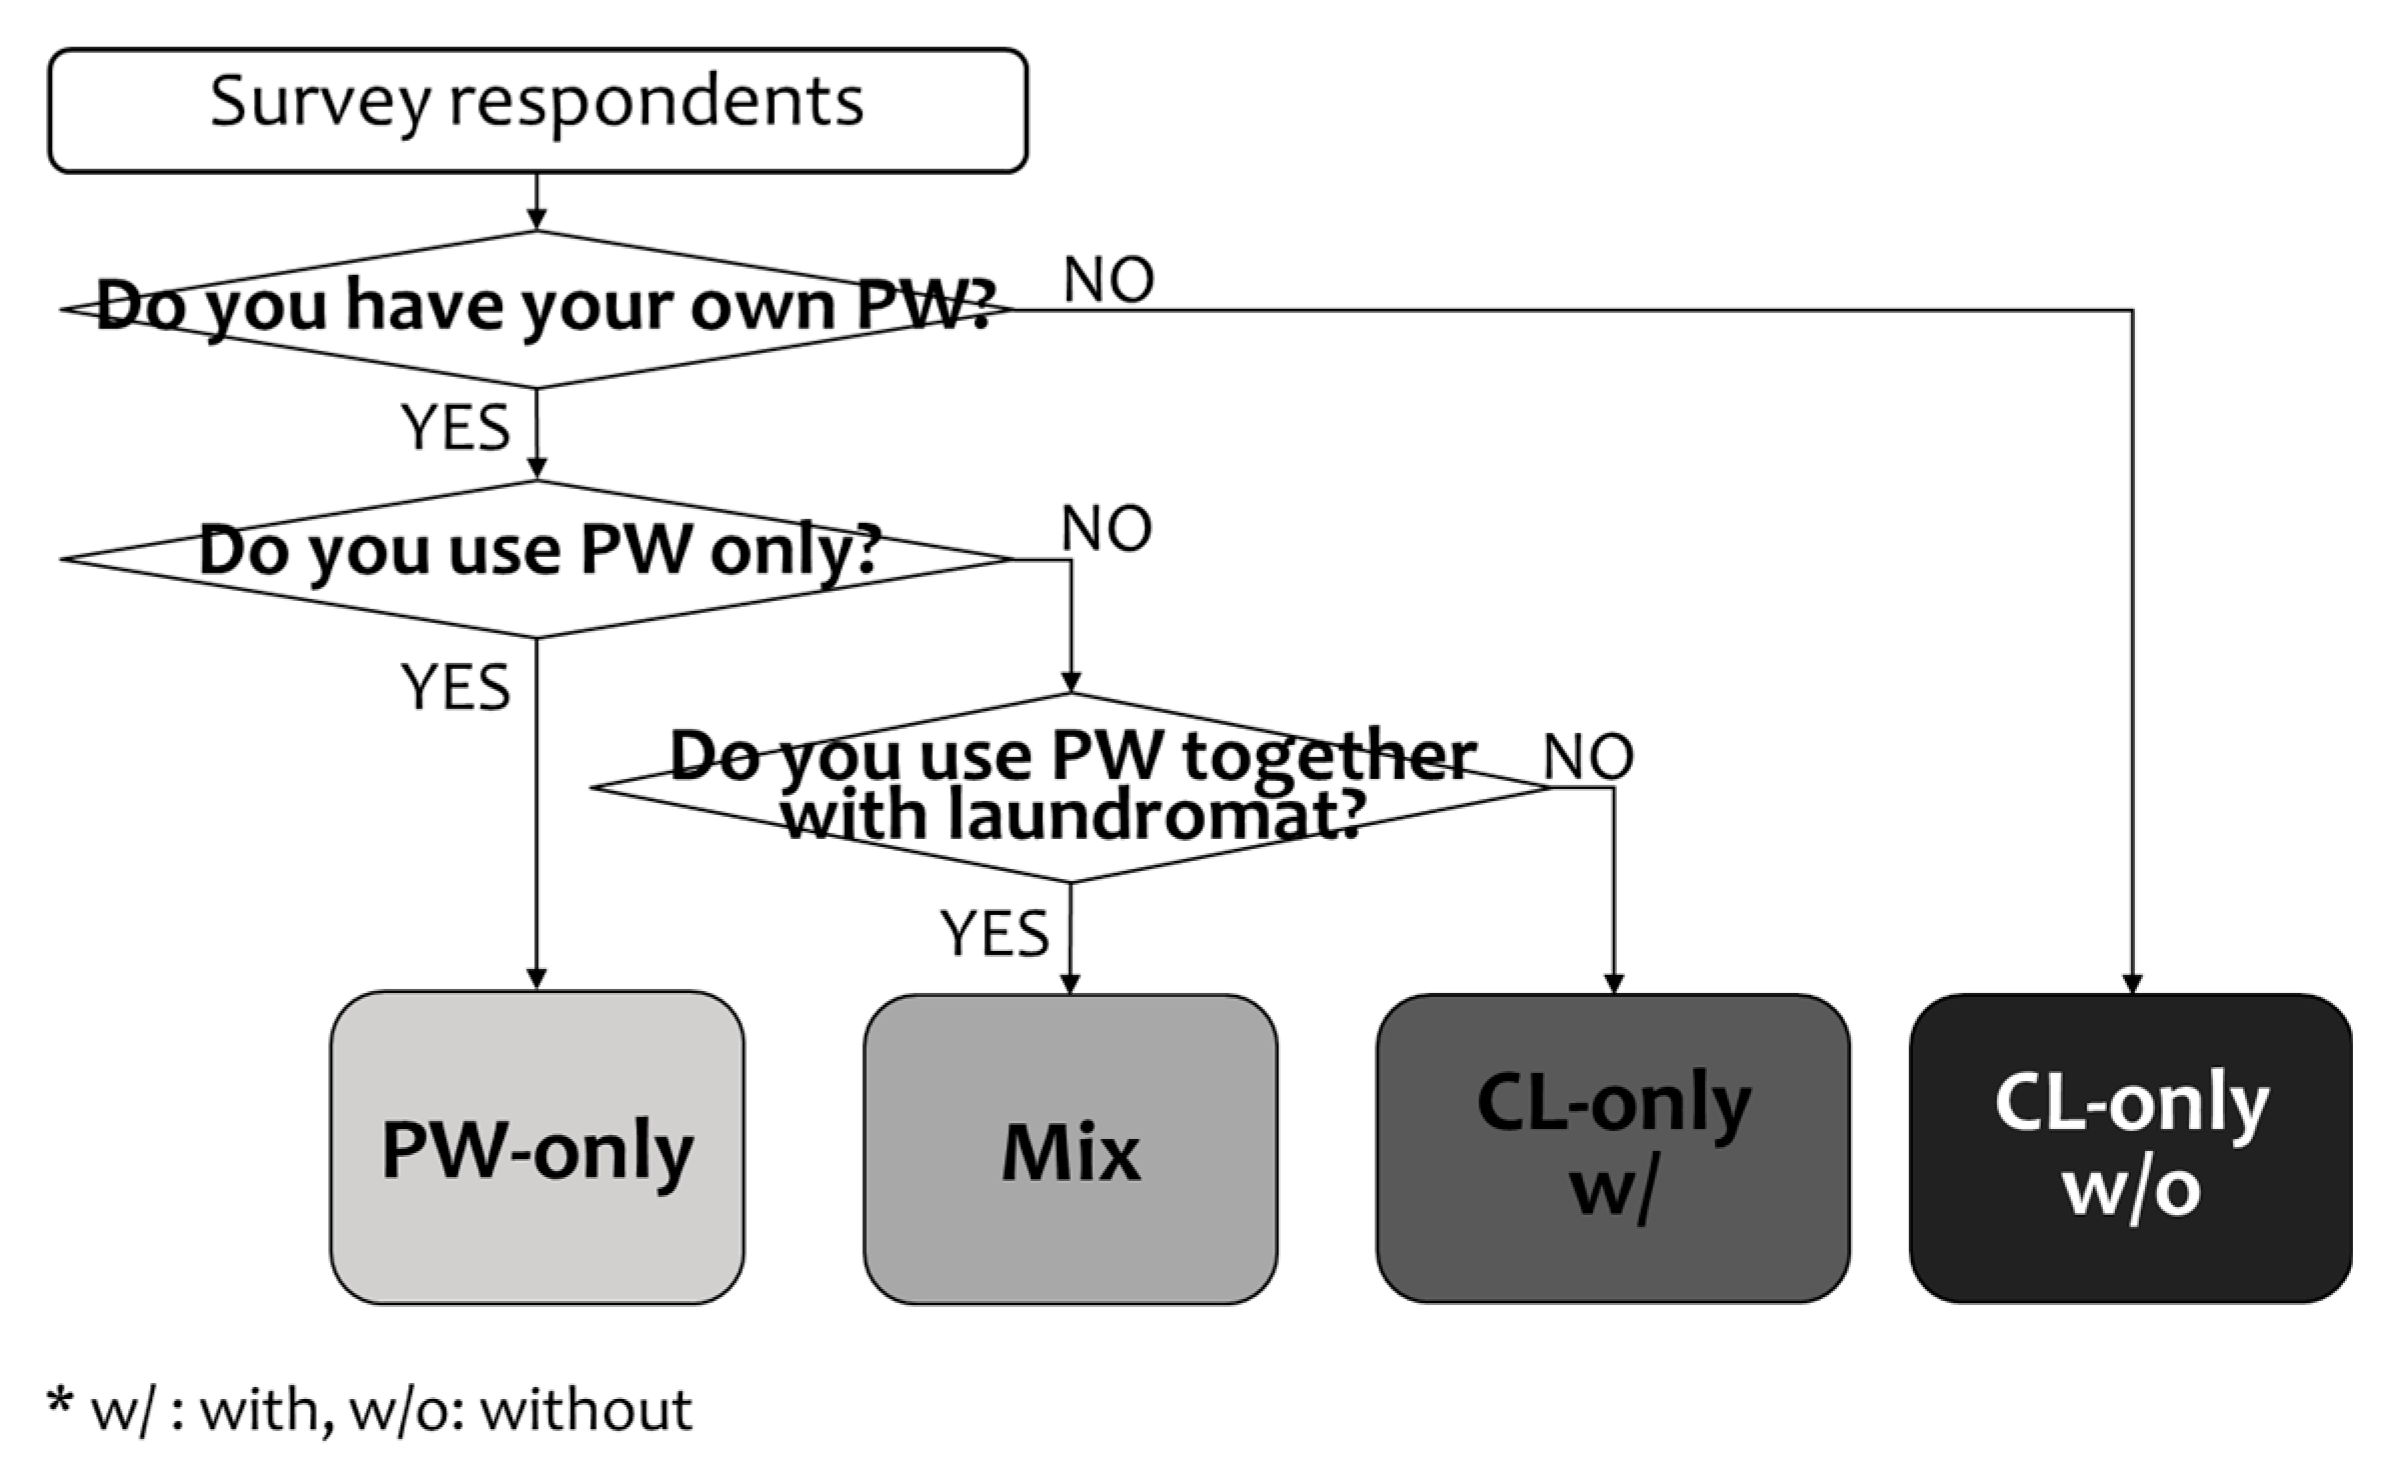
Survey respondents were classified based on their possession of a PW and their use of CL as follows: those owning and using only PW, those using both PW and CL (Mix), those using CL-only while owning PW (CL-only w/), and those using CL-only without PW (CL-only w/o), as shown in Figure 1. It is intended to clarify differences in laundry behaviors and GHG emissions around shared-LMs.

4.3. Calculating GHG Emissions

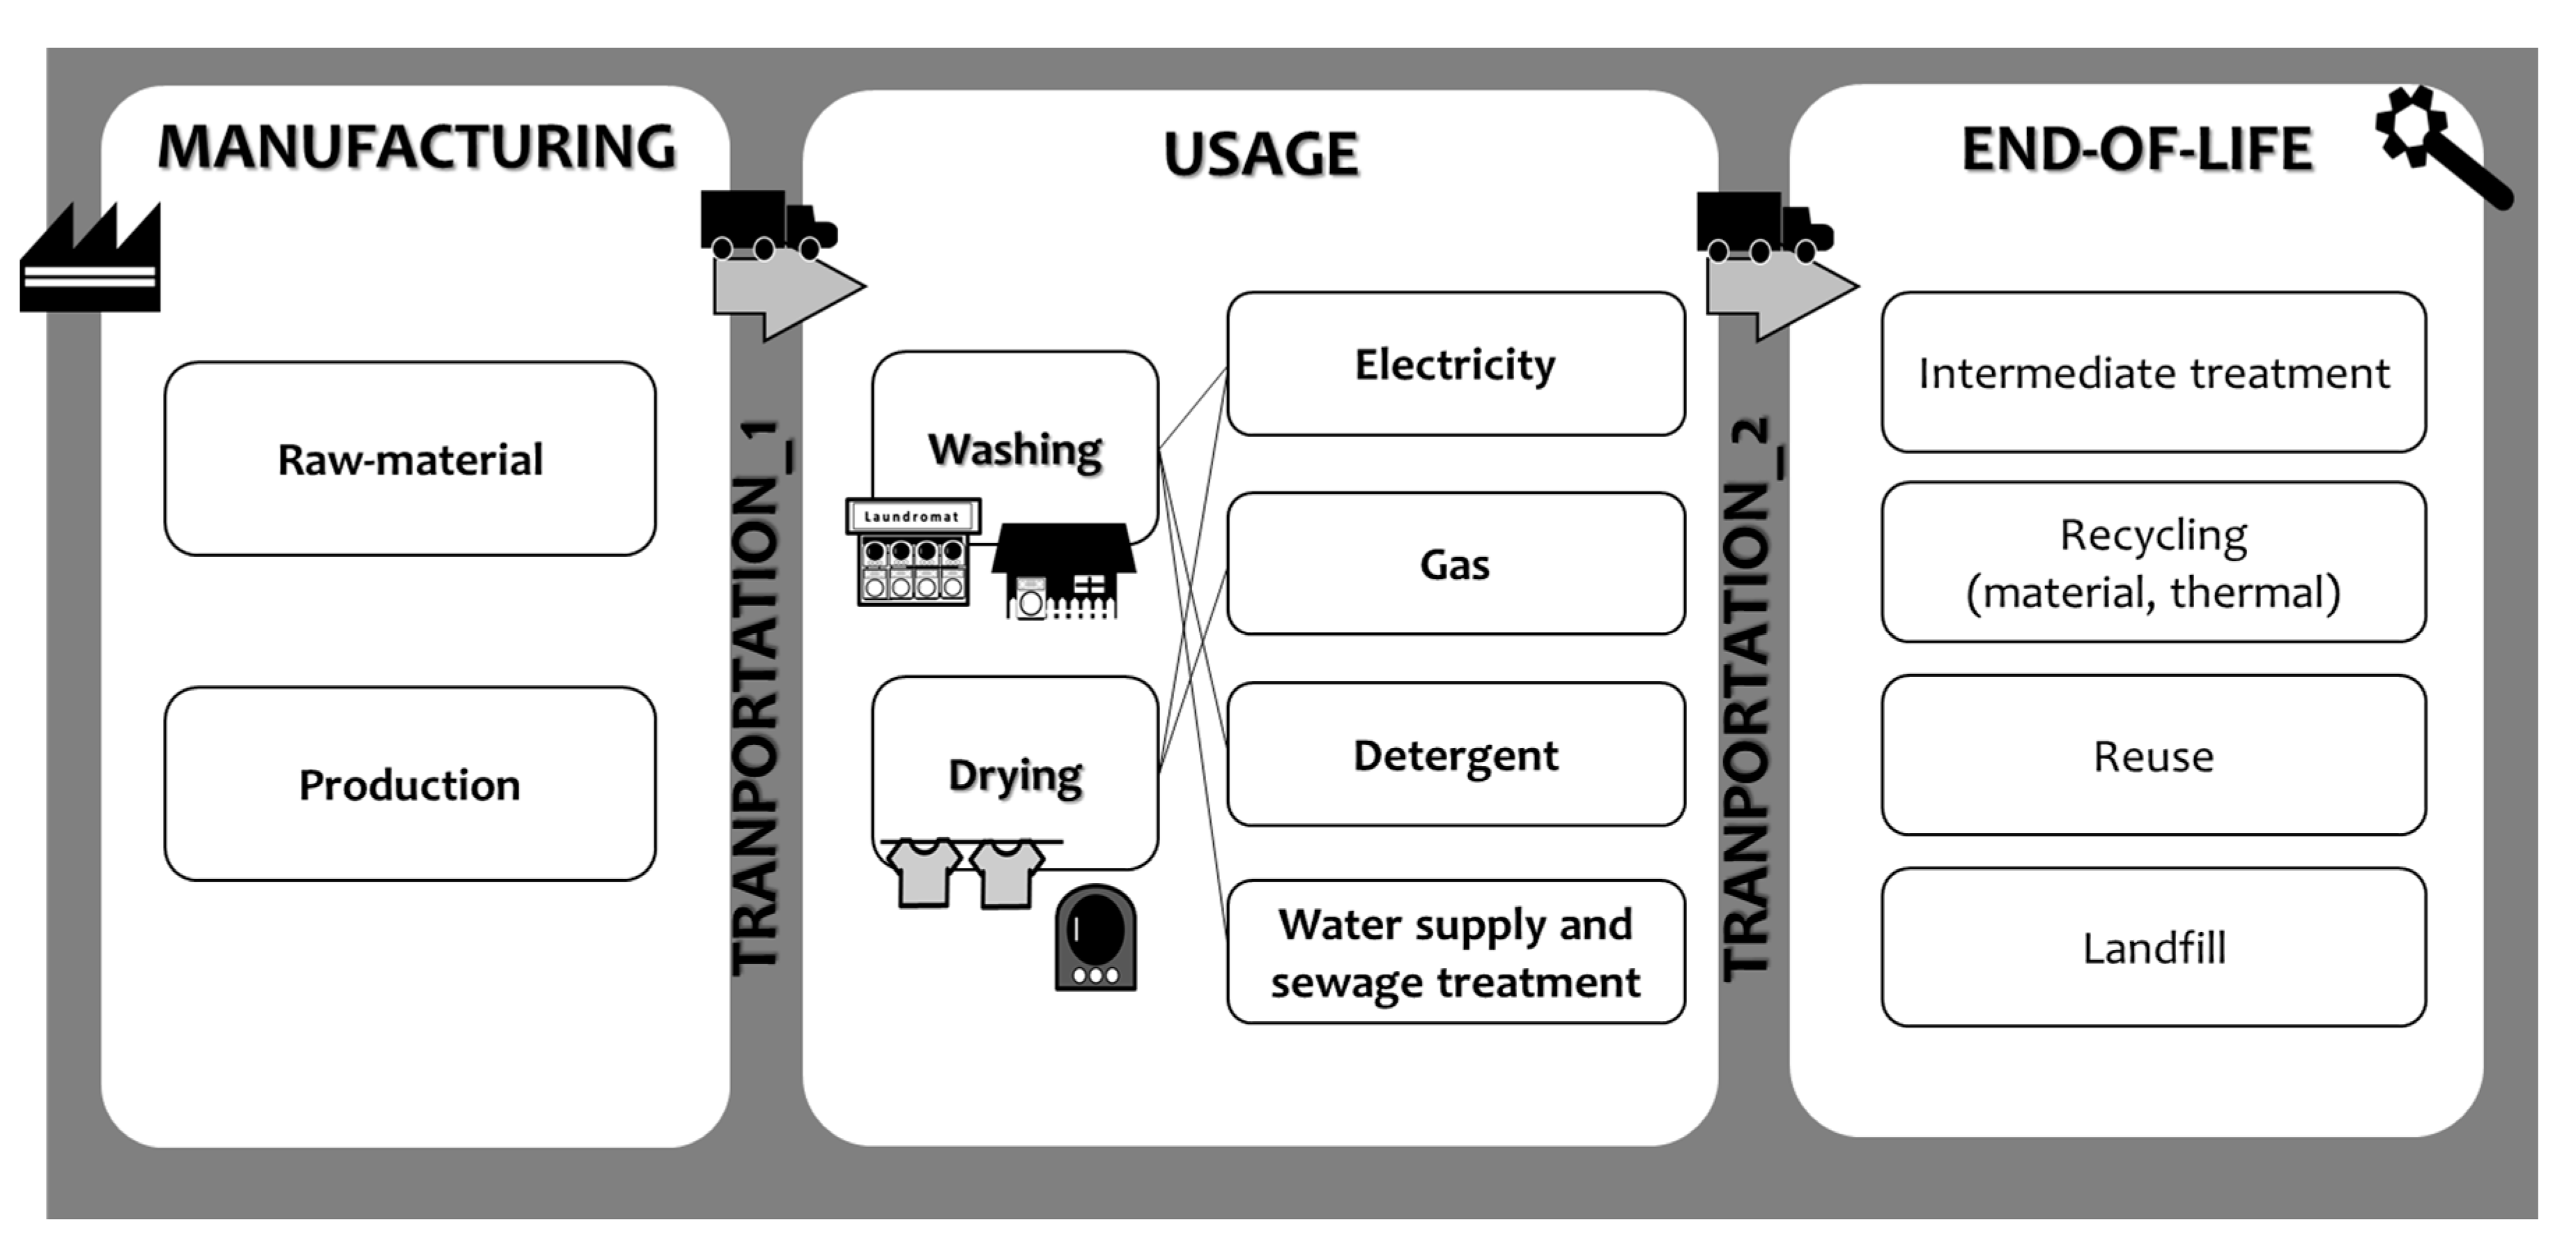
GHG emissions were used to quantify the environmental impact of laundry behaviors connected to using PW and CL in Tokyo and Bangkok. The life cycle assessment (LCA) methodology was used to calculate the total amount of GHG emitted from laundry behaviors connected to the use of PWs and CLs throughout their life cycles, based on ISO 14040: 2006 [40]. The system boundary to calculate GHG emissions, based on LCA, was composed of four stages: manufacturing, transportation, usage (including washing and drying), and end-of-life (Figure 2) [41]. In the usage stage, it was assumed that consumers walked between home and CLs to transport laundry. Besides, laundry behaviors related to LMs, such as washing and drying, were included as analysis targets. Therefore, additional laundry behaviors that could occur in the usage stage, such as hand washing and dry-cleaning, were excluded from the analysis. The functional unit was defined as ‘per person per year’ (**kg-CO2eq/year, person).
The laundry behavior-related variables for calculating GHG emissions, such as number of wash-cycles, number of people natural drying clothes outside, load-size of laundry per wash-cycle, number of people using PW or CL, the capacity of PW or CL, machine type, and tumble-dryer usage rate, were obtained from the two questionnaires (Table A3). For other variables that could not be obtained through the survey, such as years of using PW and CL, we referred to standard service life following provisions from the National Tax Agency and Association for Electric Home Appliances in Japan [42,43]. It was assumed that the amount of water consumed depending on the machine type and the laundry load-size obtained in the questionnaire, which was calculated by referring to catalog values [44,45]. Energy consumption and operating hours were also based on the default value using the basic laundry program presented in the catalog. In analyzing GHG emissions on laundry detergents, it was assumed that consumers used detergents without adding chemicals such as fabric softeners. The detergent amount used during the washing stage was calculated based on the standard dosage per load-size, which was also sourced from catalog values [46]. In terms of sharing LM in the CL, it was also assumed that six users could share one LM in the CL in both regions, according to the revenue simulation report. In addition, the details of raw materials used in the LM were obtained from the study by Yamaguchi et al. [2]. The details of the LM, such as the gross weight and running time for washing or drying, were based on the catalog data in each country. The GHG emission coefficients of each energy type in each country were obtained from the Inventory Database for Environmental Analysis (IDEA), the standard equipment inventory database for supporting environmental analysis [47]. The basic unit of laundry detergent emissions was also obtained from IDEA data.

4.4. Scenario Setting

Three scenarios were created to examine the possibility of reducing GHG emissions by using only CL for doing laundry. The specific conditions of laundry behavior for each scenario are explained in Table A4.
(1)
The business-as-usual (BAU) scenario: The BAU scenario reflects the questionnaire results. In this questionnaire, the four segments of users included PW-only, Mix, CL-only w/, and CL-only w/o.
(2)
Scenario 1 (S1): The S1 scenario describes a situation where all respondents’ segments in the BAU move to the CL-only w/o group without changing other laundry behaviors.
(3)
Scenario 2 (S2): In S2, the extended version of S1, laundry behaviors such as the volume of laundry per wash-cycle (S2-C1) and the utilization rate of the tumble-dryer (S2-C2) are incrementally increasing or decreasing from the condition of CL-only w/o. In S2-C1, the fill ratio changes from 10% to 100%. Simultaneously, the number of washing-cycles is reduced to meet the increased fill ratio. In S2-C2, the utilization rate of the tumble-dryer changed from 0% (all respondents do not use tumbler dryers) to 100% (all respondents use tumble-dryers).

5. Results

5.1. Consumer Motivations for Using Laundromats, by Respondent Segment

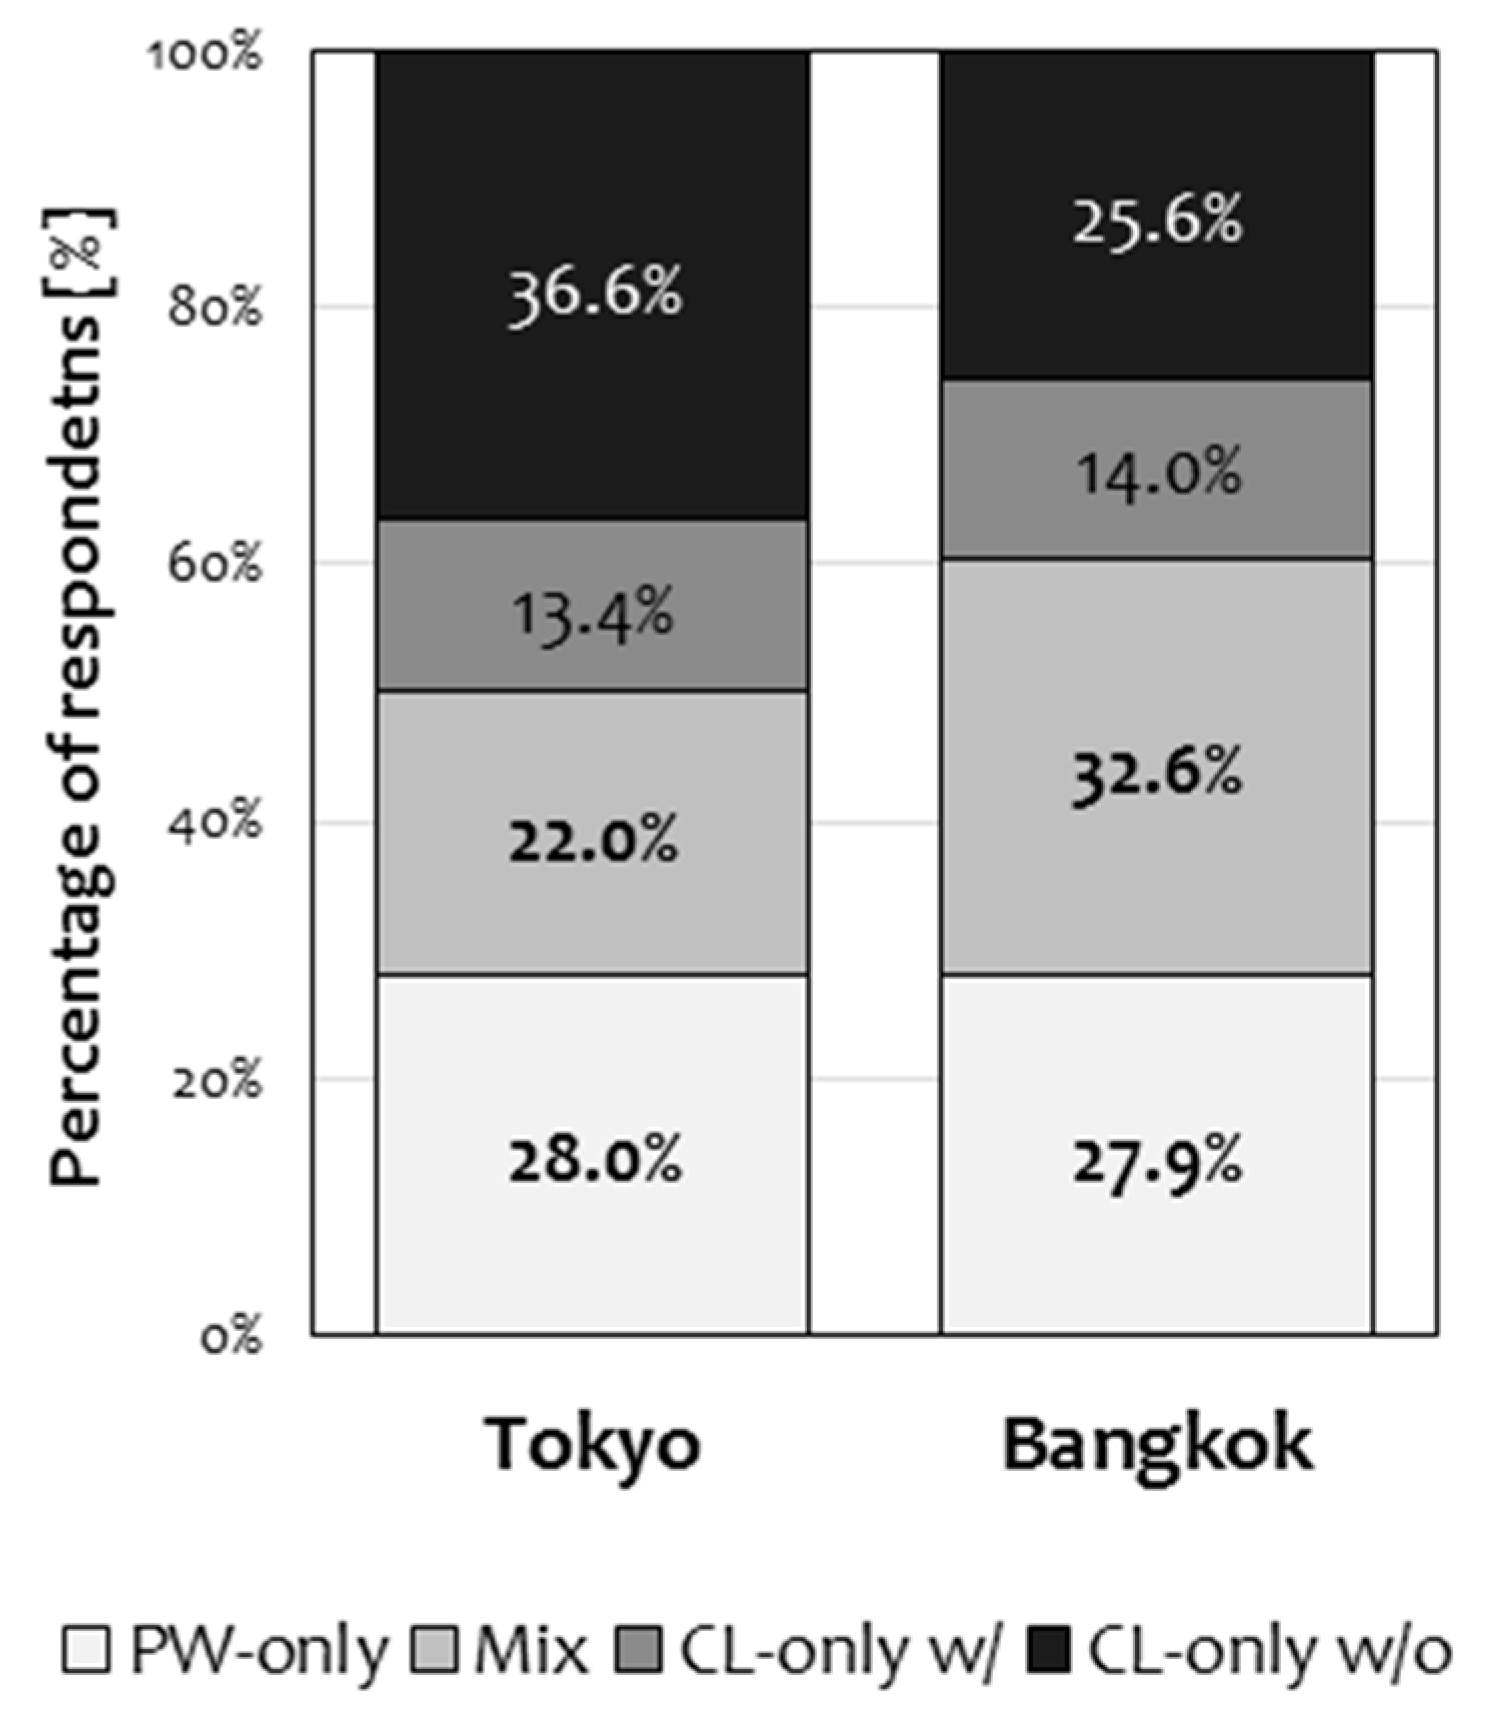
From the survey results, the percentage of PW-only in Tokyo was 28.0%, similar to Bangkok at 27.9% (Figure A1). Furthermore, the percentage of CL users, including Mix, CL-only w/, and CL-only w/o in Tokyo, was 72.0% of total respondents, almost identical to the 72.1% in Bangkok.
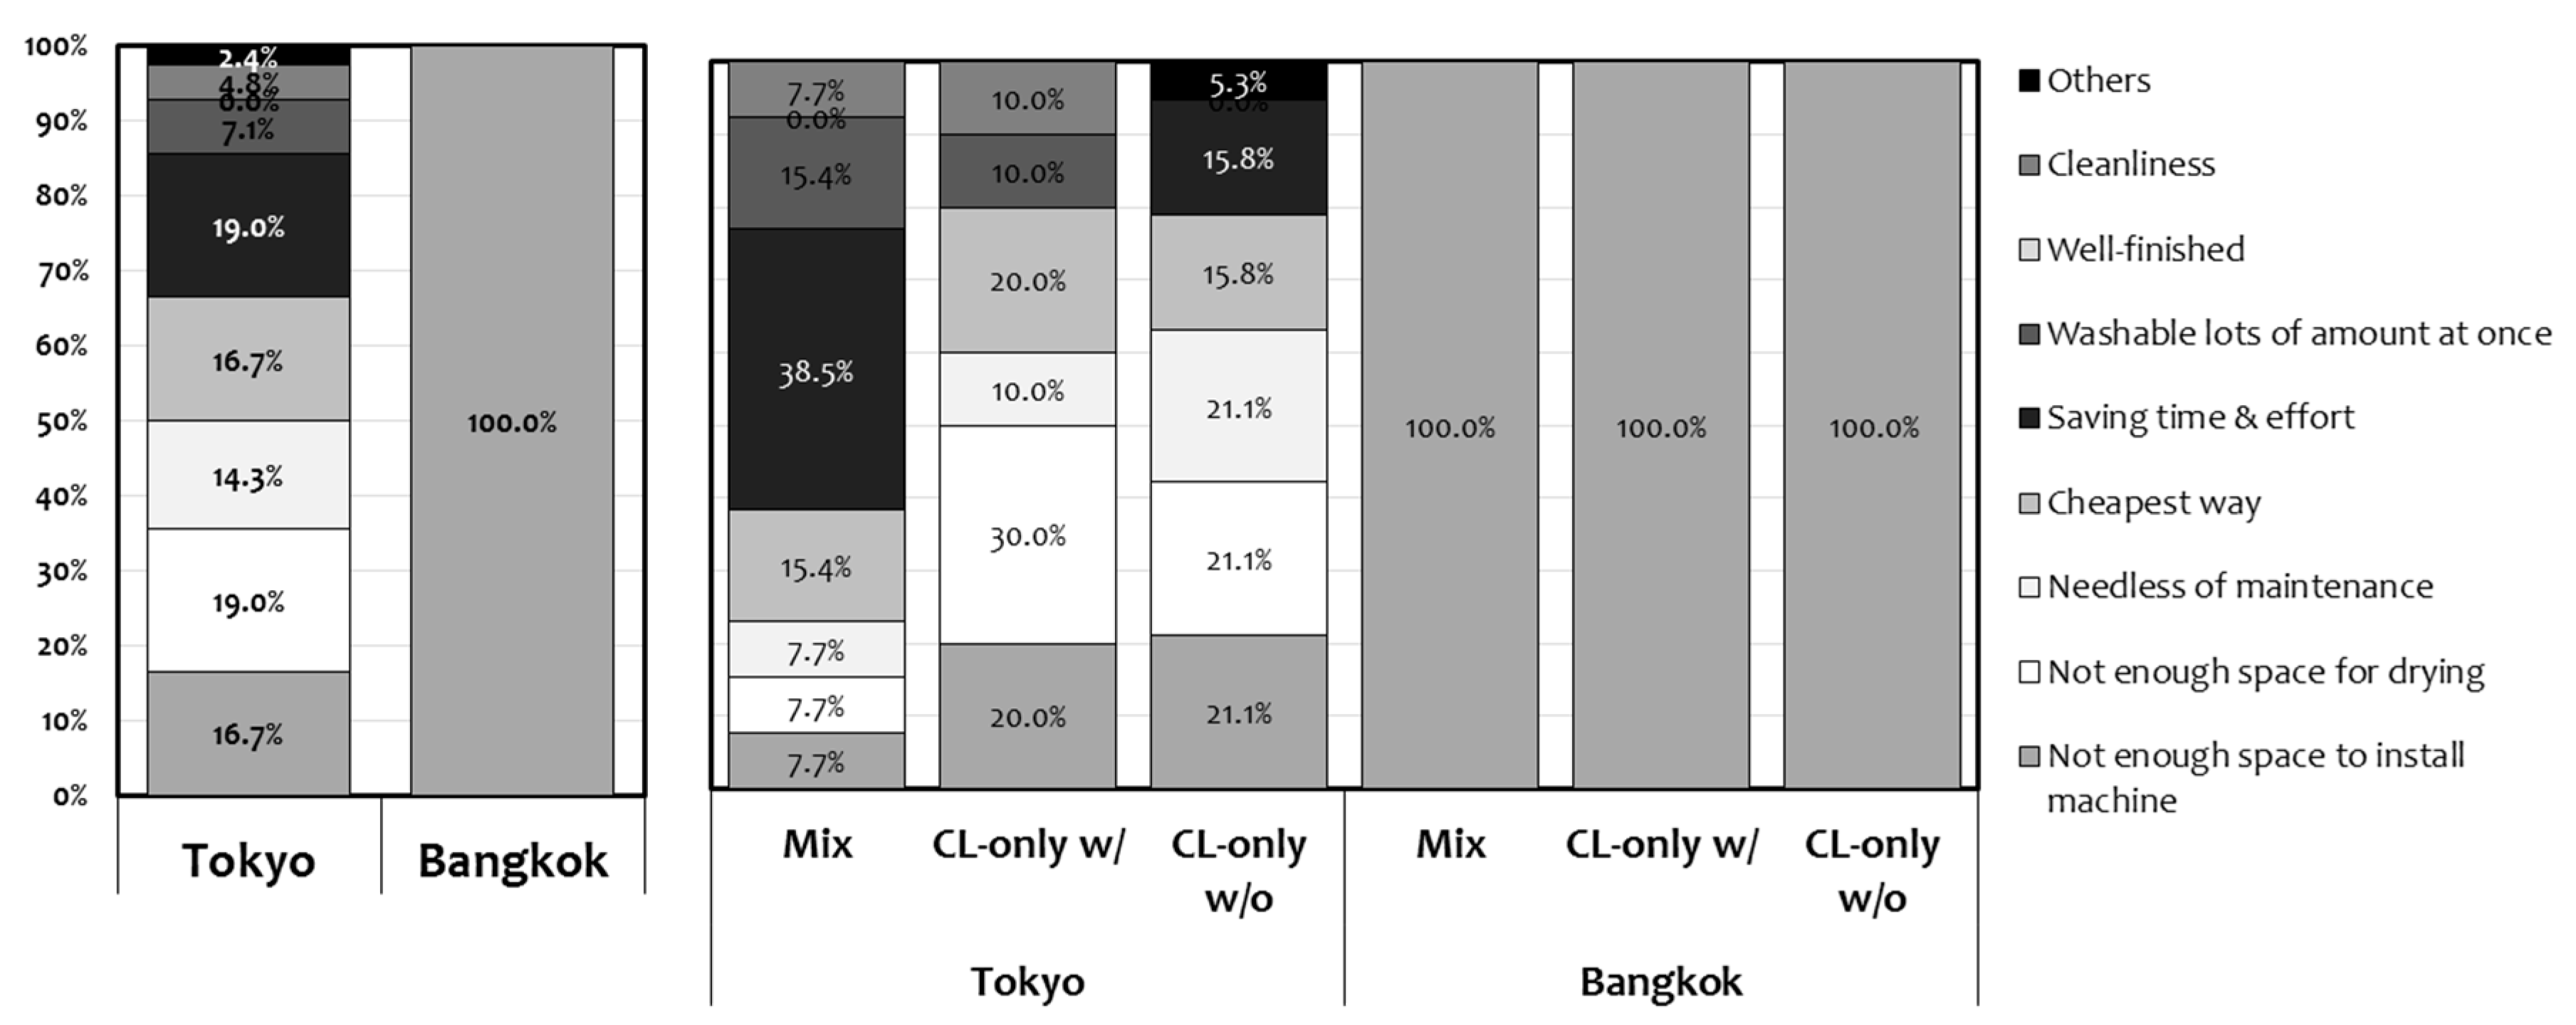
The motivation for using CL in Tokyo and Bangkok is summarized in Figure 3. In Tokyo, “saving time and effort” and “not enough space for drying” were the most mentioned reasons at 19.1%for both. In addition, “not enough space to install machine” indicating a physical limitation of residence, and “cheapest way”, describing convenience motives, accounted for 16.7%. Simultaneously, all Bangkok respondents answered that they used CL because of “not enough space to install machine”, regardless of the group. These seem to be affected by the laundry methods of respondents who live in dormitories away from home [18]. It can be thought that the respondents of Mix and CL-only w/o used CLs temporarily when living in Bangkok and PWs when back at home [18].
To understand these motivations in further detail, they were divided into groups (Figure 3). The Mix respondents mentioned “saving time and effort” as the highest motivation to use CL, followed by “washable lots of amount at once” and “cheapest way”. In comparison, CL-only w/ respondents answered, “not enough space for drying” as the highest motivations to use CL, followed by “not enough space to install machines” and “cheapest way”. Furthermore, CL-only w/o respondents answered, “not enough space to install machine”, “not enough space for drying”, and “needless of maintenance” as the highest motivations to use CL. This indicates that respondents in Tokyo sought convenience by using CL, but the types of convenience differed among the groups. The pursuit of convenience, such as saving time and effort that a PW cannot provide during the laundry process, was the most considerable motivation to use CL among the Mix group. CL-only w/, which is the group that owns PWs but use CL-only, prioritize the convenience of the drying process.
Meanwhile, seeking the simplicity of not owning a PW was the primary motive for CL-only w/o, as well as overcoming the physical limitations. Unlike Tokyo’s results, all Bangkok residents answered “not enough space to install machine”, regardless of group. All respondents used CL as an alternative to PW because of physical limitations in living conditions (such as dormitories or other residents), which meant that LMs could not be installed [26].

5.2. Characteristics of Laundry Behaviors

Table 2 reports the specifications of the LMs used in CLs and PWs by Tokyo and Bangkok respondents. The total average capacity of PW washers in Tokyo and Bangkok was 6.5 kg and 7.2 kg, respectively, which was similar. In contrast, the overall average capacity of CL washers in Tokyo and Bangkok was 16.3 kg and 10.4 kg, respectively. Tokyo respondents used washers in CLs over 2.5 times larger than those in PWs, while Bangkok respondents used washers with 1.4 times the capacity in the CLs than those in PWs.
The V-axis type was the most commonly used PW machine in both Tokyo and Bangkok, at 78.8% and 62.5%, respectively. The remaining 21.1% of Tokyo respondents used the H-axis type. Meanwhile, 25.0% of Bangkok respondents used the H-axis type, and 12.5% used the twin-tub type. Tokyo respondents used the H-axis type in the CL, while Bangkok respondents used all three types in the CL. This means that Tokyo respondents used different machine types between PWs and CLs, while there was not much difference between the two from Bangkok respondents.
The characteristics of laundry behaviors exhibited by the Tokyo and Bangkok respondents are reported in Table 3. The total average load-size in Tokyo was 945.7 kg/year-person, nearly 2.5 times higher than that in Bangkok (399.2 kg/year-person). By contrast, the average number of wash-cycles in Tokyo was 116.7 wash-cycle/year, less than 32% of those in Bangkok by 169.4 wash-cycles/year. Therefore, the volume per wash-cycle among Tokyo respondents was 9.4 kg, which was more than 2.4 times the volume per wash-cycle of Bangkok respondents (4 kg).
Dividing the results into groups, in Tokyo, the CL-only w/o group washed the most laundry at 1123.3 kg/year-person, with the lowest number of 78.0 wash-cycles/year. Accordingly, the largest volume per wash-cycle was 14.6 kg of laundry/wash-cycle-person. This indicates that respondents in the CL-only w/o group tend to do laundry in larger volumes in a single wash-cycle. In contrast, the PW-only group did the least laundry with 635.8 kg/year-person and had the second-highest wash-cycle at 127.7 wash-cycle/year. Consequently, the volume per wash-cycle was the lowest with 5.1 kg/wash-cycle-person. Meanwhile, the Mix group had the second-largest volume of laundry washed at 1182.9 kg/year and the highest wash-cycle with 183.5 wash-cycles/year. Simultaneously, the Mix group had the second smallest volume of laundry washed among all groups at 6.7 kg/wash-cycle-person.
In Bangkok, there were no significant differences in load-sizes among groups except the Mix, which had the smallest volume of laundry. The load-sizes of the PW-only, Mix, CL-only w/, and CL-only w/o groups were 438, 259.8, 484.6, and 487.6 kg/year-person, respectively. The CL-only w/o had the largest load-size among the groups, and the least frequent wash-cycle at 118.3 wash-cycle/year. It also had the second-largest volume of laundry at 5.7 kg/wash-cycle-person. The CL-only w/o group in Bangkok also exhibited the behavior of washing a large number of items at once, similar to the CL-only w/o group in Tokyo. The PW-only group had 147.4 wash-cycle/year (the second-lowest), and the volume per wash cycle was also slightly smaller than the CL-only w/o group at 4.1 kg/wash-cycle-person. Meanwhile, the Mix group washes most frequently with 236 wash-cycles/year and has the smallest volume of laundry with 1.4 kg/wash-cycle-person.
Regarding the tumble-dryer utilization rate, Tokyo respondents used 42.7% of the total wash-cycle, while Bangkok respondents used only 0.8%. Examining the use of tumble-dryers by groups, in Tokyo, CL-only w/o used 78.7% of the total wash-cycle, which was the highest rate among the groups, followed by Mix at 33.9%. Only 5.7% of the PW-only used the tumble-dryer, scoring the lowest. In Bangkok, the CL-only w/o group was the only one to use a tumble-dryer, and its utilization rate was 3.3%.

5.3. Impact of Laundry Behaviors on Greenhouse Gas Emission

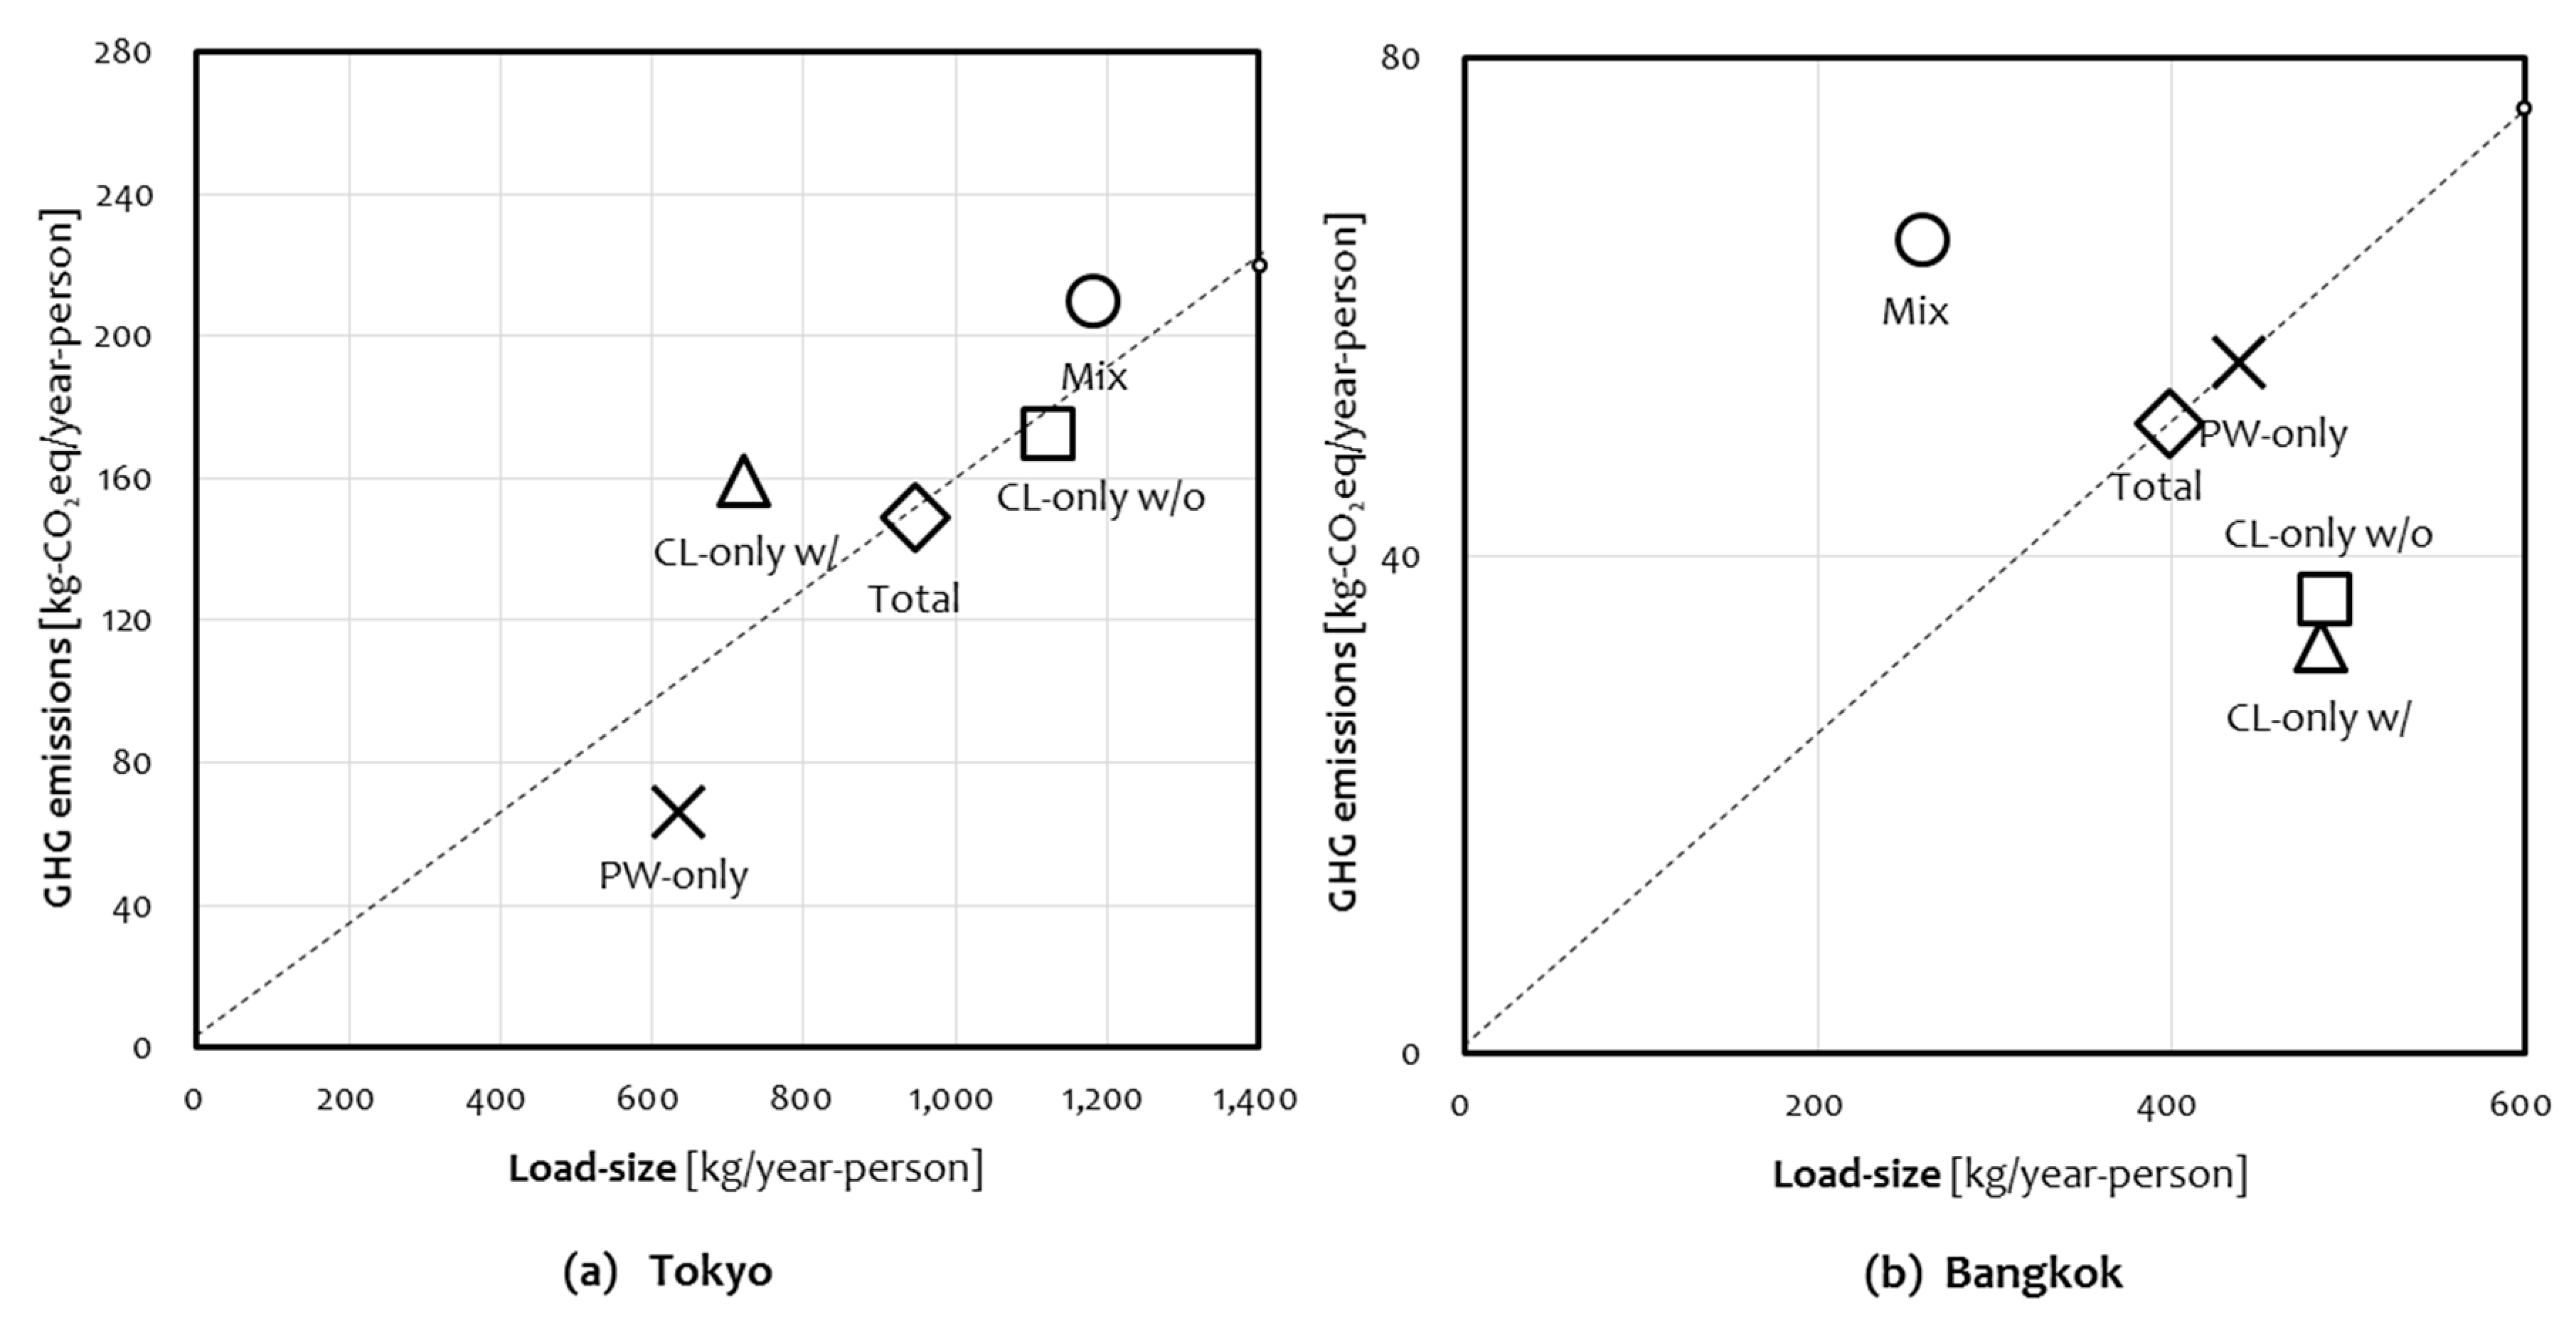
The correlations between the yearly load-size of laundry and the amount of GHG emissions by groups in the two regions are shown in Figure 4. In Tokyo, the yearly load-size of laundry in increasing order is as follows: PW-only, CL-only w/, Mix, and CL-only w/o at 635.8, 721.4, 1182.9, and 1123.3 kg/year, respectively. The amount of GHG emissions increased in the following order: PW-only, CL-only w/, CL-only w/o, and Mix, emitting 66.1, 172.1, 159.3, and 209.1 kg-CO2eq/year-person, respectively. PW-only was the most GHG-efficient group, followed by CL-only w/o. In contrast, the Mix group was the least GHG efficient among the groups.
In Bangkok, the Mix group had the smallest laundry load-size at 259.8 kg/year-person, followed by PW-only at 438.0 kg/year-person, CL-only w/o at 484.5 kg/year-person, and CL-only w/o at 487.6 kg/year-person. Moreover, Mix had the highest amount of GHG emissions at 65.3 kg-CO2eq/year-person, followed by PW-only at 55.5 kg-CO2eq/year-person, CL-only w/o at 36.4 kg-CO2eq/year-person, and CL-only w/ at 32.7 kg-CO2eq/year-person. Thus, CL-only w/o and CL-only w/ were the most environmentally efficient groups, followed by PW-only. The Mix was the least GHG efficient, similar to Tokyo.
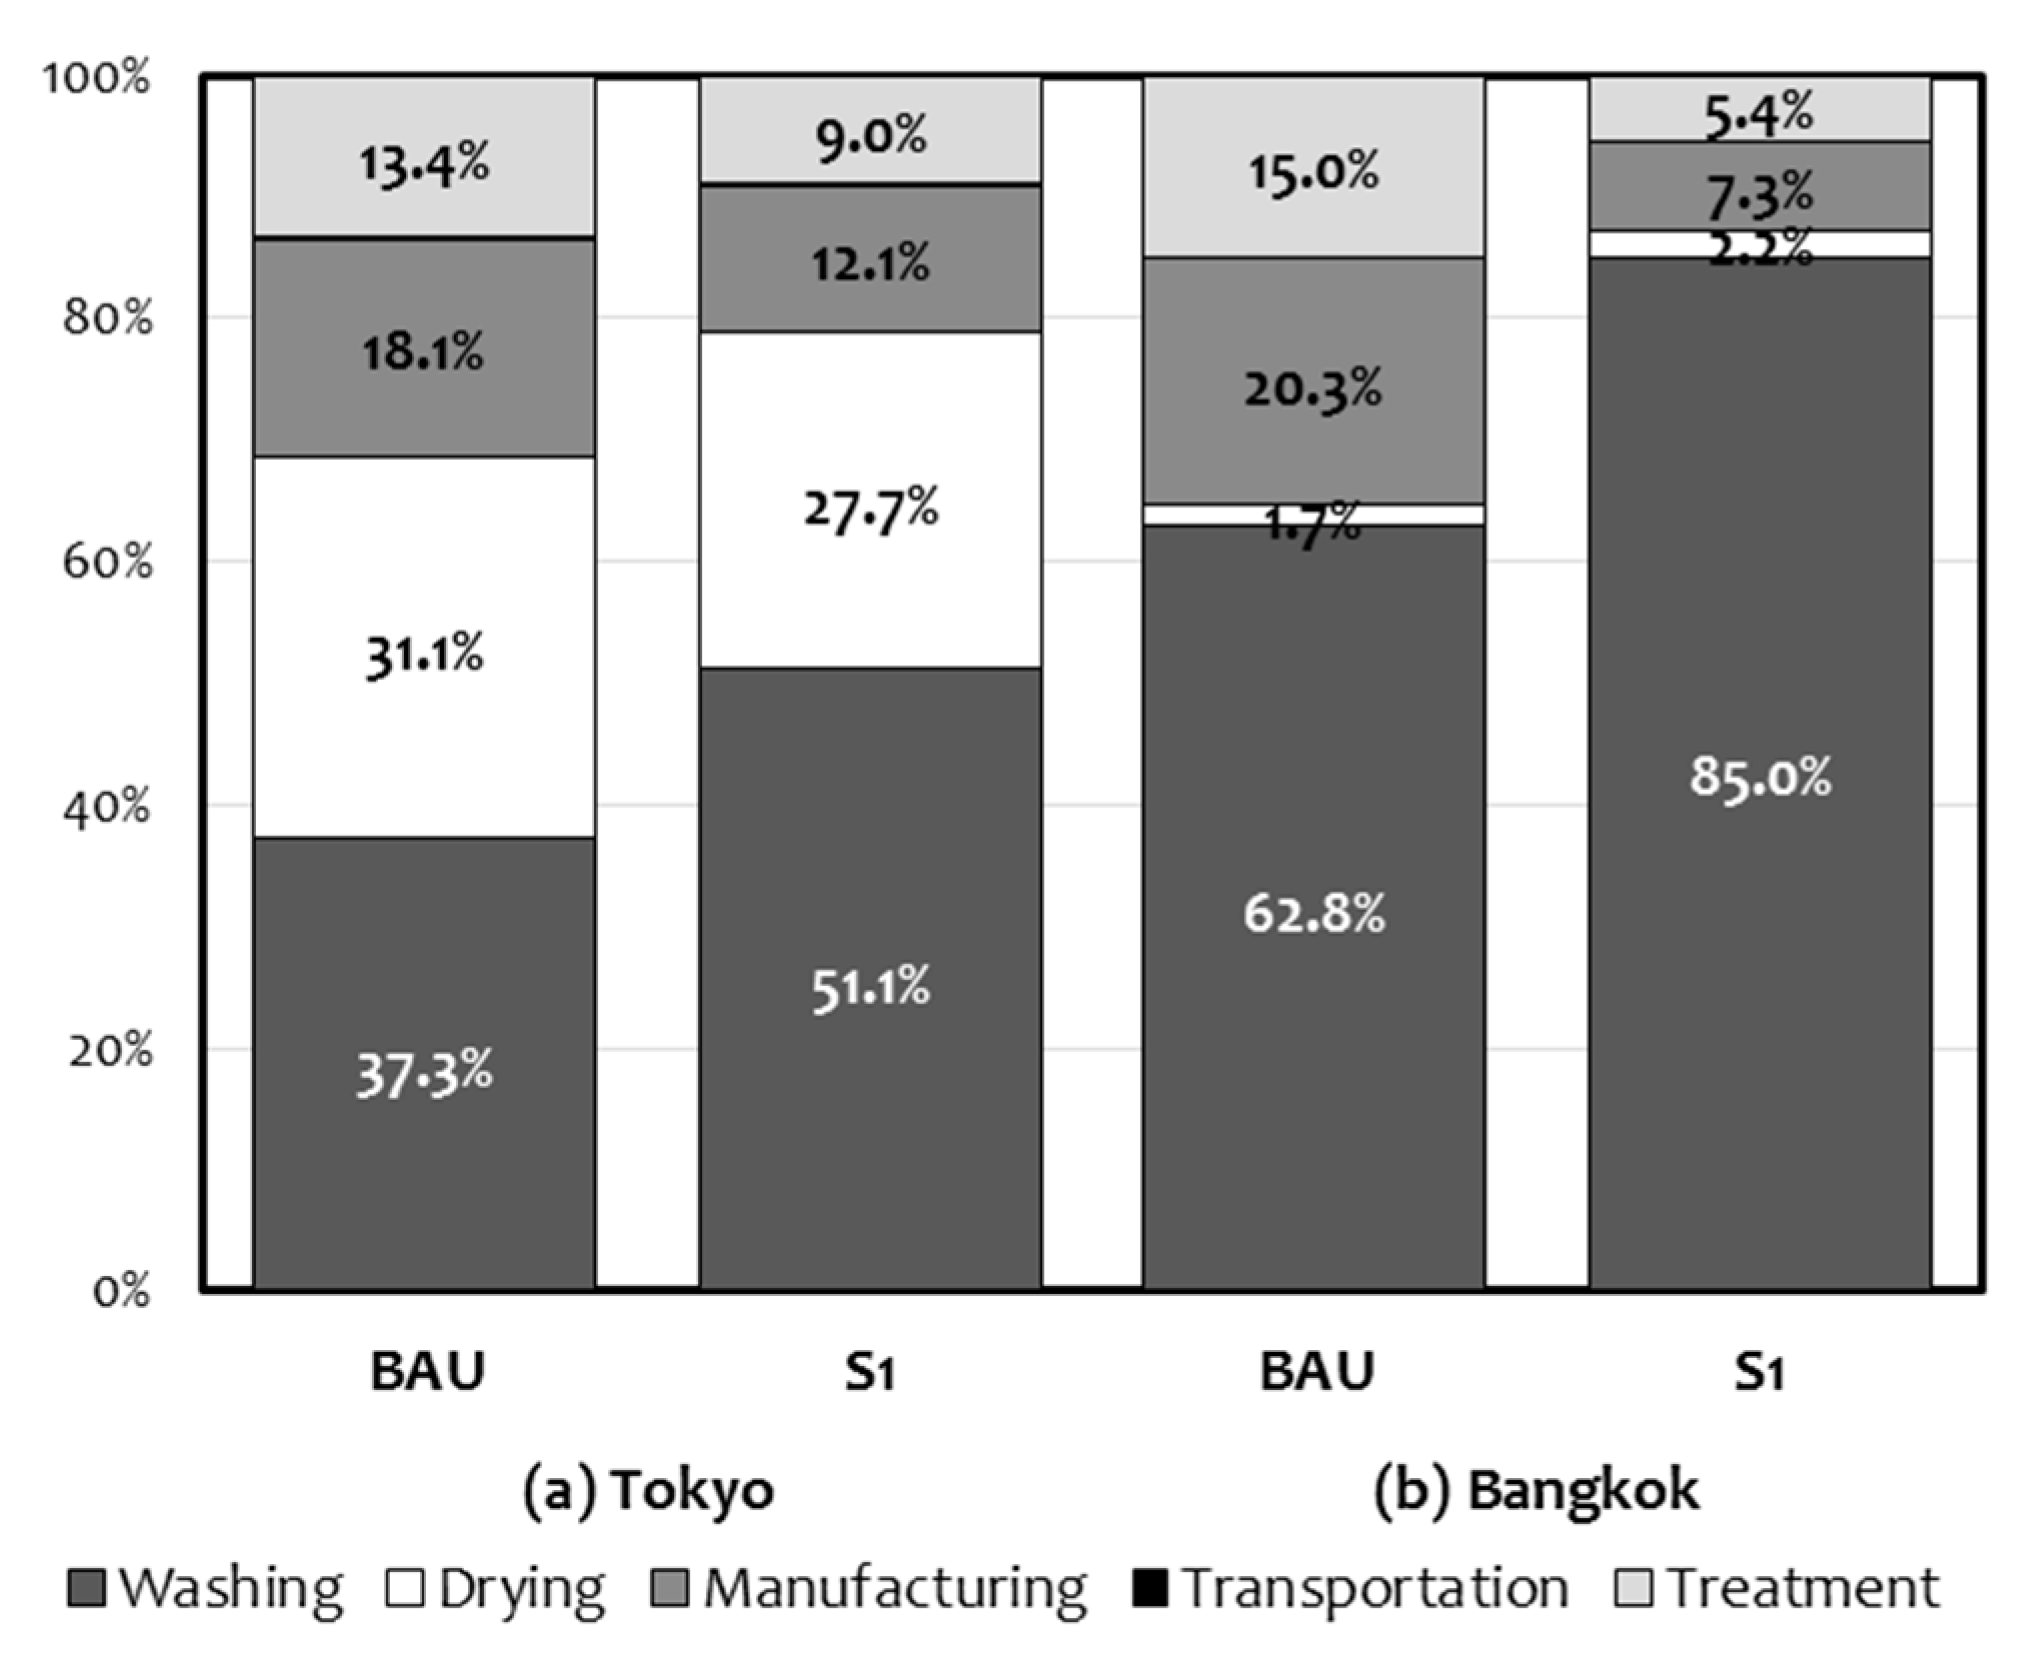
The contribution of GHG emissions in each stage is shown in Figure 5. In Tokyo, the GHG emissions in the washing stage were the highest, accounting for 37.3% of total GHG emissions, followed by the drying stage, at 31.1%. In Bangkok, the washing stage had the largest share of emissions overwhelmingly, accounting for 62.9%, whereas the drying stage accounted for only 1.7%. These different proportions of GHG emissions in Tokyo and Bangkok reflect typical laundry behaviors in each region, such as the number of wash-cycles and the tumble-dryer utilization rate.
Examining the results overall groups, for Tokyo, the manufacturing, transportation, and the end-of-life stages linked to producing LMs accounted for 45.5% of the total GHG amount among the PW-only group, the highest among all groups. In the CL-only w/o group, the ratio of the three stages was the lowest, accounting for only 26.2%, due to the influence of sharing LMs. In terms of the usage stage, including washing and drying, the CL-only w/o had the largest proportion among the groups, accounting for 73.8% of its total GHG amount, followed by the Mix at 68.7%, CL-only w/ at 64.4%, and PW-only as the lowest, at 54.5%. The drying stage in the CL-only w/o and Mix groups showed relatively high proportions because of the high utilization rate of the tumble-dryer, accounting for 39.7% and 34.5%, respectively.
In Bangkok, manufacturing, transportation, and end-of-life accounted for 47.4% of the total GHG amount in the PW-only group, which was the largest proportion, followed by Mix at 40.1%. However, in the CL-only w/o, these three stages were the second-lowest, accounting for 16.6% for sharing with other users, as in Tokyo. In terms of the usage stage, the CL-only w/o group had the second-largest share of GHG emissions, accounting for 83.4% of the total GHG emissions. In particular, in the CL-only w/o group (the only group that used a tumble-dryer in Bangkok), the drying stage accounted for 9.3% of total GHG emissions.

5.4. Feasibility of Environmentally Sustainable Laundry Machine Sharing: Results of Scenario Analysis

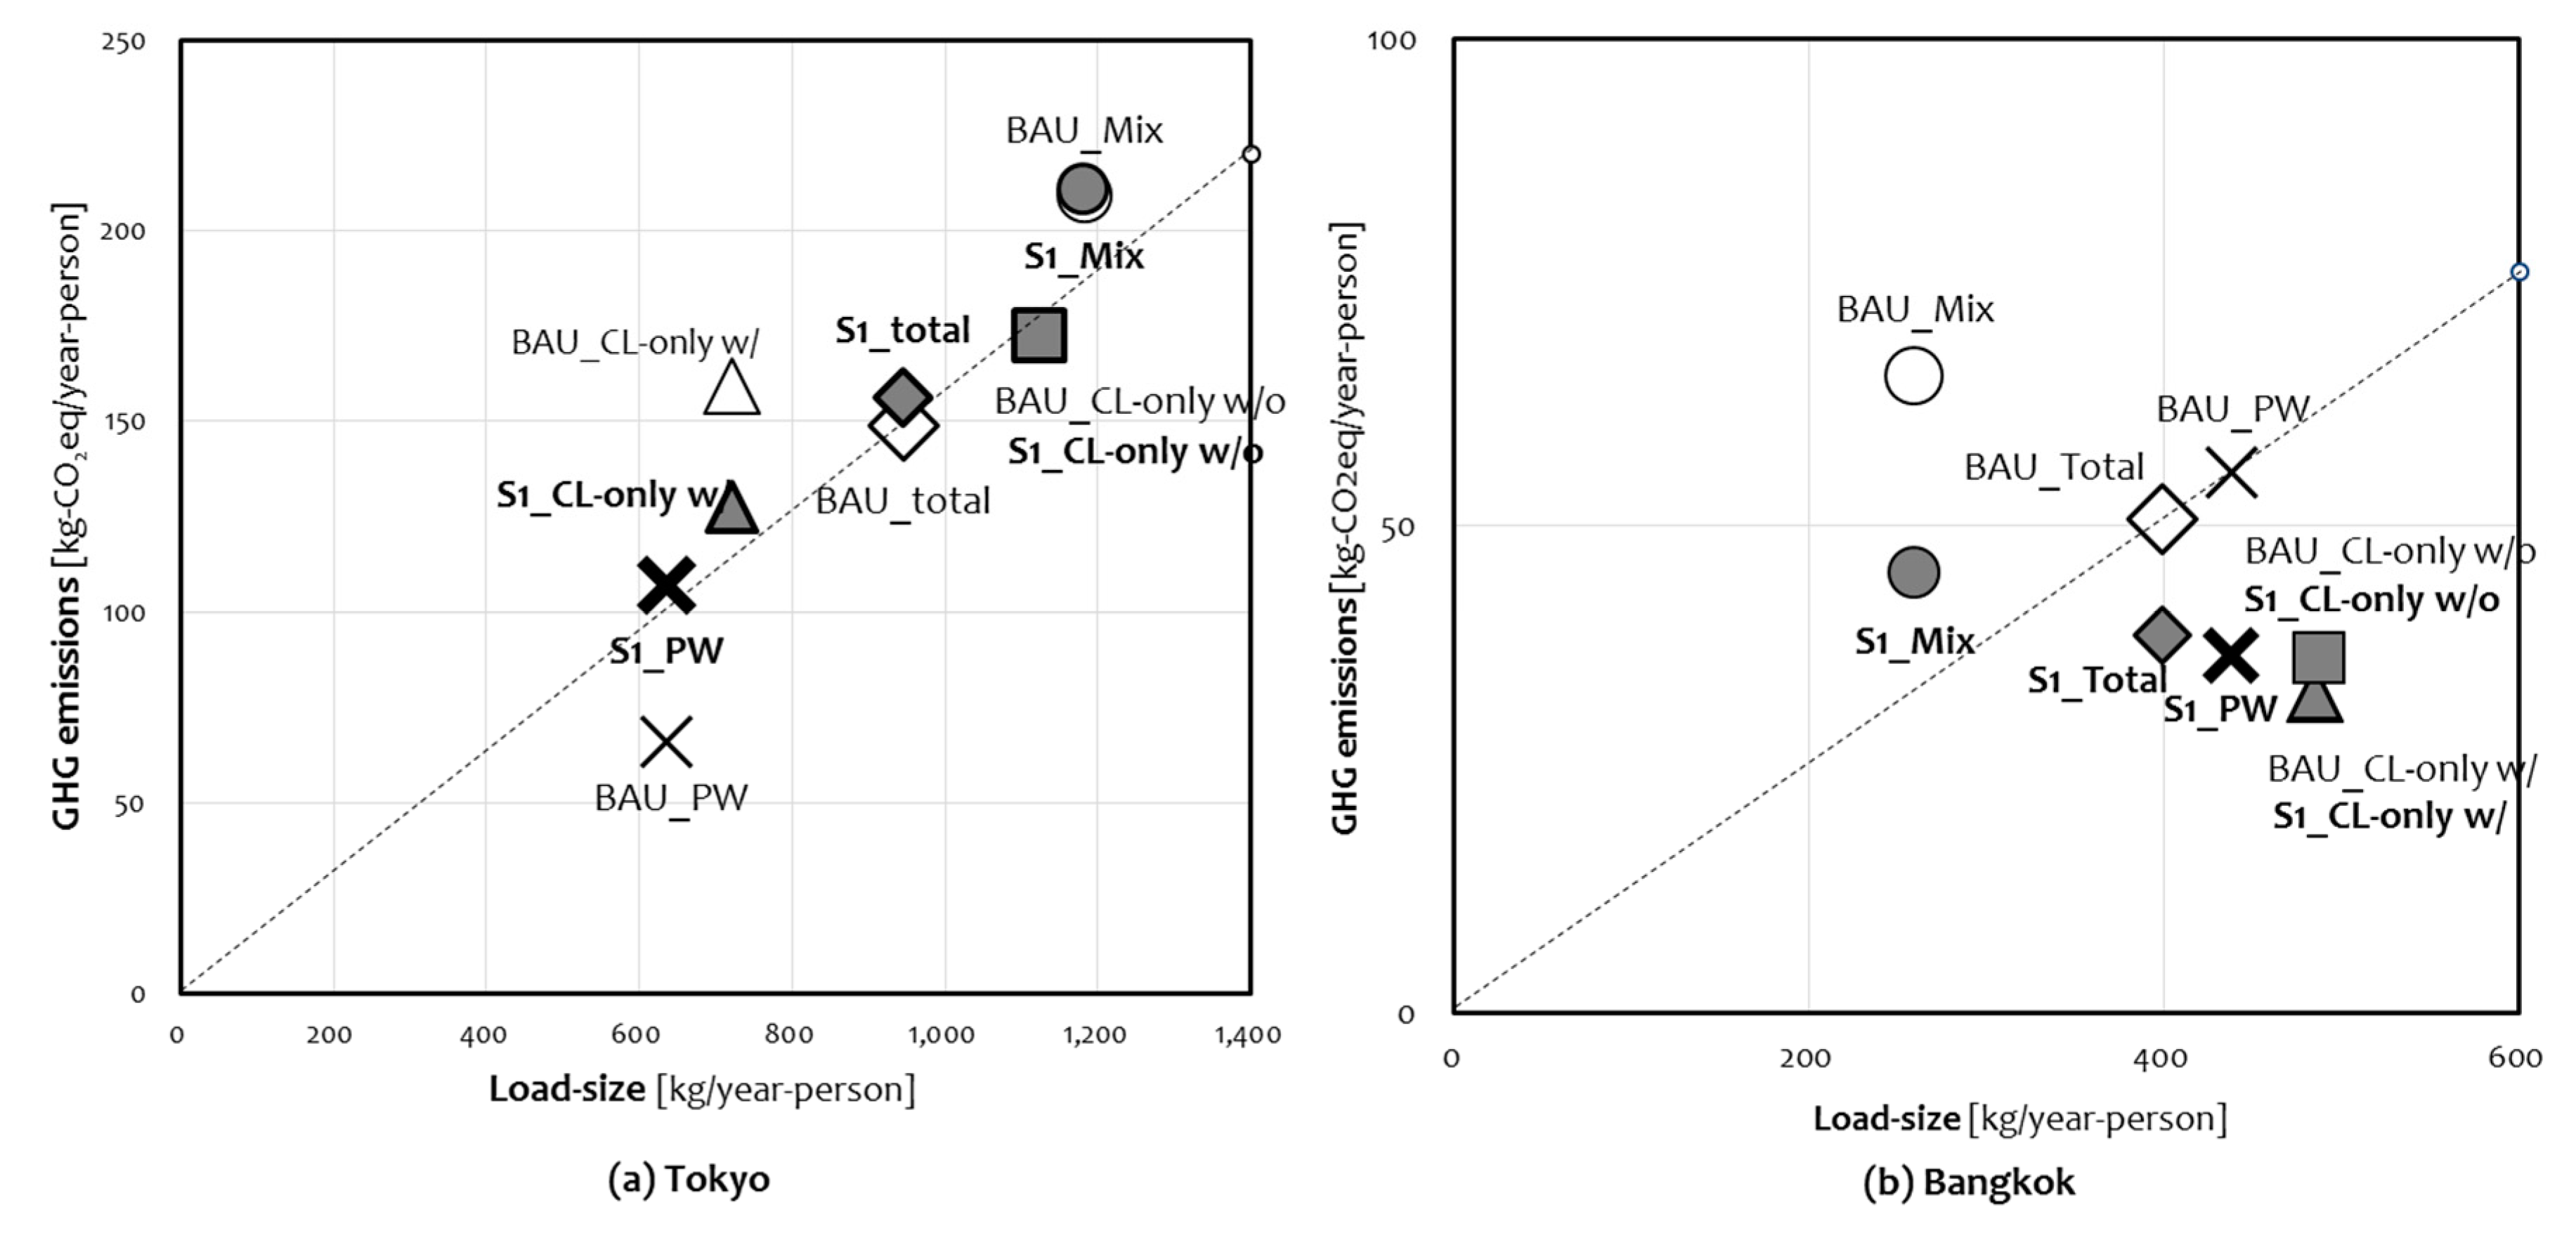
The results of the scenario analysis for the feasibility of environmentally sustainable LM-sharing were divided into two. First, the change in impact of GHG emissions by changing the respondents’ segments to CL-only w/o, comparing BAU and S1, is shown in Figure 6.
Shifting from BAU to S1, the amount of GHG emissions in Tokyo slightly increased by 5.1%, while the emissions in Bangkok decreased by 23.5%. Based on the groups, in Tokyo, the amount of GHG emissions in the PW-only group increased sharply by 62.1%. The critical contributor to the increase of GHG emissions by the PW-only group in S1 is the change in LM capacity from PW to the use of CL by large-capacity LM. The Mix also showed an increase of 0.7% in changing their behavior from using CLs and PWs to using only CLs. However, GHG emissions in the CL-only group decreased by 19.9% by abandoning their PWs from S1. In Bangkok, the GHG decline was observed in all groups; PW-only decreased the most by 33.9%, followed by Mix with a 31.2% decrease, and CL-only w/ by 0.1%. The contribution of GHG emissions in both scenarios is shown in Figure 7. The proportions of the three stages involved in producing LMs, such as manufacturing, transportation, and end-of-life, showed a decrease in both regions by sharing LMs with other users instead of using PWs in S1 compared to the BAU. Specifically, the proportion in the related stages in Tokyo and Bangkok declined from 31.5% to 21.2% and from 35.5% to 12.8%, respectively. In contrast, the proportion of GHG emissions at the washing stage increased in both regions. These grew from 37.3% to 51.1% and from 62.8% to 85.0% in Tokyo and Bangkok, respectively.
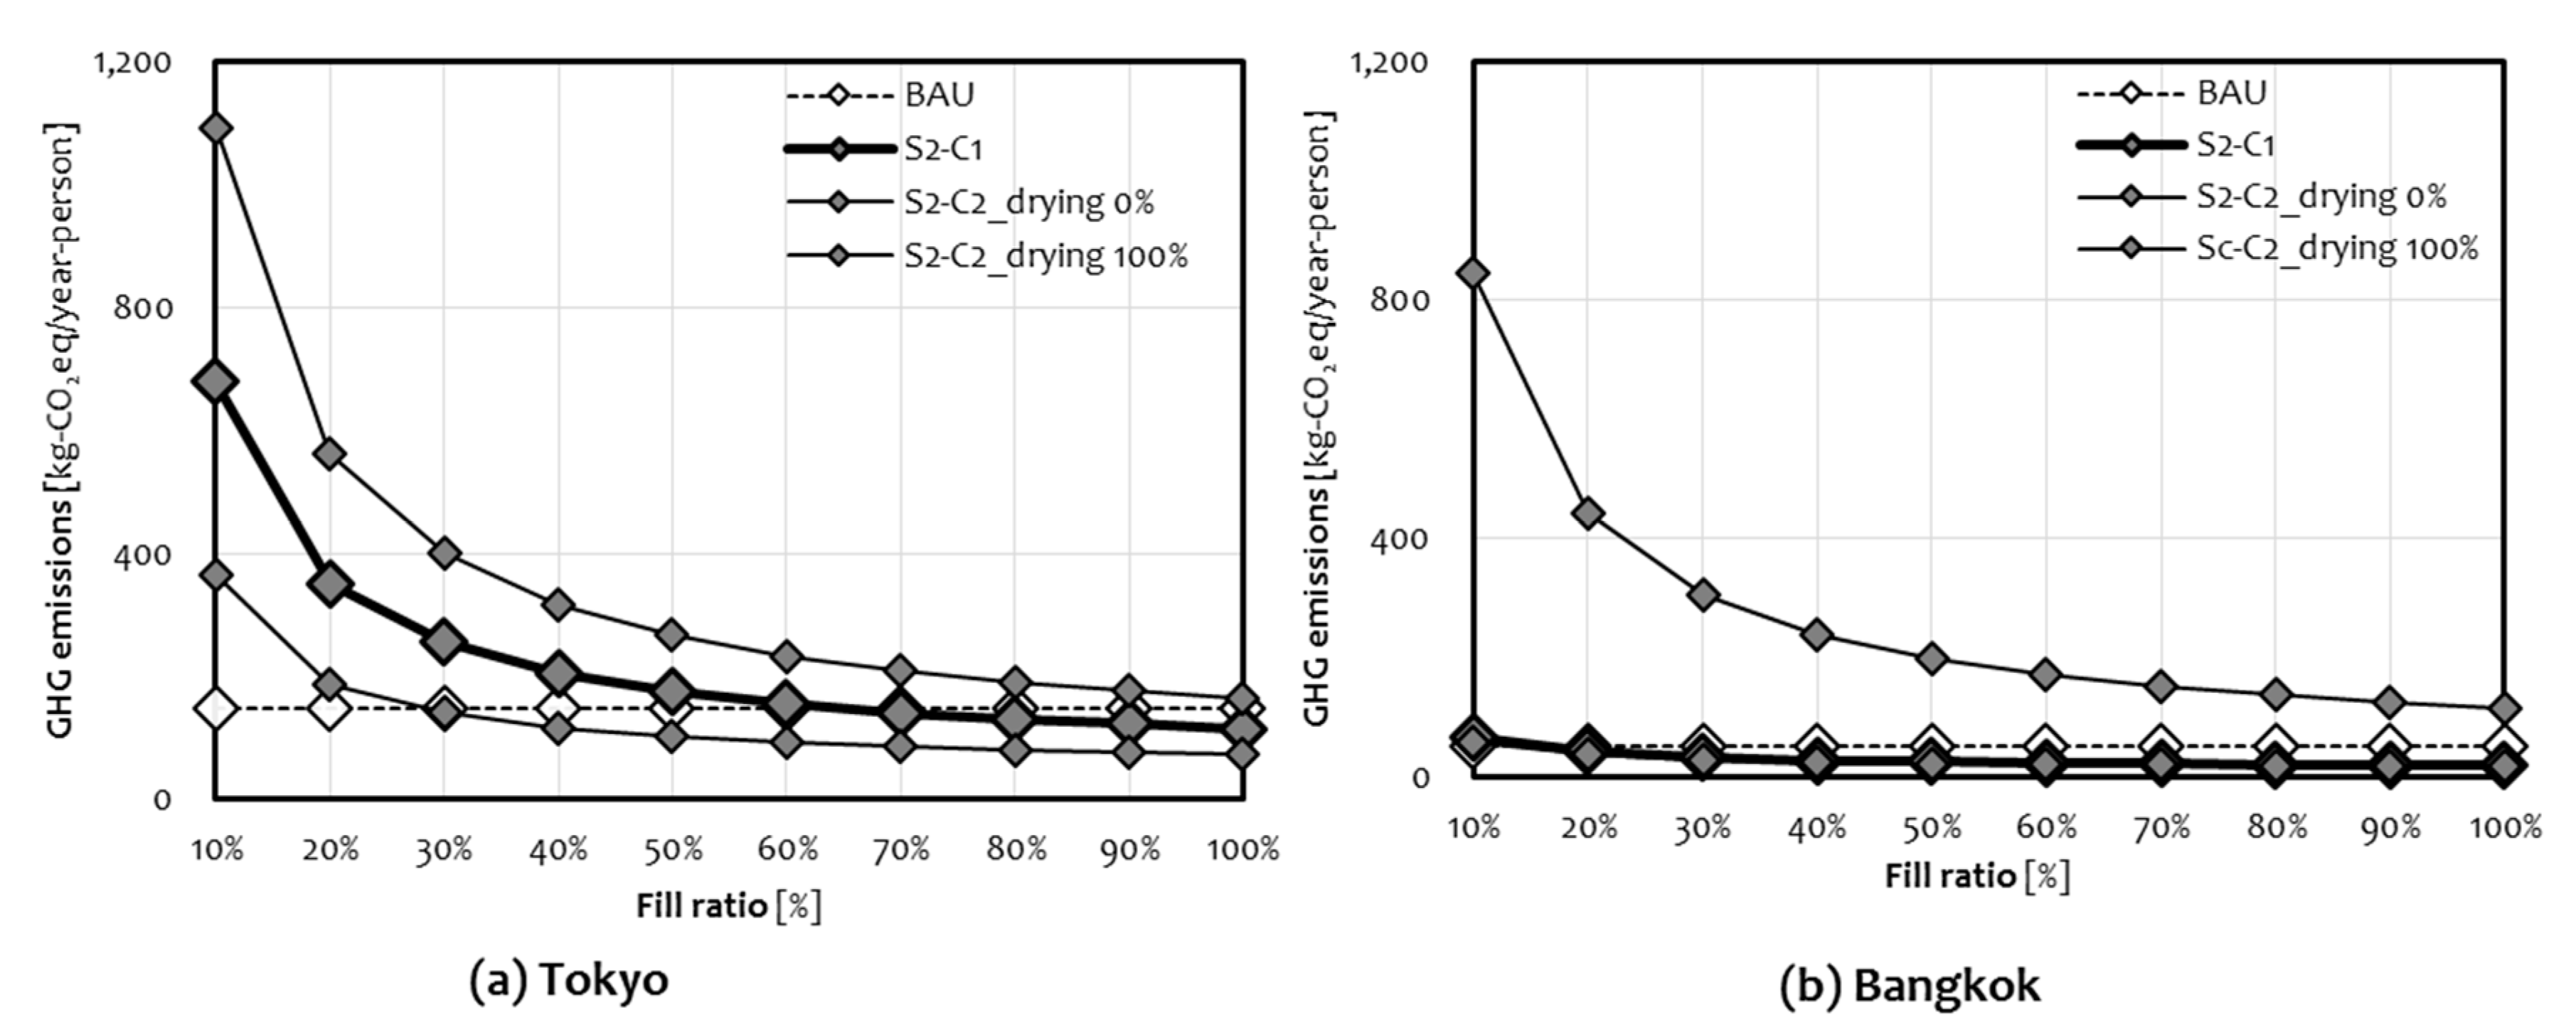
Second, to further analyze the GHG emissions by changing the laundry behaviors of survey respondents in addition to the segment changes, the sensitivity results of the GHG emissions in S2-C1 and S2-C2 are shown in Figure 8.
As a result of S2-C1, the amount of GHG emissions decreased by 83.1% in Tokyo and by 69.7% in Bangkok when the fill ratio increased from 10% to 100%. At the changing point, when the amount of GHG emissions in S2-C1 decreased below the BAU level, the fill ratio was 60–70% in Tokyo and 10–20% in Bangkok. The S2-C2 results indicate the potential to reduce 10.7% and 44.8% of GHG emissions, respectively, according to changes in the fill rate in Tokyo and Bangkok, when the utilization rate of the tumble-dryer is zero. Conversely, it also shows that it is possible to increase GHG emissions to 242.7% and 539.4% in Tokyo and Bangkok, respectively, when the utilization rate reaches 100%. Therefore, it is necessary to change the fill ratio and utilization rate of tumble-dryers to realize environmentally sustainable LM-sharing.

6. Discussion

This study investigated consumer motivations and GHG emissions in the laundry process to propose environmentally sustainable laundry behaviors through LM-sharing. In this study, consumer behavioral motivation was analyzed to describe the regional characteristics of LM-sharing in Tokyo and Bangkok. Here, the relationship between consumer behavior and motivation was affected by regional contexts and was defined based on the international consumer behavioral process’s NOA model. Furthermore, this study targeted single-households to reflect current demographic features that appeared in CL-only users in Tokyo. The results can be discussed from three perspectives: the behavioral characteristics of using CL in Tokyo and Bangkok, differences in GHG emissions according to the laundry behaviors of the respondent segments, and the feasibility of environmentally sustainable LM-sharing.
First, Tokyo and Bangkok respondents had different motivations for LM-sharing: convenience and basic needs, respectively, and their differences affected GHG emissions. Tokyo is one of the cities where LMs have become necessary household items, reaching a PW ownership rate of almost 100%, according to national statistics [37]. The regional contexts related to LM ownership were reflected in the motivation to pursue convenience-oriented laundry through LM-sharing in Tokyo. CL has been used to increase laundry efficiency, such as saving time and effort to achieve a large laundry volume at once or to dry laundry conveniently. Thus, larger capacity commercial washers and tumble-dryers were used in CL in Tokyo to pursue convenience that saves time and effort at a level PWs cannot meet (Table A1, Table 2 and Table 3). Meanwhile, in Bangkok, which has a PW ownership rate of less than 60%, CL is mainly used as an alternative to PWs because of the physical limitations of installing LMs in residences [26]. This motivation for using CLs in Bangkok was reflected in laundry behavior, with the Bangkok respondents using the CL for daily needs. Thus, in the CL, washers with similar machine types to PWs were used, while tumble-dryers were infrequently used (Table A1, Table 2 and Table 3). The differences in the laundry behavior linked to motivations are ultimately affected by GHG emissions differences in both regions. Average GHG emissions of Tokyo respondents seeking convenience beyond what a PW can provide was roughly three times as large as that of Bangkok respondents seeking practicality (Figure 4).
Second, the environmental distinction between the Mix and CL-only w/o groups was clarified. Mix respondents washed the most frequently, using both PWs and CLs to suit their requirements. Meanwhile, the CL-only w/o group could increase environmental efficiency because they tend to wash more laundry collectively and have the lowest wash-cycle among all groups. Simultaneously, it was also clarified that they use large-capacity commercial washers and tumble-dryers for laundry. It can have less environmental efficiency, even though these machines are shared with multiple users (Table 2 and Table 3). The differences in laundry behaviors between the two groups affect GHG efficiency. The CL-only w/o group, which used only CLs without a PW, was the second most environmentally efficient group after the PW-only. However, the Mix group, those using both PWs and CLs, was the least GHG-efficient group (Figure 4). As LM-sharing spreads, the proportion of Mix is expected to grow more than that of CL-only w/o. The increase in Mix users seeking convenience in the laundry process could increase total GHG emissions. Therefore, clearly distinguishing the resident segment of the Mix and CL-only w/o groups is essential to suggesting environmental sustainability through LM-sharing.
Third, LM-sharing was feasible for environmental sustainability if specific laundry behaviors were observed, such as increasing laundry volume and decreasing the mechanical-dryer utilization rate (Figure 5 and Figure 7). Two scenarios were tested to verify the effect on GHG emissions of changing the respondents’ segments (S1, Figure 5) and the laundry behaviors of survey respondents (S2-C1 and S2-C2, Figure 8). As per the results of S1, where all segments changed to CL-only w/o, it was confirmed that the amount of GHG emissions could be reduced below the BAU level in Bangkok (Figure 5). Additionally, as per the results for S2-C1 and S2-C2, further reduction in GHG emissions could be achieved by raising the fill ratio and decreasing the tumble-dryer utilization rate to zero in both regions (Figure 8). Conversely, when the tumble-dryer utilization rate reached 100%, GHG emissions could increase dramatically. The increase in GHG due to the expansion of tumble-dryer use was particularly noticeable in Bangkok, where tumble-dryers are uncommon.
In Thailand, franchise firms open many CLs around Bangkok [39,48]. The franchise CLs are equipped with the latest LMs to meet the younger generation’s growing demands (Table 1). GHG emissions can increase due to changes in the structure of LM-sharing businesses that encourage an increase in tumble-dryers in Bangkok, as evidenced by the results of the scenario analysis (Figure 7 and Figure 8). Furthermore, the introduction of CLs can stimulate the use of additional options in laundry behaviors, such as hand-washing for pretreatment of laundry or increased use of other kinds of laundry shops, such as dry cleaners. If consumers have the opportunity to use advanced LMs to save time and effort after their basic needs have been met, they might adopt more convenient laundry behavior. In addition to technological improvements in machines, the influence of consumer behaviors toward energy-saving and water-saving potential has to be considered [8]. The change in the laundromat system can influence an individual’s needs and opportunities, and thus his/her laundry behavior, and eventually affect the environment. This indicates that interdependence between social and environmental impacts could emerge during the transition to a PS system [22]. Therefore, to achieve sustainable LM-sharing, effort into production and supply in order to drive motivations to meet basic consumer needs, instead of extending consumer desires, is required.
The generalization of the analysis results may be erroneous due to the small sample size. The analysis focused on single-person households that were characteristically shown by Tokyo’s LM-sharing users. Although the number of samples was small, it was possible to clarify LM-sharing behavior by comparing with other respondents from the same demographic group of single-person households. In addition, the analysis results related to a single-person household could clarify previous studies on laundry behavior based on unclassified respondents [3,7,49].

7. Conclusions

This study proposed LM-sharing as a means of achieving sustainable laundry behaviors. This study contributes to quantifying the environmental impact of LM-sharing consumer behavior through consumer survey results from Bangkok and Tokyo. This study also identified regional differences in consumer behavior by examining the behavioral motivation of LM-sharing in these two cities. Due to the influence of regional conditions associated with PW ownership, there were distinct motivations for using CLs in Tokyo and Bangkok. The differences in motivations affected GHG emissions, reflecting consumer behaviors in the two regions. In Tokyo, the group that used PWs only (PW-only) showed higher GHG efficiency than the group using CLs only (CL-only w/o) because large-capacity washers and many tumble-dryers were preferred in CLs, tailored to consumers’ convenience. In Bangkok, contrary to Tokyo’s results, PW-only had lower GHG efficiency than CL-only w/o because LMs similar to PWs were mainly used in the CLs to meet daily needs. Furthermore, regardless of region, the group using a mix of PWs and CLs (Mix) was the least GHG-efficient group because of the use of both PWs and CLs based on convenience. Nevertheless, a consumer’s transition to laundry behaviors that only use CLs, while increasing the laundry volume per wash-cycle and decreasing the tumble-dryer utilization rate, can reduce GHG emissions in both countries.
For consumption patterns, such as laundry behaviors that are vastly diverse in different regions, it is necessary to recommend models that consider regional characteristics rather than globally unified models to achieve sustainability. This study is significant in suggesting an approach to implement LM-sharing for sustainable consumption and production systems that reflect regional needs. Understanding consumer motivation surrounding laundry behavior is useful in proposing sustainable laundry processes that meet regional needs. Many business models using LM-sharing besides the CLs proposed in this research, such as LM leasing and shared LMs in apartment complexes, have been proposed. These proposals could be an alternative to sustainable LM-sharing tailored to the needs of various consumer lifestyles. To achieve sustainable laundry behaviors, detailed discussions on laundry practices can stimulate consumer lifestyles and induce significant transformations [50]. It can also lead to discussions on how to meet the basic needs of various consumers while minimizing environmental impact [50]. This research sheds light on consumer motivations for adopting LM-sharing by examining the link with consumer lifestyles in Tokyo and Bangkok. However, further analysis of consumer acceptance of LM-sharing in the two regions has not been conducted in this research. Moreover, since this study targeted single-person households, there are limitations on the analysis results that cannot be applied to other household types. Single-person household lifestyles have characteristics suitable for continuing consumption through sharing, and the proportion of single-person households is expected to increase in the future [51]. Additionally, to extend the applicability of LM-sharing, further analysis is needed to include diverse household types in order to propose sustainability through LM-sharing. Moreover, additional research on consumer acceptance to practice sustainable laundry behaviors should be conducted in the future.
Author Contributions

Conceptualization, D.M., E.A. and M.H.; methodology, D.M., E.A. and M.H.; formal analysis, D.M.; investigation, D.M. and E.A.; writing—original draft preparation, D.M.; writing—review and editing, D.M., E.A. and M.H.; visualization, D.M.; supervision, M.H.; project administration, D.M. and M.H.; funding acquisition, M.H. All authors have read and agreed to the published version of the manuscript.

Funding

This research was supported by the Environment Research and Technology Development Fund (S-16, JPMEERF16S11610) of the Environmental Restoration and Conservation Agency.

Acknowledgments

We would like to express our gratitude to Pongsun Bunditsakulchai of the Transportation Institute, Chulalongkorn University in Thailand, and Ranaporn Tantiwechwuttikul of on-site researchers for their kind cooperation in the field investigation of our research.

Conflicts of Interest

The authors declare no conflict of interest.

Appendix A

Table A1. Characteristics of laundromats in Japan and Thailand 1,2.
ItemsJapanThailand
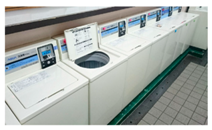
Conventional styleInside the building, usually next to the dry-cleaning shop or the public-bathhouse. V-axis commercial machine (washer, tumble-dryer). Similar capacity to PWs.
Sustainability 12 09756 i001
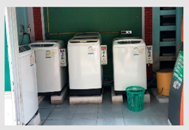
Mainly outside, on the street, or next to a building. V-axis domestic machine (washer). Similar capacity to PWs.
Sustainability 12 09756 i002
Advanced styleInstalled inside the building. H-axis commercial machine (washer, washer-dryer, and tumble-dryer). Larger capacity than PWs. Laundry-related amenities.
Sustainability 12 09756 i003
Installed inside the building. H-axis commercial machine (washer, tumble-dryer). Larger capacity than PWs. Promotion-related with laundry-service.
Sustainability 12 09756 i004
1 The shaded cells are the most common type in each region. 2 The characteristics of laundromats in both countries were summarized based on the results of residents’ surveys and newspaper articles [20,26,39,48].
Table A2. Details of consumer surveys in Tokyo and Bangkok.
ItemsTokyoBangkok
Survey period28–30 November 201722–24 October 2018
Survey method 1Web-based questionnaireFace-to-face questionnaire 1
Target area 2Tokyo Metropolis and the prefectures of Kanagawa, Chiba, and SaitamaBangkok Metropolis and Pathum Thani mainly in the Bangkok Metropolitan region 2
RespondentsTokyo residents who independently do their laundryThai Bangkok residents
Estimated time5–10 min/respondents5–10 min/respondents
Contents 3, 4Demographic dataGender, age, household size, household type, income, and housing type
Laundry behaviors related to the use of laundry-machineOwnership of washer, capacity, type of washer, number of wash-cycle, load-size, the use of laundromat, how laundry is dried (the use of tumble-dryer)
MotivationsThe reason to use laundromat (Not enough space to install the machine, not enough space for drying, saving time and effort, washing huge quantities at once, no maintenance, well-finished, available at any time, cheapest way, others)
1 The surveys were divided into three parts: demography, laundry behaviors related to the use of LMs, and motivations. 2 In the case of Bangkok, an intercept survey was conducted in two locations: (1) in a specific place, such as in or around laundromats where laundromat users can be connected easily, and (2) in public places, such as shopping malls, bus stations, or squares [26]. 3 The same questions were asked in both surveys to evaluate the regional characteristics of consumer behaviors clearly. 4 The underlined questions were asked only for Tokyo respondents in the Tokyo survey.
Table A3. Details of the variables used for calculating GHG emissions.
TokyoBangkok
Number of wash-cyclesPW f r e _ P W { 0 ,   26 ,   56 ,   104 ,   260 ,   365 } f r e _ P W { 0 ,   26 ,   56 ,   156 ,   261 ,   365 }
CL f r e _ C L { 0 ,   26 ,   56 ,   104 ,   260 ,   365 } f r e _ C L { 0 ,   26 ,   56 ,   156 ,   261 ,   365 }
Capacity of machinePW c a p a _ P W J P N { 0 ,   5 ,   6 ,   8 ,   10 ,   11 } c a p a _ P W T h a i { 0 ,   6 ,   8 ,   10 ,   12 ,   17 }
CL c a p a _ C L J P N { 0 ,   14 ,   17 ,   27 } c a p a _ C L T h a i { 0 ,   10 ,   12 ,   14 ,   17 }
Tumble-dryer c a p a _ C L J P N { 0 ,   16 ,   18 ,   28 } c a p a _ C L T h a i { 0 ,   18 ,   28 }
Machine type 1PW t y p e _ P W J P N { V a x i s ,   H a x i s } t y p e _ P W T h a i { V a x i s ,   H a x i s ,   T t u b ,   u n k n o w n }
CL, Tumble-dryer t y p e _ C L J P N = { V a x i s } t y p e _ C L T h a i { V a x i s ,   H a x i s ,   T t u b ,   u n k n o w n }
How to dry ( d r y )- d r y { n a t u r a l d r y ,   t u m b l e d r y P W ,   t u m b l e d r y C L } d r y { n a t u r a l d r y ,   t u m b l e d r y P W ,   t u m b l e d r y C L }
DistanceFrom manufacture to usage D 1 = 324
From usage to treatment D 2 = 324
Service life ( s l )PW s _ P W = 9
CL s _ C L = 15
Number of users ( u )PW u _ P W = 1
CL u _ C L = 6
1 V-axis, H-axis, and T-tub indicate the vertical-axis, horizontal axis, and twin-tub machine type, respectively. Here, the V-axis type is called the impeller style, or the top-opened type, and the H-axis type is called the drum style or front-opened type.
Table A4. Specific conditions for each scenario.
Business as Usual (BAU)S1S2: The Extended Version of the S1
S2-C1S2-C2
The current situation as stated in the questionnaireAll survey respondents in the BAU have become a part of the CL-only w/o groupFill ratio 1 varies between 10% and 100%. The number of washing-cycles is also accordingly changed.The utilization rate of the tumble-dryer changes to 0% and 100%.
1 Fill ratio is the percentage of laundry volume to the capacity of the washer.
Figure A1. Percentage of survey respondents by segments in Tokyo and Bangkok (single-person households).
Sustainability 12 09756 g0a1

References

  1. Stamminger, R.; Barth, A.; Dörr, S. Old washing machines wash less efficiently and consume more resources. Hauswirtschaft Und Wissenschaft 2005, 53, 124–131. [Google Scholar]
  2. Yamaguchi, Y.; Tsuchiya, M.; Nagayama, M. Investigation on reducing the environmental load of home laundry drying. ILCAJ 2007, 3, 221–231. (In Japanese) [Google Scholar] [CrossRef] [Green Version]
  3. Golden, J.S.; Subramanian, V. Energy and carbon impact from residential laundry in the United States. J. Integr. Environ. 2010, 7, 53–73. [Google Scholar] [CrossRef] [Green Version]
  4. Lin, J.; Iyer, M. Cold or hot wash: Technological choices, cultural choices, cultural change, and their impact on clothes-washing energy use in China. Energy Policy 2007, 35, 3046–3052. [Google Scholar] [CrossRef]
  5. Conrady, T.; Kruschwitz, A.; Stamminger, R. Influencing the sustainability of washing behavior by using motivational interviewing. Energ. Effic. 2014, 7, 163–178. [Google Scholar] [CrossRef]
  6. Kruschwitz, A.; Karle, A.; Schmitz, A.; Stamminger, R. Consumer laundry practices in Germany. Int. J. Consum. Stud. 2014, 38, 265–277. [Google Scholar] [CrossRef]
  7. Pakula, C.; Stamminger, R. Electricity and water consumption for laundry washing by washing machine worldwide. Energ. Effic. 2010, 3, 365–382. [Google Scholar] [CrossRef]
  8. Pakula, C.; Stamminger, R. Energy and water savings potential in automatic laundry washing processes. Energ. Effic. 2015, 8, 205–222. [Google Scholar] [CrossRef]
  9. Schmitz, A.; Stamminger, R. Usage behavior and related energy consumption of European consumers for washing and drying. Energ. Effic. 2014, 7, 937–954. [Google Scholar] [CrossRef]
  10. Jack, T. Laundry routine and resource consumption in Australia. Int. J. Consum. Stud. 2013, 37, 666–674. [Google Scholar] [CrossRef] [Green Version]
  11. Laitala, K.; Boks, C.; Klepp, I.G. Potential for environmental improvements in laundering. Int. J. Consum. Stud. 2011, 35, 254–264. [Google Scholar] [CrossRef]
  12. Laitala, K.; Klepp, I.G.; Boks, C. Changing laundry habits in Norway. Int. J. Consum. Stud. 2012, 36, 228–237. [Google Scholar] [CrossRef]
  13. Miilunpalo, S.M.; Räisänen, R. Clean laundry with pure conscience-A study on laundry practices among Finnish consumers. Int. J. Consum. Stud. 2019, 43, 153–165. [Google Scholar] [CrossRef]
  14. ETH Sustainability, Washing Machine. ETH Sustainability Summer School. 2011. Available online: http://webarchiv.ethz.ch/sustainability-v2/lehre/Sommerakademien/so2011/washies_report.pdf (accessed on 21 September 2019).
  15. Spencer, J.; Lilley, D.; Porter, S. The opportunities that different cultural contexts create for sustainable design: A laundry care example. J. Clean. Prod. 2015, 107, 279–290. [Google Scholar] [CrossRef] [Green Version]
  16. Stamminger, R. Modelling resource consumption for laundry and dish treatment in individual households for various consumer segments. Energ. Effic. 2011, 4, 559–569. [Google Scholar] [CrossRef]
  17. Heiskanen, E.; Jalas, M. Can services lead to radical eco-efficiency improvements? A review of the debate and evidence. Corp. Soc. Responsib. Environ. Manag. 2003, 10, 186–198. [Google Scholar] [CrossRef]
  18. Mont, O.; Tukker, A. Product-service systems: Reviewing achievements and refining the research agenda. J. Clean. Prod. 2006, 14, 1451–1454. [Google Scholar] [CrossRef]
  19. Tukker, A. Eight types of product-service system: Eight ways to sustainability? Experiences from suspronet. Bus. Strateg. Environ. 2004, 13, 246–260. [Google Scholar] [CrossRef]
  20. Amasawa, E.; Suzuki, Y.; Moon, D.; Nakatani, J.; Sugiyama, H.; Hirao, M. Designing interventions for behavioral shirts toward product sharing: Case of laundry activities in Japan. Sustainability 2018, 10, 2687. [Google Scholar] [CrossRef] [Green Version]
  21. Haapala, K.R.; Brown, K.L.; Sutherland, J.W. A life cycle environmental and economic comparison of clothes washing product-service systems. Trans. NAMRI/SME 2008, 36, 333–340. [Google Scholar]
  22. Retamal, M.; Schandl, H. Dirty laundry in Manila. J. Ind. Ecol. 2017, 22, 1389–1401. [Google Scholar] [CrossRef]
  23. Wasserbaur, R.; Sakao, T.; Söderman, L.M.; Plepys, A. What if everyone becomes a sharer? A quantification of the environmental impact of access-based consumption for household laundry activities. Resour. Conserv. Recy. 2020, 158, 104780. [Google Scholar] [CrossRef]
  24. Retamal, M. Product-service systems in Southeast Asia: Business practices and factors influencing environmental sustainability. J. Clean. Prod. 2017, 143, 894–903. [Google Scholar] [CrossRef]
  25. Wilhite, H.; Nakagami, H.; Masuda, T.; Yamaga, Y. A cross-cultural analysis of household energy use behavior in Japan and Norway. Energy Policy 1996, 24, 795–803. [Google Scholar] [CrossRef]
  26. Moon, D.; Amasawa, E.; Hirao, M. Laundry habits in Bangkok: Use patterns of products and services. Sustainability 2019, 11, 4486. [Google Scholar] [CrossRef] [Green Version]
  27. Stern, P.C. Information, incentives, and proenvironmental consumer behavior. J. Consum. Policy 1999, 22, 461–478. [Google Scholar] [CrossRef]
  28. Laakso, S. Giving up Cars-the impact of a mobility experiment on carbon emissions and everyday routines. J. Clean. Prod. 2017, 169, 135–142. [Google Scholar] [CrossRef] [Green Version]
  29. Vlek, C.; Steg, L. Human Behavior and Environmental Sustainability: Problems, Driving Forces, and Research Topics. J. Soc. Issues 2007, 63, 1–19. [Google Scholar] [CrossRef]
  30. Fishbien, M.A.; Ajzen, I. Belief, Attitude, Intention and Behaviour: An Introduction to Theory and Research; Addison-Wesley Pub. Co.: Reading, MA, USA, 1975. [Google Scholar]
  31. Ölander, F.; Thøgerson, J. Understanding of Consumer Behaviour as a Prerequisite for Environmental Protection. J. Consum. Policy 1995, 18, 345–385. [Google Scholar] [CrossRef]
  32. Vlek, C. Essential psychology for environmental policy making. Int. J. Psychol. 2000, 35, 153–167. [Google Scholar] [CrossRef]
  33. Klaniecki, K.; Wuropulos, K.; Hager, C.P. Behaviour Change for Sustainable Development. Encycl. Sustain. High. Educ. 2019. [Google Scholar] [CrossRef]
  34. Statistics Bureau of Japan. Population by Prefecture and Population Change Rate. Statistics Bureau of Japan. 2019. Available online: https://www.stat.go.jp/data/nihon/02.html (accessed on 17 September 2019).
  35. National Statistical Office. The Population and Housing Census. National Statistical Office, Thailand. Available online: http://service.nso.go.th/nso/nso_center/project/search_center/23project-en.htm (accessed on 29 October 2019).
  36. Wikipedia. Bangkok Metropolitan Region. Available online: https://en.wikipedia.org/wiki/Bangkok_Metropolitan_Region (accessed on 21 September 2019).
  37. Cabinet Office. Consumer Confidence Survey. Cabinet Office, Government of Japan. 2004. Available online: https://www.esri.cao.go.jp/jp/stat/shouhi/shouhi.html (accessed on 29 October 2019).
  38. Euromonitor International. Consumer Appliances. Available online: https://www.euromonitor.com/consumer-appliances (accessed on 21 September 2016).
  39. Jitpleecheep, P. Clean as Whistle. Bangkok Post. 2019. Available online: https://www.bangkokpost.com/business/1712596/clean-as-a-whistle (accessed on 29 October 2019).
  40. International Organization for Standardization. ISO 14040. In Environmental Management—Life Cycle Assessment—Principles and Framework; ISO: Geneva, Switzerland, 2006. [Google Scholar]
  41. Jonathan, M.C.; Julian, M.A. The role of washing machines in life cycle assessment studies. J. Ind. Ecol. 2009, 13, 27–37. [Google Scholar] [CrossRef]
  42. Association for Electric Home Appliances. Survey Report on Years of Use of Home Appliances. Association for Electric Home Appliances. 2018. Available online: https://www.aeha.or.jp/about/pdf/naikakucyousa_1809.pdf (accessed on 29 October 2019).
  43. National Tax Agency. Standard Service Life (Machine/Equipment). National Tax Agency, Government of Japan. 2018. Available online: https://www.keisan.nta.go.jp/h30yokuaru/aoiroshinkoku/hitsuyokeihi/genkashokyakuhi/taiyonensukikai.html (accessed on 21 September 2019).
  44. Electrolux Professional. Find the Perfect Washer and Dryer for You. Electrolux Professional Japan. Available online: http://www.professional-laundry.com/product/ (accessed on 29 October 2019).
  45. Hitachi. Catalog of Washing Machines and Dryers. Hitachi Global Life Solutions. 2019. Available online: https://kadenfan.hitachi.co.jp/catalog/ (accessed on 29 October 2019).
  46. LION. Care for Clothing and Cloth Products: Detergents for Clothing. Lion Corporation. Available online: https://www.lion.co.jp/ja/support/faq/product/1705 (accessed on 21 September 2019).
  47. Japan Environmental Management Association for Industry. LCI Database IDEA (Inventory Database for Environmental Analysis) Version v2.3; The Research Institute of Science for Safety and Sustainability, AIST: Tokyo, Japan, 2019. [Google Scholar]
  48. Rungfapaisarn, K. Maru Laundry Takes Coin-Operated Laundry Machines into New Era. The Nation Thailand. 11 July 2019. Available online: https://www.nationthailand.com/business/30372839 (accessed on 29 October 2019).
  49. Yamaguchi, Y.; Seii, E.; Itagaki, M.; Nagayama, M. Evaluation of domestic washing in Japan using life cycle assessment (LCA). Int. J. Consum. Stud. 2011, 35, 243–253. [Google Scholar] [CrossRef]
  50. Godin, L.; Laakso, S.; Sahakian, M. Doing laundry in consumption corridors: Wellbeing and everyday life. SSPP 2020, 16, 99–113. [Google Scholar] [CrossRef]
  51. Ala-Mantila, S.; Ottelin, J.; Heinonen, J.; Junnila, S. To each their own? The greenhouse gas impacts of intra-household sharing in different urban zones. J. Clean. Prod. 2016, 135, 356–367. [Google Scholar] [CrossRef]
Figure 1. Respondents segments based on owning private-washers and using laundromat [26].
Sustainability 12 09756 g001
Figure 2. System boundary for LCA analysis of laundry behaviors.
Sustainability 12 09756 g002
Figure 3. The motivation for using CL in Tokyo and Bangkok (Single-person households) 1, 2. 1 The answering options for survey questions in Tokyo and Bangkok were multiple choice and a single choice, respectively (n = 42, 27). 2 The statistical significance of differences between regions is as follows: χ2 = 26.124, df = 8, p < 0.001.
Sustainability 12 09756 g003
Figure 4. Load-sizes and GHG emissions per year, per person in Tokyo and Bangkok (single-person households): (a) Tokyo (n = 82); (b) Bangkok (n = 43) 1. 1 The differences in GHG emissions among groups were statistically significant. [ Tokyo ]   The   load   size   of   laundry   : χ 2 = 10.238 ,   d f = 3 ,   p = 0.017 ;   the   amount   of   GHG   emissions :   χ 2 = 41.002 ,   d f = 3 ,   p < 0.001 ; [ Bangkok ]   The   load size   of   laundry   : χ 2 = 21.463 ,   d f = 3 ,   p < 0.001 ;   the   amount   of   GHG   emissions :   χ 2 = 16.810 ,   d f = 3 ,   p = 0.001 .
Sustainability 12 09756 g004
Figure 5. Stacked bar graph showing the contribution of GHG emissions by stages (single-person households): (a) Tokyo (n = 82); (b) Bangkok (n = 43).
Sustainability 12 09756 g005
Figure 6. Differences of the load-size and the GHG emissions between BAU and S1 (single-person households): (a) Tokyo (n = 82); (b) Bangkok (n = 43).
Sustainability 12 09756 g006
Figure 7. Stacked bar graph showing the contribution rate of the GHG emissions by stages in BAU and SI (single-person households): (a) Tokyo (n = 82); (b) Bangkok (n = 43).
Sustainability 12 09756 g007
Figure 8. GHG emissions changes between BAU and S2-C1 and S2-C2 (single-person households): (a) Tokyo (n = 82); (b) Bangkok (n = 43).
Sustainability 12 09756 g008
Table 1. Demographic distributions in Tokyo and Bangkok 1.
TokyoBangkok
TotalCL-Only UsersOthersTotalCL-Only UsersOthers
Total [number]1703014018535150
Household size [people/household]2.51.02.83.02.51.6
Household size [n (%)]Single-person82(48.2)30(100)52(37.1)43(23.2)11(31.4)32(21.3)
Two-person5(2.9)0(0.0)5(3.6)44(23.8)13(37.1)31(20.7)
More than three83(48.8)0(0.0)83(59.3)98(53.0)11(31.4)87(58.0)
Gender [n (%)]Male106(62.4)28(93.3)78(55.7)70(38.7)12(36.4)58(39.2)
Female64(37.6)2(6.7)62(44.3)111(61.3)21(63.6)90(60.8)
Ages [n (%)]18~n/an/an/a51(28.0)8(22.9)43(29.3)
20s7(4.1)2(26.7)5(3.6)89(48.9)20(57.1)69(46.9)
30s42(24.7)2(26.7)40(28.6)
40s64(37.6)10(33.3)54(38.6)36(19.8)6(17.1)30(20.4)
50s38(22.4)14(46.7)24(17.1)
60s~19(11.2)2(6.7)17(12.1)6(3.3)1(2.9)5(3.4)
Residence type [n (%)]Single house52(30.6)0(0.0)52(37.1)63(34.1)1(2.9)62(41.3)
Apartments105(61.8)28(93.3)77(55.0)24(13.0)4(11.4)20(13.3)
Dormitory9(5.3)1(5.3)8(5.7)73(39.5)25(71.4)48(32.0)
others4(2.4)1(2.4)3(2.1)25(13.5)5(14.3)20(13.3)
Demographic targetSingle-male householdSingle-person household
Sample sizen = 82n = 43
1 The statistical significance of differences among the groups is as follows: [Tokyo] household size: χ2 = 39.094, df = 5, p < 0.001; gender: χ2 = 14.895, df = 3, p < 0.001; Ages: χ2 = 15.850, df = 4, p = 0.003; residence type: χ2 = 17.434, df = 3, p = 0.001; [Bangkok] household size: χ2 = 21.716, df = 7, p = 0.003; gender: χ2 = 2.663, df = 2, p = 0.264, Ages: χ2 = 1.919, df = 4, p = 0.751; residence type: χ2 = 23.693, df = 4, p < 0.001.
Table 2. Specifications of laundry-machine in CL and PW of Tokyo and Bangkok respondents (single-person households) 1,2.
TokyoBangkok
TotalPW-OnlyMixCL-Only w/CL-Only w/oTotalPW-OnlyMixCL-Only w/CL-Only w/o
CapacityPrivate-washer [kg]6.56.96.16.5 7.27.57.0
Washer at CL [kg]16.3 15.414.017.610.4 10.311.210.0
Machine typePWV-axis [%]78.887.072.272.7-62.550.064.3--
H-axis [%]21.213.027.827.3-25.033.314.3--
Twin-tub [%]-----12.58.314.3--
Unknown [%]-----8.38.37.1--
CLV-axis [%]-----29.0 64.30.00.0
H-axis [%]100-1001001009.7 14.30.09.1
Twin-tub [%]-----6.5-14.30.00.0
Unknown [%] 54.8-7.110090.9
1 Each figure reported in this table represents the average values of all samples (n = 82, 43). 2 The statistical significance is as follows:   [ Tokyo ]   Capacity   of   PW : χ 2 = 2.794 ,   d f = 2 ,   p = 0.247 ;   capacity   of   CL :   χ 2 = 10.575 ,   d f = 2 ,   p = 0.005 ;   type   of   PW :   x 2 = 84.566 ,   d f = 6 ,   p < 0.001 ;   [ Bangkok ]   Capacity   of   PW : χ 2 = 0.780 ,   d f = 1 ,   p = 0.377 ;   Capacity   of   CL   : χ 2 = 1.835 ,   d f = 2 ,   p = 0.400 ;   type   of   PW :   x 2 = 1.455 ,   d f = 3 ,   p = 0.693 ,   type   of   CL :   x 2 = 24.898 ,   d f = 6 ,   p < 0.001 .
Table 3. Characteristics of laundry behaviors by the group in Tokyo and Bangkok (single-person households) 1,2.
TokyoBangkok
TotalPW-OnlyMixCL-Only w/CL-Only w/oTotalPW-OnlyMixCL-Only w/CL-Only w/o
Load-size per a year, person [kg/year-person]945.7635.81182.9721.41123.3399.2438.0259.8484.6487.6
Number of wash-cycle [wash-cycle/year]116.7127.7183.589.878.0169.4147.4236.0152.0118.3
Volume per wash cycle, person [kg-laundry/wash-cycle-person]9.45.16.78.314.64.04.11.46.85.7
Fill ratio (CL)2 [%]67.4 43.759.184.735.8-12.951.756.4
User rate of tumble-dryer [%]47.68.744.436.483.32.30.00.00.09.1
Utilization rate of tumble-dryer [%]42.75.733.936.478.70.80.00.00.03.3
1 Each figure reported in this table represents the average values in all samples (n = 82, 43). 2 Fill ratio = volume per wash-cycle/capacity of wash. 3 The statistical significance is as follows: [ Tokyo ]   Load   size   per   year ,   person : χ 2 = 10.238 ,   d f = 3 ,   p = 0.017 ;   wash cycle : χ 2 = 32.137 ,   d f = 3 ,   p < 0.000 ;   volume   per   wash cycle ,   person :   χ 2 = 51.424 ,   d f = 3 ,   p < 0.001 ; Fill   ratio   of   CL :   χ 2 = 26.411 ,   d f = 2 ,   p < 0.001 ;   Utilization   rate   of   tumble dryer :   χ 2 = 32.115 ,   d f = 3 ,   p < 0.001 ; [ Bangkok ]   Load   size   per   year ,   person :   χ 2 = 21.463 ,   d f = 3 ,   p < 0.001 ; wash cycle :   χ 2 = 9.137 ,   d f = 3 ,   p = 0.028 ;   volume   per   wash cycle ,   person :   χ 2 = 21.892 ,   d f = 3 ,   p < 0.001 ;   Fill   rate   of   CL : χ 2 = 18.527 ,   d f = 2 ,   p < 0.001 ;   Utilization   rate   of   tumble dryer : χ 2 = 2.909 ,   d f = 3 ,   p = 0.406 .
Publisher’s Note: MDPI stays neutral with regard to jurisdictional claims in published maps and institutional affiliations.