Article

Characteristics and Influencing Factors of Green Finance Development in the Yangtze River Delta of China: Analysis Based on the Spatial Durbin Model

1
Institute of Ecological Civilization, Jiangxi University of Finance and Economics, Nanchang 330013, China
2
Department of International Trade, Inha University, 100 Inha-ro, Nam-gu, Incheon 22212, Korea
*
Author to whom correspondence should be addressed.
Sustainability 2020, 12(22), 9753; https://doi.org/10.3390/su12229753
Submission received: 12 October 2020 / Revised: 17 November 2020 / Accepted: 19 November 2020 / Published: 23 November 2020
(This article belongs to the Special Issue Energy Efficiency and Urban Climate Adaption)

Abstract

:
Based on urban economic data in the Yangtze River Delta region of China from 2011 to 2017, this study empirically explores the characteristics of green finance development and its influencing factors through the establishment of a time fixed effects Durbin model. The empirical results are as follows: (1) The development of green finance in the Yangtze River Delta has a clear spatial cluster effect, and there are large regional differences. (2) The regional GDP, regional innovation level, and air quality are the most important influencing factors, and the degree of financial development and the optimization of the industrial structure are not significant. (3) Regional GDP is positively correlated with the development of green finance, and regional innovation level and air quality are negatively correlated with the development of green finance. (4) Regional GDP, regional innovation level, and air quality are associated with the development level of green finance mainly through direct effects. The degree of financial development and the optimization of industrial structure are associated with the development level of green finance mainly through spillover effects. The degree of financial development has a positive spillover effect; in contrast, the optimization of the industrial structure has a negative spillover effect. Finally, according to the conclusions, countermeasures and suggestions for improving the level of green finance development in the Yangtze River Delta are proposed.

1. Introduction

The Yangtze River Delta urban agglomeration, as China’s most economically developed and most urbanized area, is regarded as an important engine of China’s economic development. In 2017, China designated Zhejiang Province in the Yangtze River Delta region as a pilot zone for green finance reform and innovation. At the first China International Import Expo (CIIE) in 2018, President Xi Jinping announced that the government “supports the development of the Yangtze River Delta’s regional integration and rises it into a national strategy”. The Outline of the Yangtze River Delta Regional Integration Development Plan was promulgated by the State Council in 2019. It included Shanghai, Jiangsu, Zhejiang, and Anhui provinces in the Yangtze River Delta, which is a “40 + 1” city group (forty prefecture-level cities and one municipality directly under the Central Government), stated that the Yangtze River Delta should be built into a beautiful demonstration zone in China.
In 1974, the former West Germany established the world’s first environmental bank. In 1992, the United Nations Environment Programme (UNEP) issued the “Declaration on Environmental Sustainability in the Banking and Insurance Sector”. In 2003, when the “Equator Principles” came out, the concept of green finance had been widely recognized all over the world. Using green financial services to promote sustainable economic development has become the mainstream trend of the development of the international financial industry [1]. With the increase in population density and the consumption of resources in the process of industrial expansion in the Yangtze River Delta, environmental problems have become increasingly serious. Green finance plays an increasingly important role in achieving sustainable development of the environment, economy, and society. The government has successively issued the Green Credit Guideline (2012), Green Bond Issuance Guidelines (2015), and other documents related to green financial governance to play the role of green finance in the construction of ecological civilization. On August 31, 2016, in the Guiding Opinions on Building a Green Financial System issued by seven ministries and commissions such as the People’s Bank of China, green finance was defined as “economic activities that support environmental improvement, respond to climate change, and use resources efficiently”, that is, financial services provided for project investment, project operation, and risk management in the fields of environmental protection, energy conservation, clean energy, green transportation, and green buildings. “Green” refers to saving resources, reducing pollution, protecting the environment, and achieving sustainable development. The concept of “green” is basically the same as “environmentally friendly”. Green finance includes mainly green credit, green securities, green insurance, green investment, and carbon finance.
From a macroeconomic perspective, green finance promotes the optimization of the economic structure, the improvement of supply-side quality, and maintains economic growth. In terms of microeconomic efficiency, the green financial system can encourage enterprises to carry out green innovation, reduce market transaction costs, and guide consumers toward green consumption [2]. At the same time, green finance has become a powerful driving force for the construction of ecological civilization in two ways. On the one hand, it provides financial support for enterprises engaging in environmental protection, reducing the financial barriers of these enterprises; on the other hand, it can limit traditional high-pollution and high-energy-consuming enterprises, causing such enterprises to leave the market. This type of resource allocation can improve the efficiency of capital utilization and achieve sustainable economic and environmental development. Moreover, green finance is of great significance to rural revitalization and poverty alleviation. For example, green agricultural insurance, poverty alleviation development insurance products, green financial information disclosure systems, and green poverty alleviation performance systems can achieve stable and sustainable poverty alleviation [3]. With the promotion of rural revitalization as a national strategy, funds will be injected into rural revitalization-related green industries and ecological and environmental protection projects to promote rural revitalization and development by constructing rural green financial systems and innovating rural green financial products [4]. Thus, for the Yangtze River Delta, the government aims to use financial tools to accelerate the promotion of environmental governance and green development, to innovate in the construction of ecological civilization, and to enhance the level of regional ecological civilization construction; thus, the help of green finance is needed. Hence, it is of great significance to explore the characteristics of green finance development and its influencing factors to promote the development of green finance in the Yangtze River Delta.
Some scholars have focused on the theoretical framework, technology, and investment methods of green finance. Green finance, as an important innovative product of financial services, is an effective means to resolve the contradiction between environmental protection and economic development [5]. Paranque and Revelli incorporate finance into the operational framework based on theoretical choices and point out that, in terms of portfolio management, green credit cannot be managed like ordinary financial products, but should be part of social projects embedded in collective governance [6]. Ng reveals a top-down approach of institutional legitimacy for green financing influenced by a national policy and enhanced through market-based financing and proposes a framework of circumstantial developments that contribute to the development of a green finance system [7]. Sanderson finds that blockchain technology can track carbon savings by providing green loans to institutional bond markets [8]. Gianfrate and Peri hold that convenience, in terms of lower returns paid to investors, is approximately −0.2%, and green bonds remain convenient after accounting for green certification costs [9]. Reboredo and Ugolini study price connectedness between the green bond and financial markets, and green bonds are weakly connected with the stock, energy, and high-yield corporate bond markets [10].
Some researchers measure the development level and evaluation index of green finance. Zeng et al. attempted to construct a set of evaluation systems that are suitable for China’s green finance development by drawing lessons from the connotations, indicators, and methods of green finance development evaluation at home and abroad, and combining the characteristics of China’s green finance [1]. Li et al. measured the development level of green finance and the comprehensive level of the ecological environment in the three major economic circles [11]. Chen constructed a series of green finance development evaluation indexes for the Yangtze River Delta urban agglomeration by assembling construction system policies with market vitality and other indicators. Some researchers have explored the connection between green finance, industrial structure, economic development, and ecological environment [12]. Chai found that consumption and investment have a threshold effect on the pulling effect of green finance [13]. Zhang and Zhao studied the dynamic relationship between green credit, technology progress, and industrial structure optimization, based on the Panel Vector Autoregression model [14]. Zhai analyzed ecological advantages and the path selection of green finance development. Some researchers analyze the impact of green finance on the banking industry [15]. There is an inverted U-shaped relationship between green credit and bank performance [16]. Green credit has a stronger improvement effect on the financial performance of small-scale and higher-liquidity banks [17]. From the perspective of the cost-benefit effect path, green credit will weaken the profitability of small and medium-sized commercial banks but will enhance the profitability of large commercial banks [18].
At the same time, a large number of researchers focus on the analysis of the influencing factors of green finance. Taghizadeh-Hesary and Yoshino consider that the green credit guarantee scheme reduces the risk of green finance, distributed ledger technologies increase transparency in green finance, and green finance is directly and indirectly related to various sustainable development goals [19]. In an empirical analysis of Heilongjiang Province, Dong and Fu (2018) found that the degree of impact on the development of green finance is from regional GDP, carbon emissions, air quality, and the degree of financial development [20]. There are main factors that include regional GDP, the degree of financial development, air quality, and education, which affect the evolution of the spatial distribution of green finance development in Guangdong Province. These factors have obvious spatial spillover effects [21]. Government policies have a non-negligible impact on green finance. The debt financing capacity of heavily polluting enterprises has dropped significantly under the “Green Credit Guidelines” policy in China, which improved their standard of green credit financial services and strengthened the debt-supporting capacity of green credit [22]. Nationally Determined Contributions and other macroeconomic and institutional factors are driving growing green bond issuances that will finance climate and sustainability investments through the future [23]. Eyraud et al. analyzed that green investment is boosted by economic growth and found that some policy interventions, such as the introduction of carbon pricing schemes or “feed-in-tariffs”, have a positive and significant impact on green investment [24].
To summarize, at present, many studies are mainly qualitative research on green finance and do not reflect the influence of geographical location and spatial factors in the development process of green finance, lack a spatial connection and correlation analysis of green finance in neighboring cities, and lack an analysis of the spatial and temporal characteristics and influencing factors in the Yangtze River Delta. At the same time, some scholars explore the spatial adjustment of financial efficiency. Financial agglomeration could increase the amount of financial capital through external effects, promote the formation of economies of scale, improve urban green economic efficiency [25,26], and have a significant spatial spillover effect on green development efficiency [27].
Therefore, based on urban economic data from the “40 + 1” city clusters in the Yangtze River Delta from 2011 to 2017, this paper uses the spatial econometric method to explore the spatial and temporal evolution characteristics of green finance development in the Yangtze River Delta urban agglomeration, analyzes the geographical distribution and spatial correlation of green finance development in the Yangtze River Delta, delves into the impact of green finance factors and spillover effects, and proposes countermeasures to improve the level of green finance development in the Yangtze River Delta.

2. Method

2.1. Spatial Autocorrelation Analysis

In 1970, Tobler proposed Tobler’s First Law of Geography: Everything is related to everything else, but near things are more related to each other. Spatial econometrics studies the spatial effects of variables on geography. Spatial effects include spatial dependence and spatial heterogeneity.

2.1.1. Spatial Weight Matrix

The premise of spatial analysis is to measure the spatial distance between regions. Compared with the queen contiguity adjacent spatial weight matrix, the geographic distance spatial weight matrix can better reflect the spatial correlation between regions. This study adopted the spatial weight matrix W with the squared inverse distance as follows:
w i j = { o , i = j 1 ( d i j ) 2 , i j
  d i j   denotes the great-circle distance calculation based on the longitude and latitude of area i and area j .

2.1.2. Global Spatial Autocorrelation

When determining whether to use the spatial econometric model, we must first consider whether the data are spatially dependent. This study uses spatial autocorrelation analysis to study the degree of interdependence of green finance in the spatial location of prefecture-level cities in the Yangtze River Delta and builds on this spatial panel model. Spatial autocorrelation is usually measured by Moran’s I index and Geary’s C index. In this study, Moran’s I, which is more widely used, is used for spatial autocorrelation analysis. The formula for Moran’s I is as follows:
I = i = 1 n j = 1 n w i j ( x i x ¯ ) ( x j x ¯ ) S 2 i = 1 n j = 1 n w i j
  S 2 is the sample variance, Moran’s I   (−1,1). Moran’s I > 0 means positive autocorrelation, in which a high value is adjacent to a high value and a low value is adjacent to a low value; Moran’s I < 0 means negative autocorrelation, in which a high value is adjacent to a low value; Moran’s I = 0 means no spatial autocorrelation.

2.2. Spatial Durbin Model

Spatial panel models mainly include the spatial lag model, the spatial error model, and the spatial Durbin model. The spatial Durbin model contains both endogenous and exogenous variables with a spatial lag and has a wider application space than the spatial lag model and the spatial error model. The general spatial panel model is as follows:
{ y i t = τ y i , t 1 + ρ W i y t + x i t β + W i X i δ + u i + γ t + ε i t ε i t = λ W i ε t + v i t
  y i , t 1 denotes the first-order lag of the dependent variable   y i t   (if τ 0 , it is a dynamic panel; if τ = 0 , it is a static panel), ρ W i y t denotes the spatial lag term of the dependent variable, W i X i δ denotes the spatial lag term of the independent variable, W i denotes the i row of the spatial weight matrix W , W i y t = j = 1 n w i j y j t , w i j denotes the element of the spatial weight matrix W , ρ denotes the spatial autoregressive parameter, u i denotes the space fixed effect, γ t denotes the time fixed effect, and ε i t denotes the random error vector,   ε ~ N ( 0 , σ 2 Ι n ) .
The above model is a general spatial econometric model, so we usually consider special cases:
(1)
If λ = 0 , the model is a spatial Durbin model (SDM)
(2)
If λ = 0 ,   δ = 0 , the model is a spatial autoregression model (SAR)
(3)
If τ = ρ = 0 and δ = 0 , the model is a spatial error model (SEM)

2.3. Direct Effect and Indirect Effect

In the direct effect, the change in the independent variable x r i t in area i exerts an influence on the dependent variable y i t in area i :   y i t / x r i t ; it is defined as the total effect by which the change in the independent variable x r t in all areas exerts an influence on the dependent variable y i t in area i : j = 1 n ( y i t / x r i t ) . The indirect effect (spillover effect) captures the impact of the change in the independent variable x r t in other areas on the dependent variable y i t in area i : j = 1 n ( y i t / x r i t ) y i t / x r i t   .

2.4. Variable Selection and Data Source

2.4.1. Variable Selection

The independent and dependent variables used in the spatial Durbin model are shown in Table 1.
(1)
Development Level of Green Finance (DGF)
At present, green finance mainly includes green credit, green securities, green insurance, green investment, and carbon finance. The proportion of green credit in green finance is very high. Because there is no way to obtain complete and continuous data about green credit, green securities, and green insurance in prefecture-level cities, this study takes only substitutable indicators. Considering that green financial products are put on the market and are ultimately converted into sources of funds for enterprises, it can be measured from the perspective of the entity that is the investee of green financial resources [28]. At the same time, financial institutions usually invest more funds in better-qualified companies. This study uses the amount of loans for green-related listed companies in each city as the size of green credit.
As China has long lacked effective direct investment and financing channels, direct investment in the field of energy conservation and environmental protection is heavily dependent on public finance. Although the proportion of private investment has increased in recent years, public investment still accounts for a high proportion. Therefore, bringing public investment into the scope of green investment evaluation is in line with China’s actual situation, and it can more fully reflect the level of green investment development than excluding public investment [1].
This study measures the level of green finance development from the two indicators of green credit and green investment that is represented by government energy conservation and environmental protection expenditure. These indicators also illustrate the level of green finance development from the market and government levels. As the development of green finance relies mainly on markets to promote, referring to Xuewen Zeng’s research on measurements of green finance, this study uses 85% of green credit and 15% of government energy conservation and environmental protection expenditure to obtain the level of green finance development. The formula is as follows:
Green finance development level = green credit × 85% + government energy conservation and environmental protection expenditure × 15%.
(2)
Regional Innovation Level (INNO)
The existing literature mainly measures the level of technological progress from three perspectives: input method, output method, and total factor productivity. Total factor productivity needs data on local capital deposits but lacks statistics; most of the variables used in the output method include the number of patents and sales revenue of new products, but the number of patent grants has a time lag, and it is difficult to count the sales revenue of new products in the region. Therefore, this study selects the patent application volume of each city to represent the regional innovation level of each city.
(3)
Optimization of Industrial Structure (OIS)
Industrial structure optimization includes the rationalization of the industrial structure and advanced industrial structure. This study uses the optimization of the industrial structure from the perspective of the advanced industrial structure. Industrial structure optimization is measured by the ratio of the output value of the tertiary industry to the output value of the secondary industry [29].
(4)
Others
Degree of Financial Development (DFD: the ratio of year-end deposit balances of financial institutions to the year-end GDP; GDP: regional GDP is used to reflect the level of economic development in each city; Air Quality (AQ): measured by industrial sulfur dioxide emissions.

2.4.2. Data Source

The data selected in this study are from the panel data for the Yangtze River Delta from 2011 to 2017. Green credit data were collected from the Wind database. Companies with green-related concepts from all A-share markets, including environmental protection concepts, new energy, hydrogen energy, ethanol gasoline, new energy vehicles, waste power generation, sewage treatment, exhaust gas treatment, and other conceptual sections, were selected as the research sample. Relevant green companies were selected through screening of regional sections and conceptual sections. Green credit in each city was collected by counting the long-term and short-term loans and bonds issued by enterprises in various cities. The GDP, the year-end deposit balances of financial institutions, the output value of the secondary industry, the output value of the tertiary industry, and energy-saving and environmental protection expenditure data were collected from the statistical yearbooks of each city. The number of patent applications comes from municipal intellectual property and service centers, intellectual property offices, or statistical yearbooks.

3. Results Analysis

3.1. Global Spatial Autocorrelation of Green Finance Development

Based on the collected data of the green finance development level of the Yangtze River Delta and the geographic distance spatial weight matrix, the global Moran’s I index of the green finance development level of the Yangtze River Delta from 2011 to 2017 was calculated using Stata 15.0, as shown in Table 2.
According to Table 2, the Moran’s I index in the Yangtze River Delta from 2011 to 2017 is greater than 0. In 2011 and 2012, the Moran’s I index is significant at the 10% significance level. From 2013 to 2015, the Moran’s I index is significant at the 5% significance level.
These results show that there is a positive spatial autocorrelation in the green finance development level of the Yangtze River Delta urban agglomeration from 2011 to 2017, which means that cities with high green finance development levels are clustered together and cities with low green finance development levels are clustered together. Cities with similar levels of green finance tend to be concentrated. Thus, when analyzing the characteristics of green finance development in the Yangtze River Delta and its influencing factors, the influence of geographical factors and spatial effects cannot be ignored, and a spatial panel model needs to be constructed for research.

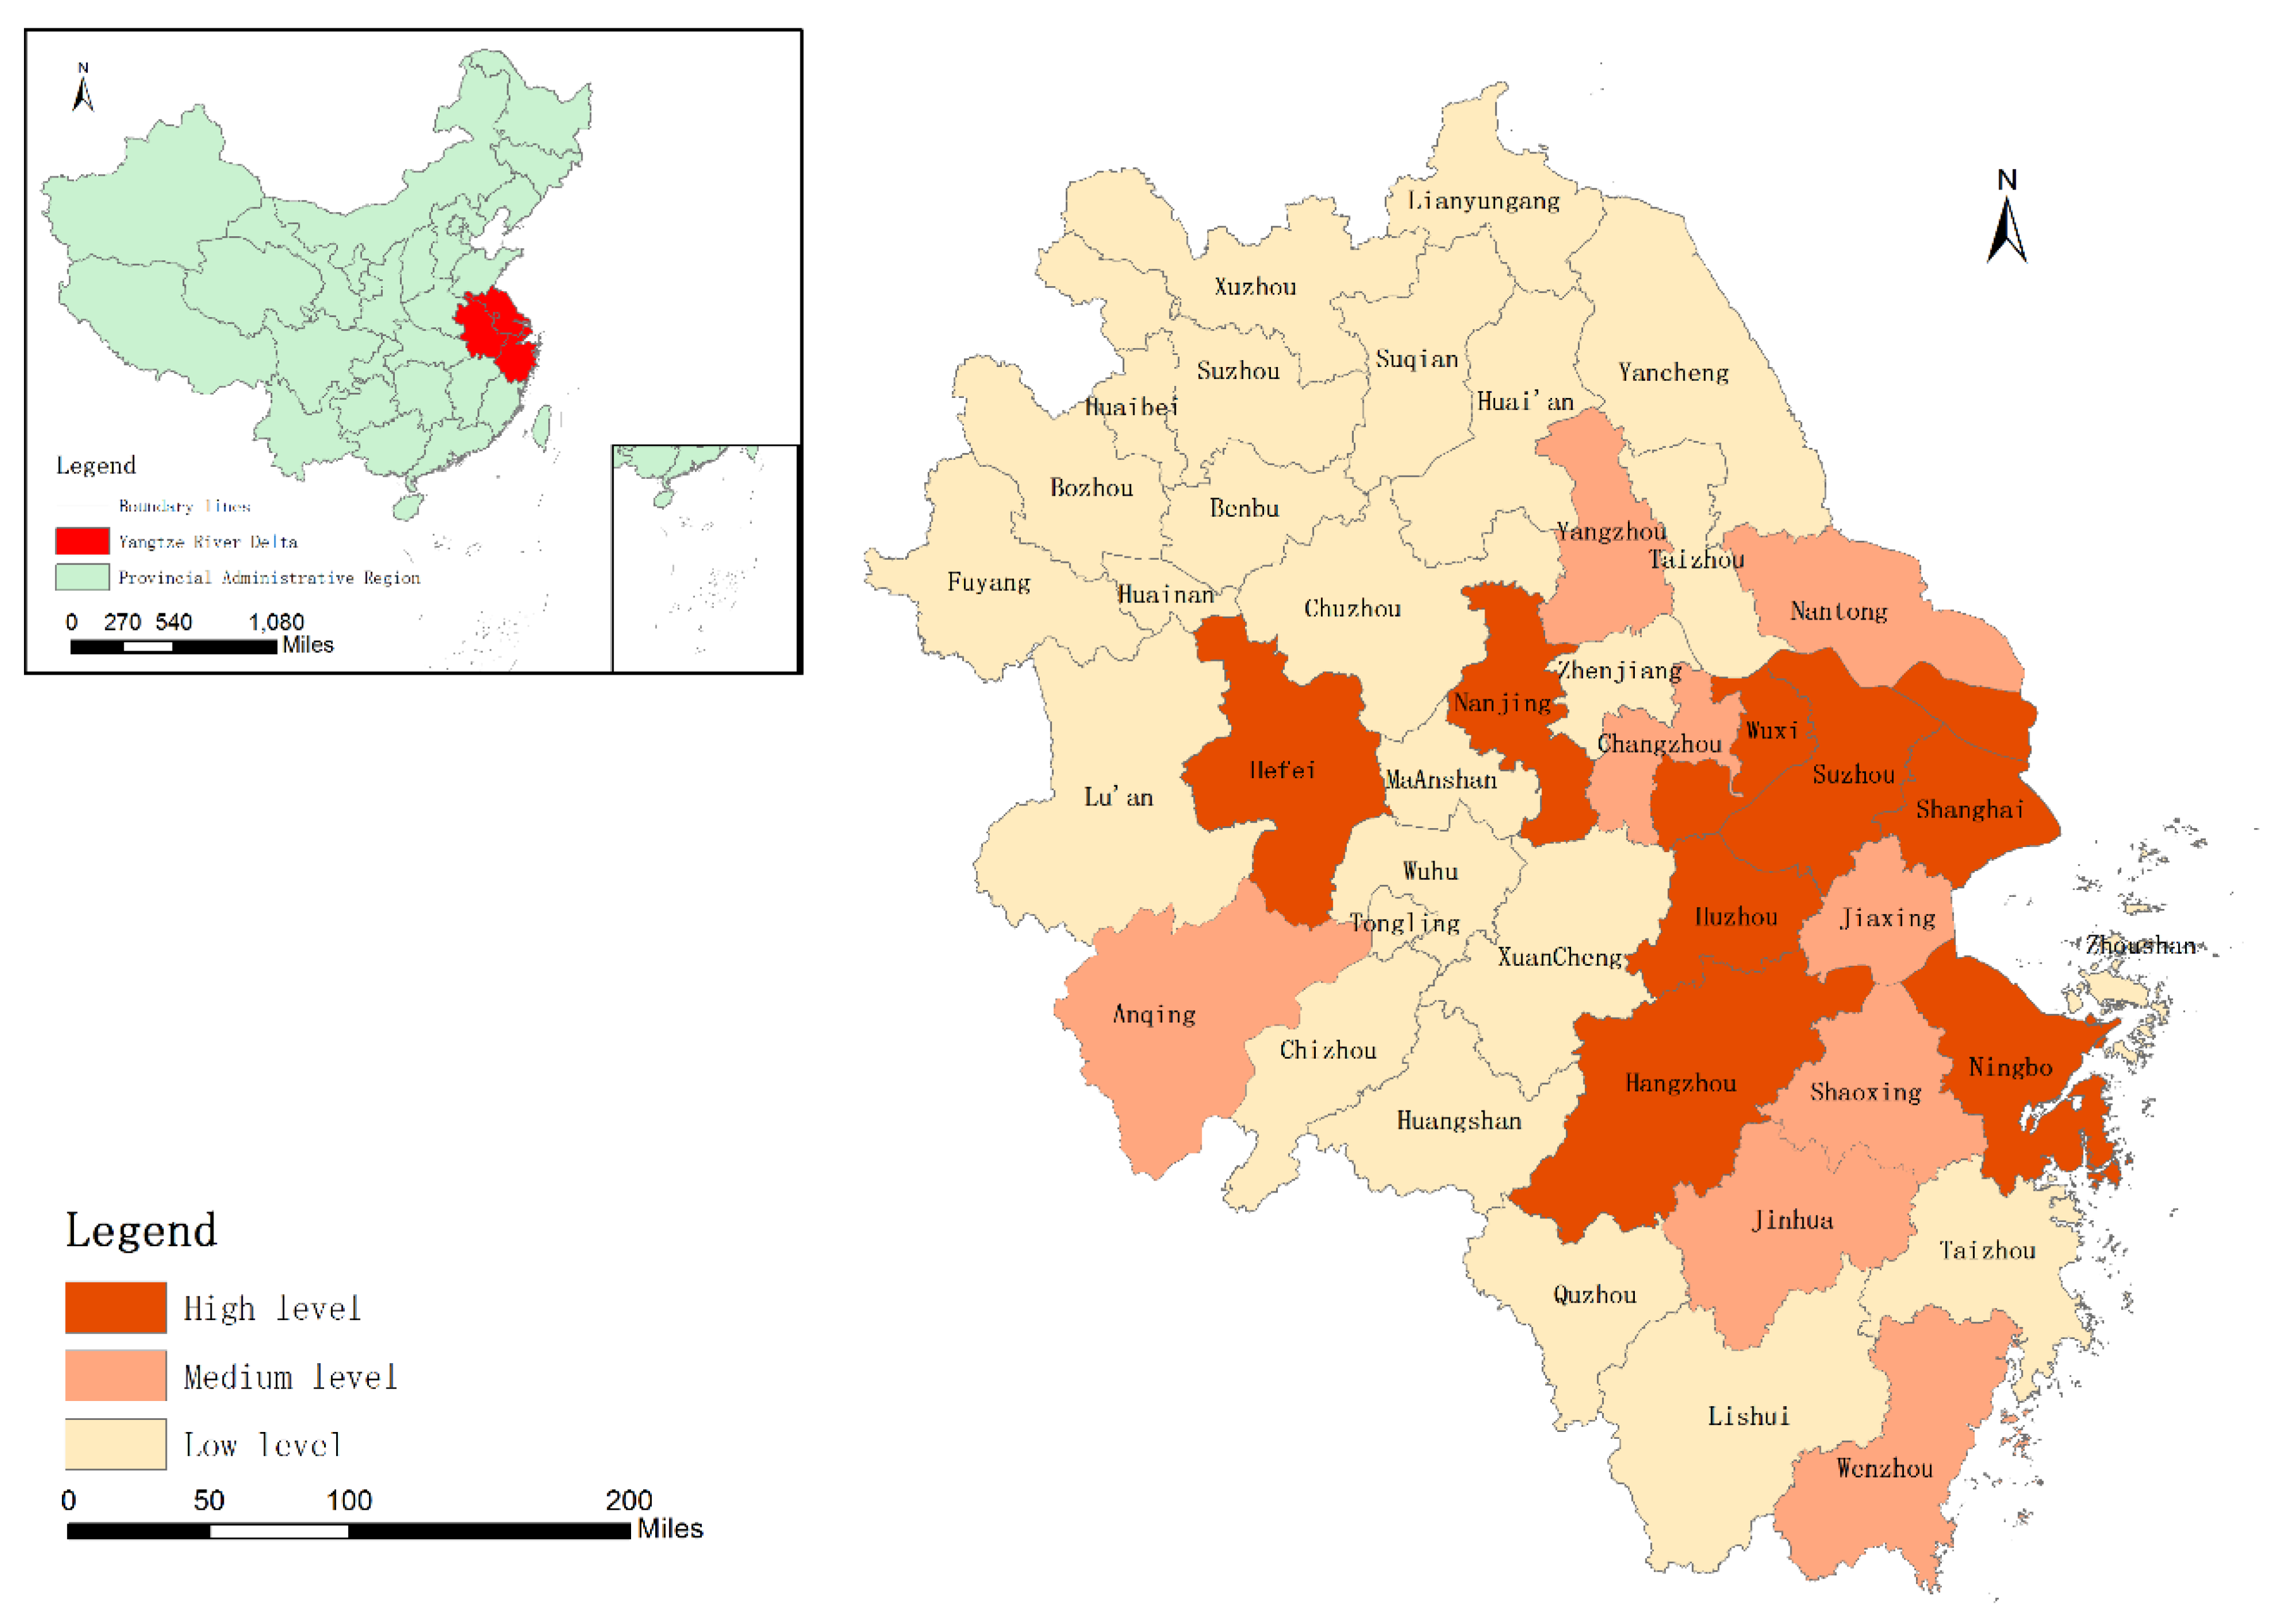
3.2. Spatial Distribution Characteristics of Green Finance Development

Based on data for the green finance development level of the Yangtze River Delta in 2017, the spatial distribution of the green finance development level of the Yangtze River Delta was plotted using ArcGIS software, as shown in Figure 1. The areas with high levels of green finance development are Shanghai, Hangzhou, Nanjing, Hefei, Suzhou, Wuxi, Huzhou, and Ningbo, which are concentrated mainly in Shanghai, northern Zhejiang, and southern Jiangsu. The level of green finance development in Zhejiang Province is generally high, and that in Anhui Province is generally low. The high-high cluster and low-low spatial cluster effects of green finance in the Yangtze River Delta region are relatively obvious.

3.3. Analysis of the Influencing Factors of Green Finance Development

3.3.1. Wald Test and the LR Test

The spatial Durbin model considers that there may be endogenous interaction effects, exogenous interaction effects, and autocorrelation of error terms between variables [30]. To include the hysteresis of the two models and to avoid residual error autocorrelation affecting the results, this study chooses a more general spatial Durbin model for empirical analysis. The results of the Wald test and the LR (likelihood ratio) test both reject the null hypothesis that the spatial Durbin model was reduced to the spatial lag model and spatial error model at the 1% significance level (see Table 3).

3.3.2. Model Specification

There is a spatial correlation between the levels of green finance development of cities in the Yangtze River Delta urban agglomeration. This study uses geographical distance to define a spatial weight matrix and constructs a spatial Durbin model. It studies mainly the impact of GDP, DFD, INNO, ISO, and AQ on the level of green financial development in the Yangtze River Delta urban agglomeration and studies the spatial effect of the independent variables and dependent variables. The spatial Durbin model is modeled as follows:
D G F i t = ρ j = 1 n w i j D G F j t + α 1 G D P i t + α 2 D F D i t + α 3 O I S i t + α 4 I N N O i t + α 5 A Q i t                                + δ 1 j = 1 n w i j G D P j t + δ 2 j = 1 n w i j D F D j t + δ 3 j = 1 n w i j O I S j t                                + δ 4 j = 1 n w i j I N N O j t + δ 5 j = 1 n w i j A Q j t + u i + γ t + v i t
  α 1 , α 2 , α 3   and α 4 are the parameters to be estimated, and ρ is the spatial autoregressive parameter.

3.3.3. Regression Results of the Spatial Durbin Model

The spatial Hausman test statistics show that the fixed effects spatial Durbin model should be used. The spatial autoregressive parameter of the spatial fixed effects Durbin model was not significant. Compared with the spatial fixed effects model and spatial and time fixed effects model, the R2 of the time fixed effects Durbin model is larger. The significance level of each independent variable and spatial lag term is more significant. Thus, the time fixed effects spatial Durbin model is more persuasive. Therefore, in this study, the time fixed effects spatial Durbin model was used for empirical analysis and discussion.
As seen from Column 2 in Table 4, in the time fixed effects SDM model, the spatial autoregressive parameter ρ is significantly negative, indicating that the level of green financial development in the Yangtze River Delta has a significant negative spatial dependence and spatial cluster effect.
The coefficient of GDP (Column 2, Line 1) is significantly positive at the significance level of 1%, indicating that GDP is significantly positively correlated with the development of green finance.
The coefficient of DFD is positive but insignificant. The coefficient of W × DFD (Column 2, Line 2) is significantly positive at the significance level of 5%, indicating that the DFD of adjacent cities is significantly positively associated with a city’s green finance development. This is because the development of financial markets in the Yangtze River Delta has a spillover effect; Shanghai is the financial center, and it connects Hangzhou and Nanjing and radiates to other areas of the Yangtze River Delta urban agglomeration.
The coefficient of OIS is negative but insignificant. Most companies in the Yangtze River Delta, such as environmental protection, new energy, waste power generation, and sewage treatment companies, still belong to the industrial secondary industry. As the secondary industry moves toward the tertiary industry, labor and capital flow largely into the tertiary industry, which has nothing to do with green energy conservation and environmental protection. Thus, it cannot fully effectively promote the development of green enterprises or the development of green finance. The coefficient of W × OIS is significantly negative at the 1% level, indicating that the OIS of adjacent cities is significantly negatively associated with a city’s development of green finance. This occurs mainly because areas with a more optimized industrial structure in southern Jiangsu, Shanghai, and northern Zhejiang have transferred high-polluting and energy-consuming enterprises to Anhui, northern Jiangsu, and southern Zhejiang in the process of optimizing their industrial structure, inhibiting the development of green finance in surrounding cities.
The coefficient of INNO is significantly negative at the significance level of 1%, indicating that the INNO is significantly negatively correlated with the development of green finance. The coefficient of INNO is negative, the direct effect coefficient of INNO is negative (Column 2, Line 4 in Table 5), and the indirect effect coefficient of INNO (Column 2, Line 9 in Table 5) is positive in the time fixed effects Durbin model. However, when considering individual effects, some R&D agglomerations (such as Shanghai, Suzhou, Nanjing, etc.) have high and stable INNO and also have a high level of green finance development. Therefore, the coefficient of INNO is positive, the direct effect coefficient of INNO (Column 3, Line 4 in Table 5) is positive, and the indirect effect coefficient of INNO (Column 3, Line 9 in Table 5) is negative in the spatial and time fixed effects Durbin model.
The coefficient of AQ is significantly negative at the significance level of 1%, indicating that the AQ is significantly negatively correlated with the development of green finance. At present, cities with poor environmental levels are mainly resource-consuming cities and heavy industry-based cities. The green financial system of these cities is not sufficiently systematic. These cities lack the capital and environment to develop green finance. Therefore, green finance development is at a low level. The coefficient of W × AQ is insignificant, indicating that surrounding cities’ air quality does not play a significant role in the local development of green finance in the Yangtze River Delta.

3.3.4. Direct Effects and Indirect Effects

Because the spatial lag dependent variable and spatial lag independent variable are included in the spatial Durbin model, the marginal effects cannot be directly reflected, and it is difficult to accurately measure the direct impact of the independent variable on the dependent variable with its estimated value [31]. Therefore, the partial differential of the spatial Durbin model is used to calculate the direct and indirect effects of the impact of each independent variable on green finance development in the Yangtze River Delta (Table 5). The direct effect shows the influence of the independent variable on green finance development in the region. The indirect effect shows the influence of the independent variable in other regions on green finance development in the region, that is, the spatial spillover effect.
(1)
Direct effects: As shown in Table 5, the direct effects coefficients of GDP (Column 2, Line 1), INNO, and AQ are significant at the significance level of 1%. The coefficient of the direct effects of the GDP is significantly positive. The coefficients of the direct effects of the INNO and AQ are significantly negative. The direct effect coefficient of INNO is significant at a significance level of 1%, while the indirect effect is not significant. By comparing the absolute value of the direct effect coefficient and the indirect effect coefficient, it is found that the GDP, INNO, and AQ are associated with the development level of green finance mainly through the direct effect.
(2)
Indirect effects (spillover effect): The indirect effects coefficients of GDP (Column 2, Line 6), DFD, OIS, and INNO are significant at the significance level of 10%. The indirect effect coefficients of DFD and INNO are significantly positive, indicating that the DFD and INNO have positive spatial spillover effects and that the DFD and INNO in neighboring cities will be positively associated with a city’s green finance development. The indirect effect coefficient of OIS is significantly negative, indicating that the OIS has a negative spatial spillover effect. The OIS in neighboring cities will be negatively associated with the improvement of the city’s green finance development level. Likewise, this result shows that the DFD and OIS mainly are associated with green finance development through the spillover effect.
The direct effect coefficients of GDP, DFD, OIS, INNO, and AQ are different from the regression coefficients of the time fixed effects spatial Durbin model because there is a feedback effect on the development of green finance in the Yangtze River Delta. Through the feedback effect, the development of green finance in local cities will affect the development of green finance in adjacent cities, and the development of green finance in adjacent cities will then affect the development of green finance in local cities. This feedback effect mainly comes from the comprehensive interaction effect of the spatial lag variables (W × GDP, W × DFD, W × AQ, W × OIS, W × INNO) and spatial dependent variables (W × DGF) [32].

3.4. Robustness Test

In this paper, the robustness test was performed by changing the spatial weight matrix. The distance weight matrix in the previous model was replaced with the adjacent spatial weight matrix of the queen for regression. The regression results are shown in Table 6.
By comparing the regression results of different spatial weights, it is found that the result of independent variable coefficients, the significance level of the direct and indirect effect coefficients, the sign direction in Table 6, and the results of the geographical weights are basically consistent. This indicates that the model and regression results are robust.

4. Conclusions and Suggestions

4.1. Conclusions

By modeling a spatial Durbin model, this study constructs a spatial econometric model for data on the Yangtze River Delta urban agglomeration from 2011 to 2017, studies the influencing factors affecting green finance development, and draws the following conclusions:
(1)
The development of green finance in the Yangtze River Delta has a clear spatial cluster effect, and there are large regional differences. High levels of green finance development are generally distributed in urban agglomerations, including Shanghai, northern Zhejiang, and southern Jiangsu. The level of green finance development in Zhejiang Province is generally high, and the level of green finance development in Anhui Province is generally low.
(2)
The GDP, INNO, and AQ are the most important influencing factors, and the DFD and OIS are not significant.
(3)
The GDP is positively correlated with the development of green finance. The INNO and AQ are negatively correlated with the development of green finance.
(4)
The GDP, INNO, and AQ are associated with the development level of green finance mainly through direct effects. The DFD and OIS are associated with the development level of green finance mainly through spillover effects. Particularly, the DFD has a positive spillover effect, and in contrast, the OIS has a negative spillover effect. The direct effects of the DFD and OIS are not significant.

4.2. Suggestions

Based on the abovementioned findings, the following important and constructive suggestions are proposed:
(1)
With the construction of the Shanghai International Financial Center as the starting point, the construction of a green financial core circle in the Yangtze River Delta should be promoted [12]. Forming a green financial capital service center and driving the development of green finance in surrounding urban agglomerations through these leading cities will gradually transform the spatial cluster effect of green finance into a spatial spillover effect, thereby providing capital services for the development of green finance in cities in the Yangtze River Delta.
(2)
The green finance development system should be improved, and the development of green finance should be accelerated. In the Yangtze River Delta region, green finance accounts for a small percentage of financial development in Anhui Province, northern Jiangsu, and southern Zhejiang. The green financial system is not perfect, and green finance began late. Therefore, regions with higher levels of green finance development, such as Shanghai, southern Jiangsu, and northern Zhejiang, need to play a role in the spatial spillover effect of financial development on green finance, continually integrate the development of green finance and the development of the Yangtze River Delta, and have a positive interaction to jointly promote green development.
(3)
The level of urban openness should be expanded, economic development should be accelerated, and the coordinated development of the economy and green finance should be promoted. The level of economic development is a major factor in the imbalance in green finance development, but the spatial spillover effect of the level of economic development in the Yangtze River Delta on green finance is insignificant. It is no longer sufficient to increase the level of openness and economic development of the 26 urban areas in the Yangtze River Delta. It is also necessary to improve the level of openness and economic development of the “40 + 1” urban agglomeration in the Yangtze River Delta to encourage the spatial spillover effects of economic development on green finance.
(4)
The economic structure should be adjusted, the development mode should be changed, and environmental protection industries, including environmental protection manufacturing and service industries, should be vigorously cultivated and developed. During the gradual development of green industry, the liquidity of green funds is enhanced, and then green economic effectiveness is improved. In the past, in the process of optimizing the industrial structure in the Yangtze River Delta, the proportion that the secondary industry transferred to the tertiary industry was considered, and the transferred secondary industry and the development of the tertiary industry were not considered much. In the process of optimizing the industrial structure, we must not only suppress investment in high-energy consumption and high-pollution industries but also vigorously develop industries such as environmental protection and clean energy and solve the problem of difficult financing for environmental protection enterprises. It is necessary not only to increase the proportion of the tertiary industry but also to vigorously develop tertiary industries such as finance, insurance, transportation, tourism, and education services related to environmental protection.
(5)
Research and investment in green technology should be increased, green development should be promoted with green technology, and green finance should be promoted through green development. A market-oriented green technology innovation system should be established. The proportion of green technology in technological innovation and the investment and financing of green technologies should be increased, striving to solve barriers, such as high technological costs, insufficient funds, and limited information on green enterprises. Finally, the conversion of green technologies into production technologies should be accelerated, and the development of green industries, such as energy-saving and environmental protection industries, clean production industries, and clean energy industries, should be expanded.
(6)
The government should provide financial incentives for green companies. The government gives cash rewards to green companies based on the quality and quantity of green technology innovation. The government provides price subsidies during the promotion of green technologies by enterprises. The government formulates corresponding tax reduction measures based on the emission reduction scale of green enterprises or the output of green products.

Author Contributions

H.X., Z.O., and Y.C. conceptualized the research and performed the validation. H.X. and Y.C. administered the project, developed the methodology. Z.O. curated the data, conducted the formal analysis, produced visualizations, and wrote and prepared the original draft manuscript. Z.O. and H.X. reviewed and edited the manuscript. All the authors contributed to drafting the manuscript and approved the final version of the manuscript. All authors have read and agreed to the published version of the manuscript.

Funding

This research was funded by the 15th Student Research Project of Jiangxi University of Finance and Economics (No: 20200613132415625).

Conflicts of Interest

The authors declare no conflict of interest.

References

  1. Zeng, X.W.; Liu, Y.Q.; Man, M.J.; Shen, Q.L. Measurement analysis of China’s green finance development. J. China Exec. Leadersh. Acad. Yan’an 2014, 7, 112–121+105. [Google Scholar]
  2. Wang, Y.; Pan, D.Y.; Zhang, X. Research on green finance’s contribution to China’s economic development. Comp. Econ. Soc. Syst. 2016, 6, 33–42. [Google Scholar]
  3. Ren, J. The internal connection and method of coordinated development between green finance and poverty alleviation. Environ. Prot. 2019, 47, 47–49. [Google Scholar]
  4. Wang, B.; Zheng, L.S. Research on the mechanism path of green finance supporting rural rejuvenation. J. Tech. Econ. Manag. 2019, 11, 84–88. [Google Scholar]
  5. Labatt, S.; White, R.R. Environmental Finance: A Guide to Environmental Risk Assessment and Financial Products; John Wiley and Sons: Hoboken, NJ, USA, 2002. [Google Scholar]
  6. Paranque, B.; Revelli, C. Ethico-economic Analysis of Impact Finance: The Case of Green Bonds. Res. Int. Bus. Financ. 2019, 47, 57–66. [Google Scholar]
  7. Ng, A.W. From sustainability accounting to a green financing system: Institutional legitimacy and market heterogeneity in a global financial centre. J. Clean. Prod. 2018, 195, 585–592. [Google Scholar]
  8. Sanderson, O. Chapter 20—How to trust green bonds: Blockchain, climate, and the institutional bond markets. In Transforming Climate Finance and Green Investment with Blockchains; Marke, A., Ed.; Academic Press: Cambridge, MA, USA, 2018. [Google Scholar]
  9. Gianfrate, G.; Peri, M. The green advantage: Exploring the convenience of issuing green bonds. J. Clean. Prod. 2019, 219, 127–135. [Google Scholar]
  10. Reboredo, J.C.; Ugolini, A. Price connectedness between green bond and financial markets. Econ. Model. 2020, 88, 25–38. [Google Scholar]
  11. Li, H.; Yuan, Y.C.; Wang, N. Evaluation of coordinated coupling of regional green finance and ecological environment. Stat. Decis. 2019, 35, 161–164. [Google Scholar]
  12. Chen, S.Y. Green finance boosts the integrated development of the Yangtze River delta. J. Environ. Econ. 2019, 4, 1–7. [Google Scholar]
  13. Chai, J.X. Analysis on the mechanism and path of green finance affecting macroeconomic growth. Ecol. Econ. 2018, 34, 56–60. [Google Scholar]
  14. Zhang, Y.H.; Zhao, J.H. Green credit, technological progress and optimization of industrial structure: An empirical analysis based on pvar model. J. Financ. Econ. 2019, 43–48. [Google Scholar] [CrossRef]
  15. Zhai, S.; Yin, Y.F.; Qian, C.F. Ecological advantages and mode selection of green finance development: Taking Huzhou as an example. Ecol. Econ. 2019, 35, 56–59+130. [Google Scholar]
  16. Zhang, C.; Dong, X.J. The dynamic impact of green credit on bank performance: The regulating effect on internet finance. Financ. Econ. Res. 2018, 33, 56–66. [Google Scholar]
  17. Zhang, L.; Lian, Y.H. Green credit, bank heterogeneity and bank financial performance. Financ. Regul. Res. 2019, 2, 43–61. [Google Scholar]
  18. Guo, W.W.; Liu, Y.D. Green credit, cost-benefit effect and commercial bank profitability. South China Financ. 2019, 9, 40–50. [Google Scholar]
  19. Taghizadeh-Hesary, F.; Yoshino, N. The way to induce private participation in green finance and investment. Financ. Res. Lett. 2019, 31, 98–103. [Google Scholar]
  20. Dong, X.H.; Fu, Y. Time-space dimension analysis of green finance development and influencing factors. Stat. Decis. 2018, 34, 94–98. [Google Scholar]
  21. Yu, F.J.; Xu, F. Development and influencing factors of green finance in Guangdong province from the perspective of space: An empirical study based on fixed effect spatial durbin model. Sci. Technol. Manag. Res. 2019, 39, 63–70. [Google Scholar]
  22. Liu, X.H.; Wang, E.X.; Cai, D.T. Green credit policy, property rights and debt financing: Quasi-natural experimental evidence from China. Financ. Res. Lett. 2019, 29, 129–135. [Google Scholar]
  23. Tolliver, C.; Keeley, A.R.; Managi, S. Drivers of green bond market growth: The importance of nationally determined contributions to the Paris agreement and implications for sustainability. J. Clean. Prod. 2020, 244, 118643. [Google Scholar]
  24. Eyraud, L.; Clements, B.; Wane, A. Green investment: Trends and determinants. Energy Policy 2013, 60, 852–865. [Google Scholar]
  25. Shi, B.Z.; Xu, N.; Liu, M.; Deng, M. Impacts and channels of financial agglomeration on green economic efficiency of city: Empirical analysis on 249 cities at level of municipality or above. Tech. Econ. 2018, 37, 87–95. [Google Scholar]
  26. Zhang, Z.Y.; Li, T.; Ma, Q. Analysis of the threshold effect of financial agglomeration on urban green economic efficiency: Based on the statistical data of nine national central cities in my country. J. Technoecon. Manag. 2020, 284, 98–102. [Google Scholar]
  27. Yuan, H.X.; Liu, Y.B.; Feng, Y.D. How does financial agglomeration affect the efficiency of green development?—Empirical analysis of SPDM and PTR models based on dual fixed time and space. Chin. J. Manag. Sci. 2019, 27, 61–75. [Google Scholar]
  28. Zhang, L.L.; Xiao, L.M.; Gao, J.F. Measurement and comparison of China’s green finance development level and efficiency—Based on micro-data of 1040 public companies. Forum Sci. Technol. China 2018, 9, 100–112,120. [Google Scholar]
  29. Han, C.H.; Zheng, R.G.; Yu, D.F. The impact of China’s industrial structure changes on economic growth and fluctuations. Econ. Res. J. 2011, 5, 4–16. [Google Scholar]
  30. Elhorst, J.P. Specification and estimation of spatial panel data models. Int. Reg. Sci. Rev. 2003, 26, 244–268. [Google Scholar]
  31. Lesage, J.; Pace, R.K. Introduction to Spatial Econometrics; Informa UK Limited: London, UK, 2009. [Google Scholar]
  32. Cheng, Y.Q.; Wang, Z.Y.; Zhang, S.Z.; Ye, X.Y.; Jiang, H.M. Spatial econometric modelling of carbon emission intensity of China’s energy consumption and its influencing factors. Acta Geogr. Sin. 2013, 68, 1418–1431. [Google Scholar]
Figure 1. Spatial distribution of green finance development in the Yangtze River Delta urban agglomeration.
Sustainability 12 09753 g001
Table 1. Variable name table.
Aggregate NameVariable NameVariable Symbol
Dependent variableDevelopment level of green financeDGF
Regional GDPGDP
Degree of financial developmentDFD
Independent variableOptimization of industrial structureOIS
Regional innovation levelINNO
Air qualityAQ
Table 2. The global Moran’s I of the green finance development level from 2011 to 2017.
YearMoran’s IE(I)sd(I)Zp-Value *
20110.019 *−0.0250.0261.6960.090
20120.040 *−0.0250.0341.9180.055
20130.058 **−0.0250.0372.2180.027
20140.073 **−0.0250.0402.4260.015
20150.062 **−0.0250.0432.0090.045
20160.030−0.0250.0351.5600.119
20170.033−0.0250.0411.4080.159
* p < 0.1, ** p < 0.05
Table 3. Wald test and LR test.
Wald TestLR Test
Wald(lag)39.05 ***LR(lag)37.18 ***
Wald(error)37.8 ***LR(error)52.56 ***
*** p < 0.01.
Table 4. Regression results of the spatial Durbin model.
VariableSpatial Fixed Effects (Column 1)Time Fixed Effects (Column 2)Spatial and Time Fixed Effects (Column 3)
GDP0.0140 ***0.0158 ***0.0142 ***
(0.002)(0.003)(0.002)
DFD1.1560.6741.446
(1.058)(0.729)(1.093)
OIS1.128−0.951.348 *
(0.716)(0.743)(0.706)
INNO0.0378 **−0.0882 ***0.0395 **
(0.019)(0.019)(0.018)
AQ−0.0071−0.0289 ***−0.0079
(0.008)(0.009)(0.008)
W × GDP−0.00260.00240.004
(0.005)(0.004)(0.009)
W × DFD0.6714.456 **4.779 **
(1.894)(1.877)(2.282)
W × OIS−3.492 *−7.031 ***0.37
(2.036)(2.681)(3.523)
W × INNO−0.0873 ***0.0461−0.0615
(0.029)(0.032)(0.040)
W × AQ−0.0121−0.0092−0.0216
(0.021)(0.016)(0.035)
  ρ   −0.144−0.78 ***−0.365 ***
R20.7390.8680.747
Standard errors in parentheses. * p < 0.1, ** p < 0.05, *** p < 0.01.
Table 5. Direct effects and indirect effects.
VariableSpatial Fixed Effects (Column 1)Time Fixed Effects (Column 2)Spatial and Time Fixed Effects (Column 3)
GDP0.0141 ***0.0165 ***0.0143 ***
(0.002)(0.003)(0.002)
DFD1.0840.4021.272
(1.067)(0.846)(1.124)
Direct effectsOIS1.245 *−0.4971.419 **
(0.689)(0.817)(0.672)
INNO0.0395 **−0.0956 ***0.0422 **
(0.019)(0.021)(0.018)
AQ−0.0067−0.0299 ***−0.0072
(0.008)(0.009)(0.007)
GDP−0.0039−0.0063 **−0.0007
(0.005)(0.003)(0.007)
DFD0.4942.486 *3.344 *
(1.699)(1.483)(1.956)
Indirect effectsOIS−3.269 *−4.041 **−0.111
(1.669)(1.644)(2.62)
INNO−0.0813 **0.0724 ***−0.057 *
(0.025)(0.021)(0.031)
AQ−0.00870.0082−0.0126
(0.018)(0.011)(0.026)
GDP0.0102 ***0.0103 ***0.0136 **
(0.004)(0.002)(0.006)
DFD1.5792.888 ***4.616 **
(1.274)(0.851)(1.892)
Total effectsOIS−2.023−4.538 ***−2.773
(1.643)(1.33)(2.384)
INNO−0.0419 **−0.0232−0.0148
(0.019)(0.023)(0.031)
AQ−0.0154−0.0217−0.0198
(0.02)(0.01)(0.029)
Standard errors in parentheses. * p < 0.1, ** p < 0.05, *** p < 0.01.
Table 6. Regression results of the spatial Durbin model with queen contiguity spatial weight matrix.
VariableSpatial Fixed-Effects
(Column 1)
Time Fixed-Effects
(Column 2)
Spatial and Time-Effects
(Column 3)
GDP0.0140 ***0.0160 ***0.0143 ***
(0.002)(0.003)(0.002)
DFD0.8620.6381.424
(1.045)(0.719)(1.101)
OIS0.38−1.3891.296 *
(0.733)(0.805)(0.729)
INNO0.0350 **−0.0924 ***0.0380 **
(0.018)(0.019)(0.019)
AQ−0.0068−0.0276 ***−0.0276 ***
(0.01)(0.01)(0.007)
GDP0.0141 ***0.0164 ***0.0145 ***
(0.002)(0.003)(0.002)
DFD0.8110.5191.304
(1.022)(0.779)(1.119)
Direct effectsOIS0.401−1.1121.331 *
(0.718)(0.798)(0.698)
INNO0.0344 **−0.0970 ***0.0391 **
(0.017)(0.021)(0.018)
AQ−0.00658−0.0284 ***−0.00729
(0.01)(0.01)(0.007)
GDP−0.00279−0.00372 **−0.00291
(0.004)(0.002)(0.003)
DFD0.2891.1622.093
(1.187)(0.961)(1.356)
Indirect effectsOIS−2.625−2.836 **0.899
(1.721)(1.278)(1.48)
INNO−0.0518 ***0.0509 **−0.0253
(0.018)(0.021)(0.022)
AQ−0.00550.0076−0.0153
(0.014)(0.009)(0.013)
GDP0.0113 ***0.0126 ***0.0116 ***
(0.003)(0.002)(0.003)
DFD1.11.681 ***3.397 ***
(1.101)(0.542)(1.123)
Total effectsOIS−2.224−3.949 ***2.23
(2.052)(1.063)(1.836)
INNO−0.0175−0.0461 **0.0138
(0.022)(0.023)(0.031)
AQ−0.0121−0.0207 *−0.0226
(0.019)(0.011)(0.016)
  ρ   0.0828−0.278 ***−0.124 **
R2 0.7140.870.727
Standard errors in parentheses. * p < 0.1, ** p < 0.05, *** p < 0.01.
Publisher’s Note: MDPI stays neutral with regard to jurisdictional claims in published maps and institutional affiliations.

