1. Introduction
Depopulation and rural–urban inequalities are determining the course of public decisions. Local, provincial or regional administrations have been trying to implement measures and initiatives such as rural hubs [
1], and to respond to another of the demands that is most notably unsatisfied. The digital divide has gained significant interest in recent times [
2] caused by a change in social dynamics worldwide. The increase in digital tools in all sectors (health, education, work, administration, etc.) has once again highlighted territorial inequalities.
This research starts from a context, long before the current health crisis caused by Covid-19, in which new communication technologies are seen as an opportunity to promote the relocation of activities from urban areas. Aspects such as the pollution and a better quality of life suppose, in certain cases, a revaluation of the activities in peri-urban and rural areas. Additionally, the growing digital gap in many rural areas with respect to urban ones constitutes an imbalance factor that counteracts these advantages, contributing, on the one hand, to limit possible telecommuting; on the other hand, to limit attractiveness as secondary residences or leisure spaces; and, finally, this growing digital divide is becoming a social divide as well, while access to sufficient internet services is considered a basic right (as the UN itself declared in 2016).
The health crisis caused by Covid-19 has highlighted that rural areas are also areas of opportunity, and that public administrations must make all possible efforts to reduce the digital divide, in line with the recent European Union Digitalisation Plan [
3].
From UDERVAL research group, within the framework of the ROBUST H2020 project, and together with the Federation of Municipalities and Provinces of Valencia region (Spain), we developed research that reaches all of the rural municipalities of the Valencia Region. It is intended to go beyond the data provided by the private companies, and to ascertain the real situation in which our towns and villages find themselves in aspects such as the availability of internet services and the degree of satisfaction of their inhabitants, the economic sectors that are being affected most negatively, the degree of digital transformation in which the municipalities are located, and the actions that would be necessary in order to improve services and contribute to a significant reduction of the digital divide, thereby improving the positioning of rural spaces as opportunities in the post-Covid-19 era.
2. Depopulation Process
Many rural areas in Europe are experiencing population decline and aging [
4,
5]. Without local services and gainful employment opportunities, people leave smaller villages for urban centres, which, in turn, creates a vicious cycle of disinvestment and disconnection in rural communities [
6]. There are smaller and remote municipalities that are directly condemned to disappearance. Main factors such as distance and low population density are producing socioeconomic differences [
4], and do not allow an integration in welfare conditions (e.g., in the accessibility of public services and resources).
SPON 2020 (published in May 2018) makes clear the migratory processes in Europe, and finds depopulation in Baltic States, Germany, and Southern/Mediterranean countries like Greece, Portugal, Bulgaria, Romania, large parts of Spain, and some areas in the South of Italy. This is demonstrated in the ROBUST H2020 project, which evidences—by well-practiced examples—that most rural areas in Europe are experiencing inequalities with urban ones. Depending on the territorial context, countries face problems in rural areas; for example, some of them give more importance to cultural aspects or sustainable food systems, whereas others give more importance to the development of public infrastructures and social services.
Rural depopulation in Europe appeared after the Second World War, in a period of widespread economic growth. This is how a trend towards urbanization took place, with a fall in the rural population from 175 million in 1950 to 150 million today [
7]. In Spain, depopulation is one of the most important demographic challenges facing current Spanish society, with a good part of rural areas being characterized by negative balances, both vegetative and migratory. As Prof. Javier Esparcia has already announced, “depopulation in a large part of Spanish rural areas is a probably irreversible phenomenon” [
8]. The decline in the rural population has been around 40% in the second half of the 20th century, and has been very notable in almost all regions, although it meant more than 50% in the inland [
9]. Moreover, migratory movements had consequences in demographic terms, affecting those with uncertain jobs, mainly young people and women. The crisis into which this system has been plunged for several decades is linked to aspects such as the crisis of the traditional agricultural system itself, as well as, in general, to social and mind-set changes: the so-called social modernisation (refering to the intense changes that took place in Spanish society between the 60s and 80s of the last century). Migrations grew more infrequent with the 1970s energy crisis, which meant a reconversion of the sectors and unemployment in urban areas.
However, if there is a variable that is directly related to the rural depopulation and the low density of settlements, it is the technological revolution, especially in the means and transport systems [
10]. Indeed, the strong mismatch between a settlement system inherited from the Middle Ages, adapted to the technology and needs of the moment, and a technological system—especially transport and communication infrastructures—from the 20th–21st centuries explains not only that this it has intensified but also that it is sure to be irreversible for many of the smaller rural communities.
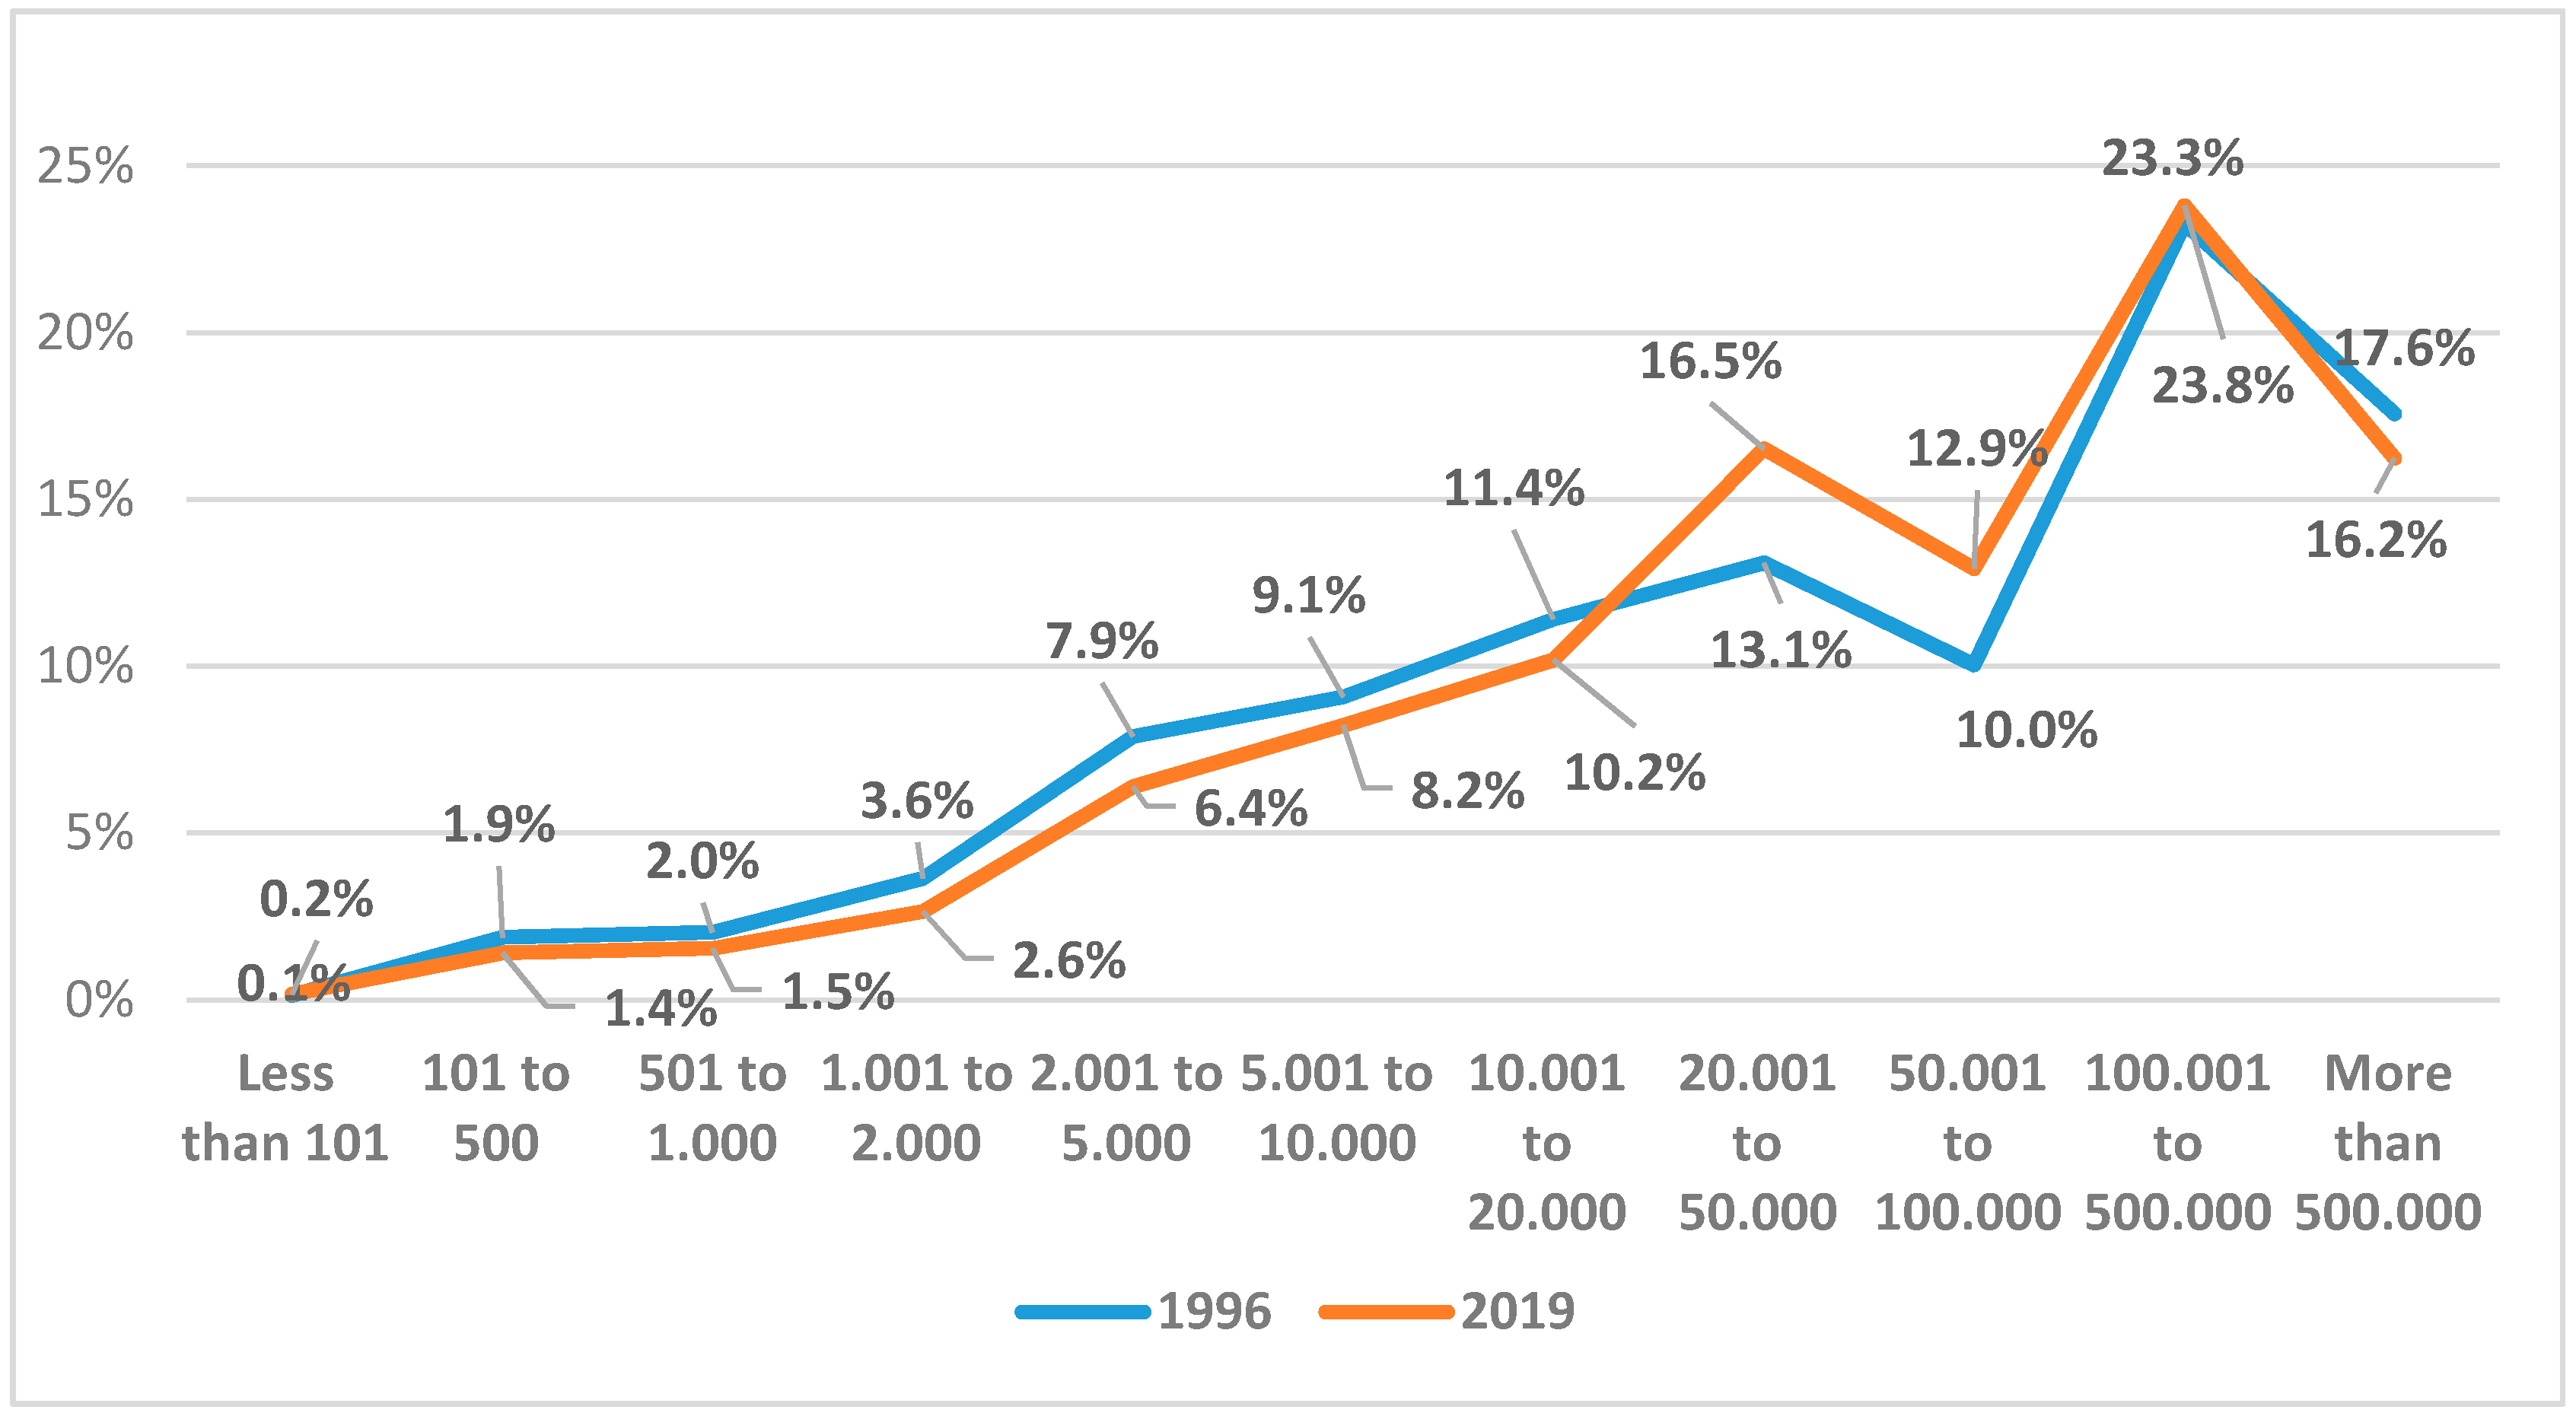
Recent changes in the population systems have taken place with the decline in the municipalities with less than 20,000 inhabitants. From the crisis in the urban settlement system in the 1960s, there are two main results to take into account. In the first place, we are facing a deeply unbalanced population system, with a large number of urban cores (and municipalities) with lower and lower population. Second, these imbalances tend to increase, with significant negative effects on smaller rural municipalities. Thus, the most recent data show that only 6% of the Spanish population lives in municipalities with less than 2000 inhabitants. This represents 72% of the municipalities in the country, adding up to around 55% of the surface. The average density in these municipalities is below 10 inhabitants/km2.
In 1996, the proportion of the population in those municipalities was almost 8%, and a similar proportion in the number of municipalities. In absolute values, these data represent a reduction of just over 0.3 million inhabitants, and of 54 fewer municipalities with less than 2000 inhabitants. Certainly, since the end of the last century, no municipality has disappeared, despite the fact that many of them have a critical size and a declining trajectory. They have been able to successfully adapt to processes of change (demographic and structural economic change, as well as the lack of basic public services), and to develop positively using suitable local adaptation strategies [
11]. Between 1996 and 2019 (
Figure 1), two important conclusions can be derived. First, rural municipalities have continued to lose population (even in a few years in which migratory flows partially alleviated the situation in some rural areas). However, these losses are not limited to the smallest municipalities, and even reach the municipalities of 20,000 inhabitants.
Second, it is in the municipalities of 20,000 inhabitants that the population growth tends to be concentrated in 2019, as compared to 1996. The derivative trends for land use planning seem clear: there is a resistance to disappearance in the smallest municipalities up to 101 inhabitants, the municipalities with more than 500 and below 20,000 inhabitants are in decline, and the municipalities of between 20,000 and 100,000 inhabitants are being strengthened.
In this sense, new evidence has to address the ways in which the New Economy and the multifunctionality of the rural environment can contribute to the making of vibrant small towns, and what institutions and stakeholders have to do in order to stimulate post-Covid-19 opportunities.
3. Case Study
The Valencia Region (at NUTS 2 (Nomenclature of Territorial Units for Statistics)) is located on the eastern coast of the Iberian Peninsula. It is about 23,255 km
2, has 542 municipalities, and has a population of over 5 million inhabitants. The population is very unevenly distributed: it is concentrated in the coastal area (26% of the territory), with an average population density of 213.45 inhabitants/km
2. There is an intermediate area (almost 43% of the territory) that represents 17% of the population, and, finally, less than 2% of the inhabitants of the Valencia Region live in the rural system that makes up 31.6% of the region. The climate is Mediterranean, characterized by mild winters (12 °C on average in December and January) and hotter summers (26 °C on average), and an average annual temperature of 18.3 °C. Other climatic characteristics are the low annual rainfall (around 300 mm on average in 2012) and high solar irradiation [
13]. The region is economically diverse (with tourism, industrial, service, governmental and agricultural sectors), but the unprecedented growth and development in the previous decades has been unbalanced, resulting in complex territorial, social, economic and landscape realities and tensions that must be addressed at the regional scale. There are, increasingly, mechanisms from regional government intended to balance the territorial inequalities—such as the Valencian Anti-Depopulation Agenda—through the joint action of local councils and regional government.
Throughout the Valencia region, there are 171 municipalities out of the 542 under some type of depopulation risk. These areas at risk of depopulation are primarily in the northwest of the region, with some areas in the west and south (
Figure 2). They represent 32% of the total of the region, and assign the regional government (
Generalitat Valenciana) three risk states based on compliance with a series of demographic indicators. Very high risk municipalities are those that comply with the six parameters; high risk are those which meet at least five of those six; moderate risk are those which meet at least four of those six, or the population of the municipality is less than 100 inhabitants. The criteria used are:
- (a)
Population density: the number of inhabitants is less than or equal to 20 inhabitants per square kilometer.
- (b)
Population growth: population growth is the rate in the period of the last 20 years (less than or equal to 0%).
- (c)
Vegetative growth rate: a percentage representing the vegetative balance (difference between births and deaths) of the population in the period of the last 20 years (less than or equal to 10%).
- (d)
Aging index: the percentage that the population over 64 years of age represents over the population under 16 years of age (greater than or equal to 250%).
- (e)
Dependency index: a quotient between the sum of the population aged under 16 and over 64, and the population aged 16 to 64, multiplied by 100 (greater than or equal to 60%).
- (f)
Migration rate: a percentage that represents the migratory balance in the period comprised of the last 10 years (the difference between the entries and exits of the population for migratory reasons) over the total population of the last year (less than or equal to zero).
4. The Importance of Digitalisation for the Prevention of Depopulation
Neoliberalism has seen more remote rural areas excluded from faster broadband connections, as market forces lead private companies to focus their attention on urban cores [
15]. This is mainly caused by ‘low profitability’, and the according loss of political will.
There is an important generalized differential in the level of provision and access to services between urban and rural areas. The quality and diversity of the limited number of services in rural areas progressively deteriorated, as they were unable to access the necessary equipment (access to water, connection to the telephone and internet service, etc.) [
16]. Access to certain services, such as the internet, is considered to be a central element of the quality of life, and their accessibility is considered to be a mechanism to overcome social exclusion and isolation [
17].
Increased technology and new times have made us change our way of forming relationships and working. Rural areas have always struggled to match the broadband opportunities of urban ones, but the lack of policies, public funding and business confidence have not allowed to overcome this failure. The geographical gaps in broadband access form a worldwide challenge that has attracted scholars’ attention in America [
18,
19], Australia [
20], and Asian countries such as China [
2] and Japan [
21], as well as most European countries [
15]. In 2016, Canada declared broadband a ‘basic service’, requiring companies to extend their service to remote communities [
22]. The rural internet access in Canada is almost 100%, although the biggest limitation is the speed and the number of competitors [
23], which undoubtedly results in a further loss of competitiveness in rural areas [
15]. The speed and reliability of connections demonstrates this fact, as is the case with the cable internet access mostly extended in urban areas.
According to the comparative analysis of the regional digital divide in the 27 countries of the European Union [
24], the digital divide is not considered to be an urban–rural issue in which there are wide access differences among urban and rural areas. However, current studies show digitalisation issues as the actual trends of rural development in recent years, and a well-documented ‘digital divide’ [
15,
24,
25,
26]. New forms of mobility and working have reflected the importance of having sufficient broadband connection in all parts of the regions of Helsinki, Frankfurt/Rhein-Main region, Mid-Wales, Styria and Valencia through the ROBUST H2020 project.
The first approach by the European Commission was with the Communication of 6 May, 2015, entitled ‘A Strategy for the Digital Single Market of Europe’, with the statement that: “Information and communication technologies (ICT) are no longer a specific sector but the foundation of all modern innovative economic systems”. This strategy highlighted the importance of the 694–790 MHz frequency band (hereinafter 700 MHz) in order to guarantee the provision of broadband services in rural areas, ensuring access and connectivity, while pointing out the need to coordinate the release of said band, and to satisfy, at the same time, the specific needs of the distribution of broadcasting services, thus reducing the digital divide between the rural and urban world in terms of the coverage and knowledge of new users. The 700 MHz frequency band was important in particular in rural, mountainous or insular areas, and other remote areas that pose economic difficulties, leading to a minimum of 30 Mbps access to broadband by 2020, favouring, in this way, the project of the gigabit society in the European Union [
27].
Recently, the European Commission promoted the WiFi4EU initiative with a budget of EUR €120 million between 2018 and 2020 for municipalities to set up free Wi-Fi networks in public spaces such as parks, squares, public building, libraries, health centres, and museums. This initiative is a good solution, since many municipalities are far from the access tower, and thus it does not reach the majority of residents. The fourth and last WiFi4EU call in June 2020 was for 947 municipalities from across Europe. Because of the Covid-19 pandemic crisis, it had a great impact for all of the municipalities that wanted to apply, but they had a low probability of achieving it.
The current global pandemic at the beginning of 2020 has fostered sectors such as teleworking and e-commerce. On the one hand, teleworking allows the increase of the population in rural areas [
25,
28] and, on the other hand, e-commerce has been a lifeline and an opportunity for reinvention for small local markets. E-commerce allows purchases to be made online without driving to the store, which has great potential for rural areas [
29]. However, the paradigm has changed. E-commerce enables the linking of rural residents with national and global markets through internet trade. Moreover, local markets and farmers have the need to (and see e-commerce as an opportunity to) revitalise their production and businesses [
2,
30]. For entrepreneurs and farmers, this is a strong challenge. Consumption habits have changed in these months, and many of them have been faced with innovation: new forms of relationships in which the telephone, e-mail and social networks have been essential to interactions. Administrative procedures in the electronic environment are increasingly widespread, and mean an opportunity to advance in the rural economy and under the current mobility restrictions [
30]. However, internet infrastructures are relatively backward or have difficulty penetrating in rural areas [
2], and their inhabitants are still experiencing problems in obtaining and retaining access to goods and services such as e-health [
31] and online education.
On the one hand, social initiatives can act as an emergency response, such as the remote British village that recently built one of the UK’s fastest Internet networks [
32]. On the other hand, the role of governmental actors has been key to parrot this geographical gap. Laura Kelly, governor of Kansas, stated that “Covid-19 has made clear the importance of access to high speed internet. Whether its telemedicine, teleworking, or online education capabilities, broadband is a tool that can change outcomes for rural and urban regions alike”. The leader of AWB (the Association of Washington Business) argued that “we need to do a better job of mapping, having the data to show where we have connectivity and where we don’t have coverage. There are different types of tech that can be used. We need to make sure we get that done”. In Spain, the Minister for the Ecological Transition and the Demographic Challenge, Teresa Ribera, highlighted that:
…despite the boost given in the last two years to broadband coverage in the country, the Government is concentrating efforts to reduce the digital divide in rural areas through the development of pilot projects for 5G services and including specific criteria and objectives in the 2025 Digital Agenda and in the Government’s Digitization Plans [
33].
In this context, the Minister of Territorial Policy and Public Function, Carolina Darias, stressed that “talking about the demographic challenge is talking about the citizens enjoying the same rights and the same public services regardless of their place of residence”.
The national government in Spain gives financial assistance to carry out projects within the framework of the New Generation Broadband Extension Program (2020 call). The objective is to “extend the coverage of public electronic communications networks capable of providing very high-speed broadband services (more than 300 Mbps symmetric, scalable to 1 Gbps), to areas without adequate coverage or provisions for their provision in the next three years”. Accordingly, the regional government of Valencia has developed a broadband map to identify ‘white areas’ based on private companies’ data. Local governments are expected to play more significant roles in the deployment of broadband infrastructures in rural areas. Particularly in less favoured areas, where telecom businesses are quite unprofitable, the active involvement of local governments is indispensable [
21,
34].
5. Materials and Methods
This paper reports the results of surveys conducted in order to determine what the situation of the internet access is in the 71 inland municipalities. In line with this, the study was carried out in order to assess the ways in which internet territorial coverage is affecting the different inland municipalities, and what the role of local government is in rural services such as internet access. It attempts to assess these working Hypothesis:
Hypothesis 1. Local governments are expected to play more significant roles in the deployment of internet infrastructures in rural areas than in urbanized areas of the countries, especially in larger municipalities [21,34]. Hypothesis 2. Low accessibility and remoteness decrease the territorial coverage in internet access. The larger the population in the municipalities, the better the internet territorial coverage [15,26]. The method consists of an explorative and replicable approach for the data assessment of internet access in rural areas, in order to draw a picture through local actors belonging to the inland areas in the Valencia region.
5.1. Questionnaires
Local councils from the inland municipalities of Valencia region were contacted by email through the practice and research partners in order to ascertain, precisely, the current situation in the rural municipalities and, with this, to inform and provide guidance to public officials in the face of decisive actions that make it possible to decisively reduce the digital divide. The first contacted were those belonging to the Valencian Anti-Depopulation Agenda, and then we expanded further to encompass the greatest number of responses from local councils found in the rural areas of the region.
The questionnaire had the objective to collect the most accurate information in the largest number of inland municipalities after the Covid-19 pandemic, limiting the collection work to the month of June. The surveys were directed either to the councils themselves (for which any person responsible for the city council could fill out the survey) or directly to the mayor, and the results were the following:
The development of the questionnaire (
Table 1) resulted from the literature and news and from any source of information, formal or informal, regarding the lack of (or inadequate) internet access in rural areas. It was tested beforehand in order to make sure of the compilation and understanding. An estimated number between 100 and 150 questionnaires, and many reminders, were distributed, resulting in 87 fully completed questionnaires, which corresponds to 71 municipalities. The time to complete the questions turned out to be no more than 20 min. The type of questions was chosen in order to follow an information thread, with most being mixed (such as scaled options) and open, in order to give the option to the local agents to enter information that it might be unknown to us.
5.2. Analysis
We performed the analysis in two main steps: an agglomerative hierarchical clustering (AHC) analysis of most of the variables (a total of 13 variables) from the questionnaires in order to observe the general dynamics and thus the situation in which rural areas find themselves in internet access, and then a descriptive analysis of the last section of questionnaire dedicated to the explanation of the most affected sectors, internet success stories, and the actions required by the government (
Table 2).
5.2.1. Hierarchical Cluster Analysis
Clustering analysis is a form of exploratory analysis that will allow us to identify different groups of municipalities with challenges and problems related to internet access. In particular, given the prevalence of categorical variables in the questionnaire, the clustering technique used was the hierarchical agglomerative method, which will help to determine the optimal number of clusters. We performed an agglomerative hierarchical clustering (AHC) with hclust in R studio. First, we computed the dissimilarity values with dist, and then fed these values into hclust and specified the agglomeration method to be used (i.e., “complete”, “average”, “single”, “ward.D”). Ward’s method was the most effective clustering method in order to obtain a number of clusters that would maximize the cohesion inside the groups and the distance between the groups. Then, both the “Elbow” and “Silhouette” methods were used in order to verify the best number of clusters. Finally, the resulting clusters were represented in a dendrogram, as this is the most proper representation method.
Assessing the clusters, we decided between different clustering algorithms and a different number of clusters. There are two types of strategies used in hierarchical clustering analysis: the agglomerative and the divisive strategies [
35]. The agglomerative method turned out to be the most balanced approach. Following this, we produced the “elbow” and “silhouette” plots (
Figure 3) in order to give an approximation in the choice of the number of clusters. The former shows the within-sum of squares—as a measure of the closeness of the observations. The latter is a measure of the data’s consistency; the silhouette plot displays a measure of how close each point in one cluster is to the points in the neighboring clusters [
36].
Table 3 provides the relevant information on the variability of the clusters. We used the elbow and silhouette methods to interpret them. The elbow method shows the within-sum of the squares as a measure of the closeness of the observations: the lower it is, the closer the observations within the clusters are, which changes for the different number of clusters. According to the row within the sum of the squares, from the cluster 4 (test 3), we see the way in which the values decrease to a lesser extent. When it comes to the silhouette assessment, row avg.silwidth, the rule is that we should choose the number that maximizes the silhouette coefficient, because we want clusters that are distinctive (far) enough apart to be considered separate. As shown in the silhouette plot, there is a jump between clusters 4 and 9. Based on the size of the clusters produced by the agglomerative method, a comparable number in size to cluster 4 can be seen.
5.2.2. Descriptive Analysis
In the second part of the questionnaire, there were open questions dedicated to the provision of the sectors that are the most affected by the lack of or inadequate internet access with specific examples, as well as the improvement actions required from governments. Finally, it was necessary to finish with internet success stories, which could be interesting way to demonstrate the importance of this service. We used descriptive methods to evaluate the responses and provide summaries about the local situation.
6. Results
6.1. Description of the Sample
The sample (n = 87) corresponds to 71 municipalities, with a population ranging from 17 inhabitants to 20,254 inhabitants, divided into:
<300 inhabitants. → 31%
300–500 inhabitants. → 25.5%
500–1000 inhabitants. → 16.6%
>1000 inhabitants. → 26.6%
The average population (2019) of the municipalities is 968 inhabitants.
The average population density is 32.83 persons/km2
According to the indicator measuring the risk of depopulation (provided by the regional government), the municipalities in the sample correspond to:
Very high risk of depopulation: 19 municipalities
High risk of depopulation: 19 municipalities
Moderate risk of depopulation: 17 municipalities
Absence of risk: 16 municipalities.
6.2. Results and Discussion
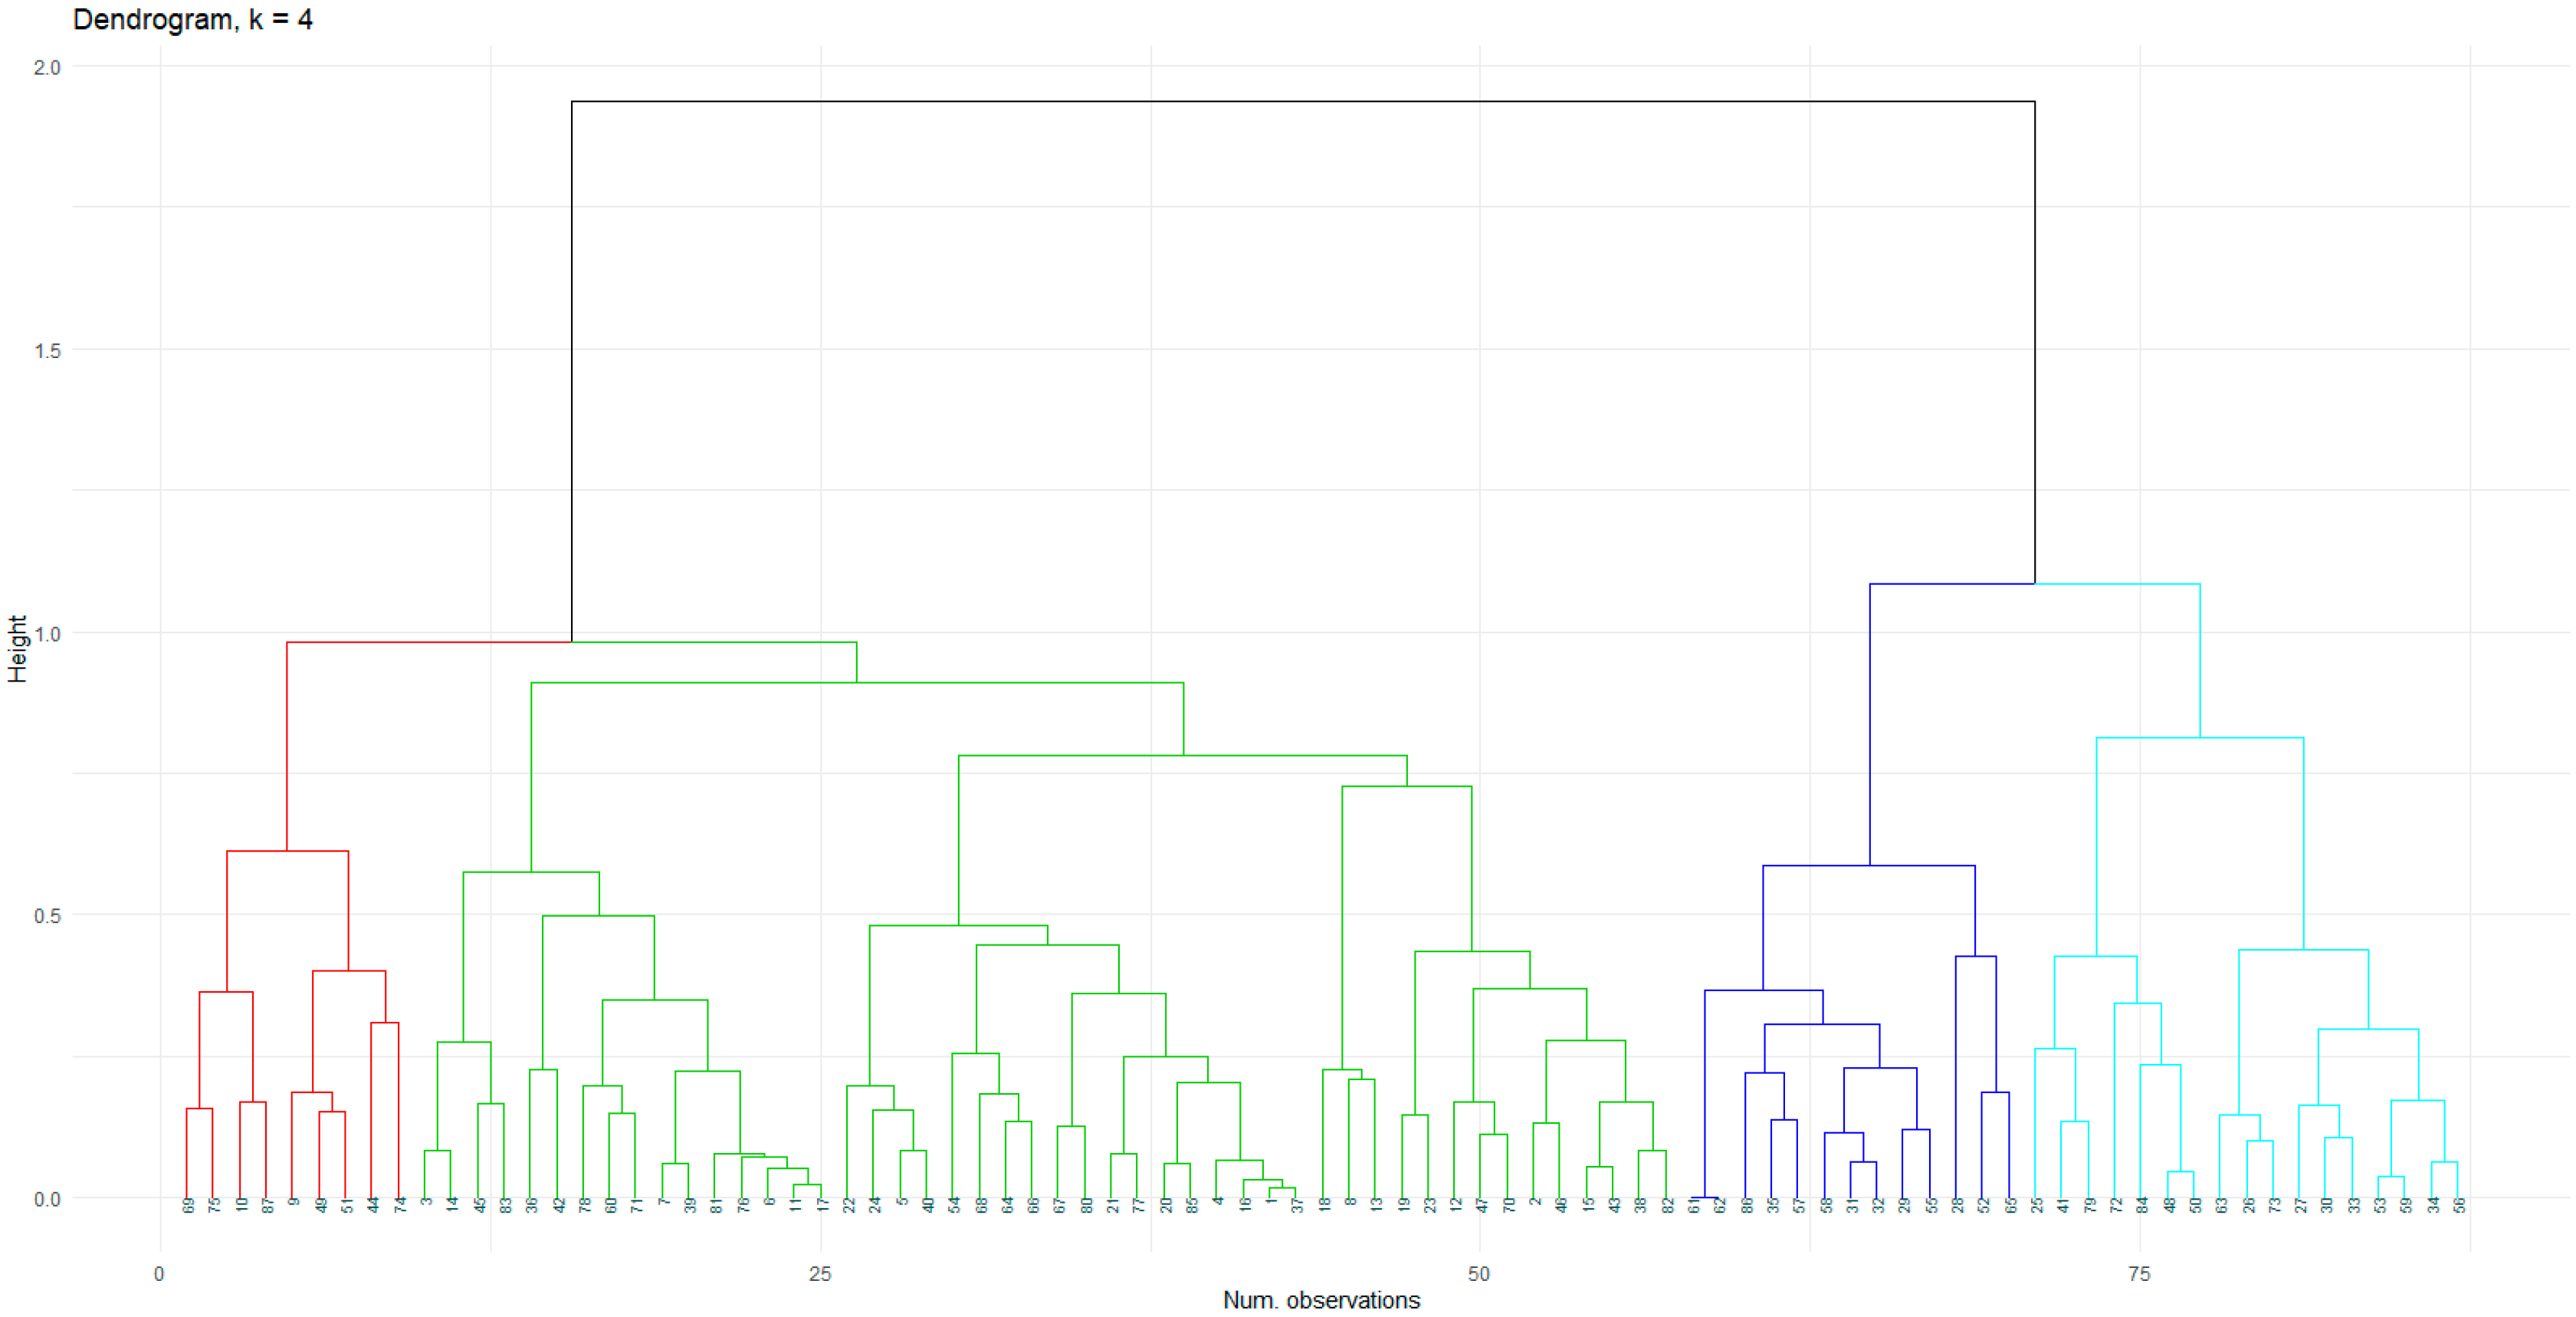
We created a dendrogram for the clusters’ representation (
Figure 4). The vertical axis of the dendrogram represents the distance or dissimilarity between the clusters, and the horizontal axis represents the observations (municipalities). The dendrogram is intuitive to interpret: each joining of the clusters is represented on the graph by colours.
In
Table 4, the clusters are described according to the most important variables of each cluster. The percentage of the variables for every cluster was calculated. The values in bold represent the highest percentage of the variable values for each cluster. The distribution of the individuals in the four clusters reveals that the first (in the red colour) accounts for 10% of the respondents, the second (in green) accounts for 55%, the third (in blue) accounts for 15%, and the fourth (in light blue) accounts for 19.5% of the sample.
Two important groups emerged from the interpretation of the four clusters that define rural areas in terms of internet access.
6.2.1. Rural Areas with a Lower Internet Access
Cluster 1 and cluster 2 are characterised by municipalities with a lower number of inhabitants and difficulties in accessing the internet. In total, 60% of them correspond to municipalities with fewer than 500 inhabitants. The vast majority need an alternative to cable/fibre in order to provide their homes with an internet connection. Many do so through an outside company with the hiring of high-speed internet connection (ADSL) (cluster 2). Other municipalities probably opt for the best quality/price option when contracting through a local operator wireless networks (e.g., Wimax) (Cluster 1). The speed achieved in both does not reach 10 Mbps, and the public Wi-Fi offered to the inhabitants in the village is provided through a single public space, such as the town hall building. In fact, there is no good territorial coverage in general, and the opinion on the neighbouring confirms this in the same way. According to local resources, they have a public website for inhabitants, but it is not updated, and even the administrative procedures they offer are not being used by population. Despite this, they do not plan to carry out actions in the short or long term, although they are aware of the importance of this challenge.
6.2.2. Rural Areas with Proper Internet Access
Most of the municipalities belonging to clusters 3 and 4 have more than 500 inhabitants, although 30% of cluster 4 corresponds to municipalities with a smaller number of inhabitants. Municipalities in both cluster 3 and 4 have cable/fibre and 100 Mbps of speed, contracted by an external company. However, there are some differences between the two clusters. In cluster 4, most of the local councils provide a significant number of public spaces with public Wi-Fi. Likewise, they have good territorial coverage, as well as a good assessment from neighbours. Additionally, they provide updated local resources, and are planning actions to further improve access to their neighbours. They are planning actions such as applying for the WiFi4EU-2020 voucher; offering training, especially for middle-aged and older people, as well as training actions for local commerce; and changing their internet service provider. The state is quite different in cluster 3, where the territorial coverage is lower, as is the perception of neighbours who are not using online administrative procedures. Given the situation, and despite being municipalities with more population, their local councils are not planning actions in order to face this failure, unlike the others.
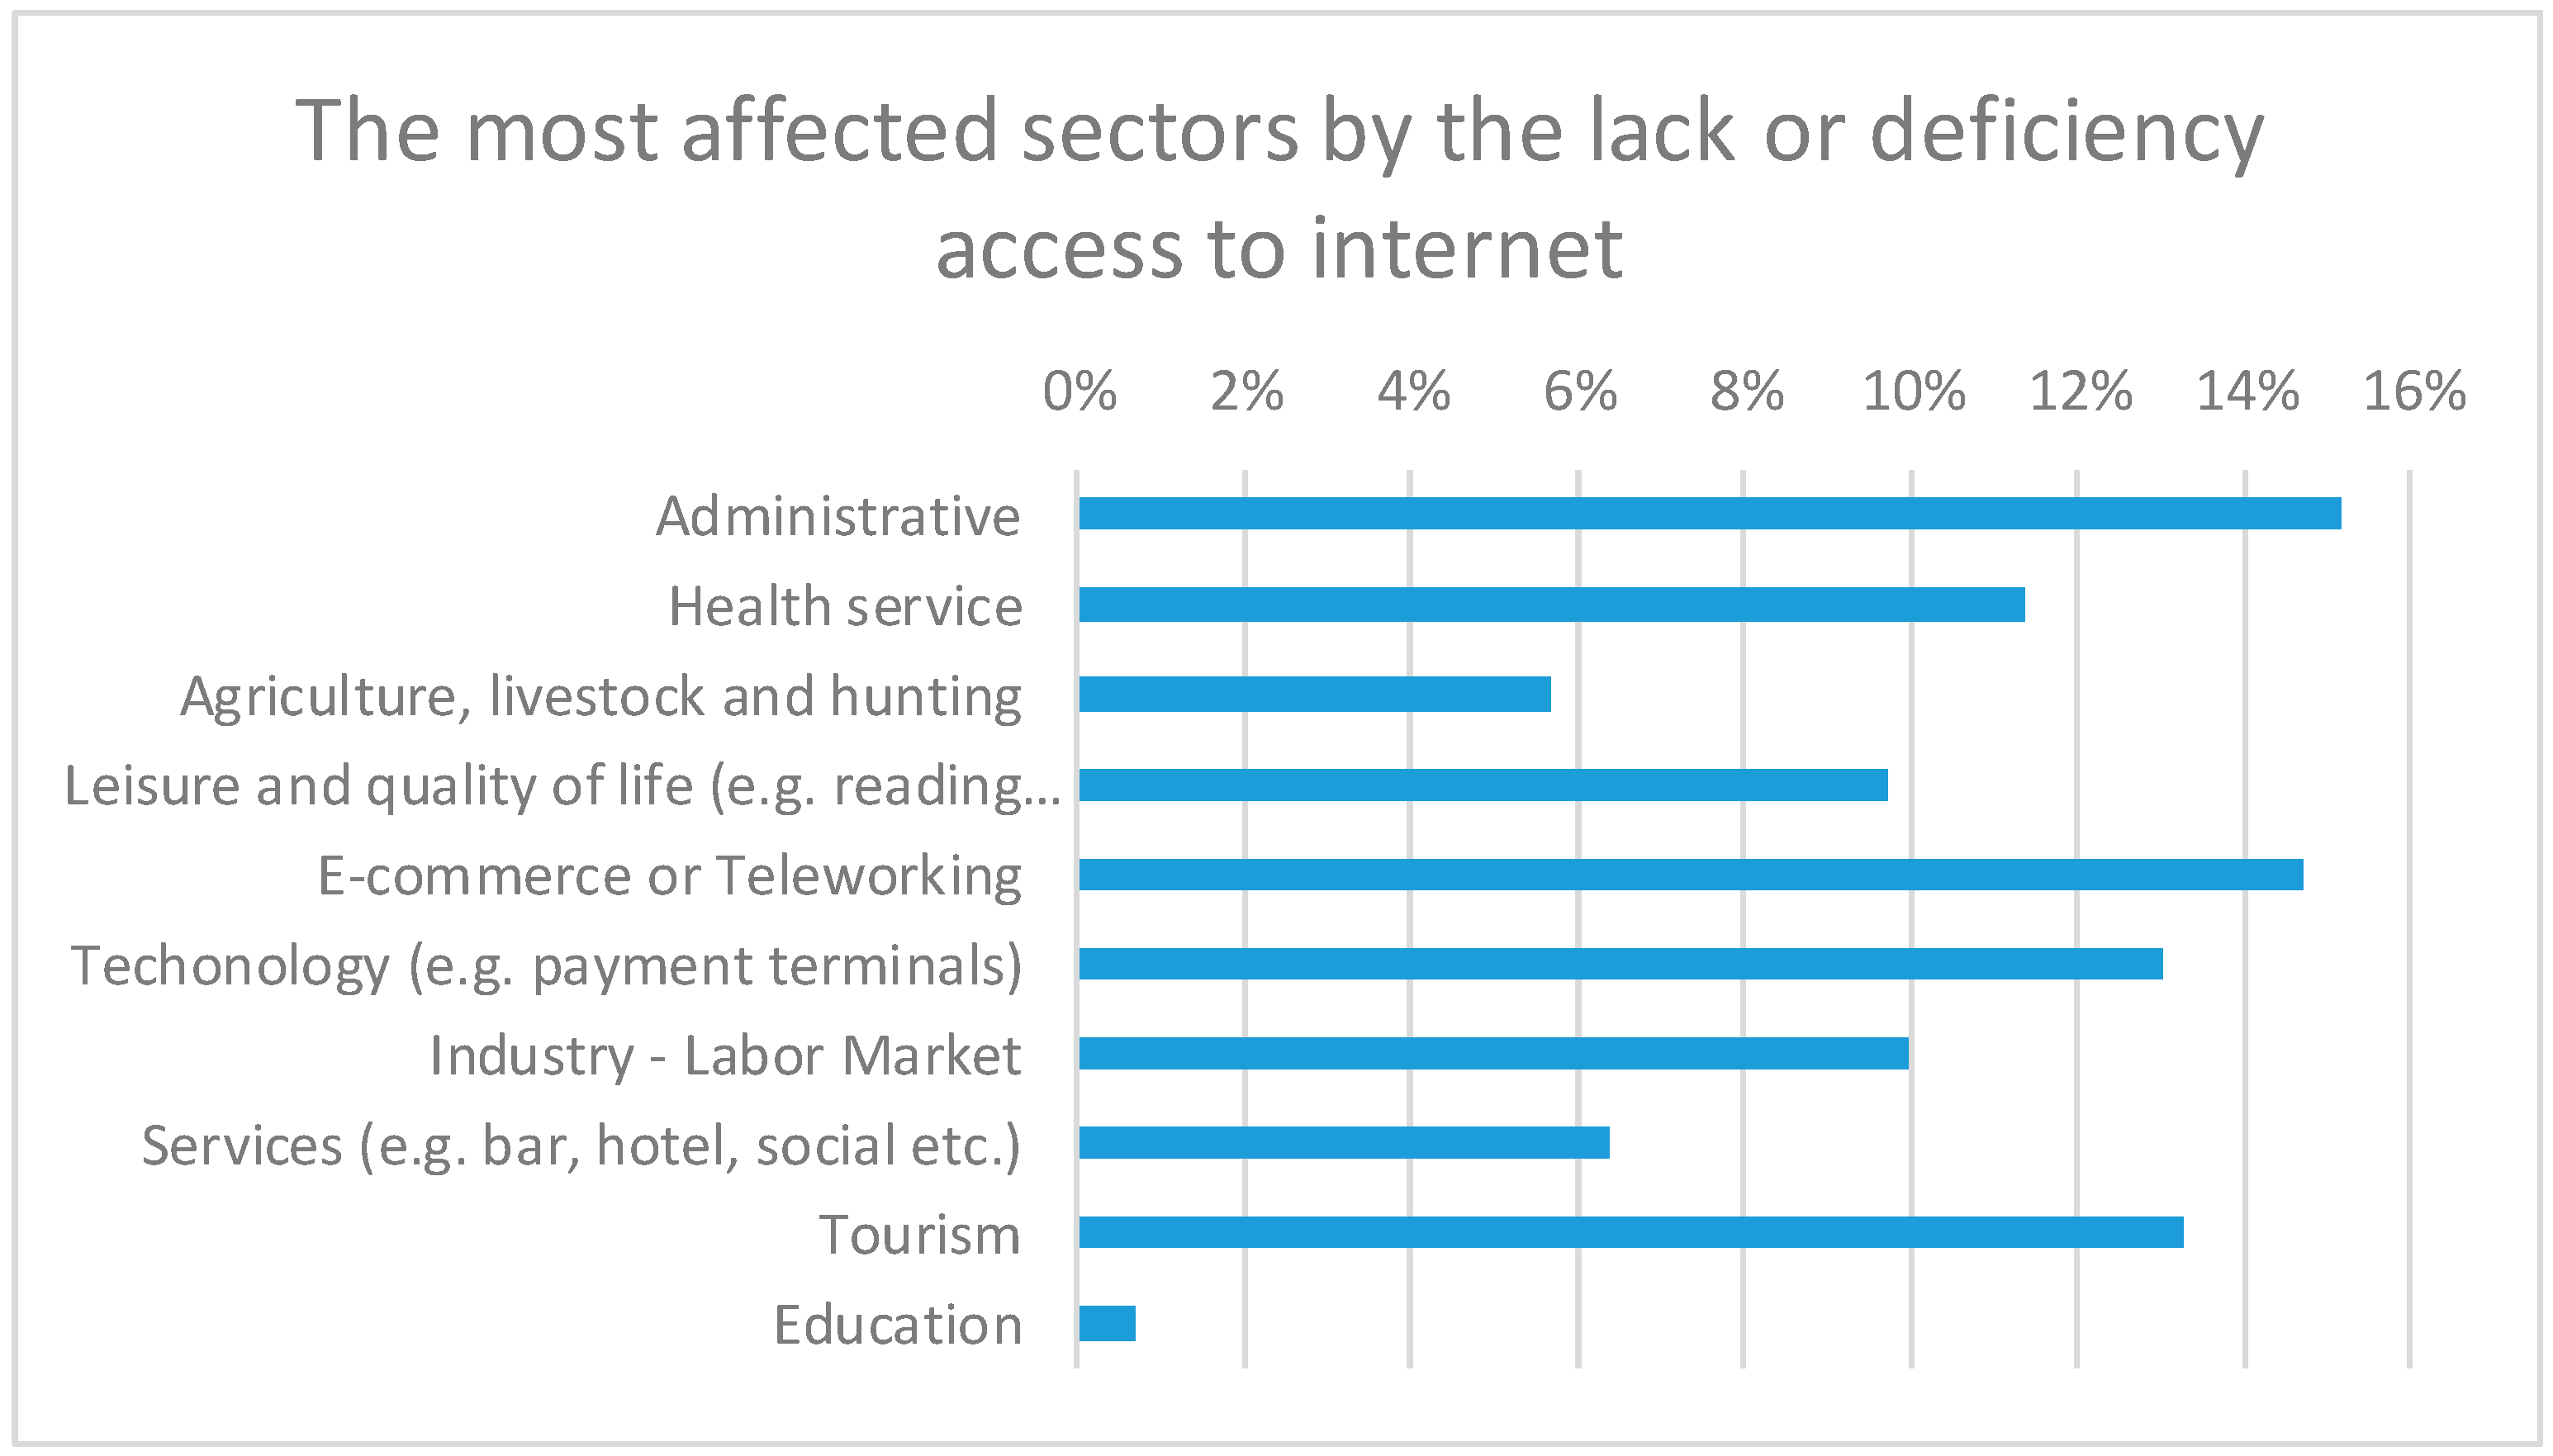
During the Covid-19 confinement, access to the internet became even more of an essential tool for the protection of our health, as well as for a range of essential tasks in the work or education, while our everyday movements are restricted. Rural areas face unprecedented challenges that, from now, have been increased. In order to cope with these changes and make important decisions, people in rural areas must have access to information and communication. According to the respondents, there are a wide number of sectors that are hampered by the lack of proper infrastructure (
Figure 5). Most of the sectors were very important during the confinement, such as education, health, administration, commerce and work. As such, rural areas faced a major challenge in technologies that prevented, on several occasions, the carrying out of important tasks, such as education. According to the municipalities in the Valencia region, the sectors that were the most affected by the lack of internet were related to its greatest use, i.e., administrative procedures, e-commerce and teleworking, as well as tourism. The first made clear the need for good internet access, accompanied by the lack of resources and training on the part of local councils, which—most of the time—did not have a good platform to carry out the procedures. The second indicated that great Covid-19 implications have originated in teleworking and e-commerce, and have increased substantially, even meaning an opportunity for rural areas. Then, faced with the Covid-19 crisis, rural tourism has been given a boost in technologies to show its potential.
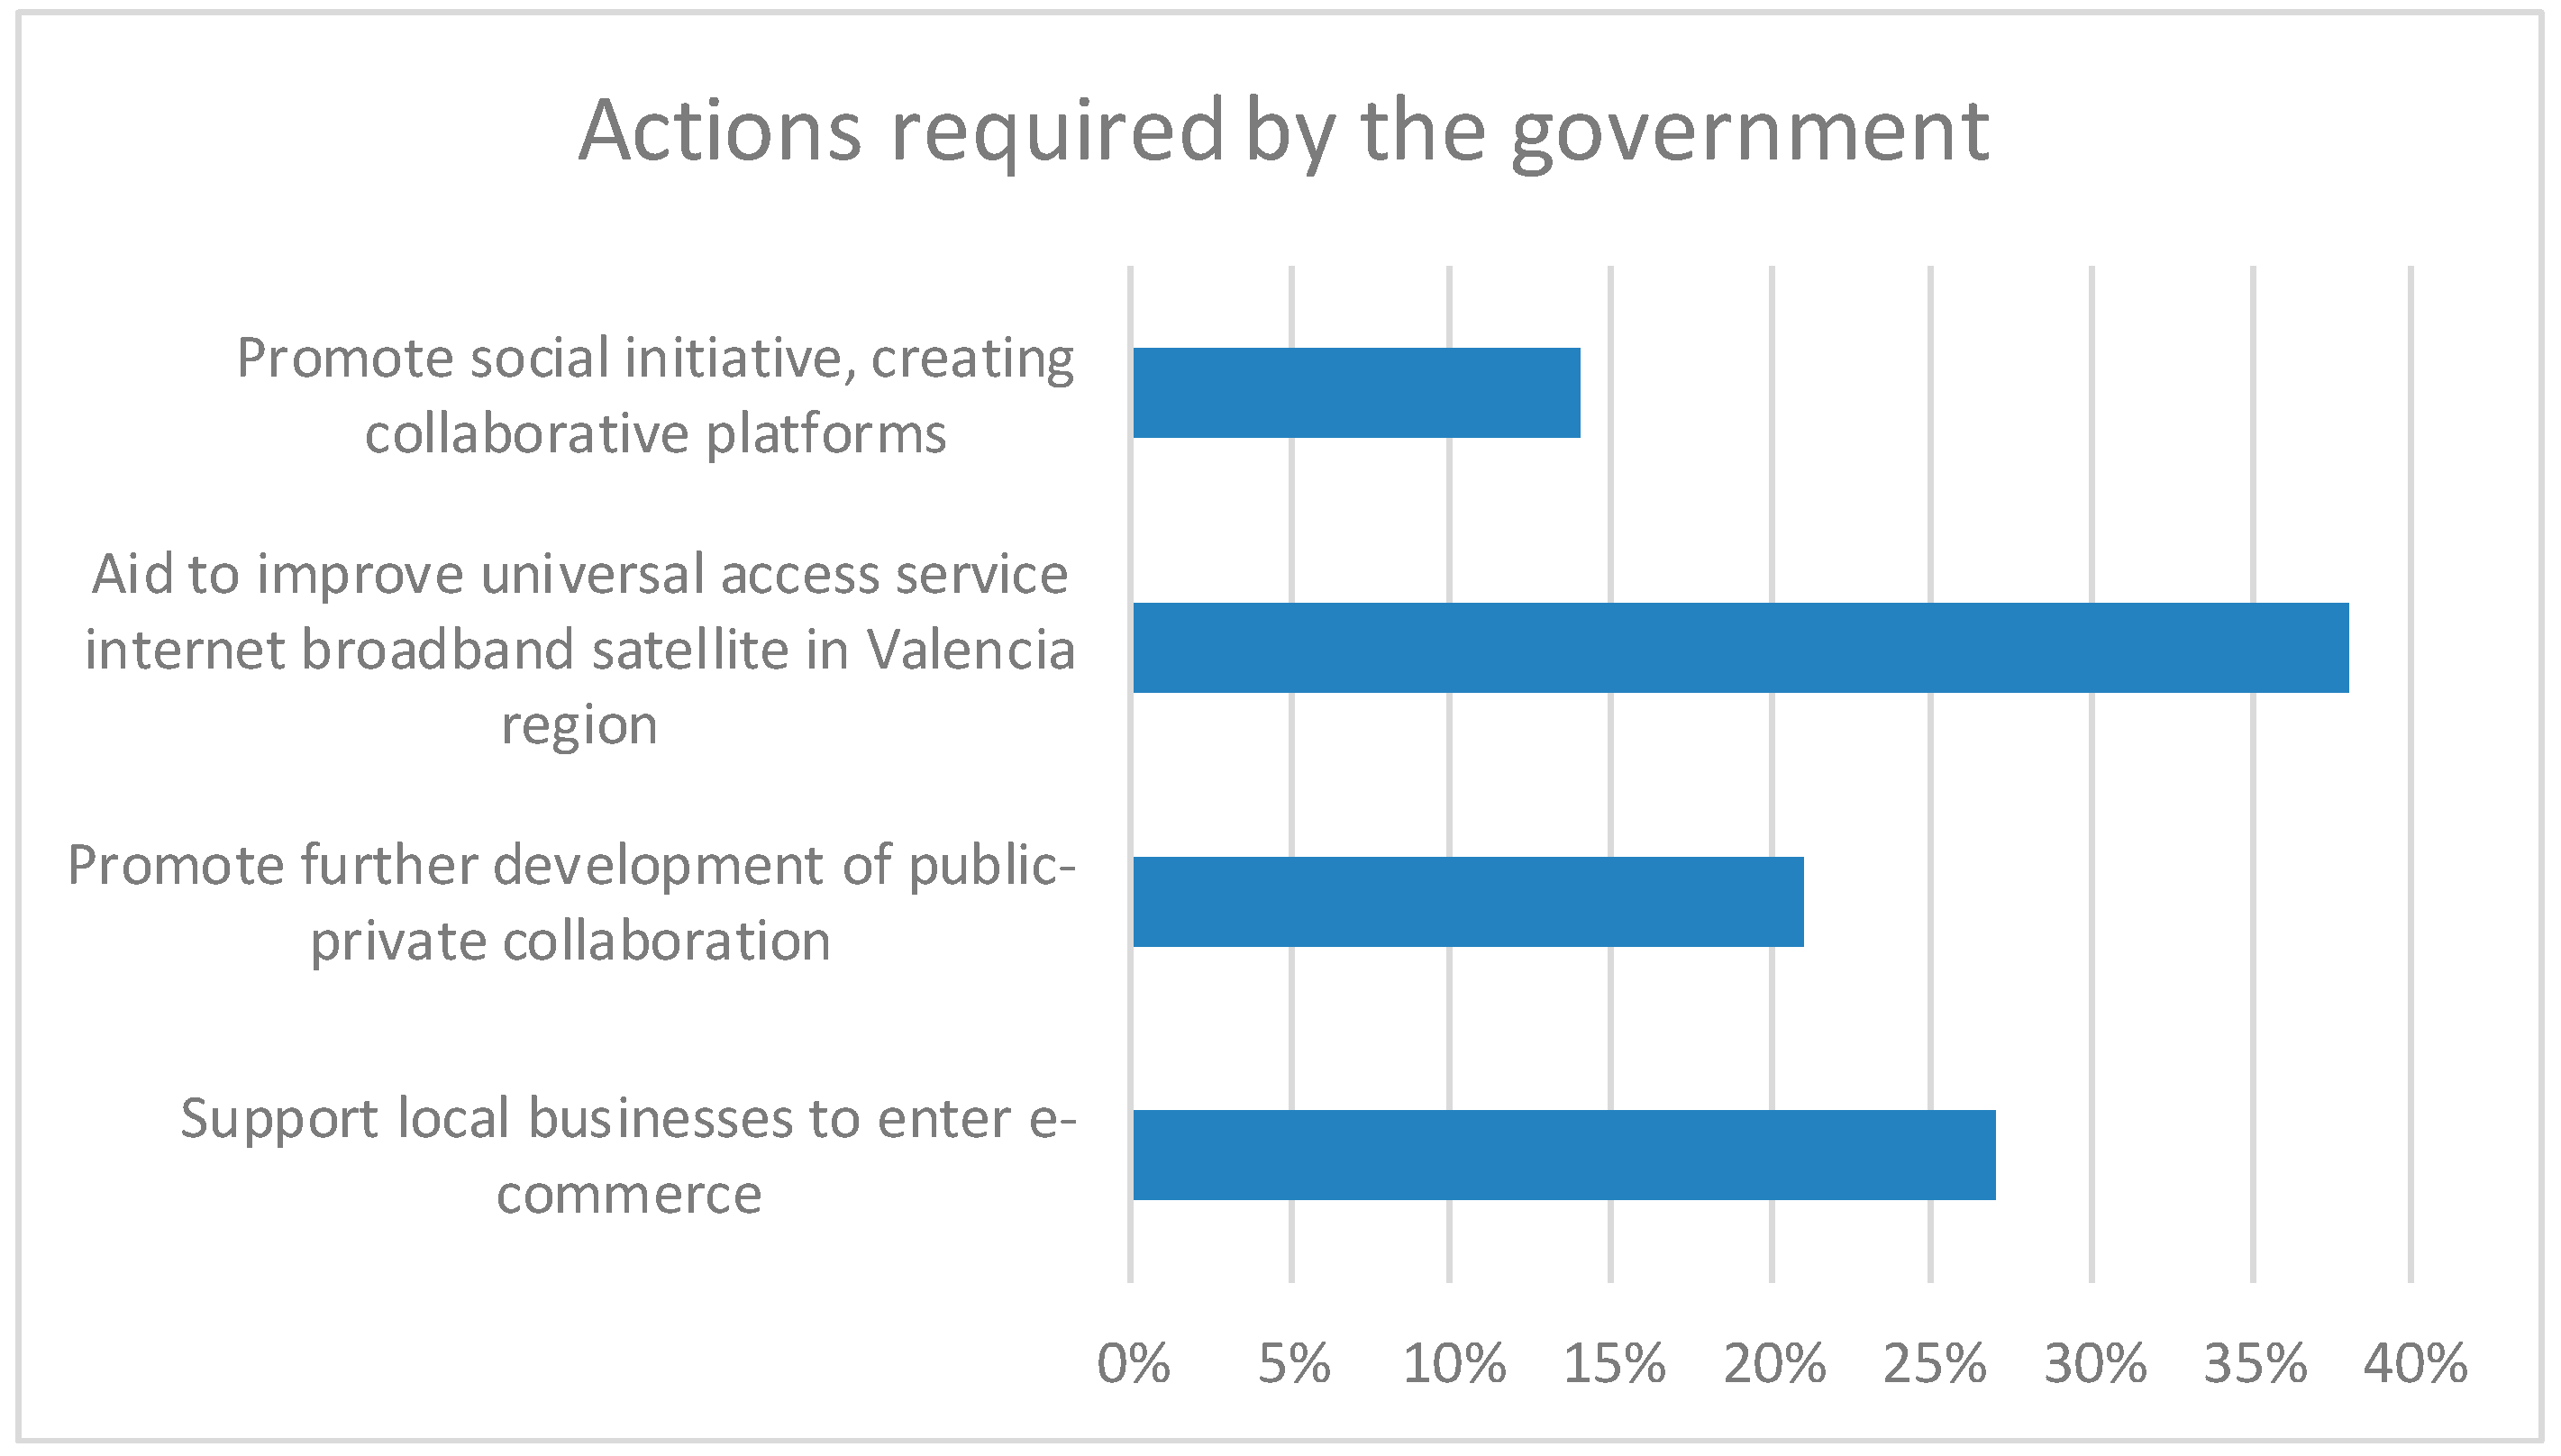
Moreover, the respondents were asked what actions would be necessary to solve this deficit from public government, and almost 40% of the local agents urged the promotion of aids to improve the universal service of access to broadband internet via satellite in the Valencia Region, whereas almost the 30% preferred to receive aid to make e-commerce easier (
Figure 6). New consumption habits caused by mobility restrictions are factors that weaken rural trade. Local shops and business (e.g., groceries) have needed to reinvent their businesses in the face of the ongoing increase in commercial competition (physical, but also digital), making it necessary not only to have an attractive and quality offer, but also to have the skills and means to attract potential customers and sell them the products [
37].
The survey respondents also think that it will be necessary to promote the further development of public–private collaboration in order to encourage fair internet prices, and to encourage operators to dedicate the same efforts to investing and maintaining infrastructure. It is defined as ‘the rural penalty’, meaning that people in rural areas ‘pay a price’ for living there [
38]. Finally, almost 15% of the municipalities agree that it is necessary to promote social initiative, i.e., the creation of collaborative platforms. This is one of the solutions to overcome the market failure in these areas [
39], at least as regards the joint creation of solutions together with local agents.
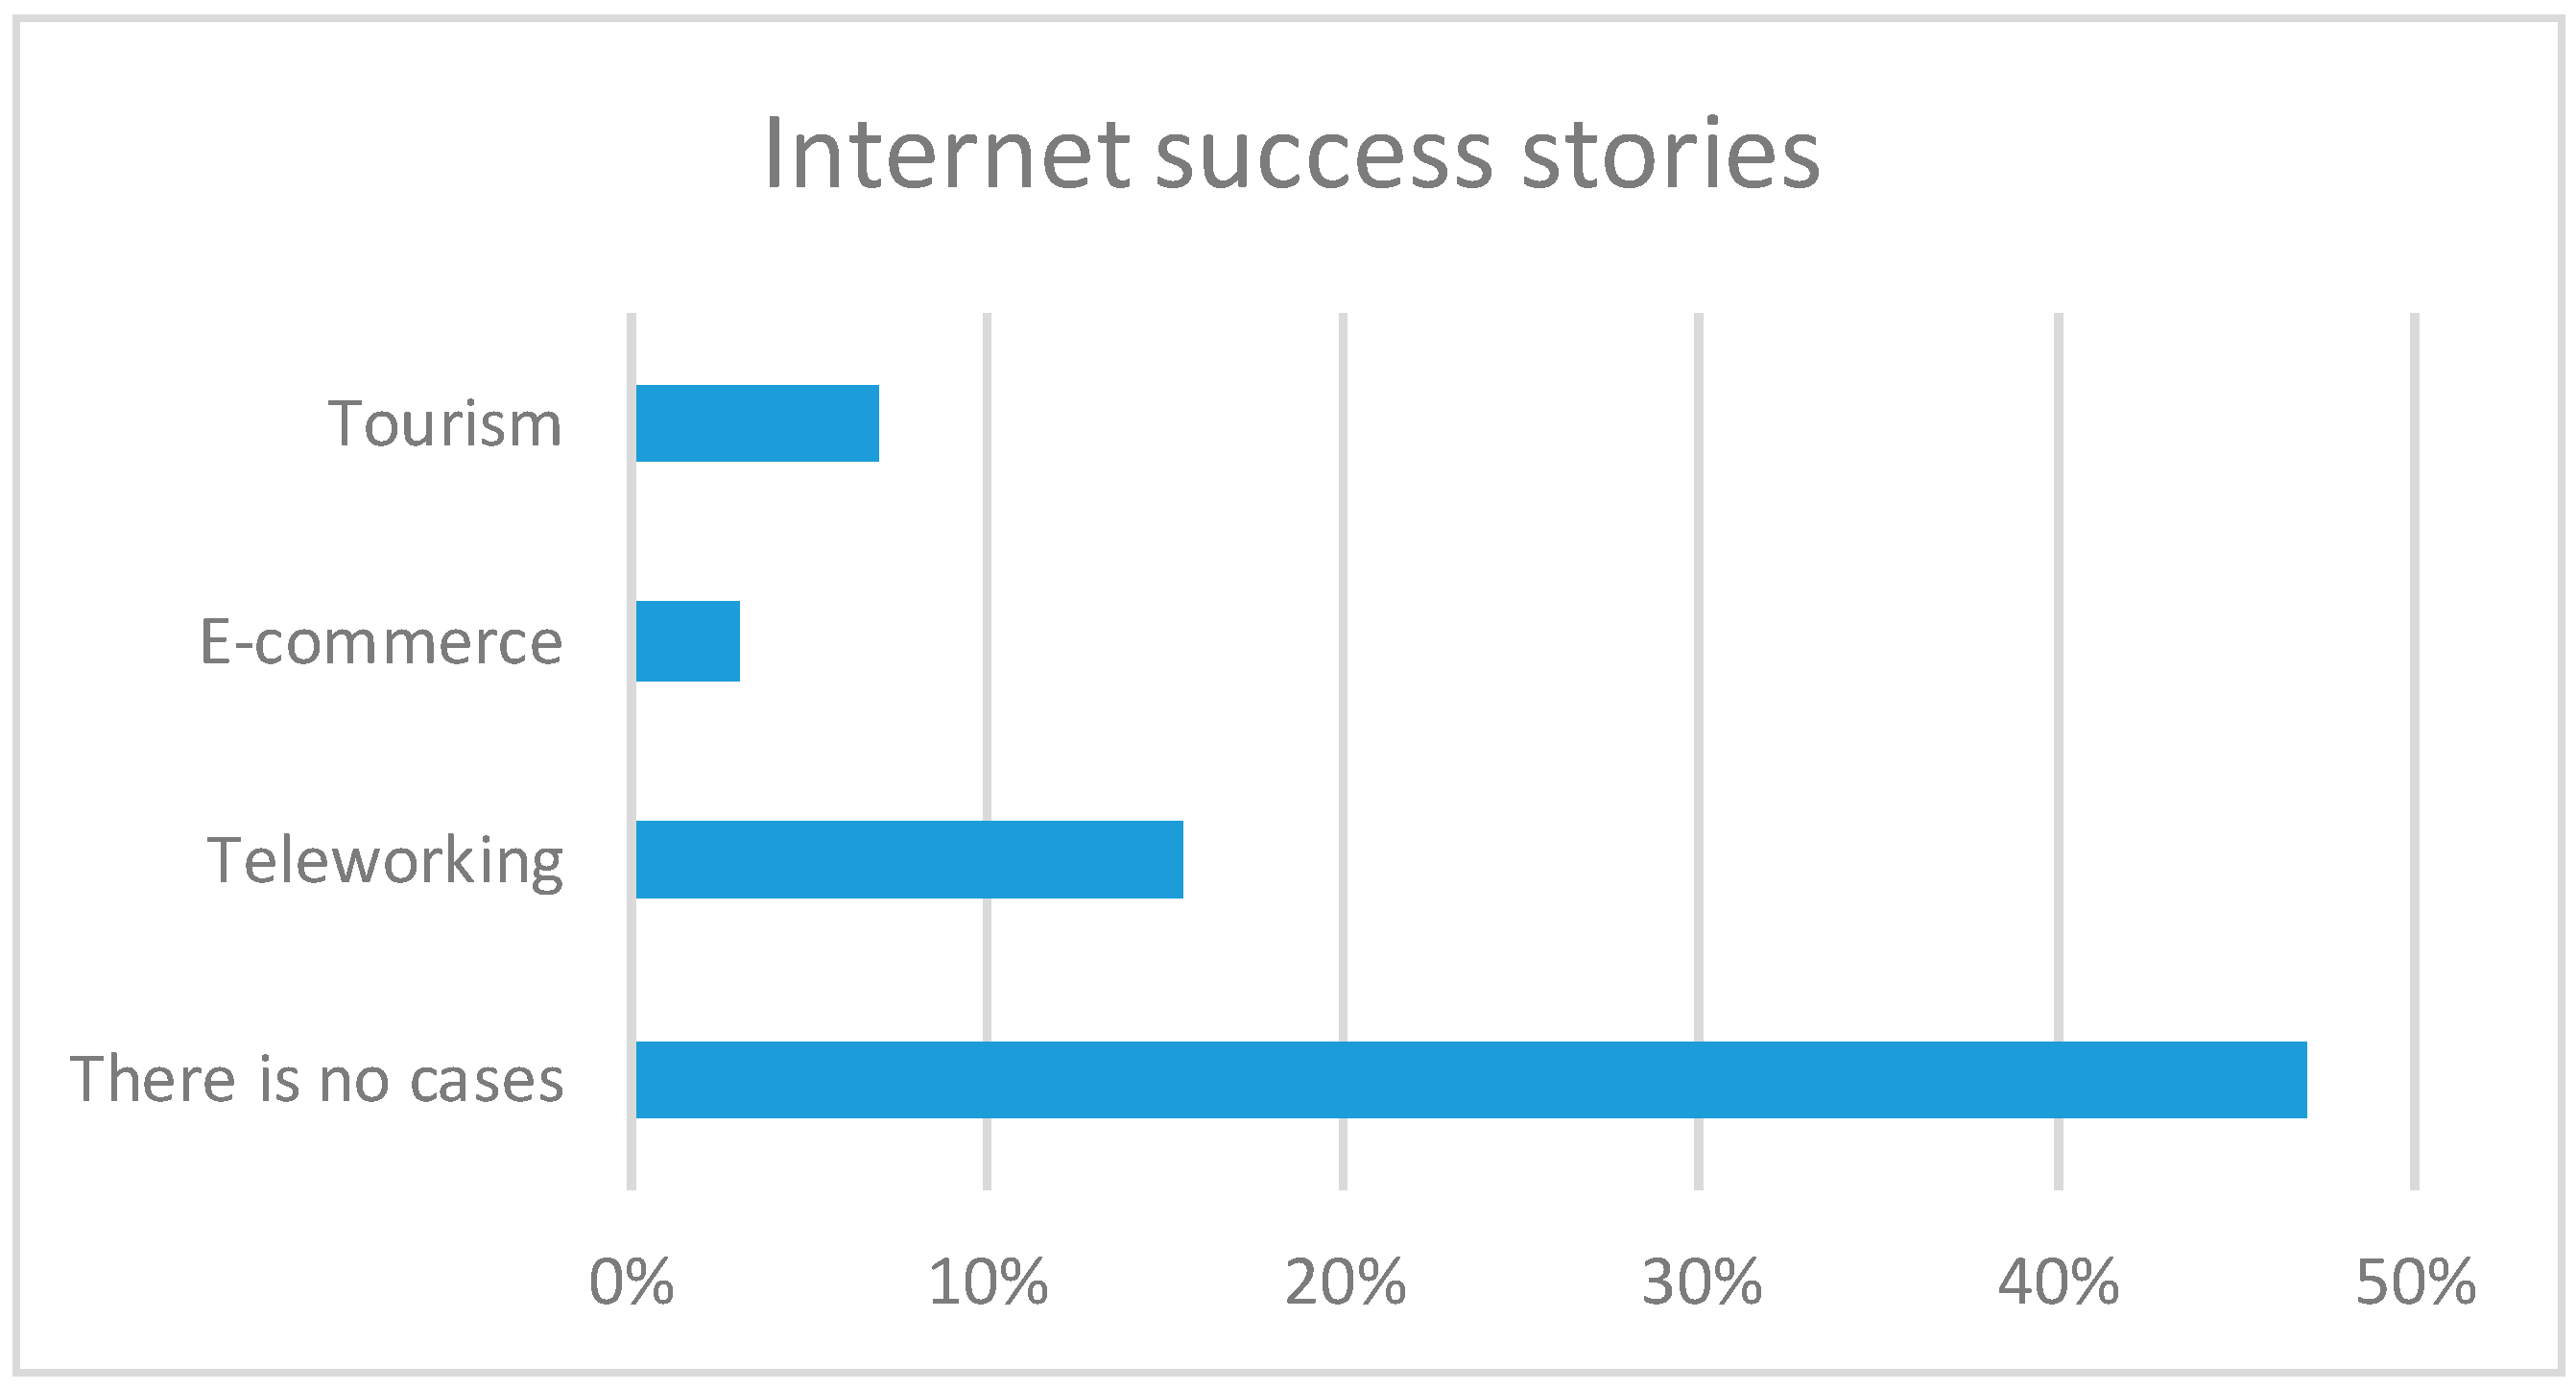
New approaches are needed in order to change the paradigm, and to stimulate new actions and highlight the opportunities that rural areas can bring. When asked if there are success stories in their municipalities thanks to the use of the internet, almost 50% of the municipalities claim not to have any (
Figure 7). This seems to indicate, on the one hand, the lack of dedication by local councils to develop new local actions or motivate inhabitants to develop them [
18], or, on the other hand, the inability to carry this out due to the lack of infrastructure. Otherwise, the other part of municipalities stated that teleworking, e-commerce and tourism were the most favored cases, thanks to digital technologies. Despite having quite a few difficulties accessing the internet, teleworking and e-commerce meant, in turn, an opportunity for most of the municipalities who saw a ray of hope their local economy.
Despite being small municipalities, other internet success cases (but not illustrated in the graph by its particularity) included: “Having a point in our village where neighbors can freely access a public WiFi network to connect to the Internet”, as well as the creation of social network—i.e., WhatsApp and Facebook—competitions. One of the municipalities has a ‘Route of Sundials’, which is one of the main tourist attractions in the village. It consists of an application that tourists can access, and, for example, the owner of the sundial can create an explanation about it.
7. Conclusions and Perspectives
The purpose of this study was to explore internet access in rural areas through surveys conducted to local agents. We can no longer assume that there is relation between depopulation and the lack of internet. The results of the survey show a clear deficiency in the internet connection in the inland municipalities, either with high or low risk of depopulation. On the one hand, orography and access is one of the reasons for the poor territorial coverage. On the other hand, both the distance and low number of inhabitants increase the distrust of the operators for the maintenance of the networks.
We originally assumed that local governments are expected to play more significant roles in the deployment of internet infrastructures in rural areas [
21,
34]; however, the results show that this usually occurs when the municipalities have higher populations. Even so, the role of local government should be to examine the locality and potential operators, in order to assess what elements are missing, how this could it be solved, and what assets could be used to reduce the costs [
18]. Such municipalities have planned either short-term or long-term actions, such as training for all ages so that they can make use of all of the available tools provided by local councils.
The results from the AHC analysis reported two main patterns related to rural areas with a lower internet access and others with a proper access. The former is in smaller municipalities in terms of population, and it is mainly influenced by the type of connection. The latter is related to municipalities with a better connection type, although it is not the panacea for the most remote rural areas, where the speed and reliability of connections is the biggest limitation, along with the decrease of territorial coverage. One of the initiatives by the local councils is to provide public Wi-Fi from different spaces of the villages, such as the town hall building, the main square, bars, or libraries, thus enabling the service to reach the greatest number of people. This is also the purpose of European Commission with WIFI4EU, of which some of them have been beneficiaries. However, most of the municipalities in the surveys claim to have just one space with free WIFI, hindering people from connecting easily and at any time.
The second part of the survey evaluated which sectors have been most affected, what the internet success stories have been, and what government actions they consider to be necessary. Given the amount of public value it can create, internet service can be seen as a public good that is required to provide other public services, as e-health and e-administration [
15]. Likewise, the most affected sectors by the lack of internet are those that are essential for society, such as administration and health. Mobility restrictions due to the Covid-19 pandemic have left the challenge of technologies in rural areas in a tight spot, as they have to face most of the activities. Certainly, according to local agents themselves, both teleworking and e-commerce have meant an opportunity for rural areas, although 15% of the municipalities detected inconveniences in the neighbours when continuing in this direction. Usually, there is bad practice by private companies in these areas when it comes to solving connection and speed problems. Therefore, the need for public-private collaboration in order to avoid this situation and the stigma suffered by rural areas is stressed.
The theoretical implications as to how the access to the internet affects rural areas are strongly confirmed by the rural reality, although the findings add more evidence highlighting the implication of Covid-19 on the digital divide: the UN consider this service to be a basic human right, but it has yet to be acheived in rural areas. The findings confirm the need for internet access as a basic service (such as water or electricity) that reaches the total population; new life trends on teleworking and e-commerce aspire to solve another problem: depopulation; it also confirmed the theory related to the role of local government, and the implications of embodying and promoting good governance.
While this research draws from a sample of 71 inland municipalities, its insights are, nonetheless, valuable in identifying the existing connectivity issues faced in the inland region of Valencia. This research has practical implications that should be considered: firstly, there is a need to reconceive the current policy approach to internet access. Greater rural digital inclusion may be achieved by focusing on connectivity as a public interest goal, targeting aims to suit local contexts, and implementing participatory digital government practices. Secondly, internet access in rural areas has to consider the main stakeholders, since it not only depends on the installation (data provided by the companies) but also on the reach and coverage at all points. This also requires that inhabitants in rural areas are updated through digital training. Thirdly, local agents are the biggest drivers of local initiatives and strategies, so they need support and collaboration to be so. Fourthly, and most importantly, both teleworking and e-commerce provide an opportunity to attract the population and revitalize the local economy in rural areas, which requires good internet access, along with everything it implies.


