Abstract
This study aims to validate the sustainable total resource management measures and provide a hierarchical structure to manage the medical resources for the healthcare industry in Thailand. Prior studies have failed to deal with the valid attributes and to present a theoretical hierarchical structure. The Thailand healthcare industry faces medical resource depletion in the current pandemic outbreak. To address these gaps, this study proposes a fuzzy Delphi method to screen out the less important attributes in order to enhance the validity of measures. Fuzzy interpretive structural modelling transfers the complex interrelationships into a hierarchical structure and provides the direction for practical improvement. The result shows that green human resources practices, collaboration in supply chain networks, analysis and knowledge management, and technology innovation are all important aspects of the hierarchical structure for practical improvement. The linkage criteria are (1) green ability, (2) green motivation, (3) operational efficiency, (4) environmental regulation, and (5) energy conservation. The theoretical and managerial implications are subsequently discussed.
1. Introduction
The emergence of an unknown pneumonia etiology known as the novel coronavirus outbreak (COVID-19) caused an enormous number of deaths due to respiratory failure [1,2]. The positive cases spread in 216 countries rapidly. Several studies have provided potential evidence of medical resource shortage and the massive volume of waste generated, leading to many countries exceeding their healthcare capacity, as well as other environmental issues [3]. Thailand had the first imported case from China and the thousands of subsequent confirmed cases have resulted in the extra demand for medical resources while also increasing the generation of healthcare waste [4,5]. However, Thailand’s healthcare industry lacks a method of measurement to use for this current outbreak in order to deal with the management of their resources. This study emphasizes the urgency to launch a sustainable total resource management (STRM) to manage the resource allocation and improve sustainability.
STRM refers to a systematic management architecture which incorporates all resources, partners, and design in the firms’ value-add chain to enhance productivity and the effectiveness of resource utilization [6]. For instance, Choi et al. [7] recognized that total resource efficiency needs to be sustainable in terms of consuming less resources and producing fewer waste, while offering an equivalent, or added, value of products/services. Jomthanachai et al. [8] argued that efficiency-based total resource management is comparative to sustainability by conveying the magnitudes of sustainable resource efficiency transition such as redesign, recycle, reduce, reuse, remanufacture, and by-product synergy. The STRM is needs to be emphasized in order to enhance the resource utilization and firm performance [9,10]. Bringezu and Bleischwitz [11] presented sustainable resource management as utilizing the natural resources system in a coherent manner and maximizing human welfare rather than hampering the living eco-system. In lieu of this, this study proposes STRM should arrange all resources, partners, and designs of the firms’ value-add chain in order to enhance the economic productivity and effectiveness of resource utilization while maximizing social welfare and environmental supports.
Prior studies addressed these issues by taking economic benefits, environmental impact, and society (Triple Bottom Line; TBL) into account in order to achieve effective STRM [10,12,13,14]. Carter and Rogers [15] claimed that firms need to take into account social feedback simultaneously extended the concept using TBL perspectives. Wu et al. [10] proposed to focus on TBL perspectives to extend the sustainable resource management in order to achieve STRM. Namany et al. [9] argued that limited resources and unsustainable consumption can lead to ecological collapse and resource exhaustion. However, the poor utilization of resources as a firm’s under-developed financials disseminates as straggling political modifications, low awareness of public sectors, and extensive trade restrictions, which causes extensive unsustainability as social disruption, mass planning, and environment contamination [16]. Efficient resource consumption is a challenge that obligates firms to rectify their management process and business activities to balance the TBL perspectives [9,13,17]. Despite the vital role STRM plays for the sustainable development of firms, still, there is a lack of proper guidelines and measurement for addressing the STRM. A set of valid measures aims to resolve this challenge and preserves the incentive for firms to be sustainable.
STRM attributes are described as qualitative information but are still absent when assessing valid and significant attributes [5,10,18]. Indeed, the attributes acquire the accurate qualitative information that is necessary to interpret the real situation in order to improve the resource management performance under specific uncertainties. Hence, the fuzzy Delphi method (FDM) and the fuzzy interpretive structural modeling (FISM) method have been used to modify the qualitative data collected from industrial expert groups into quantitative data to inspect the attributing fusion system and propose an effective result [19,20,21]. This study aggregates FDM and FISM to achieve the STRM hierarchical structures. FDM is used to verify the valid attributes whereas FISM is used to handle the interrelationships among the attributes. This study achieves the following objectives:
- To build valid STRM attributes in qualitative information;
- To construct an STRM hierarchical structure under uncertainties;
- To provide a healthcare industry guideline for uncertain situations.
The contributions in this study are presented as follows: (1) Validating the STRM attributes in the context of healthcare industry needs; (2) building an STRM hierarchical structure under uncertainties; and (3) providing the healthcare industry with an improvement guideline for pandemic situations.
This study is presented as follows. The theoretical background, proposed methods, and measurements are presented in Section 2. FDM and FISM are explained in Section 3. Results are discussed in Section 4. Theoretical and managerial implications are shown in Section 5. Conclusions, future studies, and limitations are mentioned in Section 6.
2. Literature Review
This section explains the literature focused on STRM and TBL perspectives. The subsections also present proposed methods and measures.
2.1. Sustainable Total Resources Management
STRM requires specific boundaries and an enhanced understanding of the attributes that can increase the transformation of current resource management systems [22,23]. Leduc and Van Kann [24] argued that available residual social resources gathering would possibly increase STRM efficiency. Indeed, Mousa and Othman [17] proposed that green human resources management is a key point for facilitating sustainable social resources through emphasizing initiative green behavior to achieve ecological influences. Shahzad et al. [18] suggested that corporate social responsibility practices play a role in social resources assimilation to improve business operation and achieve sustainability. Higher operational efficiency of these intangible resources is regarded as a potential determinant of market valuation and resource investments in STRM [25]. Social resources are indicated as a critical perspective to enhance firms’ assessments ability to attain the STRM [26].
The economic resources perspective is extensive and refers to the generation of profits or benefits to support STRM operations [10,16]. Lin et al. [27] proposed firms’ economic resources needs to emphasize performance measures targeting sustainable development. Particularly, Zhou et al. [28] debated fairness, information knowledge, and technology as the main factors to enclose firms’ information and capital alongside the economic performance. Yang and Lin [29] implied that the core strategy to implementing STRM involves supply chain collaboration as important components to achieve sustainability and increases a company’s economic competitiveness. However, the healthcare industry generally ignores sustainable practices of the sector for a number of reasons, such as facilities or medical services quality, to avoid extra expenses [30,31]. Forming an equilibrium between resource utilization and economic development is deemed to be a challenge that obliges firms to contrive responsive business activities that improve their sustainability.
The environmental resources perspective comprises all forms of natural resources, without damaging human health, and tolerating eco-systems [10]. Mousa and Othman [17] argued that applying technology and innovation in STRM can foster environmental values with efficient on-resource utilization and inventory, as well as energy conservation. Song et al. [14] pointed out that sustainable management becomes the important issue to supported environmental preservation and sustainable resource allocation. However, traditional management occupations disregard the natural environment restrictions, and the activities that address ecological influences and resource destruction [13]. Although environmental regulation has contributed to reduce environmental effects and improve resource allocation efficiency, climate change, diminishing resources, and an increase in environmental contamination has grown in line with an STRM approach in practices [32,33,34]. Thus, increasingly precise resource management constraints and embellished environmental issues to sustainable resource utilization and environmental protection are urgent [35]. STRM thorough the perspective of environmental resources is required.
Indeed, Chien et al. [35] revealed that the STRM is necessary to achieve both socio-economic development and environmental sustainability by catalyzing modernizations that support sustainable performance, such as material, production, energy, and human resources. Song et al. [14] argued that effective resource utilization requires STRM to fulfill the firms’ sympathy purposes, improved through sustainable performance and competence. Thus, it is necessary to implement and accomplish an STRM construction for the conforming assessment [6,8,36]. Embracing STRM, the TBL perspective for environmental and social performance improvement, while achieving positive economic benefits, is necessary.
2.2. Proposed Methods
Quantitative and qualitative approaches to analyze optimal STRM have been widely applied in existing studies [9,12,26,37]. Song et al. [14] applied fuzzy decision-making and trial evaluation laboratory to interpret frameworks between sustainable resource management and green innovation. Wu et al. (2019) proposed the application of exploratory factor analysis, a hybrid fuzzy synthetic method, and decision-making and trial evaluation laboratory to assess causal sustainable resource management performance. Moreover, Jomthanachai et al. [8] used a genetic algorithm and data analytics for total resource management to verify material acceptance and improve the verification system efficiency. However, few studies have discussed resource management attributes through linguistic preferences. have Although the aforementioned studies provided optimal solutions for addressing the STRM, few studies examined STRM attributes through linguistic preferences; hierarchical structures were not deliberated in the analytical process, and qualitative information is still not yet utilized to describe the interdependence relationships of attributes.
From this viewpoint, this study proposes a hybrid method where the first phase is applied FDM and FISM into the second phase, constructed around prior studies. The FDM is used to verify the valid attributes inspired by experts’ judgements, while the FISM is used to handle the interdependencies relationship among STRM attributes [14,20]. Specifically, FDM is applied to lessen the uncertainty judgements due to human preferences and possessing qualitative information in order to refine the valid attributes [13,19]. FISM is a proper method for transforming the qualitative data to quantitative data by analyzing interdependence properties to a systematic hierarchical structure [21,29].
2.3. Proposed Attributes
This study proposes a set of attributes, including 3 perspectives and 24 criteria, such as social, economic, and environmental perspectives, presented in Table 1. The social perspective contains green human resources practices which promote sustainable capability and corporate reputation and provide better performance with regards to financial profit and market value performance, as well as a sustainable competitive advantage [17,25,38]. According to this concept, green ability (C1) relates to recruiting future employees who have environmental awareness and allocating environmentally friendly training, as well as motivating employees on participating in green activities by organizing green performance management combined with merit and punishment systems [39,40,41]. Green motivation (C2) applies leadership as a major role in supporting employee creativity [39,40,41]. Green opportunity (C3) refers to workplace creativity as a significant environment for developing company performance through innovative ideas [38,41]. Green training and involvement (C4) relate to merit and capabilities systems which increase company performance and strengthen employees’ responsibility towards environment [38,42]. Green performance management and compensation (C5) is a merit and controlling system which enhances employee usage of the environmental management system [39,43]. In addition, corporate social responsibility to the community (C6) is known as a company’s vision towards society’s prosperity and extra support to non-profit firms [18,44]. Corporate social responsibility to employees (C7) means the responsibility of the company to provide a comfortable workplace and support employees’ higher education and suitable training, along with guarantee employee’s physical and psychological wellbeing [18,45]. Corporate social responsibility to customers (C8) is described as a company’s obligation to maintain customers’ rights, including ethical practices and the achievement of environmental standards [18,46].

Table 1.
Proposed perspectives and criteria.
Economic perspective is the effectiveness of resources management towards sustainable economic growth through quality management and supply chain collaboration [12,29]. Operational efficiency (C9) is a proxy indicator of a company’s operational performance [26]. Analysis and knowledge management (C10) is a main area to drive company performance and developing innovation along with increasing company competitiveness [47,48]. Long-term relationships with supply chain partners (C11) improve the supply chain’s green practice implementation [29,49]. In addition, trust relationships with supply chain partners (C12) encourages supply chain partners to promote their partners’ investment [29,50]. Supervision of supplier performance (C13) affects suppliers’ environmental performance and sets up the foundation for the environmental management system [29,51]. Information and knowledge sharing with supply chain partners (C14) relates to distributing company’s resources, such as knowledge, technology, and information, within supply chain [28,29]. After success establishing quality management and supply chain collaboration, economic resources can be one of the key factors in order to fully achieve STRM.
Environmental perspective identifies a strategy in achieving the efficient STRM that consists of the healthcare inventory control system and green innovation [32,33,52]. The type of healthcare inventory items (C15) involved consists of medicines and surgical and medical supplies, such as syringes, surgical gloves, surgical kits, surgical gown, and medical equipment like X-ray generator, electrocardiography machine, etc. [52,53]. Patient medical conditions (C16) is the daily demand of healthcare resources derived from number of patient arrival, disease, and the length of stay in the hospital [52,53]. Furthermore, physician prescribing behavior (C17) affected the demand of healthcare resources, due to the excessive prescription of physicians [53,54]. The primary issue of inventory items (C18) referred to all medical and surgical supplies needed for patients’ treatment [53,54]. Environmental regulation (C19) involved management procedures to raise higher environmental concern [33,34]. Energy conservation (C20) focused on efficiency energy usage and renewable energy resources for sustainability achievement and organization competitiveness [33,34,55]. Corporate social responsibility to the environment (C21) is the firm’s commitment towards environmental protection by controlling how industrial waste may be disposed and reducing waste emissions [18,56]. Subsequently, guidance and support from regulatory authorities (C22) is urgently needed for issuing supportive policies to evaluate a company’s green performance and lead the path for improvements [29,57]. Consumer demands (C23) is known as the highest motivation for a firm to increase using green practices [29,58]. To manage environmental resources, technological capability (C24) is an empirical factor for driving environmentally friendly innovation [29,59].
3. Method
This section provides the healthcare industrial background and STRM in Thailand along with FDM, FISM, and the analysis procedure.
3.1. Industrial Background
The healthcare industry is the backbone of the frontline fighting against the outbreak pandemic. Currently, Thailand is facing a severe crisis for the whole economic system because of the “lockdown” policy from the government. In addition, Thailand needs to deal with the shortage of medical resources due to sharp demand over all the country and limited power production and acquisition of total resources. In the environmental side, solid waste generation during the pandemic is rapidly and continuously rising, comprising both healthcare and household waste, the main portion of which is from healthcare equipment. Due to the lack of medical supplies and the delay of resource allocation, in local hospitals, the medical personnel have a higher chance to get infected with the virus and work overloaded hours. Among these crises and problems, STRM is becoming one of the keys factors to decrease the effect of the pandemic on society and maintain the balance between proper resources management and reduction of environmental harms.
During pandemic situation, STRM gathers available local and residual resources allocation for social, economic, and environment resources assessment, especially in the healthcare industry. Moreover, medical waste generated is surpassing the healthcare capacity, resulting in the problem of resource management practices. Hence, STRM is necessary to overcome these problems. However, Thailand still needs to improve resource allocation and resource utilization. STRM is critically needed as a solution to solve the resource limitation and environmental burden to fulfill sustainable development goals. This study is dedicated to guiding the policymakers and healthcare firms to achieve sustainability under resource limitation, balancing resources management along with reducing environmental burdens. A group of 10 experts with extensive experience in STRM was approached, including 1 top healthcare manager, 4 doctor experts, and 5 nurse experts for the FDM analysis, and a group of 19 experts in the practical healthcare field to assess in the FISM to construct the hierarchical structure and explore interdependence among the attributes.
3.2. Fuzzy Delphi Method
FDM integrated fuzzy set theory with Delphi method [60]: this method is used to solve the ambiguous from expert perceptions through reducing the questionnaires [61]. Bui et al. [19] expressed that the advantage of this method enables one to shorten the interview time for maintaining the consistency and better expressions for experts to present their perceptions. Thus, FDM is adopted to address the perceptions from converting these qualitative features into computable figures for making the decisions [13].
These perceptions is assessed by number experts as through adopting linguistic terms to present it. Then, the weights of element is , where , and . These linguistic terms need to transform into triangular fuzzy numbers, as seen in Table 2. Later, cut is applied to generate the result.
Table 2.
Linguistic terms transformation for Fuzzy Delphi Method (FDM)
Generally, 0.5 is used for denoting under a common situation. The ranges of between 0 and 1 that uses for presenting the positive or negative perception of experts. The value of is generated as follows:
where is the optimism level of decision maker. Then, adopting as the threshold value to screen out the unnecessary criteria. Once the , the criterion is considered as the necessary criteria; otherwise, it needs to be eliminated.
3.3. Fuzzy Interpretive Structural Modeling
The ISM was first proposed as a systematic analysis tool to precisely find the ultimate interrelationships among specifying criteria through developing a hierarchical structural model [62,63]. In ISM, digraph theory is used to systemize the criteria and their direct linkages. Systemic interrelationships are indicated by using the binary code for presenting each linkage of criteria. However, it neglects to take experts’ judgments into account in the traditional method [19,64]. Thus, this study uses TFN to transfer the linguistic terms from experts’ judgments. The fuzzy ISM approach is presented as follows:
Assuming there are set of criteria and numbers of expert in the assessment group. Experts are requested to evaluate the influence/importance level between and through linguistic terms. These linguistic terms have to transfer into TFNs by contrasting with Table 3. Subsequently, the fuzzy self-interaction assessment matrix is generated as follows:
Table 3.
Corresponding Triangular Fuzzy Numbers (TFN) for Fuzzy Interpretive Structural Modeling (FISM).
These TFNs need to normalize by using the following equations:
where .
The left and right normalized values can be gathered as follows:
The normalized crisp value is computed as below:
The corresponding crisp values matrix based on integrating the crisp values of all experts are generated as follows:
Accordingly, experts are requested to assess the probability by providing a positive number between 0 and 1 [64]. These relationship probabilities between and need to integrate with matrix:
The reachability matrix is calculated as follows:
Once the matrix is obtained, the driving power and dependence power are can be generated through following equations (Wang et al., 2018).
Using the coordinate maps criteria into the interdependence diagram and the intersection point is the average value from the vertical and horizontal axis to separate the diagram into four quadrants. The first quadrant is the linkage quadrant, which possesses strong driving power and dependence power; the criteria fall into this quadrant which have significantly influence to others. The second quadrant is the dependency quadrant due to it having strong dependence power and weak driving power to influence other criteria. The third quadrant is the autonomy quadrant, which comprises both weak driving power and dependence power. The fourth quadrant is called the driving quadrant, which has strong driving power but weak dependence power to affect other criteria.
The threshold values and are used to transfer into binary reachability matrix through applying the equations as below.
The individual binary set and are presented as:
where is the intersection set.
Based on the intersection set , the following equation is used for calculating the number of intersection criteria for developing the structure.
From the bottom to the top, the lowest value is arranged to be at the first level, and the second-lowest value is arranged to be at the second level; then, this step is repeated until all criteria have been arranged into the model.
4. Results
This section provides the scientific results based on the proposed procedures and reveals the important STRM hierarchical structure.
4.1. Fuzzy Delphi Method
From FDM analysis, there are only 24 criteria that passed the threshold value , as shown in Table 4. These remaining criteria are using for further development of the hierarchical structure.
Table 4.
FDM result.
4.2. Fuzzy Interpretive Structural Modelling
In this stage, experts are requested to assess the interrelation level among remaining criteria. Experts’ assessments are conducted to develop the visual structure through converting the linguistic terms into TFNs as presented in Appendix A Table A1. However, these TFNs still need to be made defuzzy and gather the crisp value matrix as Table A2 shown.
The reachability matrix is generated by integrating corresponding crisp values and the probability numbers provided by the expert, as shown in Table A3. The average driving power and dependence power for presenting the columns and rows in reachability matrix are used to generate the interdependence diagram (as Figure 1 presented). The diagram shows that C1, C2, C3, C7, C9, C19, C20, C23, and C24 belong to linkage quadrant; C4, C5, C6, C8, C10, C11, C13, C14, and C21 are located in dependent quadrant; C12, C15, C16, C18, and C22 fallen into autonomous quadrant. However, there is no criterion which falls into the driving quadrant. The criteria located in the linkage quadrant with strong driving and dependence power address the equilibrium of the system.

Figure 1.
Interdependence diagram of the criteria.
Subsequently, the reachability and antecedent matrix need to transfer into binary matrix through using average values of the driving and dependence power . Based on these two, binary reachability and antecedent matrix generate the intersection matrix, as shown in Table A4. The hierarchical structure is constructed by accumulating the frequencies of each criterion in the intersection matrix (as Figure 2 expressed). The hierarchical structure allocates the criteria into the levels. Different levels which represent the different features of STRM, from higher to lower level, are the green human resources practice (A1) aspect, including C3, C4, C8, C9, and C20; level seven refers to collaboration in supply chain network (A2), including C1, C2, C6, C7, C13, and C14; level six refers as analysis and knowledge management (A3), including C10; level five calls technology innovation (A4), including C11 and C24; level four is green performance (A5), including C5; environment management (A6) is in the level three, including C21; environmental regulation (A7) is level two, with C19; and C12, C15, C16, C17, C18, C22, and C23 consist of the last level, which is called the healthcare inventory control system (A8).
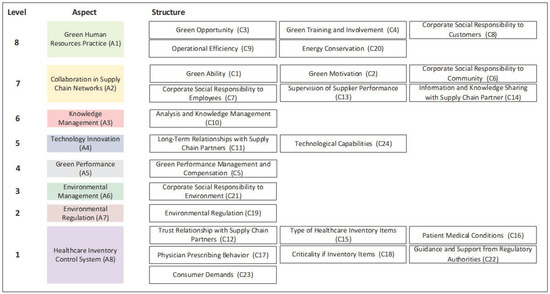
Figure 2.
Sustainable Total Resource Management (STRM) Framework.
5. Implications
Theoretical and managerial implications are addressed in this section.
5.1. Theoretical Implications
The remaining 24 criteria structure the STRM hierarchical framework for healthcare industry. The framework consists of eight aspects, which include green human resources practice (A1), collaboration in supply chain (A2), analysis knowledge management (A3), technology innovation (A4), green performance (A5), environment management (A6), environmental regulation (A7), and healthcare inventory control system (A8).
Green human resources practice (A1) is with the highest frequencies, the influential power comes from green opportunity. Therefore, green training and involvement, corporate social responsibility to customers, and operational efficiency are playing critical roles in maintaining the long-term relationship with customers, as well as enhancing the commitment to green behavior in sustainable resources preventing the environmental harm [18,38,41]. For reaching sustainable goals, green human resources practice needs to align with the green strategy in generating a positive impact to improve the STRM performance [17]. Collaboration in supply chain networks (A2) is the second top level in STRM framework. The supervision of supplier performance and information and knowledge sharing with supply chain partners enables the reduction of disruptions among supply chains for promoting collaborations among the supply chain network [3,51]. This enables one to assist the entire supply chain partners in balancing resource utilization, maintaining the ecological system, maximizing the control efficiency, synergizing the quality management, and strengthening market value and resource investment for enhancing the performance of STRM [25,29].
Moreover, knowledge management (A3) is the third important aspect in approaching the STRM as it increases the firm performance improves and accomplishes the knowledge exploration and exploitation [28]. This aspect fosters innovation and strengthens long term relationships among supply chain partners for better performance and enhancing the firm competitive advantages [47,48]. Therefore, promoting green human resource management is needed, since it helps to improve innovative ideas as an effective instrument to guarantee firm knowledge development and STRM achievement. Technological innovation (A4) generates technological capabilities development and long-term relationships with supply chain partners. The aspect is argued to play an important role in developing STRM, since STRM aims to gain competitive advantage and meet the stakeholder’s requirement [29,65]. Establishing STRM must have clear technological innovation strategies that can support a firm’s sustainability and facilitate smooth management system implementation. Hence, improving technological innovation is mandatory for firms in reinforcing and motivating the firm to overcome disruption and crisis challenges. Overall, STRM performance assessment should make sure technological innovation outcomes are in line with the firm’s sustainability goals, thus balancing the TBL, which should be assessed by an integrated process.
5.2. Managerial Implications
The top five criteria with the highest driving and dependence power were chosen from the linkage quadrant as necessary criteria that have high effect on the overall STRM practice, including green ability (C1), green motivation (C2), operational efficiency (C9), environmental regulation (C19), and energy conservation (C20). These criteria have higher influential effects; thus, they need to be considered as guidelines for making the improvements.
As a result of rapidly environmental damage, the healthcare industry is increasingly concentrating on environmental protection, engaging environmental activities, and promoting green performance to attract customers. However, environmental issues also involve COVID-19 acuteness, such as poor air quality, which is related to an increase in infected cases. Environmental and climate factors help form the landscape within which the pandemic surges. However, environmental regulation in Thailand is showing disadvantages because of a lack of awareness from firms, hardly earning public appreciation or recognition. A catastrophic impact from the crisis, low occurrence probability, and cost-ineffectiveness calculation may lead to a waste of resources. In this context, green ability, green motivation, and environmental regulation play important roles to increase the STRM performance in practice. The green ability considers employee recruitment, choosing employees who have better awareness in preventing environmental damage. Green motivation affected sustainability during the pandemic, as the incentivizing STRM preparation ahead of time assured staff ability and willingness to work during the disruption. Furthermore, environmental regulation can play an important role, as the restrictions and rules to higher management procedures in a firm.
Energy conservation, as a comprehensive application of renewable resources, can affect sustainability and competitiveness in the healthcare industry, through managing energy consumption on raising company performance towards STRM. The criterion is implemented through efficient energy facilities with higher performance, especially in larger hospitals, generate dysfunctions on increasing energy consumption. Energy conservation is based on the care activity of each healthcare industry, which helps to estimate the typical consumption and implement the energy saving program through reducing energy consumption. Thus, this reduces expenditure for the discharge of waste and decreasing environmental damage, in line with environmental regulation to strengthen the care provided, as well as planning for at the local level action during the pandemic.
Boosting operational efficiency generates firms’ competitiveness while pursuing STRM by transforming various resources into value-added outputs. Enhancing the criterion adequately confronts healthcare products/services quality and satisfies concerns regarding the availability of treatment resources. This releases demand and pressure on the operation process during crisis and ensures the imperative competitive advantages through best operations practices, alongside strategic initiatives. Therefore, the firm should provide training courses and enhance its knowledge utilization capability and promote collaboration with supply chain partners to build a competitive advantage for firms through STRM pathway building.
6. Conclusions
Medical resources shortage and massive waste generated, exceeding healthcare capacity and environmental harm, can be properly addressed by STRM. Although prior studies are focused on the environmental perspective, the economic perspective and social perspective are overlooked. Thailand’s healthcare industry urgently needs to create an appropriate tool that is integrated with STRM. Thus, this study proposes at set of 24 criteria under three perspectives for STRM measurement. The proposed methods integrate FDM and FISM to evaluate interdependence and develop the guidelines for improving firms’ resources management. This hybrid method can deepen our understanding of STRM by using the visual analysis to construct hierarchical structure model, hence simplifying complex issues, as well as defining the limitations of previous studies by analyzing the interdependence of the attributes based on linguistic preferences.
The findings are presented that STRM performance is improved by focusing on the important aspects and criteria from hierarchical STRM structure. This study identified that green human resources practices, collaboration in the supply chain network, analysis and knowledge management, and technology innovation are the most influential aspects that can improve STRM implementation in the healthcare industry. Five of the 24 criteria were identified as direct drivers, the highest dependence power, including green ability, green motivation operational efficiency, environmental regulation, and energy conservation. These attributes play important roles in determining the successful STRM in practice. An example of proper STRM implementation is provided, directing decision-makers in the healthcare industry to achieve efficient STRM performance.
This study contributes to our understanding of STRM by identifying potential driver attributes in the interdependence diagram and hierarchical structure model that result in STRM, and provides essential implications from the theoretical and managerial perspectives. This study found that green human resources practices, collaboration in the supply chain network, adequate analysis and knowledge management, and sufficient technological innovation are essential tools to develop successful STRM in Thailand’s healthcare industry. Balancing resources, along with suitable environmental management practices maintained during the pandemic, are urgent for proper resources management. Suitable guidelines are provided for healthcare decision-makers to pay close attention to these attributes, in order to quickly appropriately take control and deal with various situations, and thus, achieve STRM.
This study presents limitations, along with future studies. The first existing limitations are the proposed attributes from selected 24 measurements that were selected from the literature, which are various and different in nature, and identification may be the cause of a limited framework and insufficient entire practice in real complex situations. Second, the collected data were taken only from the urban areas of Thailand during the COVID-19 pandemic situation. Future studies should consider adding more criteria that render it possible to measure to perform a more holistic analysis. Third, future studies must collect data expertise from other countries to more effectively integrate subjective preferences.
Author Contributions
M.-L.T. Conceptualization; original draft Writing; review & editing; P.A.T. original draft writing; N.T. Conceptualization; Resources; review and editing; P.J. Conceptualization; Resources; review and editing; G.C. Conceptualization; Resources; review and editing; R.C.-W.L. original draft writing; K.-J.W. Conceptualization; Resources; review and editing. All authors have read and agreed to the published version of the manuscript.
Funding
The APC of this research was funded by Ministry of Science and Technology, Taiwan under grant number MOST 109-2222-E-011-012.
Acknowledgments
Thank you for the anonymous reviewers and Nitcha Todumrongkul, Patrapapar Juladacha and Gabriella Christianti clolleced the information from the hospitals in Thailand.
Conflicts of Interest
The authors declare no conflict of interest.
Appendix A
Table A1.
Fuzzy self-interaction assessment.
Table A1.
Fuzzy self-interaction assessment.
| C1 | C2 | C3 | C4 | …… | C22 | C23 | C24 | |||||||||||||||
|---|---|---|---|---|---|---|---|---|---|---|---|---|---|---|---|---|---|---|---|---|---|---|
| a | b | c | a | b | c | a | b | c | a | b | c | …… | a | b | c | a | b | c | a | b | c | |
| C1 | 0.3 | 0.5 | 0.7 | 0.3 | 0.5 | 0.7 | 0.5 | 0.7 | 0.9 | 0.5 | 0.7 | 0.9 | …… | 0.5 | 0.7 | 0.9 | 0.1 | 0.3 | 0.5 | 0.3 | 0.5 | 0.7 |
| C2 | 0.3 | 0.5 | 0.7 | 0.3 | 0.5 | 0.7 | 0.7 | 0.9 | 1 | 0.1 | 0.3 | 0.5 | …… | 0.3 | 0.5 | 0.7 | 0 | 0.1 | 0.3 | 0.7 | 0.9 | 1 |
| C3 | 0.3 | 0.5 | 0.7 | 0 | 0.1 | 0.3 | 0.3 | 0.5 | 0.7 | 0.3 | 0.5 | 0.7 | …… | 0.5 | 0.7 | 0.9 | 0.7 | 0.9 | 1.0 | 0.3 | 0.5 | 0.7 |
| C4 | 0.7 | 0.9 | 1 | 0.1 | 0.3 | 0.5 | 0.0 | 0.1 | 0.3 | 0.3 | 0.5 | 0.7 | …… | 0.5 | 0.7 | 0.9 | 0.7 | 0.9 | 1.0 | 0.3 | 0.5 | 0.7 |
| C5 | 0.3 | 0.5 | 0.7 | 0.1 | 0.3 | 0.5 | 0.1 | 0.3 | 0.5 | 0.7 | 0.9 | 1 | …… | 0.1 | 0.3 | 0.5 | 0.1 | 0.3 | 0.5 | 0.5 | 0.7 | 0.9 |
| C6 | 0.1 | 0.3 | 0.5 | 0 | 0.1 | 0.3 | 0.7 | 0.9 | 1 | 0.5 | 0.7 | 0.9 | …… | 0.7 | 0.9 | 1 | 0.7 | 0.9 | 1.0 | 0.3 | 0.5 | 0.7 |
| C7 | 0.7 | 0.9 | 1 | 0.3 | 0.5 | 0.7 | 0 | 0.1 | 0.3 | 0.1 | 0.3 | 0.5 | …… | 0 | 0.1 | 0.3 | 0.3 | 0.5 | 0.7 | 0.5 | 0.7 | 0.9 |
| C8 | 0.1 | 0.3 | 0.5 | 0.3 | 0.5 | 0.7 | 0.1 | 0.3 | 0.5 | 0 | 0.1 | 0.3 | …… | 0.5 | 0.7 | 0.9 | 0.7 | 0.9 | 1.0 | 0.1 | 0.3 | 0.5 |
| C9 | 0.0 | 0.1 | 0.3 | 0 | 0.1 | 0.3 | 0.3 | 0.5 | 0.7 | 0.7 | 0.9 | 1 | …… | 0.7 | 0.9 | 1.0 | 0.7 | 0.9 | 1.0 | 0.1 | 0.3 | 0.5 |
| C10 | 0.7 | 0.9 | 1.0 | 0.1 | 0.3 | 0.5 | 0.7 | 0.9 | 1.0 | 0.5 | 0.7 | 0.9 | …… | 0.5 | 0.7 | 0.9 | 0 | 0.1 | 0.3 | 0.5 | 0.7 | 0.9 |
| C11 | 0.7 | 0.9 | 1.0 | 0 | 0.1 | 0.3 | 0.3 | 0.5 | 0.7 | 0.3 | 0.5 | 0.7 | …… | 0 | 0.1 | 0.3 | 0.1 | 0.3 | 0.5 | 0.5 | 0.7 | 0.9 |
| C12 | 0.7 | 0.9 | 1.0 | 0.5 | 0.7 | 0.9 | 0.3 | 0.5 | 0.7 | 0.7 | 0.9 | 1.0 | …… | 0 | 0.1 | 0.3 | 0 | 0.1 | 0.3 | 0.0 | 0.1 | 0.3 |
| C13 | 0.0 | 0.1 | 0.3 | 0.1 | 0.3 | 0.5 | 0.1 | 0.3 | 0.5 | 0.3 | 0.5 | 0.7 | …… | 0.7 | 0.9 | 1.0 | 0 | 0.1 | 0.3 | 0.5 | 0.7 | 0.9 |
| C14 | 0.0 | 0.1 | 0.3 | 0.7 | 0.9 | 1.0 | 0.7 | 0.9 | 1.0 | 0.1 | 0.3 | 0.5 | …… | 0.5 | 0.7 | 0.9 | 0.3 | 0.5 | 0.7 | 0.1 | 0.3 | 0.5 |
| C15 | 0.7 | 0.9 | 1.0 | 0.7 | 0.9 | 1.0 | 0.3 | 0.5 | 0.7 | 0.1 | 0.3 | 0.5 | …… | 0.1 | 0.3 | 0.5 | 0.3 | 0.5 | 0.7 | 0.1 | 0.3 | 0.5 |
| C16 | 0.0 | 0.1 | 0.3 | 0.3 | 0.5 | 0.7 | 0.7 | 0.9 | 1.0 | 0.3 | 0.5 | 0.7 | …… | 0 | 0.1 | 0.3 | 0.3 | 0.5 | 0.7 | 0.7 | 0.9 | 1.0 |
| C17 | 0.1 | 0.3 | 0.5 | 0 | 0.1 | 0.3 | 0 | 0.1 | 0.3 | 0.7 | 0.9 | 1.0 | …… | 0.7 | 0.9 | 1.0 | 0.7 | 0.9 | 1.0 | 0.1 | 0.3 | 0.5 |
| C18 | 0.5 | 0.7 | 0.9 | 0.7 | 0.9 | 1.0 | 0.7 | 0.9 | 1.0 | 0.3 | 0.5 | 0.7 | …… | 0.7 | 0.9 | 1.0 | 0.1 | 0.3 | 0.5 | 0.3 | 0.5 | 0.7 |
| C19 | 0.5 | 0.7 | 0.9 | 0 | 0.1 | 0.3 | 0.1 | 0.3 | 0.5 | 0.0 | 0.1 | 0.3 | …… | 0.3 | 0.5 | 0.7 | 0.5 | 0.7 | 0.9 | 0.5 | 0.7 | 0.9 |
| C20 | 0.5 | 0.7 | 0.9 | 0 | 0.1 | 0.3 | 0.1 | 0.3 | 0.5 | 0.0 | 0.1 | 0.3 | …… | 0.1 | 0.3 | 0.5 | 0.3 | 0.5 | 0.7 | 0.1 | 0.3 | 0.5 |
| C21 | 0.7 | 0.9 | 1.0 | 0.3 | 0.5 | 0.7 | 0 | 0.1 | 0.3 | 0.1 | 0.3 | 0.5 | …… | 0.7 | 0.9 | 1.0 | 0.7 | 0.9 | 1.0 | 0.0 | 0.1 | 0.3 |
| C22 | 0.0 | 0.1 | 0.3 | 0.5 | 0.7 | 0.9 | 0 | 0.1 | 0.3 | 0.5 | 0.7 | 0.9 | …… | 0.3 | 0.5 | 0.7 | 0.7 | 0.9 | 1.0 | 0.3 | 0.5 | 0.7 |
| C23 | 0.3 | 0.5 | 0.7 | 0.1 | 0.3 | 0.5 | 0.5 | 0.7 | 0.9 | 0.1 | 0.3 | 0.5 | …… | 0.0 | 0.1 | 0.3 | 0.3 | 0.5 | 0.7 | 0.0 | 0.1 | 0.3 |
| C24 | 0.3 | 0.5 | 0.7 | 0.1 | 0.3 | 0.5 | 0.1 | 0.3 | 0.5 | 0.1 | 0.3 | 0.5 | …… | 0.5 | 0.7 | 0.9 | 0.1 | 0.3 | 0.5 | 0.3 | 0.5 | 0.7 |
Table A2.
Crisp value matrix.
Table A2.
Crisp value matrix.
| C1 | C2 | C3 | C4 | C5 | C6 | C7 | C8 | C9 | C10 | C11 | C12 | C13 | C14 | C15 | C16 | C17 | C18 | C19 | C20 | C21 | C22 | C23 | C24 | |
|---|---|---|---|---|---|---|---|---|---|---|---|---|---|---|---|---|---|---|---|---|---|---|---|---|
| C1 | 0.28 | 0.39 | 0.45 | 0.34 | 0.43 | 0.34 | 0.42 | 0.32 | 0.40 | 0.33 | 0.34 | 0.4 | 0.31 | 0.43 | 0.40 | 0.27 | 0.26 | 0.41 | 0.40 | 0.43 | 0.46 | 0.39 | 0.41 | 0.39 |
| C2 | 0.42 | 0.25 | 0.41 | 0.46 | 0.38 | 0.30 | 0.45 | 0.39 | 0.42 | 0.36 | 0.43 | 0.44 | 0.43 | 0.43 | 0.44 | 0.33 | 0.35 | 0.34 | 0.48 | 0.34 | 0.38 | 0.34 | 0.43 | 0.45 |
| C3 | 0.42 | 0.45 | 0.24 | 0.44 | 0.46 | 0.43 | 0.48 | 0.40 | 0.33 | 0.36 | 0.37 | 0.31 | 0.41 | 0.35 | 0.45 | 0.30 | 0.28 | 0.32 | 0.42 | 0.39 | 0.43 | 0.44 | 0.51 | 0.44 |
| C4 | 0.44 | 0.42 | 0.32 | 0.25 | 0.33 | 0.34 | 0.42 | 0.37 | 0.31 | 0.39 | 0.40 | 0.36 | 0.32 | 0.46 | 0.39 | 0.32 | 0.30 | 0.29 | 0.46 | 0.44 | 0.44 | 0.40 | 0.37 | 0.40 |
| C5 | 0.38 | 0.31 | 0.40 | 0.46 | 0.25 | 0.33 | 0.48 | 0.31 | 0.34 | 0.40 | 0.35 | 0.28 | 0.37 | 0.37 | 0.30 | 0.31 | 0.25 | 0.36 | 0.31 | 0.34 | 0.43 | 0.38 | 0.47 | 0.47 |
| C6 | 0.37 | 0.42 | 0.41 | 0.39 | 0.39 | 0.26 | 0.35 | 0.38 | 0.35 | 0.38 | 0.39 | 0.36 | 0.42 | 0.40 | 0.38 | 0.28 | 0.32 | 0.34 | 0.36 | 0.45 | 0.41 | 0.42 | 0.41 | 0.41 |
| C7 | 0.48 | 0.42 | 0.35 | 0.41 | 0.43 | 0.34 | 0.26 | 0.33 | 0.34 | 0.30 | 0.5 | 0.42 | 0.37 | 0.50 | 0.38 | 0.33 | 0.31 | 0.40 | 0.37 | 0.38 | 0.35 | 0.33 | 0.36 | 0.38 |
| C8 | 0.38 | 0.30 | 0.43 | 0.39 | 0.38 | 0.38 | 0.41 | 0.23 | 0.36 | 0.40 | 0.35 | 0.45 | 0.47 | 0.39 | 0.44 | 0.34 | 0.44 | 0.32 | 0.32 | 0.39 | 0.32 | 0.43 | 0.36 | 0.37 |
| C9 | 0.35 | 0.34 | 0.36 | 0.35 | 0.33 | 0.47 | 0.45 | 0.37 | 0.23 | 0.40 | 0.34 | 0.39 | 0.39 | 0.30 | 0.41 | 0.35 | 0.31 | 0.42 | 0.37 | 0.42 | 0.43 | 0.45 | 0.45 | 0.45 |
| C10 | 0.45 | 0.37 | 0.42 | 0.46 | 0.41 | 0.37 | 0.39 | 0.37 | 0.24 | 0.24 | 0.44 | 0.34 | 0.34 | 0.40 | 0.38 | 0.44 | 0.39 | 0.38 | 0.37 | 0.40 | 0.39 | 0.43 | 0.44 | 0.46 |
| C11 | 0.45 | 0.41 | 0.42 | 0.43 | 0.38 | 0.36 | 0.40 | 0.43 | 0.37 | 0.40 | 0.26 | 0.44 | 0.35 | 0.40 | 0.33 | 0.34 | 0.24 | 0.28 | 0.31 | 0.30 | 0.32 | 0.33 | 0.35 | 0.37 |
| C12 | 0.49 | 0.37 | 0.30 | 0.28 | 0.32 | 0.36 | 0.36 | 0.32 | 0.33 | 0.30 | 0.39 | 0.27 | 0.31 | 0.47 | 0.38 | 0.40 | 0.29 | 0.26 | 0.28 | 0.33 | 0.38 | 0.42 | 0.20 | 0.27 |
| C13 | 0.40 | 0.37 | 0.41 | 0.37 | 0.35 | 0.34 | 0.43 | 0.31 | 0.36 | 0.39 | 0.43 | 0.35 | 0.26 | 0.42 | 0.33 | 0.34 | 0.33 | 0.32 | 0.36 | 0.37 | 0.46 | 0.44 | 0.36 | 0.40 |
| C14 | 0.34 | 0.40 | 0.37 | 0.37 | 0.40 | 0.35 | 0.29 | 0.37 | 0.34 | 0.37 | 0.41 | 0.37 | 0.33 | 0.30 | 0.35 | 0.33 | 0.41 | 0.31 | 0.37 | 0.37 | 0.42 | 0.37 | 0.38 | 0.42 |
| C15 | 0.45 | 0.39 | 0.39 | 0.40 | 0.31 | 0.25 | 0.42 | 0.41 | 0.34 | 0.41 | 0.24 | 0.30 | 0.39 | 0.27 | 0.30 | 0.47 | 0.34 | 0.45 | 0.35 | 0.28 | 0.32 | 0.28 | 0.32 | 0.32 |
| C16 | 0.31 | 0.29 | 0.28 | 0.33 | 0.26 | 0.27 | 0.42 | 0.30 | 0.25 | 0.30 | 0.32 | 0.26 | 0.40 | 0.32 | 0.56 | 0.30 | 0.48 | 0.35 | 0.33 | 0.25 | 0.31 | 0.30 | 0.31 | 0.36 |
| C17 | 0.26 | 0.22 | 0.24 | 0.33 | 0.19 | 0.35 | 0.31 | 0.34 | 0.28 | 0.30 | 0.25 | 0.27 | 0.24 | 0.33 | 0.46 | 0.42 | 0.29 | 0.44 | 0.34 | 0.24 | 0.19 | 0.27 | 0.23 | 0.24 |
| C18 | 0.29 | 0.36 | 0.29 | 0.32 | 0.30 | 0.26 | 0.36 | 0.27 | 0.29 | 0.32 | 0.26 | 0.23 | 0.20 | 0.35 | 0.48 | 0.42 | 0.43 | 0.29 | 0.26 | 0.31 | 0.24 | 0.36 | 0.29 | 0.30 |
| C19 | 0.42 | 0.45 | 0.44 | 0.43 | 0.38 | 0.37 | 0.43 | 0.36 | 0.39 | 0.25 | 0.25 | 0.30 | 0.39 | 0.35 | 0.29 | 0.35 | 0.31 | 0.34 | 0.29 | 0.47 | 0.47 | 0.33 | 0.28 | 0.31 |
| C20 | 0.48 | 0.36 | 0.42 | 0.39 | 0.38 | 0.38 | 0.38 | 0.37 | 0.41 | 0.43 | 0.29 | 0.38 | 0.35 | 0.36 | 0.31 | 0.28 | 0.20 | 0.43 | 0.51 | 0.28 | 0.41 | 0.39 | 0.39 | 0.38 |
| C21 | 0.41 | 0.38 | 0.46 | 0.44 | 0.43 | 0.39 | 0.40 | 0.28 | 0.35 | 0.36 | 0.25 | 0.34 | 0.36 | 0.40 | 0.34 | 0.26 | 0.19 | 0.3 | 0.36 | 0.36 | 0.28 | 0.42 | 0.43 | 0.43 |
| C22 | 0.36 | 0.35 | 0.3 | 0.4 | 0.33 | 0.29 | 0.39 | 0.37 | 0.39 | 0.34 | 0.30 | 0.31 | 0.30 | 0.43 | 0.31 | 0.41 | 0.33 | 0.24 | 0.45 | 0.43 | 0.33 | 0.28 | 0.38 | 0.39 |
| C23 | 0.43 | 0.45 | 0.38 | 0.32 | 0.38 | 0.35 | 0.38 | 0.34 | 0.36 | 0.38 | 0.30 | 0.35 | 0.34 | 0.42 | 0.33 | 0.37 | 0.36 | 0.22 | 0.32 | 0.43 | 0.39 | 0.38 | 0.27 | 0.33 |
| C24 | 0.40 | 0.46 | 0.34 | 0.34 | 0.35 | 0.34 | 0.31 | 0.34 | 0.39 | 0.39 | 0.31 | 0.28 | 0.44 | 0.44 | 0.34 | 0.45 | 0.20 | 0.25 | 0.40 | 0.38 | 0.32 | 0.43 | 0.41 | 0.38 |
Table A3.
Reachability matrix.
Table A3.
Reachability matrix.
| C1 | C2 | C3 | C4 | C5 | C6 | C7 | C8 | C9 | C10 | C11 | C12 | C13 | C14 | C15 | C16 | C17 | C18 | C19 | C20 | C21 | C22 | C23 | C24 | ||
|---|---|---|---|---|---|---|---|---|---|---|---|---|---|---|---|---|---|---|---|---|---|---|---|---|---|
| C1 | 10.70 | 10.70 | 10.20 | 9.80 | 10.10 | 9.70 | 10.20 | 9.70 | 10.60 | 9.80 | 9.70 | 10.10 | 10.00 | 9.80 | 9.50 | 9.60 | 9.10 | 9.80 | 10.50 | 10.50 | 9.40 | 9.60 | 10.30 | 10.40 | 10.00 |
| C2 | 11.30 | 11.30 | 10.80 | 10.20 | 10.60 | 10.20 | 10.70 | 10.10 | 11.10 | 10.20 | 10.20 | 10.60 | 10.50 | 10.30 | 10.00 | 9.90 | 9.60 | 10.30 | 11.10 | 10.90 | 10.10 | 10.10 | 10.80 | 10.80 | 10.50 |
| C3 | 11.20 | 11.20 | 10.70 | 10.20 | 10.50 | 10.30 | 10.60 | 10.10 | 11.10 | 10.20 | 10.30 | 10.60 | 10.60 | 10.20 | 10.00 | 10.00 | 9.50 | 10.10 | 11.10 | 10.90 | 9.90 | 10.10 | 10.80 | 10.70 | 10.50 |
| C4 | 10.60 | 10.60 | 10.30 | 9.80 | 10.00 | 9.70 | 10.10 | 9.60 | 10.60 | 9.70 | 9.60 | 10.00 | 10.00 | 9.70 | 9.40 | 9.50 | 9.00 | 9.70 | 10.40 | 10.40 | 9.40 | 9.60 | 10.20 | 10.30 | 9.90 |
| C5 | 10.30 | 10.40 | 9.80 | 9.30 | 9.70 | 9.40 | 9.90 | 9.30 | 10.20 | 9.40 | 9.40 | 9.80 | 9.60 | 9.40 | 9.20 | 9.20 | 8.80 | 9.30 | 10.20 | 10.00 | 9.30 | 9.30 | 9.80 | 9.90 | 9.60 |
| C6 | 10.80 | 10.70 | 10.30 | 9.80 | 10.20 | 9.70 | 10.20 | 9.80 | 10.70 | 9.80 | 9.80 | 10.20 | 10.00 | 9.80 | 9.50 | 9.60 | 9.10 | 9.80 | 10.60 | 10.40 | 9.50 | 9.60 | 10.30 | 10.40 | 10.00 |
| C7 | 10.70 | 10.70 | 10.30 | 9.80 | 10.10 | 9.70 | 10.20 | 9.60 | 10.60 | 9.80 | 9.70 | 10.20 | 10.00 | 9.60 | 9.60 | 9.50 | 9.10 | 9.90 | 10.50 | 10.40 | 9.50 | 9.70 | 10.30 | 10.40 | 10.00 |
| C8 | 10.70 | 10.80 | 10.30 | 9.70 | 10.10 | 9.70 | 10.10 | 9.80 | 10.60 | 9.80 | 9.70 | 10.10 | 10.00 | 9.80 | 9.50 | 9.60 | 9.10 | 9.90 | 10.60 | 10.40 | 9.60 | 9.70 | 10.40 | 10.50 | 10.00 |
| C9 | 10.70 | 10.80 | 10.40 | 9.80 | 10.20 | 9.90 | 10.30 | 9.80 | 10.80 | 9.90 | 9.80 | 10.20 | 10.20 | 10.00 | 9.70 | 9.70 | 9.20 | 9.80 | 10.70 | 10.60 | 9.60 | 9.80 | 10.40 | 10.40 | 10.10 |
| C10 | 11.00 | 11.00 | 10.60 | 10.10 | 10.30 | 10.20 | 10.50 | 10.00 | 11.00 | 10.10 | 10.10 | 10.50 | 10.30 | 10.00 | 10.00 | 9.80 | 9.50 | 10.20 | 10.90 | 10.70 | 10.00 | 10.10 | 10.60 | 10.60 | 10.30 |
| C11 | 10.30 | 10.30 | 9.80 | 9.30 | 9.70 | 9.40 | 9.90 | 9.40 | 10.30 | 9.40 | 9.30 | 9.70 | 9.70 | 9.40 | 9.20 | 9.10 | 8.80 | 9.30 | 10.20 | 10.10 | 9.20 | 9.40 | 9.90 | 10.00 | 9.60 |
| C12 | 9.50 | 9.50 | 9.20 | 8.70 | 8.90 | 8.70 | 9.10 | 8.60 | 9.50 | 8.70 | 8.70 | 9.10 | 8.90 | 8.70 | 8.50 | 8.50 | 8.10 | 8.70 | 9.40 | 9.40 | 8.50 | 8.80 | 9.30 | 9.30 | 8.90 |
| C13 | 10.60 | 10.60 | 10.20 | 9.70 | 10.00 | 9.70 | 10.10 | 9.60 | 10.50 | 9.60 | 9.60 | 10.00 | 9.90 | 9.70 | 9.40 | 9.40 | 9.00 | 9.60 | 10.40 | 10.30 | 9.50 | 9.60 | 10.10 | 10.30 | 9.90 |
| C14 | 10.40 | 10.40 | 10.00 | 9.50 | 9.80 | 9.50 | 9.80 | 9.40 | 10.40 | 9.50 | 9.40 | 9.80 | 9.70 | 9.50 | 9.30 | 9.30 | 8.80 | 9.60 | 10.30 | 10.10 | 9.30 | 9.40 | 9.90 | 10.00 | 9.70 |
| C15 | 9.80 | 10.00 | 9.60 | 8.90 | 9.30 | 9.10 | 9.50 | 9.10 | 10.00 | 9.10 | 9.20 | 9.40 | 9.30 | 9.10 | 8.90 | 8.90 | 8.50 | 9.10 | 9.80 | 9.80 | 8.90 | 9.00 | 9.50 | 9.60 | 9.30 |
| C16 | 9.30 | 9.30 | 9.00 | 8.50 | 8.80 | 8.40 | 8.70 | 8.40 | 9.10 | 8.50 | 8.50 | 8.70 | 8.70 | 8.60 | 8.30 | 8.30 | 7.90 | 8.60 | 9.20 | 9.00 | 8.30 | 8.40 | 9.00 | 8.90 | 8.70 |
| C17 | 8.20 | 8.30 | 8.00 | 7.50 | 7.90 | 7.50 | 7.90 | 7.40 | 8.20 | 7.60 | 7.50 | 7.80 | 7.70 | 7.60 | 7.50 | 7.50 | 7.20 | 7.60 | 8.10 | 8.10 | 7.30 | 7.60 | 8.00 | 8.00 | 7.70 |
| C18 | 8.80 | 8.80 | 8.50 | 8.20 | 8.30 | 8.10 | 8.30 | 8.10 | 8.70 | 8.10 | 8.00 | 8.40 | 8.30 | 8.10 | 7.90 | 7.90 | 7.60 | 8.20 | 8.70 | 8.60 | 7.90 | 8.10 | 8.60 | 8.60 | 8.30 |
| C19 | 10.20 | 10.10 | 9.90 | 9.30 | 9.60 | 9.40 | 9.80 | 9.40 | 10.30 | 9.50 | 9.40 | 9.70 | 9.50 | 9.30 | 9.10 | 9.20 | 8.70 | 9.40 | 10.10 | 10.10 | 9.20 | 9.40 | 9.90 | 10.00 | 9.60 |
| C20 | 10.60 | 10.70 | 10.30 | 9.60 | 10.10 | 9.80 | 10.30 | 9.60 | 10.60 | 9.70 | 9.70 | 10.10 | 10.00 | 9.70 | 9.50 | 9.50 | 9.10 | 9.70 | 10.50 | 10.60 | 9.50 | 9.60 | 10.10 | 10.40 | 10.00 |
| C21 | 10.30 | 10.30 | 9.70 | 9.30 | 9.60 | 9.30 | 9.80 | 9.30 | 10.20 | 9.40 | 9.30 | 9.80 | 9.60 | 9.30 | 9.10 | 9.10 | 8.70 | 9.30 | 10.10 | 10.10 | 9.20 | 9.30 | 9.80 | 10.00 | 9.60 |
| C22 | 10.00 | 10.00 | 9.60 | 9.10 | 9.40 | 9.10 | 9.50 | 9.00 | 9.90 | 9.20 | 9.00 | 9.40 | 9.30 | 9.00 | 8.90 | 8.90 | 8.50 | 9.20 | 9.80 | 9.70 | 8.90 | 9.10 | 9.60 | 9.70 | 9.30 |
| C23 | 10.10 | 10.10 | 9.80 | 9.30 | 9.50 | 9.30 | 9.70 | 9.30 | 10.10 | 9.30 | 9.20 | 9.60 | 9.50 | 9.30 | 9.00 | 9.00 | 8.60 | 9.30 | 10.00 | 10.00 | 9.00 | 9.30 | 9.80 | 9.90 | 9.50 |
| C24 | 10.30 | 10.30 | 9.80 | 9.40 | 9.70 | 9.40 | 9.90 | 9.30 | 10.30 | 9.40 | 9.30 | 9.90 | 9.60 | 9.30 | 9.10 | 9.20 | 8.70 | 9.40 | 10.20 | 10.10 | 9.20 | 9.30 | 9.90 | 10.00 | 9.60 |
| 10.30 | 10.30 | 9.90 | 9.40 | 9.70 | 9.40 | 9.80 | 9.30 | 10.20 | 9.40 | 9.30 | 9.70 | 9.60 | 9.40 | 9.20 | 9.20 | 8.80 | 9.40 | 10.10 | 10.10 | 9.20 | 9.30 | 9.90 | 10.00 |
Table A4.
Intersection matrix.
Table A4.
Intersection matrix.
| C1 | C2 | C3 | C4 | C5 | C6 | C7 | C8 | C9 | C10 | C11 | C12 | C13 | C14 | C15 | C16 | C17 | C18 | C19 | C20 | C21 | C22 | C23 | C24 | Frequency | Level | |
|---|---|---|---|---|---|---|---|---|---|---|---|---|---|---|---|---|---|---|---|---|---|---|---|---|---|---|
| C1 | 1 | 1 | 1 | 0 | 1 | 0 | 1 | 0 | 1 | 0 | 0 | 1 | 0 | 0 | 0 | 0 | 0 | 0 | 1 | 1 | 0 | 0 | 1 | 1 | 11 | 7 |
| C2 | 1 | 1 | 1 | 0 | 1 | 0 | 1 | 0 | 1 | 0 | 0 | 1 | 0 | 0 | 0 | 0 | 0 | 0 | 1 | 1 | 0 | 0 | 1 | 1 | 11 | 7 |
| C3 | 1 | 1 | 1 | 0 | 1 | 0 | 1 | 0 | 1 | 0 | 0 | 1 | 1 | 0 | 0 | 0 | 0 | 0 | 1 | 1 | 0 | 0 | 1 | 1 | 12 | 8 |
| C4 | 1 | 1 | 1 | 0 | 1 | 0 | 1 | 0 | 1 | 0 | 0 | 1 | 1 | 0 | 0 | 0 | 0 | 0 | 1 | 1 | 0 | 0 | 1 | 1 | 12 | 8 |
| C5 | 1 | 1 | 0 | 0 | 1 | 0 | 1 | 0 | 0 | 0 | 0 | 1 | 1 | 0 | 0 | 0 | 0 | 0 | 1 | 0 | 0 | 0 | 0 | 0 | 7 | 4 |
| C6 | 1 | 1 | 1 | 0 | 1 | 0 | 1 | 0 | 1 | 0 | 0 | 1 | 0 | 0 | 0 | 0 | 0 | 0 | 1 | 1 | 0 | 0 | 1 | 1 | 11 | 7 |
| C7 | 1 | 1 | 1 | 0 | 1 | 0 | 1 | 0 | 1 | 0 | 0 | 1 | 0 | 0 | 0 | 0 | 0 | 0 | 1 | 1 | 0 | 0 | 1 | 1 | 11 | 7 |
| C8 | 1 | 1 | 1 | 0 | 1 | 0 | 1 | 0 | 1 | 0 | 0 | 1 | 1 | 0 | 0 | 0 | 0 | 0 | 1 | 1 | 0 | 0 | 1 | 1 | 12 | 8 |
| C9 | 1 | 1 | 1 | 0 | 1 | 0 | 1 | 0 | 1 | 0 | 0 | 1 | 1 | 0 | 0 | 0 | 0 | 0 | 1 | 1 | 0 | 0 | 1 | 1 | 12 | 8 |
| C10 | 1 | 1 | 1 | 0 | 0 | 0 | 1 | 0 | 1 | 0 | 0 | 1 | 0 | 0 | 0 | 0 | 0 | 0 | 1 | 1 | 0 | 0 | 1 | 1 | 10 | 6 |
| C11 | 1 | 1 | 0 | 0 | 1 | 0 | 1 | 0 | 1 | 0 | 0 | 0 | 1 | 0 | 0 | 0 | 0 | 0 | 1 | 1 | 0 | 0 | 0 | 1 | 9 | 5 |
| C12 | 0 | 0 | 0 | 0 | 0 | 0 | 0 | 0 | 0 | 0 | 0 | 0 | 0 | 0 | 0 | 0 | 0 | 0 | 0 | 0 | 0 | 0 | 0 | 0 | 0 | 1 |
| C13 | 1 | 1 | 1 | 0 | 1 | 0 | 1 | 0 | 1 | 0 | 0 | 1 | 0 | 0 | 0 | 0 | 0 | 0 | 1 | 1 | 0 | 0 | 1 | 1 | 11 | 7 |
| C14 | 1 | 1 | 1 | 0 | 1 | 0 | 1 | 0 | 1 | 0 | 0 | 1 | 0 | 0 | 0 | 0 | 0 | 0 | 1 | 1 | 0 | 0 | 1 | 1 | 11 | 7 |
| C15 | 0 | 0 | 0 | 0 | 0 | 0 | 0 | 0 | 0 | 0 | 0 | 0 | 0 | 0 | 0 | 0 | 0 | 0 | 0 | 0 | 0 | 0 | 0 | 0 | 0 | 1 |
| C16 | 0 | 0 | 0 | 0 | 0 | 0 | 0 | 0 | 0 | 0 | 0 | 0 | 0 | 0 | 0 | 0 | 0 | 0 | 0 | 0 | 0 | 0 | 0 | 0 | 0 | 1 |
| C17 | 0 | 0 | 0 | 0 | 0 | 0 | 0 | 0 | 0 | 0 | 0 | 0 | 0 | 0 | 0 | 0 | 0 | 0 | 0 | 0 | 0 | 0 | 0 | 0 | 0 | 1 |
| C18 | 0 | 0 | 0 | 0 | 0 | 0 | 0 | 0 | 0 | 0 | 0 | 0 | 0 | 0 | 0 | 0 | 0 | 0 | 0 | 0 | 0 | 0 | 0 | 0 | 0 | 1 |
| C19 | 0 | 0 | 1 | 0 | 0 | 0 | 1 | 0 | 1 | 0 | 0 | 0 | 0 | 0 | 0 | 0 | 0 | 0 | 0 | 1 | 0 | 0 | 0 | 0 | 4 | 2 |
| C20 | 1 | 1 | 1 | 0 | 1 | 0 | 1 | 0 | 1 | 0 | 0 | 1 | 1 | 0 | 0 | 0 | 0 | 0 | 1 | 1 | 0 | 0 | 1 | 1 | 12 | 8 |
| C21 | 0 | 0 | 0 | 0 | 0 | 0 | 1 | 0 | 0 | 0 | 0 | 1 | 1 | 0 | 0 | 0 | 0 | 0 | 0 | 1 | 0 | 0 | 0 | 1 | 5 | 3 |
| C22 | 0 | 0 | 0 | 0 | 0 | 0 | 0 | 0 | 0 | 0 | 0 | 0 | 0 | 0 | 0 | 0 | 0 | 0 | 0 | 0 | 0 | 0 | 0 | 0 | 0 | 1 |
| C23 | 0 | 0 | 0 | 0 | 0 | 0 | 0 | 0 | 0 | 0 | 0 | 0 | 0 | 0 | 0 | 0 | 0 | 0 | 0 | 0 | 0 | 0 | 0 | 0 | 0 | 1 |
| C24 | 1 | 1 | 0 | 0 | 0 | 0 | 1 | 0 | 1 | 0 | 0 | 1 | 0 | 0 | 0 | 0 | 0 | 0 | 1 | 1 | 0 | 0 | 1 | 1 | 9 | 5 |
References
- Zambrano-Monserrate, M.A.; Ruano, M.A.; Sanchez-Alcalde, L. Indirect effects of COVID-19 on the environment. Sci. Total Environ. 2020, 728, 138813. [Google Scholar] [CrossRef] [PubMed]
- World Health Organization. Considerations for Implementing Mass Treatment, Active Case-Finding and Population-Based Surveys for Neglected Tropical Diseases in the Context of the COVID-19 Pandemic: Interim Guidance, 27 July 2020 (No. WHO/2019-nCoV/neglected_Tropical_Diseases/2020.1); World Health Organization: Geneva, Switzerland, 2020. [Google Scholar]
- Rowan, N.J.; Laffey, J.G. Challenges and solutions for addressing critical shortage of supply chain for personal and protective equipment (PPE) arising from Coronavirus disease (COVID19) pandemic–Case study from the Republic of Ireland. Sci. Total Environ. 2020, 725, 138532. [Google Scholar] [CrossRef] [PubMed]
- Ng, K.S.; Yang, A.; Yakovleva, N. Sustainable waste management through synergistic utilisation of commercial and domestic organic waste for efficient resource recovery and valorisation in the UK. J. Clean. Prod. 2019, 227, 248–262. [Google Scholar] [CrossRef]
- Hinjoy, S.; RoyceTsukayama Chuxmun, T.; Masunglong, W.; Sidet, C.; Kleeblumjeak Iamsirithaworn, S. Self-assessment of the Thai Department of Disease Control’s communication for international response to COVID-19 in the early phase. Int. J. Infect. Dis. 2020, 96, 205–210. [Google Scholar] [CrossRef]
- Chien, C.F.; Hong, T.Y.; Guo, H.Z. An empirical study for smart production for TFT-LCD to empower Industry 3.5. J. Chin. Inst. Eng. 2017, 40, 552–561. [Google Scholar] [CrossRef]
- Choi, J.K.; Thangamani, D.; Kissock, K. A systematic methodology for improving resource efficiency in small and medium-sized enterprises. Resour. Conserv. Recycl. 2019, 147, 19–27. [Google Scholar] [CrossRef]
- Jomthanachai, S.; Rattanamanee, W.; Sinthavalai, R.; Wong, W.P. The application of genetic algorithm and data analytics for total resource management at the firm level. Resour. Conserv. Recycl. 2020, 161, 104985. [Google Scholar] [CrossRef]
- Namany, S.; Al-Ansari, T.; Govindan, R. Sustainable energy, water and food nexus systems: A focused review of decision-making tools efficient resource management and governance. J. Clean. Prod. 2019, 225, 610–626. [Google Scholar] [CrossRef]
- Wu, K.-J.; Tseng, M.L.; Lim, M.K.; Chiu, A.S. Causal sustainable resource management model using a hierarchical structure and linguistic preferences. J. Clean. Prod. 2019, 229, 640–651. [Google Scholar] [CrossRef]
- Bringezu, S.; Bleischwitz, R. (Eds.) Sustainable Resource Management: Global Trends, Visions and Policies; Routledge: Oxon, UK, 2017. [Google Scholar]
- Wu, S.; Li, L.; Li, S. Natural resource abundance, natural resource-oriented industry dependence, and economic growth: Evidence from the provincial level in China. Resour. Conserv. Recycl. 2018, 139, 163–171. [Google Scholar] [CrossRef]
- Lee, C.-H.; Wu, K.-J.; Tseng, M.-L. Resource Management practice through eco-innovation toward sustainable development using qualitative information and quantitative data. J. Clean. Prod. 2018, 202, 120–129. [Google Scholar] [CrossRef]
- Song, M.; Fisher, R.; Kwoh, Y. Technological challenges of green innovation and sustainable resource managemenet with large scale data. Technol. Forecast. Soc. Chang. 2019, 144, 361–368. [Google Scholar] [CrossRef]
- Carter, C.R.; Rogers, D.S. A framework of sustainable supply chain management: Moving toward new theory. Int. J. Phys. Distrib. Logist. Manag. 2008, 35, 360–387. [Google Scholar] [CrossRef]
- Budhwar, P.S.; Varma, A.; Patel, C. Convergence-divergence of HRM in the Asia-Pacific: Context-specific analysis and future research agenda. Hum. Resour. Manag. Rev. 2016, 26, 311–326. [Google Scholar] [CrossRef]
- Mousa, S.K.; Othman, M. The impact of green human resource management practices on sustainable performance in healthcare organisations: A conceptual framework. J. Clean. Prod. 2020, 243, 118595. [Google Scholar] [CrossRef]
- Shahzad, M.; Qu, Y.; Javed, S.A.; Zafar, A.U.; Rehman, S.U. Relation of environment sustainability to CSR and green innovation: A case of Pakitani manufacturing industry. J. Clean. Prod. 2020, 253, 119938. [Google Scholar] [CrossRef]
- Bui, T.D.; Tsai, F.M.; Tseng, M.L.; Ali, M.H. Identifying sustainable solid waste management barriers in practice using the fuzzy Delphi method. Resour. Conserv. Recycl. 2020, 154, 104625. [Google Scholar] [CrossRef]
- Lim, M.K.; Tseng, M.-L.; Tan, K.H.; Bui, T.D. Knowledge management in sustainable supply chain management: Improving performance through an interpretive structural modelling approach. J. Clean. Prod. 2017, 162, 801–816. [Google Scholar] [CrossRef]
- Wang, W.; Liu, X.; Qin, Y.; Huang, J.; Liu, Y. Assessing contributory factors in potential systemic accidents using AcciMap and integrated fuzzy ISM-MICMAC approach. Int. J. Ind. Ergon. 2018, 68, 311–326. [Google Scholar] [CrossRef]
- Pahl-Wostl, C. The implications of complexity for integrated resources management. Environ. Model. Softw. 2007, 22, 561–569. [Google Scholar] [CrossRef]
- Pahl-Wostl, C.; Arthington, A.H.; Bogardi, J.; E Bunn, S.; Hoff, H.; Lebel, L.; Nikitina, E.; A Palmer, M.; Poff, L.N.; Richards, K.; et al. Environmental flows and water governance: Managing sustainable water uses. Curr. Opin. Environ. Sustain. 2013, 5, 341–351. [Google Scholar] [CrossRef]
- Leduc, W.R.; Van Kann, F.M. Spatial planning based on urban energy harvesting toward productive urban regions. J. Clean. Prod. 2013, 39, 180–190. [Google Scholar] [CrossRef]
- Kwon, M.; Lee, C.; Xiao, Y.; McIntosh, W.A. Community currency activities, community attachment, and quality of life: A case study of the Crooked River Alliance of TimeBanks. Time Soc. 2019, 28, 1181–1220. [Google Scholar] [CrossRef]
- Damastuti, E.; Groot, R.D. Effectiveness of community-based mangerove managemenet for sustainable resource use and livelihood support: A case study of four villages in Central Java, Indonesia. J. Environ. Manag. 2017, 203, 510–521. [Google Scholar] [CrossRef]
- Lin, Y.H.; Tseng, M.L. Assessing the competitive priorities within sustainable supply chain management under uncertainty. J. Clean. Prod. 2016, 112, 2133–2144. [Google Scholar] [CrossRef]
- Zhou, M.; Govindan, K.; Xie, X. How fairness perceptions, embeddedness, and knowledge sharing drive green innovation in sustainable supply chains: An equity theory and network perspective to achieve sustainable development goals. J. Clenaer Prod. 2020, 260, 120950. [Google Scholar] [CrossRef]
- Yang, Z.; Lin, Y. The effect of supply chain collaboration on green innovation performance: An interpretive structural modelling analysis. Sustain. Prod. Consum. 2020, 23, 1–10. [Google Scholar] [CrossRef]
- Mbongwe, B.; Mmereki, B.T.; Magashula, A. Healthcare waste management: Current practices in selected healthcare facilities, Botswana. Waste Manag. 2008, 28, 226–233. [Google Scholar] [CrossRef]
- Yellowlees, P.M.; Chorba, K.; Burke Parish, M.; Wynn-Jones, H.; Nafiz, N. Telemedicine can make healthcare greener. Telemed. E-Health 2010, 16, 229–232. [Google Scholar] [CrossRef]
- Asadi, S.; Pourhashemi, S.O.; Nilashi, M.; Abdullah, R.; Samad, S.; Yadegaridehkordi, E.; Razal, N.S. Investigating influence of green innovation on sustainability performance: A case on Malaysia hotel industry. J. Clean. Prod. 2020, 258, 120860. [Google Scholar] [CrossRef]
- Du, W.; Wang, F.; Li, M. Effects of environmental regulation on capacity utilization: Evidence from energy enterprises in China. Ecol. Indic. 2020, 113, 106217. [Google Scholar] [CrossRef]
- Wu, H.; Lina Xu, S.R.; Hao, Y.; Yan, G. How do energy consumption and environmental regulation affect carbon emissions in China? New evidence from a dynamic threshold panel model. Resour. Policy 2020, 67, 101678. [Google Scholar] [CrossRef]
- Chien, C.F.; Tseng, M.L.; Tan, R.R.; Tan, K.; Velek, O. Industry 3.5 for Sustainable Transition and Total Resource Management. Resour. Conserv. Recycl. 2020, 152, 104482. [Google Scholar]
- Tseng, M.L.; Chang, C.H.; Lin, C.W.R.; Wu, K.J.; Chen, Q.; Xia, L.; Xue, B. Future trends and guidance for the triple bottom line and sustainability: A data driven bibliometric analysis. Environ. Sci. Pollut. Res. 2020, 27, 33543–33567. [Google Scholar] [CrossRef]
- Islam, M.; Managi, S. Green growth and pro-environmental behavior: Sustainable resource managemenet using natural capital accounting in India. Resour. Conserv. Recycl. 2019, 145, 126–138. [Google Scholar] [CrossRef]
- Zaid, A.A.; Jaaron, A.A.; Bon, A.T. The impact of green human resource management and green supply chain management practices on sustainable performance: An empirical study. J. Clean. Prod. 2018, 204, 965–979. [Google Scholar] [CrossRef]
- Jia, J.; Liu, H.; Chin, T.; Hu, D. The Continuous Mediating Effects of GHRM on Employees’ Green Passion via Transformational Leadership and Green Creativity. Sustainability 2018, 10, 3237. [Google Scholar] [CrossRef]
- Zhu, Q.; Krikke, H.; Caniels, M.C. Supply chain integration: Value creation through managing inter-organizational learning. Int. J. Oper. Prod. Manag. 2018, 38, 211–229. [Google Scholar] [CrossRef]
- Yu, W.; Chavez, R.; Feng, M.; Wong, C.Y.; Fynes, B. Green human resource management and environmental cooperation: An ability-motivation-opportunity and contingency perspective. Int. J. Prod. Econ. 2020, 219, 224–235. [Google Scholar] [CrossRef]
- Liu, J.; Liu, Y.; Yang, L. Uncovering the influence mechanism between top management support and green procurement: The effect of green training. J. Clean. Prod. 2020, 251, 119674. [Google Scholar] [CrossRef]
- Pham, N.T.; Vo-Thanh, T.; Shahbaz, M.; Huynh, T.L.; Usman, M. Managing environmental challenges: Training as a solution to improve employee green performance. J. Environ. Manag. 2020, 269, 110781. [Google Scholar] [CrossRef] [PubMed]
- Lamb, S.; Jennings, J.; Calain, P. The evolving role of CSR in international development: Evidence from Canadian extractive companies’ involvement in community health initiatives in low-income countries. Extr. Ind. Soc. 2017, 4, 614–621. [Google Scholar] [CrossRef]
- Potdar, B.; Garry, T.; McNeill, L.; Gnoth, J.; Pandey, R.; Mansi, M.; Guthrie, J. Retail employee guardianship behaviour: A phenomenological investigation. J. Retail. Consum. Serv. 2020, 54, 102017. [Google Scholar] [CrossRef]
- Chuah, S.H.-W.; El-Manstrly, D.; Tseng, M.-L.; Ramayah, T. Sustaining customer engagement behavior through corporate social responsibility: The roles of environmental concern and green trust. J. Clean. Prod. 2020, 262, 121348. [Google Scholar] [CrossRef]
- Martins, V.; Rampasso, I.; Anholon, R.; Quelhas, O.; Filho, W.L. Knowledge management in the context of sustainability: Literature review and opportunities for future research. J. Clean. Prod. 2019, 229, 489–500. [Google Scholar] [CrossRef]
- Parast, M.M.; Golmohammadi, D. Quality management in healthcare organizations: Empirical evidence from the baldrige data. Int. J. Prod. Econ. 2019, 216, 133–144. [Google Scholar] [CrossRef]
- Neutzling, D.M.; Land, A.; Seuring, S.; Nascimento, L.F. Linking sustainability-oriented innovation to supply chain relationship integration. J. Clean. Prod. 2018, 172, 3448–3548. [Google Scholar] [CrossRef]
- Singh, A.; Teng, J.T. Enhancing supply chain outcomes through Information Technology and Trust. Comput. Hum. Behav. 2016, 54, 290–300. [Google Scholar] [CrossRef]
- Hawkins, T.G.; Gravier, M.J.; Muir, W.A. The role of supplier performance evaluations in mitigating risk: Assessing evaluation processes and behaviors. Ind. Mark. Manag. 2020, 87, 2–17. [Google Scholar] [CrossRef]
- Saha, E.; Ray, P.K. Modelling and analysis of inventory management systems in healthcare: A review and reflections. Comput. Ind. Eng. 2019, 137, 106051. [Google Scholar] [CrossRef]
- Saedi, S.; Kundakcioglu, O.E.; Henry, A.C. Mitigating the impact of drug shortages for a healthcare facility: An inventory management approach. Eur. J. Oper. Res. 2016, 251, 107–123. [Google Scholar] [CrossRef]
- Biuki, M.; Kazemi, A.; Alinezhad, A. An integrated location-routing-inventory model for sustainable design of a perishable products supply chain network. J. Clean. Prod. 2020, 260, 120842. [Google Scholar] [CrossRef]
- García-Sanz-Calcedo, J.; Gómez-Chaparro, M.; Sanchez-Barroso, G. Electrical and thermal energy in private hospitals: Consumption indicators focused on healthcare activity. Sustain. Cities Soc. 2019, 47, 101482. [Google Scholar] [CrossRef]
- Searcy, C.; Dixon, S.M.; Neumann, W.P. The use of work environment performance indicators in corporate social responsibility reporting. J. Clean. Prod. 2016, 112, 2907–2921. [Google Scholar] [CrossRef]
- Price, T.; Tredinnick-Rowe, J.; Walshe, K.; Tazzyman, A.; Ferguson, J.; Boyd, A.; Bryce, M. Reviving clinical governance? A qualitative study of the impact of professional regulatory reform on clinical governance in healthcare organisations in England. Health Policy 2020, 124, 446–453. [Google Scholar] [CrossRef]
- Agnisarman, S.; Ponathil, A.; Lopes, S.; Madathil, K.C. An investigation of consumer’s choice of a healthcare facility when user-generated anecdotal information is integrated into healthcare public reports. Int. J. Ind. Ergon. 2018, 66, 206–220. [Google Scholar] [CrossRef]
- Alonso-González, M.J.; Hoogendoorn-Lanser, S.; van Oort, N.; Cats, O.; Hoogendoorn, S. Drivers and barriers in adopting Mobility as a Service (MaaS)–A latent class cluster analysis of attitudes. Transp. Res. Part A Policy Pract. 2020, 132, 378–401. [Google Scholar] [CrossRef]
- Ishikawa, A.; Amagasa, M.; Shiga, T.; Tomizawa, G.; Tatsuta, R.; Mieno, H. The max-min Delphi method and fuzzy Delphi method via fuzzy integration. Fuzzy Sets Syst. 1993, 55, 241–253. [Google Scholar] [CrossRef]
- Noorderhaben, N. Strategic Decision Making; Addison-Wesley: Wokingham, UK, 1995. [Google Scholar]
- Warfield, J.N. Developing interconnection matrices in structural modeling. IEEE Trans. Syst. Man Cybern. 1974, 81–87. [Google Scholar] [CrossRef]
- Wu, W.W.; Lee, Y.T.; Tseng, M.L.; Chiang, Y.H. Data mining for exploring hidden patterns between KM and its performance. Knowl.-Based Syst. 2010, 23, 397–401. [Google Scholar] [CrossRef]
- Govindan, K.; Palaniappan, M.; Zhu, Q.; Kannan, D. Analysis of third party reverse logistics provider using interpretive structural modeling. Int. J. Prod. Econ. 2012, 140, 204–211. [Google Scholar] [CrossRef]
- González-Rodríguez, M.R.; Díaz-Fernández, M.C. Customers’ corporate social responsibility awareness as antecedent of repeat behaviour intention. Corp. Soc. Responsib. Environ. Manag. 2020, 27, 1294–1306. [Google Scholar] [CrossRef]
Publisher’s Note: MDPI stays neutral with regard to jurisdictional claims in published maps and institutional affiliations. |
© 2020 by the authors. Licensee MDPI, Basel, Switzerland. This article is an open access article distributed under the terms and conditions of the Creative Commons Attribution (CC BY) license (http://creativecommons.org/licenses/by/4.0/).