Abstract
The sustainability of structures during their construction and service life has become a widespread topic of interest. To ensure the sustainability of bridges, maintenance databases can be analyzed to determine the status changes and required maintenance of existing bridges. The results of this analysis can then be used to predict the environmental impacts and costs incurred during ongoing maintenance of new bridges to prepare accordingly for the future. To prepare for future events, this study utilizes the US National Bridge Inventory to analyze changes in the condition rating of bridge decks and substructures according to their service years, and suggests maintenance scenarios for the service life of bridge deck and substructure concrete by investigating the maintenance activities according to service years. The factors for applying the scenarios in Korea and conceptual equations for life cycle studies which apply the scenarios are discussed for further study in the life cycle assessment field of bridges.
1. Introduction
To ensure the sustainability of a structure over its entire life cycle, it is important not only to estimate the cost and environmental impacts due to construction, but also those due to operation and maintenance during its service life. A structure requires energy to operate during its service life, including the various materials and energy used for maintenance. As maintenance type and method are often determined according to the degree of damage to a structure, it can be difficult to predict the energy required for maintenance before damage occurs.
In previous studies, the most common method for evaluating the life cycle impacts of bridges has been to establish a certain scenario for maintenance [1,2,3,4,5,6,7,8,9]. However, the maintenance activities considered in most life cycle assessment (LCA) studies are still limited, as they do not take into consideration the deterioration of the structural parts such as concrete structures. The concrete structures in bridges undergo phenomena such as spalling and cracking during deterioration. Because these structures are of primary importance, the maintenance activities they require should be considered for more appropriate life cycle studies. The purpose of this study is to fill this gap.
To more thoroughly evaluate the impacts of maintenance on the life cycle costs (LCC) of bridges, the changes that bridges have experienced in the past can be analyzed and used as a basis for predictions of future maintenance requirements. Accordingly, in this study, the trend of bridge condition change is analyzed by using information from bridge asset databases, in order to derive the expected condition rating according to service years of bridges. As a result, the maintenance scenario for the life of bridge concrete structures is proposed based on investigation of the historical maintenance activities according to service years. Furthermore, the factors for applying the scenarios in Korea and conceptual equations for life cycle assessment studies which apply the scenarios are discussed for future use.
2. Material and Method
2.1. Maintenance Phase in Bridge LCA and LCC
LCA is a method commonly used for estimating the environmental impact of products and services. LCA is a standardized and systematic method based on ISO 14,040 that evaluates the potential environmental impacts of a product or a service throughout its whole life cycle [10,11]. In bridge LCA studies, the bridge is considered as a product and the life cycle is divided into four (or five) phases: manufacturing phase, construction phase, maintenance and use phase (or maintenance phase and use phase), and end-of-life phase [2,3,5,8,11]. Whereas LCA focuses on environmental impact, LCC is a method for calculating the expected cost. The expected total cost during the lifetime of a bridge can be expressed as follows
where CT is the initial cost, CPM is the expected cost of routine maintenance, CINS is the expected cost of inspections, CREP is the expected cost of repair, and CF is the expected failure cost [12].
CET = CT + CPM + CINS + CREP + CF
The impact of maintenance is an important part of both LCA and LCC, and as the maintenance phase continues throughout the service life of a bridge, it is considered to be the longest phase in the life cycle. However, the evaluated results of this phase are usually uncertain because the realistic maintenance schedule and repair intervals are influenced by the budget plan, periodic inspection, and material deterioration conditions [3].
Defining the scenario for each maintenance activity is important for estimating environmental impact and cost during the maintenance phase. Various maintenance activities have been considered in previous studies to build the maintenance scenario. However, as shown in Table 1, the maintenance activities which are applied in the previous studies are mostly focused on subsidiary materials. As concrete is the main material which forms the structure of road and railway bridges, it is essential to consider the concrete structure of bridges in the bridge maintenance phase.

Table 1.
Maintenance activities considered in previous bridge life cycle studies.
2.2. Bridge Asset Databases
To systematically manage structures, many countries around the world have developed systems for collecting data describing the current status and maintenance history of bridges according to year. The data collected for such systems constitute a form of big data, and are actively used in research on bridge status analysis, traffic analysis, and cost predictions [12,14,15,16,17,18,19,20].
A representative bridge maintenance dataset is the National Bridge Inventory (NBI) of the US Department of Transportation (US DOT). The US DOT has been annually updating the NBI since 1992 to facilitate accurate and systematic bridge management. The NBI includes a total of 137 types of data, including bridge construction year, use, and structure type. Among these data, information describing deck, substructure (including piers and abutments), and superstructure conditions are recorded as one-digit number ratings based on a coding guide [21].
In Korea, the Ministry of Land, Infrastructure, and Transport provides annual status information on bridge length, locations, and the like through the Road, Bridge, and Tunnel Status Information System [22]. This system manages bridge information, benchmarks bridge management systems (BMS) in Europe and the US and accumulates maintenance data over the entire life cycle of the bridges it contains [23,24]. Additionally, the Korea Expressway Corporation operates an expressway public data portal that discloses a variety of public data on expressways for reference by private users [25]. This system is configured to provide datasets related to bridge maintenance that include bridge status, inspection information, diagnoses, and repair work performance among the numerous included datasets related to transportation, construction, and maintenance. However, considering that land was most actively developed in the 1990s and 2000s in Korea, many bridges have relatively short recorded service lifetimes. This can be confirmed by reference to the bridge statistics in the annually updated Road, Bridge, and Tunnel Status Information System. Figure 1 compares the data in this system with the US bridge data in the NBI: only 11% of bridges in Korea have been in service for over 30 years, whereas 65% of bridges in the US have been in service for over 30 years. From the perspective of bridge service life, this indicates that most of the bridges in Korea are still in the early stage of their life cycle, while many bridges in the US are in their later stages. In particular, the US NBI database contains many bridges that have been in service for over 100 years. This indicates that the data on US bridges are more appropriate than the Korean data for analyzing bridge life cycle maintenance. Accordingly, this study used the US NBI data to investigate changes over the service lives of bridges while assuming the service life of a bridge to be 100 years.
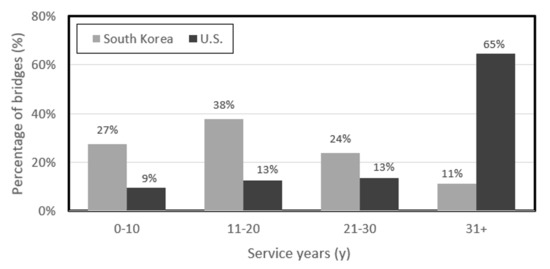
Figure 1.
Distribution of bridges according to bridge service years in the US and Korea.
2.3. National Bridge Inventory
The bridge condition rating used in the NBI is divided into 10 ratings from 0 to 9 in a one-digit format, with definitions for each rating [26]. Furthermore, the US DOT classifies bridge maintenance actions from the perspective of asset management, with the maintenance actions required for each condition rating defined according to this classification, as shown in Table 2 [27].
Table 2.
Maintenance actions based on NBI condition rating [27].
As of 2018, the NBI database holds records on 616,096 bridges. This study utilized a valid dataset describing a total of 458,488 bridges obtained after removing incomplete and omitted data. This dataset contains road and expressway bridge information including year built, deck condition, substructure (including pier and abutment) condition, and superstructure condition. Based on the format of the NBI, the condition rating of each bridge could be compared with the service years. Meanwhile, as actual bridges show different aging tendencies in different components of their structure, the required maintenance activities are also different, so analysis of costs and impacts based on different structure components is considered reasonable. Accordingly, the changes in superstructure, deck, and substructure condition ratings were analyzed separately.
In this study, to define the required concrete maintenance activities according to service years, the information of maintenance activities required for each condition rating provided in the NBI guidelines is used [27,28].
2.4. Research Framework
As shown in Figure 2, the main framework of this study is organized into three stages: condition rating analysis, maintenance scenario development, and application stage for environmental impact and cost calculation of bridge maintenance. In condition rating analysis stage, the trend of bridge deck and substructure condition change is analyzed by comparing the condition rating and service years as two dimensions, in order to derive the expected condition rating according to service years of bridges. Continually, in maintenance scenario development stage, the maintenance activities and the degree of damage are classified by the condition rating according to service years, in order to develop the maintenance scenario of bridge deck and substructure. Finally, in the application stage, the subjects which should be considered to apply the developed scenario in Korea and the conceptual method of utilizing the scenario for life cycle assessment calculation are discussed.

Figure 2.
Research framework.
3. Results
3.1. Condition Rating Analysis
Figure 3 shows the average, standard deviation, and minimum and maximum superstructure condition ratings within a 90% confidence interval from the NBI dataset according to service year. It can be observed that the standard deviations of the condition ratings increase as the service years increase. Thus, based on the 90% confidence interval, the difference between the maximum and minimum values of the condition ratings increases as the service years increase. This indicates that bridges are given relatively similar condition ratings early in their service life, then become more varied as their service years increase. This is likely because different bridges are exposed to different environments throughout their life cycle, leading to different aging rates, which means different condition changes during the same service year. However, this study investigated the change in the average condition ratings of the bridges in the NBI database under the assumption that the aging rate is constant.

Figure 3.
Superstructure condition rating according to bridge service years.
The NBI not only contains information on the whole bridge, but also records of deck and superstructure independently. Similar to the tendency of superstructures in Figure 3, the deck and substructure parts also form second-order curves describing the change in each condition rating according to service years, as shown in Figure 4 and Figure 5. Clearly, the reduction in condition rating of the substructure over its life cycle is larger than that of the deck. The averages of the condition ratings in Figure 4 and Figure 5 were rounded to whole-number (one-digit) condition ratings, respectively, so that the conditions could be discussed in terms of the NBI ratings and their corresponding maintenance activities. For example, bridge decks show an average rating of 8 in the year built and an average rating of 6 after passing 100 years of service life. Similarly, substructures show an average rating of 8 in the year built, but the average rating decreases to 5 after 100 years of service life.

Figure 4.
Average deck condition rating according to bridge service years.
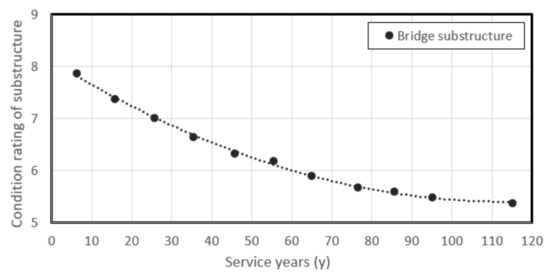
Figure 5.
Average substructure condition rating according to bridge service years.
As the deck and substructure are likely to be more universal for analyzing the change in structural concrete separately from the superstructure, only the substructure and deck ratings are analyzed in the remainder of this study. Meanwhile, the estimated range of service years according to the condition rating summarized in Table 3 becomes the basis for development of the maintenance scenario.
Table 3.
Deck and substructure average condition rating and assigned maintenance phase according to service years.
3.2. Maintenance Scenario Development
The condition ratings of bridges vary with ongoing service years. Thus, the maintenance activities can also be classified by correlating the condition rating to the service years of the bridge. However, as the degree of damage to a bridge is reflected in the condition rating, the degree of application of the maintenance activity also differs according to condition rating. The NBI Rating Guidelines (MDOT, 2017) explain the degree of damage indicated by each condition rating according to the part of the bridge being rated. On this basis, the actual degree of damage according to the service years of the bridge can be determined. Then, by applying the maintenance activities provided in the NBI Rating Guidelines for each condition rating of the bridges analyzed in this study, we can determine the degree of damage according to the service years of the deck and substructure, grouped in Table 4 and Table 5, respectively, according to the distribution of whole-number ratings in Table 3.
Table 4.
Degree of damage according to condition rating of deck.
Table 5.
Degree of damage according to condition rating of substructure.
Meanwhile, deck replacement should also be considered during the service life of a bridge. Kim & Jang [29] derived the appropriate deck replacement demand by analyzing the deck replacement data of 12,129 bridges in Korea. As a result, the period of deck replacement demand was analyzed to be 51 years to 71 years, which indicates that the deck replacement should be performed once during the service life of a bridge. The influence of deck replacement is already reflected in the NBI condition ratings. Therefore, the changes in maintenance activities according to deck replacement are unnecessary to consider. The maintenance scenarios for the concrete structure of deck and substructure, which include the deck replacement activity, are shown in Figure 6 and Figure 7.

Figure 6.
Deck concrete maintenance scenario.

Figure 7.
Substructure concrete maintenance scenario.
4. Discussions
4.1. Maintenance Quantity Application
Previous studies consider the probability and estimated application quantity of each maintenance activity to evaluate the maintenance quantity. Although only the maintenance of major concrete structure is considered, the maintenance of sub-materials is evaluated by considering the probability and applied quantity of each maintenance activity during the fixed action time. An example of maintenance quantity in Sweden is shown in Table 6 [13].
Table 6.
Example of maintenance quantity [13].
The maintenance quantity may differ according to the construction style and built environment of each country. In Korea, Kim, Park, and Moon derived the action time and the probability of major structural maintenance activities by analyzing a survey of 120 experts [30]. As a result, the average initial action time of concrete repair was 20 years and the secondary action time was 10 years, and the probability of all maintenance activities was 40%. However, the applied quantities of maintenance activities were not derived, and the results of the survey lacked evidence.
According to the bridge inspection guidelines in Korea, bridge maintenance actions are conducted after the result of an inspection is reported. Therefore, further studies on concrete maintenance quantity of bridges are needed to develop a more practical bridge maintenance evaluation method.
4.2. Application in Korea
Several countries maintain extensive databases recording the histories of bridge maintenance that constitute a form of big data asset management. The US DOT NBI database analyzed in this study is the most representative case of bridge history management big data. Similarly, Korea operates its own system to manage bridge history. The bridge history databases of the US and Korea are notably similar in their classification of bridge condition ratings, which are compared in Table 7.
Table 7.
Comparisons of condition rating of Korea and US [31].
However, most bridges in Korea have only a small number of service years, reflecting only a short period of systematic bridge history management. Consequently, bridge data in Korea are insufficient for analyzing the maintenance costs over the 100-year bridge service life assumed in this study. By using the US DOT NBI database, this study was able to analyze a sufficiently long history of bridge management data to predict future service costs and environmental impacts. The proposed methods of prediction can be used to prepare countries such as Korea for bridge aging by informing planning and resource allocation for bridge maintenance and replacement programs.
4.3. Conceptual Life Cycle Assessment
The degree of damage to a bridge determines the required quantity of material and energy input into the maintenance activity. These are important factors when estimating the cost and environmental impact of the maintenance activity through life cycle assessments. Generally, cost is the product of the maintenance quantity and unit price. Note that when calculating the lifetime maintenance costs, this study does not consider fluctuations in unit cost over time. The equations for calculating the major maintenance costs incurred during the life of the bridge are as follows
where C is the cost of the deck, substructure, or total maintenance; ci,r is the unit cost (cost/unit) of maintenance activity i for component condition rating r; qi,r is the average quantity (unit) of maintenance activity i for component condition rating r; yr is the number of service years (years) at which component condition rating r is provided; pi is the maintenance period (year) at which maintenance activity i is performed; n is the total number of maintenance activities conducted over the bridge service life; and m is the total number of component condition ratings over the bridge service life.
Typically, environmental impact is calculated as the product of the repair quantity and emission factor, yielding the following equations for environmental impact
where I is the environmental impact (kgCO2eq) of the deck, substructure, or total maintenance; e is the emission factor (kgCO2eq/unit) of maintenance activity i for component condition rating r; and qi,r, yr, pi, n, and m are defined as in Equations (2) and (3).
Using these equations, the cost and environmental impact over the entire life of a bridge can be calculated according to the predicted condition of the bridge and its structures according to service years, allowing a more complete understanding of the total environmental and cost impact of the bridge. However, as the equations are conceptual by only considering the factors studied through this study, the method of integrating the maintenance scenarios into LCA and LCC should be derived in further studies.
5. Conclusions
The maintenance activities which are applied in previous studies on bridge life cycle are mostly focused on subsidiary materials. Because concrete is the main material which forms the structure of bridges, the impact caused by maintaining the concrete structure should be considered in bridge life cycle studies.
The purpose of this study is to derive an appropriate method of calculating the environmental impact and cost caused by maintaining the concrete structure of a bridge during its service life. This study presents the appropriate scenario of bridge concrete structure maintenance by analyzing the condition rating according to service life of bridges. Moreover, the method for calculating the impact of the bridge maintenance phase is proposed by discussing other factors. This study reaches the following conclusions.
The condition ratings of bridges in the NBI were relatively similar early in their service lives but became more varied as their service lives increased. This tendency is a result of the different rates of aging due to the different environments to which the bridges were exposed. This study investigated the change in the average condition ratings of bridge decks and substructures under the assumption that the aging rate is constant.
An analysis of bridge deck condition ratings showed that deck ratings decreased from an average of 8 in the year of construction to an average of 6 after 100 service years. Bridge substructure condition ratings decreased from an average of 8 in the year of construction to an average of 5 after 100 service years. We then derived the expected service years according to the condition rating of the deck and substructure.
For application in bridge life-cycle studies, we derived the scenarios of bridge (deck and substructure) concrete maintenance, which consists of concrete repair and replacement by defining the required concrete maintenance activities according to service years of bridges.
We discussed the factors which influence the results of environmental impact and cost estimation in the maintenance phase. Moreover, we discussed the conceptual calculation method for estimating the environmental impact and cost in equations. Further studies on factors of the calculation method are necessary to develop the method for practical use in the bridge life cycle field.
Author Contributions
Conceptualization, H.K., S.T., Y.A. and J.Y.; methodology, H.K.; validation, H.K., S.T. and Y.A.; formal analysis, H.K.; investigation, H.K.; resources, H,K.; data curation, H.K.; writing—original draft preparation, H.K.; writing—review and editing, H.K., S.T., Y.A. and J.Y.; visualization, H.K.; supervision, S.T. and J.Y.; project administration, S.T. All authors have read and agreed to the published version of the manuscript.
Funding
This research was supported by the National Research Foundation of Korea (NRF) grant funded by the Korea government (MSIT) (No. 2015R1A5A1037548) and supported by the Korea Agency for Infrastructure Technology Advancement (KAIA) grant funded by the Ministry of Land, Infrastructure and Transport (No. 20CTAP-C152276-02).
Conflicts of Interest
The authors declare no conflict of interest.
References
- Bouhaya, L.; Le Roy, R.; Feraille-Fresnet, A. Simplified Environmental Study on Innovative Bridge Structure. Environ. Sci. Technol. 2009, 43, 2066–2071. [Google Scholar] [CrossRef] [PubMed]
- Du, G.; Karoumi, R. Life Cycle Assessment of a Railway Bridge: Comparison of Two Superstructure Designs. Struct. Infrastruct. Eng. 2013, 9, 1149–1160. [Google Scholar] [CrossRef]
- Du, G.; Safi, M.; Pettersson, L.; Karoumi, R. Life Cycle Assessment as a Decision Support Tool for Bridge Procurement: Environmental Impact Comparison among Five Bridge Designs. Int. J. Life Cycle Assess. 2014, 19, 1948–1964. [Google Scholar] [CrossRef]
- Gervásio, H.; da Silva, L.S. Comparative Life-Cycle Analysis of Steel-Concrete Composite Bridges. Struct. Infrastruct. Eng. 2008, 4, 251–269. [Google Scholar] [CrossRef]
- Hammervold, J.; Reenaas, M.; Brattebø, H. Environmental Life Cycle Assessment of Bridges. J. Bridg. Eng. 2013, 18, 153–161. [Google Scholar] [CrossRef]
- Horvath, A.; Hendrickson, C. Steel versus Steel-Reinforced Concrete Bridges: Environmental Assessment. J. Infrastruct. Syst. 1998, 4, 111–117. [Google Scholar] [CrossRef]
- Itoh, Y.; Kitagawa, T. Using CO2 Emission Quantities in Bridge Lifecycle Analysis. Eng. Struct. 2003, 25, 565–577. [Google Scholar] [CrossRef]
- Pang, B.; Yang, P.; Wang, Y.; Kendall, A.; Xie, H.; Zhang, Y. Life Cycle Environmental Impact Assessment of a Bridge with Different Strengthening Schemes. Int. J. Life Cycle Assess. 2015, 20, 1300–1311. [Google Scholar] [CrossRef]
- Veganzones Muñoz, J.J.; Pettersson, L.; Sundquist, H.; Karoumi, R. Life-Cycle Cost Analysis as a Tool in the Developing Process for New Bridge Edge Beam Solutions. Struct. Infrastruct. Eng. 2016, 12, 1185–1201. [Google Scholar] [CrossRef]
- International Organization for Standardization (ISO). Environmental Management—Life Cycle Assessment—Principles and Framework (2006); ISO 14040; ISO: Geneva, Switzerland, 2006. [Google Scholar]
- Du, G.; Karoumi, R. Life Cycle Assessment Framework for Railway Bridges: Literature Survey and Critical Issues. Struct. Infrastruct. Eng. 2014, 10, 277–294. [Google Scholar] [CrossRef]
- Frangopol, D.M.; Dong, Y.; Sabatino, S. Bridge Life-Cycle Performance and Cost: Analysis, Prediction, Optimisation and Decision-Making. Struct. Infrastruct. Eng. 2017, 13, 1239–1257. [Google Scholar] [CrossRef]
- Safi, M.; Sundquist, H.; Karoumi, R. Cost-Efficient Procurement of Bridge Infrastructures by Incorporating Life-Cycle Cost Analysis with Bridge Management Systems. J. Bridg. Eng. 2015, 20, 04014083. [Google Scholar] [CrossRef]
- Bolukbasi, M.; Mohammadi, J.; Arditi, D. Estimating the Future Condition of Highway Bridge Components Using National Bridge Inventory Data. Pract. Period. Struct. Des. Constr. 2004, 9, 16–25. [Google Scholar] [CrossRef]
- Bolukbasi, M.M.; Arditi, D.; Mohammadi, J. Optimum Rehabilitation Schedule of Steel Highway Bridges. Struct. Infrastruct. Eng. 2006, 2, 141–152. [Google Scholar] [CrossRef]
- Dai, K.; Smith, B.H.; Chen, S.E.; Sun, L. Comparative Study of Bridge Management Programmes and Practices in the USA and China. Struct. Infrastruct. Eng. 2014, 10, 577–588. [Google Scholar] [CrossRef]
- Dekelbab, W.; Al-Wazeer, A.; Harris, B. History Lessons from the National Bridge Inventory. Public Roads 2008, 71, 30–36. [Google Scholar]
- Farhey, D.N. Structural Performances of Bridge Materials in the US National Bridge Inventory 2013. Struct. Eng. Int. 2017, 27, 101–113. [Google Scholar] [CrossRef]
- Huang, R.Y.; Chen, P.F. Analysis of Influential Factors and Association Rules for Bridge Deck Deterioration with Utilization of National Bridge Inventory. J. Mar. Sci. Technol. 2012, 20, 336–344. [Google Scholar]
- Inkoom, S.; Sobanjo, J. Availability Function as Bridge Element’s Importance Weight in Computing Overall Bridge Health Index. Struct. Infrastruct. Eng. 2018, 14, 1598–1610. [Google Scholar] [CrossRef]
- United States Department of Transportation (US DOT); Federal Highway Administration (FHWA). National Bridge Inventory (NBI). 2018. Available online: https://www.fhwa.dot.gov/bridge/nbi/ascii.cfm (accessed on 19 January 2020).
- Korea Institute of Civil Engineering and Building Technology. Road, Bridge, and Tunnel Status Information System. Available online: https://bti.kict.re.kr/bti (accessed on 12 December 2019).
- Korea Institute of Civil Engineering and Building Technology. Developing Bridge. Management System Considering Life-Cycle Cost and Performance of Bridges; Ministry of Land, Transport and Maritime Affairs: Seoul, Korea, 2012. [Google Scholar]
- Sun, J.W.; Lee, D.Y.; Park, K.Y. Development on Repair and Reinforcement Cost Model for Bridge Life-Cycle Maintenance Cost Analysis. J. Korea Acad. Ind. Coop. Soc. 2016, 17, 128–134. [Google Scholar] [CrossRef]
- Korea Expressway Corporation. Highway Public Data Portal. 2019. Available online: http://data.ex.co.kr (accessed on 12 December 2019).
- United States Department of Transportation (US DOT); Federal Highway Administration (FHWA); Office of Engineering Bridge Division. Recording and Coding Guide for the Structure Inventory and Appraisal of the Nation’s Bridges. 1995. Available online: https://www.fhwa.dot.gov/bridge/mtguide.pdf (accessed on 19 January 2020).
- United States Department of Transportation (US DOT); Federal Highway Administration (FHWA). Bridge Preservation Guide—Maintaining a Resilient Infrastructure to Preserve Mobility. 2018. Available online: https://www.fhwa.dot.gov/bridge/preservation/guide/guide.pdf (accessed on 5 December 2019).
- Michigan Department of Transportation. MDOT NBI Rating Guidelines. 2017. Available online: https://www.michigan.gov/documents/mdot/BIR_Ratings_Guide_Combined_2017-10-30_606610_7.pdf (accessed on 13 March 2020).
- Kim, J.K.; Jang, I.Y. Proposal of Domestic Road Bridge Deck Deterioration Models and Forecast of Replacement Demand. J. Korea Inst. Struct. Maint. Insp. 2017, 61–68. [Google Scholar] [CrossRef]
- Kim, T.H.; Park, M.Y.; Moon, J.W. A Study on Optimal LCC Considering Asset Management through Maintenance-Period Analysis about Railway Truss Bridge [Paper Presentation]. In Spring Conference of the Korean Society for Railway (South. Korea); Korean Society for Railway: Gwangju, South Korea, 2008; pp. 1337–1345. [Google Scholar]
- Jeong, Y.; Kim, W.S.; Lee, I.; Lee, J. Bridge Service Life Estimation Considering Inspection Reliability. KSCE J. Civ. Eng. 2017, 21, 1882–1893. [Google Scholar] [CrossRef]


Publisher’s Note: MDPI stays neutral with regard to jurisdictional claims in published maps and institutional affiliations. |
© 2020 by the authors. Licensee MDPI, Basel, Switzerland. This article is an open access article distributed under the terms and conditions of the Creative Commons Attribution (CC BY) license (http://creativecommons.org/licenses/by/4.0/).