Abstract
The menu serves as a form of advertisement and has also been recognized as an important marketing communication tool between restaurant and consumer. Extant literature have assessed the menu item performance by using the multi-factor efficiency index. However, there is a paucity of literature focusing on the efficiency disaggregation in order to improve the performance of individual food, labor, and other resources. The aim of this study was to determine the input targets for each menu item by comparing the efficiency frontier established by all menu items in two types of restaurant chains. In order to achieve this goal, the study sought to establish the food and labor cost performance assessment model utilizing the total-factor framework combined with a slack-based measure (SBM) of efficiency in data envelopment analysis (DEA) (SBM-DEA). Resource-saving target ratios (RSTR) for panel data with 35 menu items in these two different cultural type of restaurant chains including Chinese-style and Japanese-style restaurants for twelve months were assessed in a total-factor framework. The four-quadrant analysis based on efficiency and unit profit offered different strategies to the restaurateur being studied. The empirical findings indicated that the average total-factor food cost efficiency (TFFCE) was better than the total-factor labor cost efficiency (TFLCE) in these two types of restaurants. The TFFCE (80%) and TFLCE (61%) of the Chinese-style restaurant were better than those (TFFCE (76%) and TFLCE (50%)) of the Japanese-style restaurant in the observant periods. Even though the Chinese-style restaurant had a better resource efficiency, the restaurateur was still able to improve at least 20% in terms of food cost efficiency and 39% of labor cost efficiency, respectively. Managerial discussion and future study are also discussed.
1. Introduction
The food sector is an essential contributor to the world economy, and there is an increased diversity of dietary preferences and needs with a growing population and varying lifestyle [1]. With the pervasiveness in the growth of dining out, food service businesses have an important role toward more sustainable and healthy food systems [2]. With the rise in food and labor costs, increasing the utilization rate for these resources to generate more economic benefits has been an essential topic for practitioners [3]. In order to assess the success of a food service business, a holistic performance measurement system needs to be developed. A performance measurement system in this study was defined as a system that enables a firm to successfully transfer food and labor resource costs to revenue and their existing customers. Food service businesses are the last-mile process of the food production and distribution. The performance of the food service business is the main driver leading to the entire cycle of the food production chain [2]. Meanwhile, performance indicators are operationalized process characteristics, which compare the efficient frontier of a system with a target value [3]. The performance measurement system provides decision makers as to whether they are achieving their goals, and whether and where improvements are necessary [4]. Furthermore, restaurateurs strive to achieve sustainability from making resource improvement priority decisions. The menu delivers a form of value proposition and has also been recognized as an important marketing communication tool between the restaurant and the consumer. The menu is recognized as the center of food production and subsequently leads food procurement and production decisions in all restaurant operations, from purchasing to preparing food materials to the sales price of each finished menu item [5,6]. Due to the characteristics of small profit margins and relatively high failure rates in the restaurant industries, existing menu analysis or menu engineering only considering the food cost would distort the economic value for menu items and lead to inappropriate decision making for restaurateurs [7,8]. Meanwhile, traditional menu analysis models are limited because of their underlying assumption of menu item interdependency [8]. Restaurant managers need to use new approaches to analyze the true profitability for each menu item and develop a cost-effective menu item mix through incorporating food costs, labor costs, and menu item interdependency into new approaches.
A restaurant conventionally utilizes two methods to evaluate its performance. The first is a ratio analysis such as that of the food cost per menu item, employee productivity, and sales volume [9]. However, applications of this method are limited due to the possibility that different ratios will produce different performance results. The second is the parametric method (e.g., the regression model). This technique needs a good fit and does not produce any benchmarks [10]. Data envelopment analysis (DEA) has the benefit of being applicable to restaurant operational assessment, and the DEA model is able to integrate a wide range of inputs and outputs simultaneously [11].
The extant research utilizing DEA to evaluate the menu item efficiency have addressed a multi-factor assessment [3,5,7,12,13]. However, there is no improvement priority suggestion for a restaurateur for an inefficient menu item in a restaurant. Some researchers have suggested that the input slack or output surplus analysis could offer the decision-maker the basis of a specific improvement direction [3,12]. However, due to the resource limitation and budget constraint, the restaurateur needs to prioritize resource improvement. This paper has two objectives: the first objective was to use the input-oriented slack-based measurement (SBM) data envelopment analysis (DEA) (SBM-DEA) to calculate the menu item performance; and the second was to decompose the menu item performance into different resource consumption efficiencies such as total-factor food cost efficiency (TFFCE) and total-factor labor cost efficiency (TFLCE) within the total-factor framework to simultaneously consider food, labor resources, the number of food suppliers, and menu item interdependency in different styles of restaurant. Thus, the restaurateur could improve the lower total-factor resource efficiency first based on the efficiency decomposition in order to enhance the most-needed improvement. This paper is the first study in menu analysis to consider the resource improvement priority and menu item interdependency simultaneously.
The rest of this paper is organized as follows. Section 2 presents the literature review for multi-factor menu efficiency assessment and total-factor resource efficiency in the energy application, however, there were no applications in the food service industry. Section 3 explains the methodology, and Section 4 presents the empirical results and some concluding remarks.
2. Literature Review
Most studies in the literature have used the DEA technique to evaluate multiunit restaurant efficiency [14,15,16,17]. However, multiple-factor menu item analysis considering the resource efficiency had rarely been studied empirically. Furthermore, there is a paucity of studies to focus on the efficiency disaggregation in order to improve individual food, labor, and the performance of other resources.
2.1. Menu Item Efficiency
The extant research using the DEA has evaluated the efficiency of different brands in the same franchisor [18]; few studies have focused on the menu item efficiency using DEA [3,5,7,12,13] and compared the financial performance between the traditional menu engineering and DEA [12]. Traditional economic theory views labor and capital as two of the production factors for economic growth [10]. Efficiency is defined as an index of the production of multiple output variables given several input variables. A production plan achieves an efficient frontier if there is no way to produce an equal level of outputs with less inputs (input-oriented DEA model) [10]. The literature analyzed menu item performance in Chinese chain restaurants based on the revised menu engineering model that incorporates labor cost and operating expenses and DEA with using food costs, the number of food suppliers, and labor costs. This includes three of six inputs with the assumption of variable return-to-scale to generate sales volume and net profit [3]. Taylor et al. [13] were the first to use DEA under a constant return-to-scale (CRS-DEA) to analyze the performance of menu items and employed a complexity of processes that considered more factors including labor cost, than those of the traditional menu engineering model to produce gross profit and popularity to assess the efficiency of 65 menu items. Chou and Fang [3] extended the DEA model from Taylor et al. [13] to consider more factors including the labor cost and other operating expenses into the menu performance assessment model. Other studies [5,7] used the labor cost, food cost, and number of food suppliers to produce gross profit and popularity to assess the efficiency score. Fang et al. [12] investigated total food cost, weighted labor cost, and operating expenses to produce revenue and gross profit through DEA. Thus, this study established the following hypotheses based on the extant literature:
Hypothesis 1 (H1).
The menu items would utilize the input resource of food cost to positively produce the sales volume and profit.
Hypothesis 2 (H2).
The menu items would utilize the input resource of labor cost to positively produce the sales volume and profit.
Hypothesis 3 (H3).
The menu items would utilize the input resource of the number of food suppliers to positively produce the sales volume and profit.
Although no further studies have considered the resource improvement priority, researchers claim that slack-based measurement (SBM) data envelopment analysis (DEA) could increase the discrimination power of efficiency assessment for decision making units [19].
2.2. Total-Factor Input Efficiency
Integrating the DEA model with the total-factor framework could capture the separate contribution of the resource in order to prioritize resource improvement [20]. The total-factor productivity assessment has been applied to the energy input resource efficiency. Hu and Wang [21] indicated that all inputs (for example, labor and capital), together with energy resource, ought to be considered simultaneously in assessing the energy efficiency and developing the index of total-factor energy efficiency (TFEE) to analyze energy efficiencies of 29 administrative regions in China from 1995 to 2002. Their paper employed DEA and used labor, capital stock, energy, and total sown area of farm crops as the four inputs, and real GDP as the single output in order to find the target energy input of each region in China for each particular year. Hu and Kao [22] further used CRS-DEA by incorporating three inputs (energy, labor, and capital) and a single output (GDP) to establish the energy-saving target (EST) and then measured energy-saving target ratios (ESTRs) for 17 APEC economies during 1991–2000. The empirical results indicate a U-shape relation between per capita EST and per capita GDP. ESTR has a significantly positive impact on the value-added percentage of GDP of the industry sectors and a negative impact on that of the service sectors.
Honma and Hu [23] used DEA with the assumption of variable-return-to-scale (VRS) by incorporating three inputs (energy consumption, labor, and capital stock) and a single output (the value added in each sector) to estimate the TFEE of 17 sectors in Japan from 1998 to 2005. The empirical results showed that the TFEE was relatively higher in the mining, general machinery, real estate and housing services as well as the financial, insurance, and service sectors in Japan, which was in contrast to the relatively lower energy intensity for the agricultural sector as well as the transportation and communication sectors. However, these studies used the total-factor framework that is limited in energy efficiency use by not expanding to other input resource efficiency evaluations.
3. Methods
This paper used the total-factor framework (Hu & Wang, 2006) combined with a slack-based measure (SBM) of efficiency in data envelopment analysis (DEA) developed by Tone [24] (SBM-DEA). This SBM-DEA model was used to determine the input targets for each menu item by comparing the efficiency frontier established by all menu items in two types of restaurant chains.
This paper followed the procedure in Figure 1 and used the input-oriented VRS SBM-DEA with an appropriate input/output selection to calculate the efficiency score as the first methodology. The quadrant-based matrix was developed to identify the sustainable menu items as the benchmark. Then, this paper used the total-factor framework to disaggregate the input efficiency as the second methodology. The disaggregated input efficiency is able to separate the target and actual value for each input resource efficiency and identify the improvement priority for each input resource [25].
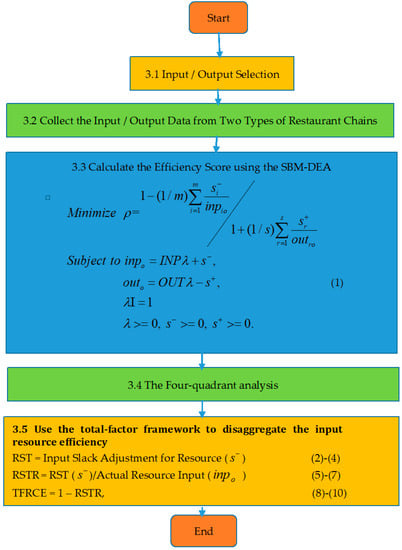
Figure 1.
Research flowchart.
3.1. Selection of Inputs and Outputs
The first step in Figure 1 is the input/output selection. Traditional economic theory views labor and capital as two of the most vital production factors for economic growth. Roh and Choi [18] suggested that expenditure was one of candidates for an input variable to assess restaurant efficiency. The food cost is one of the main input resources in menu item performance assessment [3,5,7,12,13]. In particular, with the rise in food and labor costs, optimizing the utilization rate for these resources to produce more economic benefits has been a crucial topic for food service practitioners [3]. The extant literature utilized two inputs including the level of marination and the number of stations to represent the required processing efforts for each menu item [13]. This paper used the labor processing time as the criteria to calculate the unit labor cost. This paper also adopted the number of food suppliers as one of the input resources from Taylor et al. [13]. Hence, this paper used three inputs including unit food cost, unit labor cost, and number of food suppliers. The operating expenses excluding the labor cost were not easy to allocate to each product. The food and labor costs account for more than 70% of revenue. Hence, the input variables that have been used in the literature and that were determined after consultation with the restaurant managers were categorized into the following three factors: (1) unit food cost, (2) unit labor cost, and (3) number of food suppliers.
3.2. Collect the Input/Output Data from Two Types of Restaurant Chains
The study used panel data including the unit food cost, unit labor cost, number of food suppliers, popularity, and unit profit for 35 menu items from Japanese-style and Chinese-style restaurant chains. The total food cost, which was collected from the Japanese-style and Chinese-style restaurants during these observant periods, was easily traced to each menu item. The unit food cost is equal to the total food cost divided by the sales volume. Regarding the unit labor cost, this paper adopted the time equation method by Kaplan and Anderson [26] to estimate the mean labor processing time for each process through an interview with the chef and the food operation manager. The food operation manager explained that the observed processing time was measured using the time-driven approach and a time and motion study. The total labor cost for a menu item can be calculated by the number of items sold, the hourly rate, and the number of hours processed. The unit labor cost is the total labor cost divided by the sales volume in the observant period. The data of number of food suppliers for each menu item were collected by the food operation manager.
Regarding the data of output variables, the researcher suggested that sales and net profit can be valued as outputs to measure performance [27]. Another study further used gross margin (sales minus food cost) and popularity as two outputs to measure menu-item efficiency [13]. Kasavana and Smith [28] developed menu engineering by using the weighted contribution margin and popularity as the two axes to distinguish different quadrants. This paper further used the popularity (the sales quantity for each menu item divided by total sales quantities) and unit profit (unit sales price minus unit food and labor cost) to assess the efficiency of the menu items. The food operation managers in these two restaurant-chains collected the sales quantities for each menu item from the point-of sale (POS) system in the observant period.
3.3. Calculate the Efficiency Score Using the Slack-Based Measurement (SBM) DEA (SBM-DEA)
The first methodology was used to evaluate the overall efficiency score by SBM-DEA in Equation (1). A higher efficiency score means that the menu item uses fewer inputs to obtain a given level of outputs. All menu items at the same time constitute the reference set for constructing the efficiency frontier for each menu item.
where is a scalar and the overall efficiency for the oth menu item, with ; there are m inputs and s outputs for each menu item, which means the input matrices are INP = (inpio) ∈ Rm x n and the output matrices are OUT = (outro) ∈ Rs x n, respectively. The production possibility set P is P = {(inp, out)|inp ≥ INPλ, out ≤ OUTλ, λ ≥ 0}. The oth menu item is represented by the column vectors inpo and outo, and λ is an N × 1 non-negative vector of constants, which means there are N menu items.
The value indicates a point on the efficient frontier and hence presents a technically efficient menu item. The frontier is a piecewise linear isoquant, determined by the selected data points of the same period. The frontier are the efficient menu items among those selected data in that period. The weight vector λ forms a convex combination of observed inputs and outputs.
The menu item (inpo, outo) could be improved and achieve efficiency by reducing the input excess s- and the ratio calculates the relative reduction rate of input o. Overall efficiency reflects the ability of menu items to use as little input as possible, in order to obtain a given level of output.
3.4. The Four-Quadrant Analysis
As the extant studies used the four-quadrant analysis to make the strategic decisions in the marketing messages in the social media and exhibition sectors [29,30], this paper adopted this methodology to provide strategic suggestions to the restaurateurs. In the fourth stage, this paper set up the four-quadrant matrix formulated by efficiency (long-term sustainability) and unit profit (short-term profitability) and presents the sustainable benchmark and improvement directions. The extant research [12] indicated that menu items with higher earnings before interest and tax implies that these items would generate short-term profitability during the observed period. However, menu items with a higher efficiency score show that these items have relatively sustainable growth because they use less input resources to produce a given level of outputs [12]. The efficiency score is calculated by Equation (1). The unit profit of each menu item is calculated by unit profit = unit price − unit food cost − unit labor cost.
This paper used the mean value for efficiency and unit profit of 20 menu items in the Chinese-style restaurant and 15 menu items in the Japanese-style restaurant as the cutting points of two axes in this four-quadrant analysis. Based on the four quadrants, named as “Star” with high efficiency and high unit profit, “Unsustainable item” with low efficiency score and high unit profit, “Unprofitable item” with high efficiency and low unit profit, and “Kaizen” with low efficiency and low unit profit, this paper provides strategic improvement suggestions on these menu items. “Kaizen” originates from the Japanese language and implies a continuous small improvement, which is a systematic way that focuses on the continuous improvement of the process, productivity, and quality of the product by suggesting effective and efficient Kaizen events [31].
3.5. Use the Total-Factor Framework to Disaggregate the Input Resource Efficiency
For the menu items with an efficiency score less than one, this paper adopted the total-factor framework to disaggregate the input resource efficiency including the food cost efficiency and labor cost efficiency in order to prioritize resource improvement.
Efficiency is generally defined as the ratio of the value of the best practice compared to that of the actual practice. The actual resource consumption is larger than or equal to the ideal resource input because the actual practice is able to improve the resource-saving target to achieve the best practice. This paper estimated two types of resource-saving targets including the food cost-saving target and the labor cost-saving target in the following equations.
The resource-saving target ratio (RSTR) index is therefore the ratio of the aggregate resource-saving target from Equation (2) to actual resource consumption. RSTR in Equation (5) can be measured based on the input excess of resource obtained from the SBM-DEA model:
As Equation (5) indicates, the RSTR represents each sector’s inefficient level of resource consumption. Since the minimal value of RST is zero, the value of RSTR lies between zero and unity. The total adjustments in food cost and labor cost inputs are regarded as the inefficient portion of actual food cost and labor consumption.
This paper developed two types of RSTR including the food cost-saving target ratio (FCSTR) and the labor cost-saving target ratio (LCSTR). The total-factor food cost efficiency (TFFCE) index and total-factor labor cost efficiency (TFLCE) index are related to the RSTR as in Equations (9) and (10):
A zero FCSTR or LCSTR value means that a sector is on the frontier with the best TFFCE or TFLCE (up to one) among the observed menu items and also indicates that no redundant or over-consumed resource use exists in this menu item; otherwise, an inefficient menu item with a value of RSTR larger than zero shows that the resource needs to be saved at the same output level. A higher FCSTR and lower TFFCE or higher LCSTR and lower TFLCE imply a higher resource inefficiency and a higher resource-saving amount, and vice versa.
4. Results and Discussion
4.1. The Descriptive Statistics and Hypotheses Test of the Correlation between Inputs/Outputs
To comply with the confidential agreement that was made with the restaurant manager, the name and specific location of the restaurant in this study are not disclosed. The financial and operating information were obtained from the point-of-sale (POS) system and the restaurateur.
Chinese-style restaurants are popular in Taiwan. As it is rare to find the same menu items in different Chinese and Japanese-style restaurants, a total of 35 menu items comprising 20 items from the Chinese-style restaurant chain and 15 items from the Japanese-style restaurant chain in Taipei city was observed. The relevant operating data from the POS systems in these two types of restaurants were obtained from the restaurateurs during twelve consecutive periods for the empirical study. This study collected sales volume, unit net profit, unit food cost, processing time, and labor hourly wage for each menu item. On average, the menu items in the Chinese and Japanese style restaurants were priced at NT$70 and NT$203 (US$1 = NT$28.9 as of October 2020), respectively. The menu popularity was obtained by dividing the number of each item sold by the total number of all items sold.
Table 1 presents the descriptive statistics of resource consumption and output generation used in the total-factor framework. The average unit food cost and labor cost accounted for 19% and 47% of the average sales price (NT$203) in the Japanese-style restaurant, respectively, as opposed to 41% and 32% in the Chinese-style restaurant (average sales price was NT$70). The descriptive statistics indicated that the labor cost in the Japanese-style restaurant was relatively higher than that in the Chinese-style restaurant during the observant periods, but the food cost in the Chinese-style restaurant was relatively higher than that in the Japanese-style restaurant. These descriptive results demonstrate that Japanese chefs probably tend to spend more time on the visual presentation of food in order to present a better layout to customers. Therefore, the Chinese-style food operation managers may have room for food cost improvement. The average popularity (4.73%) and unit profit (NT$70.17) in the Japanese-style restaurant were different with those (popularity was 5% and unit profit was NT$19.08) in the Chinese-style restaurant.

Table 1.
Descriptive statistics of resource consumption and output generation in two styles of restaurants.
Researchers [13,16] have suggested examining the correlation (isotonicity) between inputs and outputs before using the DEA. This study examined the correlation coefficients between the inputs and outputs in order to characterize the production economic theory [10]. There was a positive relationship between each input and output in Table 2, therefore, supporting hypotheses H1, H2, and H3.
Table 2.
Isotonicity test between the inputs and outputs for menu items.
4.2. Efficiency Score
Through Equation (1), the efficiency score of 35 menu items in these two types of restaurants are shown in Figure 2.
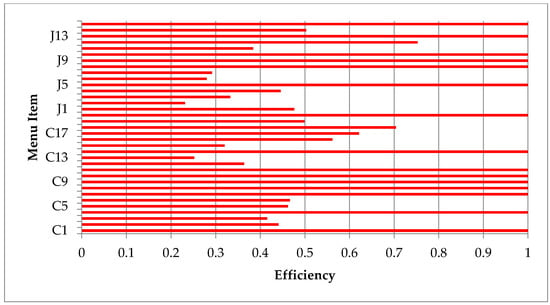
Figure 2.
Efficiency score for 35 menu items. Note: C1–C20 represent the menu item number in the Chinese-style restaurant; J1–J15 represent the menu item number in the Japanese-style restaurant.
Figure 2 indicates that the average efficiency score was 0.68; the standard deviation was 0.3, which represents there is 32% improvement to achieve the efficient frontier, meaning that it was 32% inefficient compared to the benchmark groups. This implies that the restaurateur could request a 32% reduction in the current inputs while maintaining the current output level. The average efficiency of menu items in the Japanese-style restaurant and Chinese-style restaurant was 0.65 and 0.71, respectively, which means that it was 35% and 29% inefficient compared to the benchmark groups. This implies that the food operation managers could request a 35% and 29% reduction in the current inputs while maintaining the current output level in the Japanese-style and Chinese-style restaurants, respectively.
Further quadrant analysis and efficiency disaggregation are necessary to prioritize the input resource improvement. Meanwhile, nine out of 20 (45%) menu items in the Chinese-style restaurant performed efficiently in contrast to six out of 15 (40%) menu items in the Japanese-style restaurant that performed efficiently. A comparison of the efficiency score of the menu items between the two types of restaurants using the independent samples t-test with equal variances (the Levene test was insignificant as the F-value = 0.911 and p-value = 0.347) indicated a statistically insignificant difference (p-value = 0.574; t-value = 0.568). This result showed that there was an insignificant difference in the efficiency scores between the Japanese-style and Chinese-style restaurants.
4.3. The Four-Quadrant Analysis
The literature used the business strategy mechanism, as defined by the Boston Consulting Group, to demonstrate the link between a net income and efficiency [3,29,30]. Table 3 and Table 4 show the unit profit, efficiency, classification, and quadrant for each menu items in the Japanese-style restaurant and Chinese-style restaurant.
Table 3.
Unit profit and efficiency score for each menu item in the Japanese-style restaurant.
Table 4.
Unit profit and efficiency score for each menu item in the Chinese-style restaurant.
The cut-off point for the unit profit and efficiency in this quadrant analysis was NT$70.17 and 0.65 in the Japanese-style restaurant in Table 3 and NT$19.08 and 0.71 in the Chinese-style restaurant in Table 4, respectively. A higher unit profit revealed that these menu items achieved their short-term objective, in contrast to higher levels of efficiency, implying that these menu items have potential growth as fewer input resources are used to generate more popularity and profit. Once the unit profit of the menu item is higher than the average value, the fourth column of unit profit was classified into “High”, and otherwise classified into “Low”. The same rule applied to the efficiency of the menu item in column five.
This paper further developed the four-quadrant matrix derived from BCG, in contrast to only one efficiency index [13]. The matrix in this paper was formulated by efficiency (long-term sustainability) and unit profit (short-term profitability) [12] and presents the benchmark and improvement directions. The horizontal axis represents the efficiency derived from Equation (1). This paper used the average efficiency value and unit profit of 20 menu items in the Chinese-style restaurant and 15 menu items in the Japanese-style restaurant as the cutting points of two axes in the four-quadrant analyses in Figure 3 and Figure 4.
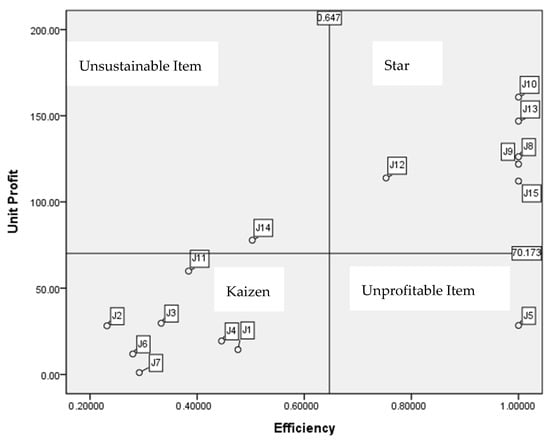
Figure 3.
The quadrant-based analysis for the Japanese-style restaurant. J1–J15 represents the menu item number in the Japanese-style restaurant.
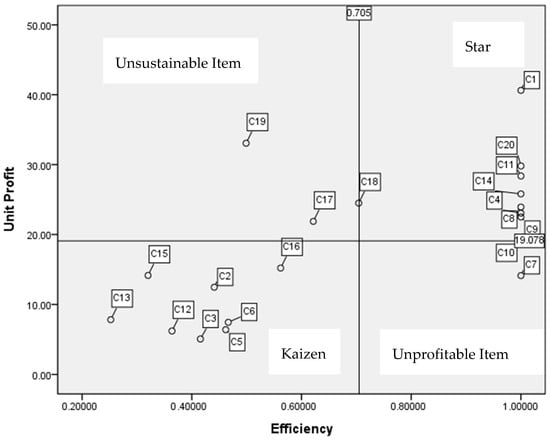
Figure 4.
The quadrant-based analysis for the Chinese-style restaurant. C1–C20 represents the menu item number in the Chinese-style restaurant.
Based on the four quadrants named as “Star” with high efficiency and high unit profit, “Unsustainable item” with low efficiency score and high unit profit, “Unprofitable item” with high efficiency and low unit profit, and “Kaizen” with low efficiency and low unit profit, this paper provided strategic improvement suggestions on these menu items from Figure 3 for the Japanese-style restaurant and Figure 4 for the Chinese-style restaurant, respectively.
Quadrant “Star”: The well-performing menu items in the Japanese-style restaurant in Figure 3 and Chinese-style restaurant in Figure 4 attained an efficiency and unit profit higher than the mean values of the corresponding statistics. Six menu items in Figure 3 and eight menu items in Figure 4 were located in the Star quadrant, representing menu items that have a high unit profit and high efficiency. The menu items in the Star quadrant were taken as being on the best practice frontier. The food operation managers need to retain these items in a highly visible position on the menu and implement standard food quality control and proficient cooking skills in order to maintain the best efficiency and profitability [5,32].
Quadrant “Unsustainable item”: The profitable menu items with a lower efficiency score were in this quadrant. There was one item in Figure 3 and three items in Figure 4, implying that more inefficient menu items existed in the Chinese-style restaurant compared to the Japanese restaurant even though the average efficiency score (0.71) of the Chinese-style restaurant was higher than that (0.65) of the Japanese-style restaurant. This paper utilized the total-factor framework and Equations (2)–(10) to calculate the total factor resource efficiency to provide the resource improvement suggestions.
Quadrant “Unprofitable item”: This quadrant contained items that reached higher efficiency scores but lower profits, including one item in the Japanese-style restaurant, and one item in the Chinese-style restaurant. The higher efficiency means that if the food operation manager is able to increase the input resources for the menu items in this quadrant, then these items would attain more popularity and profit. In terms of increasing unit profit, there are two ways to improve this: one is to add value perception into this menu item from the customer perspectives in order to increase the sales price; another is to reduce the unit food and labor cost.
Quadrant “Kaizen”: These are menu items with lower efficiency and lower unit profit compared to the corresponding cutting points located in this “Kaizen” quadrant, implying that the food operation managers need to adjust or drop these items from the menu. There were seven items in the Japanese-style restaurant and eight items in the Chinese-style restaurant.
4.4. The Total-Factor Framework to Disaggregate the Input Resource Efficiency
For the menu items with an efficiency score less than 1.0, the extant research used the total-factor framework to disaggregate the input resource efficiency. This paper disaggregated the efficiency score into the food cost efficiency and labor cost efficiency in order to prioritize the resource improvement for the menu items located in the quadrant “Unsustainable item”.
The empirical results in Table 5 and Table 6 indicate that the average food cost saving target ratio (FCSTR) and the average labor cost saving target ratio (LCSTR) derived by Equations (6) and (7) were 24.24% and 49.99% in the Japanese-style restaurant and 19.59% and 39.1% in the Chinese-style restaurant, respectively. These results imply that a higher saving target ratio represents more improvement for these inefficient menu items. From the total-factor food cost efficiency (TFFCE) and total-factor labor cost efficiency (TFLCE) derived by Equations (9) and (10), these results indicate that the average TFFCE (75.76%) in the Japanese-style restaurant was lower than that (80.41%) in the Chinese-style restaurant. Meanwhile, the average TFLCE (50.1%) in the Japanese-style restaurant was lower than that (60.9%) in the Chinese-style restaurant.
Table 5.
Total-factor resource efficiency in the Japanese-style restaurant.
Table 6.
Total-factor resource efficiency in the Chinese-style restaurant.
To compare the results in these two types of restaurants, the first priority for resource improvement is labor cost because the average TFLCEs were relatively lower than the TFFCEs in these two types of restaurants, implying that the disaggregated labor cost efficiency scores were less than the disaggregated food cost efficiency. The Taiwanese government passed a policy of one fixed day off and one flexible rest day, which provides the laborers with enough rest from work. Even though the laborers could obtain a higher hourly wage for working overtime, this labor law amendment has become another new challenge for the labor intensive restaurant industry. The extant study also suggested that increasing the utilization rate for the food and labor resources could generate more economic benefits [3].
Meanwhile, the relatively complicated operating processes in the Japanese-style restaurant may be the main reason leading to the lower labor cost efficiency. Based on the findings in Table 5 and Table 6, the restauranteur needs to address the enhancement of labor cost efficiency for each menu item first.
Following the results from the quadrant-based analysis, the menu items with profitable but lower efficiency score located in the “Unsustainable item” quadrant need to be improved. There was one item “J14” in the Japanese-style restaurant and three items “C17, C18, and C19” in the Chinese-style restaurant in the “Unsustainable item” quadrant. According to the disaggregation efficiency in Table 5 and Table 6, these four items had a relatively lower labor cost efficiency compared to the other resources. The food operation managers need to put labor cost improvement as the first priority for these inefficient items. They may initiate the following possible methods for labor cost improvement: (1) establishing standard receipts and operation procedures [33] or taking the best performed items as a benchmark such as the menu items located in the “Star” quadrant, for example, by taking the menu items “J8”, “J9”, “J10”, “J12”, ”J13”, “J15” in the Japanese-style restaurant and “C1”, “C8”, “C9”, “C11”, “C14”, “C20” in the Chinese-style restaurant as a benchmark; (2) benchmarking efficient cooking skills such as cook-chill and cook-freeze systems [9]; (3) using pre-prepared food or pre-cooked food ingredients to reduce the processing time [34]; and (4) hiring more part-time employees instead of full-time employees to maintain cost flexibility [3].
The Levene homogenous variance test value was 26.759 (p-value < 0.000) for TFFCE, TFLCE, and TFSE, indicating that the hypothesis of the homogenous variance of three types of efficiency scores was rejected. The post-hoc Games–Howell test in Table 7 shows that the TFFCEs were higher than the TFLCEs, indicating that the labor cost efficiency would be the first priority for resource improvement compared to other resources.
Table 7.
Efficiency comparison among three types of efficiency (TFFCE, TFLCE, and TFSE).
5. Implications and Future Research
5.1. Theoretical Implications
This paper contributed to two objectives: the first objective was to use the input-oriented SBM-DEA to calculate the menu item performance; and the second contribution of this study was to decompose the menu item performance into the different resource consumption efficiencies such as total-factor food cost efficiency (TFFCE) and total-factor labor cost efficiency (TFLCE) within the total-factor framework to simultaneously consider food, labor resources, numbers of food suppliers, and menu item interdependency in different style restaurants. The restaurateur could improve the lower total-factor resource efficiency first based on the efficiency decomposition in order to enhance the most-needed improvement. Based on these empirical results, the current study provides the following theoretical implications. First, this paper developed an innovative method and utilized the SBM-DEA model integrated with the BCG strategic matrix analysis and disaggregated food and labor cost performance from the total-factor framework that could enhance the menu’s financial performance and sustainability in the Chinese- and Japanese-style restaurant chains. Using the SBM-DEA efficiency model could increase the discrimination power of a decision making unit’s efficiency score [19]. A measurement method that takes only one or a few input resources to produce outputs into consideration may lead to limitations and a potentially inaccurate efficiency assessment [35]. The SBM-DEA model considers multiple input resources and multiple outputs simultaneously to generate one efficiency index for menu items in the Japanese- and Chinese-style of restaurants. This empirical result was consistent with those of Taylor et al. [13] using the DEA model for the homogeneous menu items, however, the current study used the SBM-DEA to enhance the discrimination power of the menu item efficiency.
Second, the extant research used to address the food cost efficiency was due to the fact that the food cost was the primary cost components of the menu items. With the continuous labor costs increasing, the empirical results of this paper used the disaggregated efficiencies from the total-factor framework to argue that the labor cost would be the center of cost management in these Japanese- and Chinese-style restaurants. The literature argued that prepared vegetables, the use of cook-chill techniques, and the amount of equipment needed would achieve a better performance [36,37]. The menu engineering model [28] only considered the food cost for each menu item, so neglecting the labor cost may distort the profit value information nowadays.
Third, this current study adopted the BCG strategy to formulate the quadrant-based matrix using the short-term profitability (unit profit) and long-term sustainability (efficiency) as two axes. Consistent with earlier studies [12,29,30] in other research areas, the quadrant-based matrix could also provide strategic decisions for food operation managers. In the quadrant “Unsustainable items”, this paper utilized the total-factor framework to decide the resource improvement priority.
5.2. Practical Implications
The practical implications of the current study are as follows. First, rather than simply using their intuition, the food operation managers could periodically assess the efficiency score and unit profit based on this innovative method to identify menu items to be benchmarked, improved, or kaizen and to augment the financial and sustainable performance in the catering business.
Second, the food operating managers in this study should expedite the cooking processes of the inefficient menu items in order to increase the disaggregating labor cost efficiency in the Japanese- and Chinese-style restaurants. The earlier study argued that the food operation managers could utilize the deferred system (the cook-warm and cook-chill), which allows for the food to be prearranged at times and places unravelling from the dining place [37]. In the cook-warm system, the food is delivered at a temperature of 65 °C and the eating is best to occur within two hours after cooking [38]. The cook-chill system is defined as a cooking system based on the full culinary of food followed by fast chilling and storage in controlled low-temperature circumstances above the freezing point, usually 0–3 °C [39]. Another study also suggested that food preparation and cooking are employed in centralized kitchens, from which prepared meals are delivered to consumers as long as a hazard analysis and critical control point (CCP) determination for cook-chilled menu items in a centralized kitchen are carried out [40].
Third, outsourcing parts of the food preparation to food ingredient suppliers might be a feasible solution to enhance the labor cost efficiency [41]. In addition, finding out new local food ingredient suppliers might be a better alternative to manage the costs. The extant study [42] argued that food operation managers should carefully choose food vendors to reduce the delivery time and wastage through proper production planning when used locally produced foods. Lo [43] argued that corporate sustainability is defined as a business model to produce long-term shareholder value with certain level of resources, indicating that an organization’s sustainability is by generating net income and attracting more investors. The extant research also supports that an efficiency score could be valued as a sustainable index that uses less input resources to produce the outputs [44]. Thus, the study would collect food wastage after meals as one of the undesirable outputs of the DEA model to measure the sustainable efficiency index.
In addition, restaurants need to re-examine the production process to decrease the cooking time and steps during peak times in order to fulfil the increasing trends from online food delivery services. Hiring more part-time employees instead of full-time employees might be a better way to reduce the labor costs and have more flexibility in increasing the popularity through price-cut competition [3].
Finally, through observations and in-depth interviews with the chefs in the Chinese-style restaurant, the chefs started to utilize cooking equipment and culinary techniques to improve labor cost efficiency. For example, they utilized a pressure cooker for braised pork to reduce the labor processing time. Senior practical experiences from chefs in collaboration with state-of-the-art cooking technology and equipment would identify better and quicker cooking processes in different types of restaurants.
5.3. Limitations and Future Research
The major contribution of this study was to develop an innovative SBM-DEA model to evaluate the menu item efficiency with a better discrimination power and determine the input targets for each menu item by comparing the efficiency frontier, though the study is subject to some limitations. First, as few of the restaurant chains in Taiwan are publicly listed companies, the research data were obtained from the Chinese- and Japanese-style restaurants through confidential agreements, thus the observant data limit the generalizability of these findings to other types of restaurants. Future research can first extend this model to other types of restaurants with available operating information. Furthermore, due to data availability, this study did not discuss the environmental impacts on the efficiency of menu items that might use different food preparation and cooking skills to help identify environmentally sustainable solutions. The operating expenses in each menu item were another data limitation. Future study could include the energy and operating expenses into this model to cover more operating and financial data as well as including other restaurant chains with similar menus in order to generalize this empirical result to other types of restaurants.
Funding
This study was funded by Taiwan’s Ministry of Science and Technology (MOST 103-2410-H-003-100, MOST 106-2410-H-003 -107 -MY2 and MOST 108-2511-H-003-052) and the National Taiwan Normal University, Taiwan.
Acknowledgments
The authors wishes to thank the project partners for their help in collecting the data from two types of restaurant chains.
Conflicts of Interest
The author declares no conflict of interest.
References
- Sufiyan, M.; Haleem, A.; Khan, S.; Khan, M.I. Evaluating food supply chain performance using hybrid fuzzy MCDM technique. Sustain. Prod. Consum. 2019, 20, 40–57. [Google Scholar] [CrossRef]
- Takacs, B.; Borrion, A. The use of life cycle-based approaches in the food service sector to improve sustainability: A systematic review. Sustainability 2020, 12, 3504. [Google Scholar] [CrossRef]
- Chou, S.F.; Fang, C.Y. Exploring surplus-based menu analysis in Chinese-style fast food restaurants. Int. J. Hosp. Manag. 2013, 33, 263–272. [Google Scholar] [CrossRef]
- Aramyan, L.H.; Lansink, A.G.O.; Van Der Vorst, J.G.; Van Kooten, O. Performance measurement in agri-food supply chains: A case study. Supply Chain Manag. Int. J. 2007, 12, 304–315. [Google Scholar] [CrossRef]
- Fang, C.Y.; Hsu, F.S. An efficiency-based metafrontier approach to menu analysis. J. Hosp. Tour. Res. 2014, 38, 199–221. [Google Scholar] [CrossRef]
- Magnini, V.P.; Kim, S. The influences of restaurant menu font style, background color, and physical weight on consumers’ perceptions. Int. J. Hosp. Manag. 2016, 53, 42–48. [Google Scholar] [CrossRef]
- Fang, C.Y.; Hsu, F.S. Meal category analysis: An application of the metafrontier approach. Tour. Econ. 2012, 18, 1083–1095. [Google Scholar] [CrossRef]
- Noone, B.M.; Cachia, G. Menu engineering re-engineered: Accounting for menu item substitutes in pricing and menu placement decisions. Int. J. Hosp. Manag. 2020, 87, 102504. [Google Scholar] [CrossRef]
- Greathouse, K.R.; Gregoire, M.B.; Spears, M.C.; Richards, V.; Nassar, R.F. Comparison of conventional, cook-chill, and cook-freeze foodservice systems. J. Am. Diet. Assoc. 1989, 89, 1606–1611. [Google Scholar]
- Coelli, T.J. Recent developments in frontier modeling and efficiency measurement. Aust. J. Agric. Econ. 1995, 39, 219–245. [Google Scholar]
- Song, M.; Jia, G.; Zhang, P. An evaluation of air transport sector operational efficiency in China based on a three-stage DEA analysis. Sustainability 2020, 12, 4220. [Google Scholar] [CrossRef]
- Fang, C.Y.; Peng, P.Y.; Pan, W.T. Does using an a la carte or combo set menu affect the performance of a teppanyaki-style restaurant? Int. J. Contemp. Hosp. Manag. 2013, 25, 491–509. [Google Scholar] [CrossRef]
- Taylor, J.; Reynolds, D.; Brown, D.M. Multi-factor menu analysis using data envelopment analysis. Int. J. Contemp. Hosp. Manag. 2009, 21, 213–225. [Google Scholar] [CrossRef]
- Assaf, A.G.; Deery, M.; Jago, L. Evaluating the performance and scale characteristics of the Australian restaurant industry. J. Hosp. Tour. Res. 2011, 35, 419–436. [Google Scholar] [CrossRef]
- Reynolds, D. Hospitality-productivity assessment using data envelopment analysis. Cornell Hotel Restaur. Adm. Q. 2003, 44, 130–137. [Google Scholar]
- Reynolds, D.; Biel, D. Incorporating satisfaction measures into a restaurant productivity index. Int. J. Hosp. Manag. 2007, 26, 352–361. [Google Scholar] [CrossRef]
- Reynolds, D.; Thompson, G.M. Multiunit restaurant productivity assessment using three-phase data envelopment analysis. Int. J. Hosp. Manag. 2007, 26, 20–32. [Google Scholar] [CrossRef]
- Roh, E.Y.; Choi, K. Efficiency comparison of multiple brands within the same franchise: Data envelopment analysis approach. Int. J. Hosp. Manag. 2010, 29, 92–98. [Google Scholar] [CrossRef]
- Chang, M.C.; Hu, J.L.; Chen, C.H. A metafrontier pollution efficiency analysis of Taiwan’s administrative regions. J. Clean. Prod. 2019, 222, 393–406. [Google Scholar] [CrossRef]
- Huo, T.; Tang, M.; Cai, W.; Ren, H.; Liu, B.; Hu, X. Provincial total-factor energy efficiency considering floor space under construction: An empirical analysis of China’s construction industry. J. Clean. Prod. 2020, 244, 118749. [Google Scholar] [CrossRef]
- Hu, J.L.; Wang, S.C. Total-factor energy efficiency of regions in China. Energy Policy 2006, 34, 3206–3217. [Google Scholar] [CrossRef]
- Hu, J.L.; Kao, C.H. Efficient energy-saving targets for APEC economies. Energy Policy 2007, 35, 373–382. [Google Scholar] [CrossRef]
- Honma, S.; Hu, J.L. Total-factor energy efficiency for sectors in Japan. Energy Sources Part B 2013, 8, 130–136. [Google Scholar] [CrossRef]
- Tone, K. A slacks-based measure of efficiency in data envelopment analysis. Eur. J. Oper. Res. 2001, 130, 498–509. [Google Scholar] [CrossRef]
- Chiu, C.N. How can managerial efficiency be improved? Evidence from the bed and breakfast industry. Tour. Manag. Perspect. 2018, 27, 111–124. [Google Scholar] [CrossRef]
- Kaplan, R.S.; Anderson, S.R. Time-driven activity-based costing. Harv. Bus. Rev. 2004, 82, 131–138. [Google Scholar] [CrossRef]
- Donthu, N.; Hershberger, E.K.; Osmonbekok, T. Benchmarking marketing productivity using data envelopment analysis. J. Bus. Res. 2005, 58, 1474–1482. [Google Scholar] [CrossRef]
- Kasavana, M.L.; Smith, D.I. Menu Engineering: A Practical Guide to Menu Analysis; Hospitality Publications: Okemos, MN, USA, 1982. [Google Scholar]
- Lo, Y.C.; Fang, C.Y. Facebook marketing campaign benchmarking for a franchised hotel. Int. J. Contemp. Hosp. Manag. 2018, 30, 1705–1723. [Google Scholar] [CrossRef]
- Fang, C.Y.; Ding, Y.C. Perspectives of organizers and exhibitors on the performance assessment of exhibitors at an International Travel Fair. Int. J. Hosp. Manag. 2020, 87, 102469. [Google Scholar] [CrossRef]
- Suarez-Barraza, M.F.; Ramis-Pujol, J.; Kerbache, L. Thoughts on kaizen and its evolution: Three different perspectives and guiding principles. Int. J. Lean Six Sigma 2011, 2, 288–308. [Google Scholar] [CrossRef]
- Raab, C.; Shoemaker, S.; Mayer, K. Activity-based costing: A more accurate way to estimate the costs for a restaurant menu. Int. J. Hosp. Tour. Adm. 2007, 8, 1–14. [Google Scholar] [CrossRef]
- Salem-Mhamdia, A.B.H.; Ghadhab, B.B. Value management and activity based costing model in the Tunisian restaurant. Int. J. Contemp. Hosp. Manag. 2012, 24, 269–288. [Google Scholar] [CrossRef]
- Fertig, A.R.; Loth, K.A.; Trofholz, A.C.; Tate, A.D.; Miner, M.; Neumark-Sztainer, D.; Berge, J.M. Compared to pre-prepared meals, fully and partly home-cooked meals in diverse families with young children are more likely to include nutritious ingredients. J. Acad. Nutr. Diet. 2019, 119, 818–830. [Google Scholar] [CrossRef] [PubMed]
- Brown, D.M.; Hoover, L.W. Productivity measurement in foodservice: Past accomplishments--a future alternative. J. Am. Diet. Assoc. 1990, 90, 973–981. [Google Scholar]
- Clark, J.R. Improving catering productivity: By using cook-chill technology. Cornell Hotel Restaur. Adm. Q. 1997, 38, 60–67. [Google Scholar] [CrossRef]
- Fusi, A.; Guidetti, R.; Azapagic, A. Evaluation of environmental impacts in the catering sector: The case of pasta. J. Clean. Prod. 2016, 132, 146–160. [Google Scholar] [CrossRef]
- Williams, P.G.; DipNutrDiet, M.H.P. Vitamin retention in cook/chill and cook/hot-hold hospital foodservices. J. Am. Diet. Assoc. 1996, 96, 490–498. [Google Scholar] [CrossRef]
- Evans, J.; Russell, S.; James, S. Chilling of recipe dish meals to meet cook—chill guidelines. Int. J. Refrig. 1996, 19, 79–86. [Google Scholar] [CrossRef]
- Abd Lataf, D.L.; Mahyudin, N.A.; Mohammad Rashedi, I.F.; Hariri, R.; Abdullah, A.Z. Hazard analysis and critical control point (CCP) determination in cook-chilled beef curry and beef kurma. J. Tour. Hosp. Culin. Arts 2020, 12, 1–18. [Google Scholar]
- Reynolds, D.; Leeman, D. Does combining health care hospitality services increase efficiency? J. Hosp. Tour. Res. 2007, 31, 182–193. [Google Scholar] [CrossRef]
- Sharma, A.; Gregoire, M.B.; Strohbehn, C. Assessing costs of using local foods in independent restaurants. J. Foodserv. Bus. Res. 2009, 12, 55–71. [Google Scholar] [CrossRef]
- Lo, S.-F. Performance evaluation for sustainable business: A profitability and marketability framework. Corp. Soc. Respons. Environ. Manag. 2010, 17, 311–319. [Google Scholar] [CrossRef]
- Fang, C.-Y.F. Perspective of local government on the performance assessment of district sports and leisure centers. Sustainability 2020, 12, 9094. [Google Scholar] [CrossRef]
Publisher’s Note: MDPI stays neutral with regard to jurisdictional claims in published maps and institutional affiliations. |
© 2020 by the author. Licensee MDPI, Basel, Switzerland. This article is an open access article distributed under the terms and conditions of the Creative Commons Attribution (CC BY) license (http://creativecommons.org/licenses/by/4.0/).