Article

Performance Evaluation of Photovoltaic/Thermal (PV/T) System Using Different Design Configurations

1
Green Energy Technology Research Center, Kongju National University, Cheonan 122324, Korea
2
Department of Architectural Engineering, Kongju National University, Cheonan 122324, Korea
*
Author to whom correspondence should be addressed.
Sustainability 2020, 12(22), 9520; https://doi.org/10.3390/su12229520
Submission received: 30 September 2020 / Revised: 14 November 2020 / Accepted: 14 November 2020 / Published: 16 November 2020
(This article belongs to the Special Issue ZEMCH International Research 2020)

Abstract

:
This study summarizes the performance of a photovoltaic/thermal (PV/T) system integrated with a glass-to-PV backsheet (PVF film-based backsheet) and glass-to-glass photovoltaic (PV) cells protections. A dual-fluid heat exchanger is used to cool the PV cells in which water and air are operated simultaneously. The proposed PV/T design brings about a higher electric output while producing sufficient thermal energy. A detailed numerical study was performed by calculating real-time heat transfer coefficients. Energy balance equations across the dual-fluid PV/T system were solved using an ordinary differential equation (ODE) solver in MATLAB software. The hourly and annual energy and exergy variations for both configurations were evaluated for Cheonan City, Korea. In the case of a PV/T system with a glass-to-glass configuration, a larger heat exchange area causes the extraction of extra solar heat from the PV cells and thus improving the overall efficiency of the energy transfer. Results depict that the annual electrical and total thermal efficiencies with a glass-to-glass configuration were found to be 14.31% and 52.22%, respectively, and with a glass-to-PV backsheet configuration, the aforementioned values reduced to 13.92% and 48.25%, respectively. It is also observed that, with the application of a dual-fluid heat exchanger, the temperature gradient across the PV panel is surprisingly reduced.

1. Introduction

The increasing demand for energy in day-to-day activities causes the excessive use of fossil fuels, which ultimately results in an increase in greenhouse gas emissions [1]. This is where the international organizations for climate control intervene to compel power generation companies to use sustainable energy sources instead. Due to this reason, the generation of electricity and heat from renewable energy sources has dramatically increased in the last decade [2]. It is anticipated that the use of renewable energy for residential, domestic, and commercial sectors will increase in near future. The photovoltaic (PV) module is a device that is used to convert sun rays directly into electricity, whereas both electricity and heat can be harvested using emerging technology known as photovoltaic/thermal (PV/T) technology [3]. The PV/T system can be non-concentrating (flat plate collectors) or concentrating and usually, flat plate collectors do not need a tracking platform to locate the sun position across the day [4].
A large portion of incident solar radiation is ultraviolet and infrared in nature, which leads to an increase in the operating temperature of PV solar cells [5]. Therefore, in the context of lowering PV module temperature and consequently increasing thermal efficiency, an optimized heat exchanger design and working fluid having superior thermal properties are very important. Water and air are the most common fluids that have been used as coolants for PV modules over the decades [6]. It has been observed that the PV/T system using water as a working fluid showed higher power conversion efficiency than that of air. Liquid fluids have always been the best choice to cool PV cells, rather than air, because of their excellent heat transfer capabilities. PV/T technology can also be categorized as glazed- and unglazed-PV/T systems [7,8]. The unglazed PV/T systems are comparatively inexpensive and considered best especially under high ambient temperature conditions compared to glazed PV/T systems. Furthermore, Vats et al. [9] analyzed the influence of packing factor on the overall energy performance of the semitransparent photovoltaic thermal system. For the comparison purpose, they have considered various types of solar cells with different packing factors, based on the results it was concluded that decreasing the packing factor decreases the PV module temperature and increases the sunlight transmission through the non-packing area.
When the quality of energy is a prime concern, the exergy analysis becomes as important as the energy analysis [10,11], especially for a co-generation system which is producing both electricity and heat simultaneously. The literature review revealed that several studies on the exergy analysis of various solar energy systems have been carried out with the intention of developing new methods and equations [12]. Pathak et al. [13] developed a theoretical exergy model to compare the performance of the PV/T system with conventional systems for a limited roof area. Based on climatic data from three different locations, the exergy performance of the PV/T, PV, and solar thermal systems having similar collector areas were predicted and compared. The outcomes from the comparative analysis show that the PV/T system surpassed the exergy efficiency of both PV and solar thermal systems for all locations.
Over the years, the simultaneous application of two fluids as the coolant in the PV/T systems has been gaining popularity among researchers. Tripanagnostopoulous [14] was the first who introduced the concept of utilizing two working fluids for the same PV/T collector. Using this concept, several studies on the dual-fluid PV/T system regarding performance optimization using different fluids and conduit designs have been published [15]. Jarimi et al. [16] developed a 2-D steady-state model of a bi-fluid PV/T system considering a slight modification in the finned air channel. The simulation-based results were validated using indoor experimental data. The introduction of the dual-fluid concept in PV/T technology for the cooling of solar cells is promising in terms of optimizing solar energy use, where a total equivalent efficiency near 90% is achievable [17]. Additionally, with a smaller area, the dual-fluid PV/T system can generate extra thermal energy.
Based on the literature review, it has been observed that several studies have been performed in the field of PV/T technology considering different aspects e.g., single- and dual-fluid channels for air circulation. In addition, many reported articles had discussed liquid fluid with different designs of tubes such as circular, rectangular, and trapezoidal, etc. To the best of our knowledge, no studies have been reported on the dual-fluid semitransparent PV/T system, in which a glass protection underneath the solar cells has been provided instead of a PV backsheet (PVF film-based backsheet). Due to the provision of dual-fluid coolant and glass-to-glass PV protection, additional solar heat from the PV module surface can be extracted, which will result in the lower temperature of the PV cells compared to the glass-to-PV backsheet based PV/T system. In the dual-fluid semitransparent PV/T system, the percentage of harvested energy per unit area is higher than the conventional glass cover PV/T system. It would therefore be an excellent choice to provide energy for the building and industrial sector.

2. Research Methods

2.1. Mathematical Model

In this study, the transient thermo-electric models for the glass-to-PV backsheet and glass-to-glass PV/T systems are developed and proposed. The transient mathematical model for the sheet-and-tube PV/T system reported by Chow [18] was modified and employed for the proposed design. The energy balance equations for various components were solved using an ODE solver in Matlab software. The following assumptions have been considered during mathematical modeling:
(1)
There is no change in the physical dimensions and material properties of the collector components.
(2)
For the parallel tube heat exchanger, temperature and flow rate in all tubes were taken as same.
(3)
The ohmic losses in the PV cells and edge losses are neglected.
(4)
All heat transfer coefficients were calculated in real-time [19].
(5)
Only the absorption loss of glass is taken into consideration.
(6)
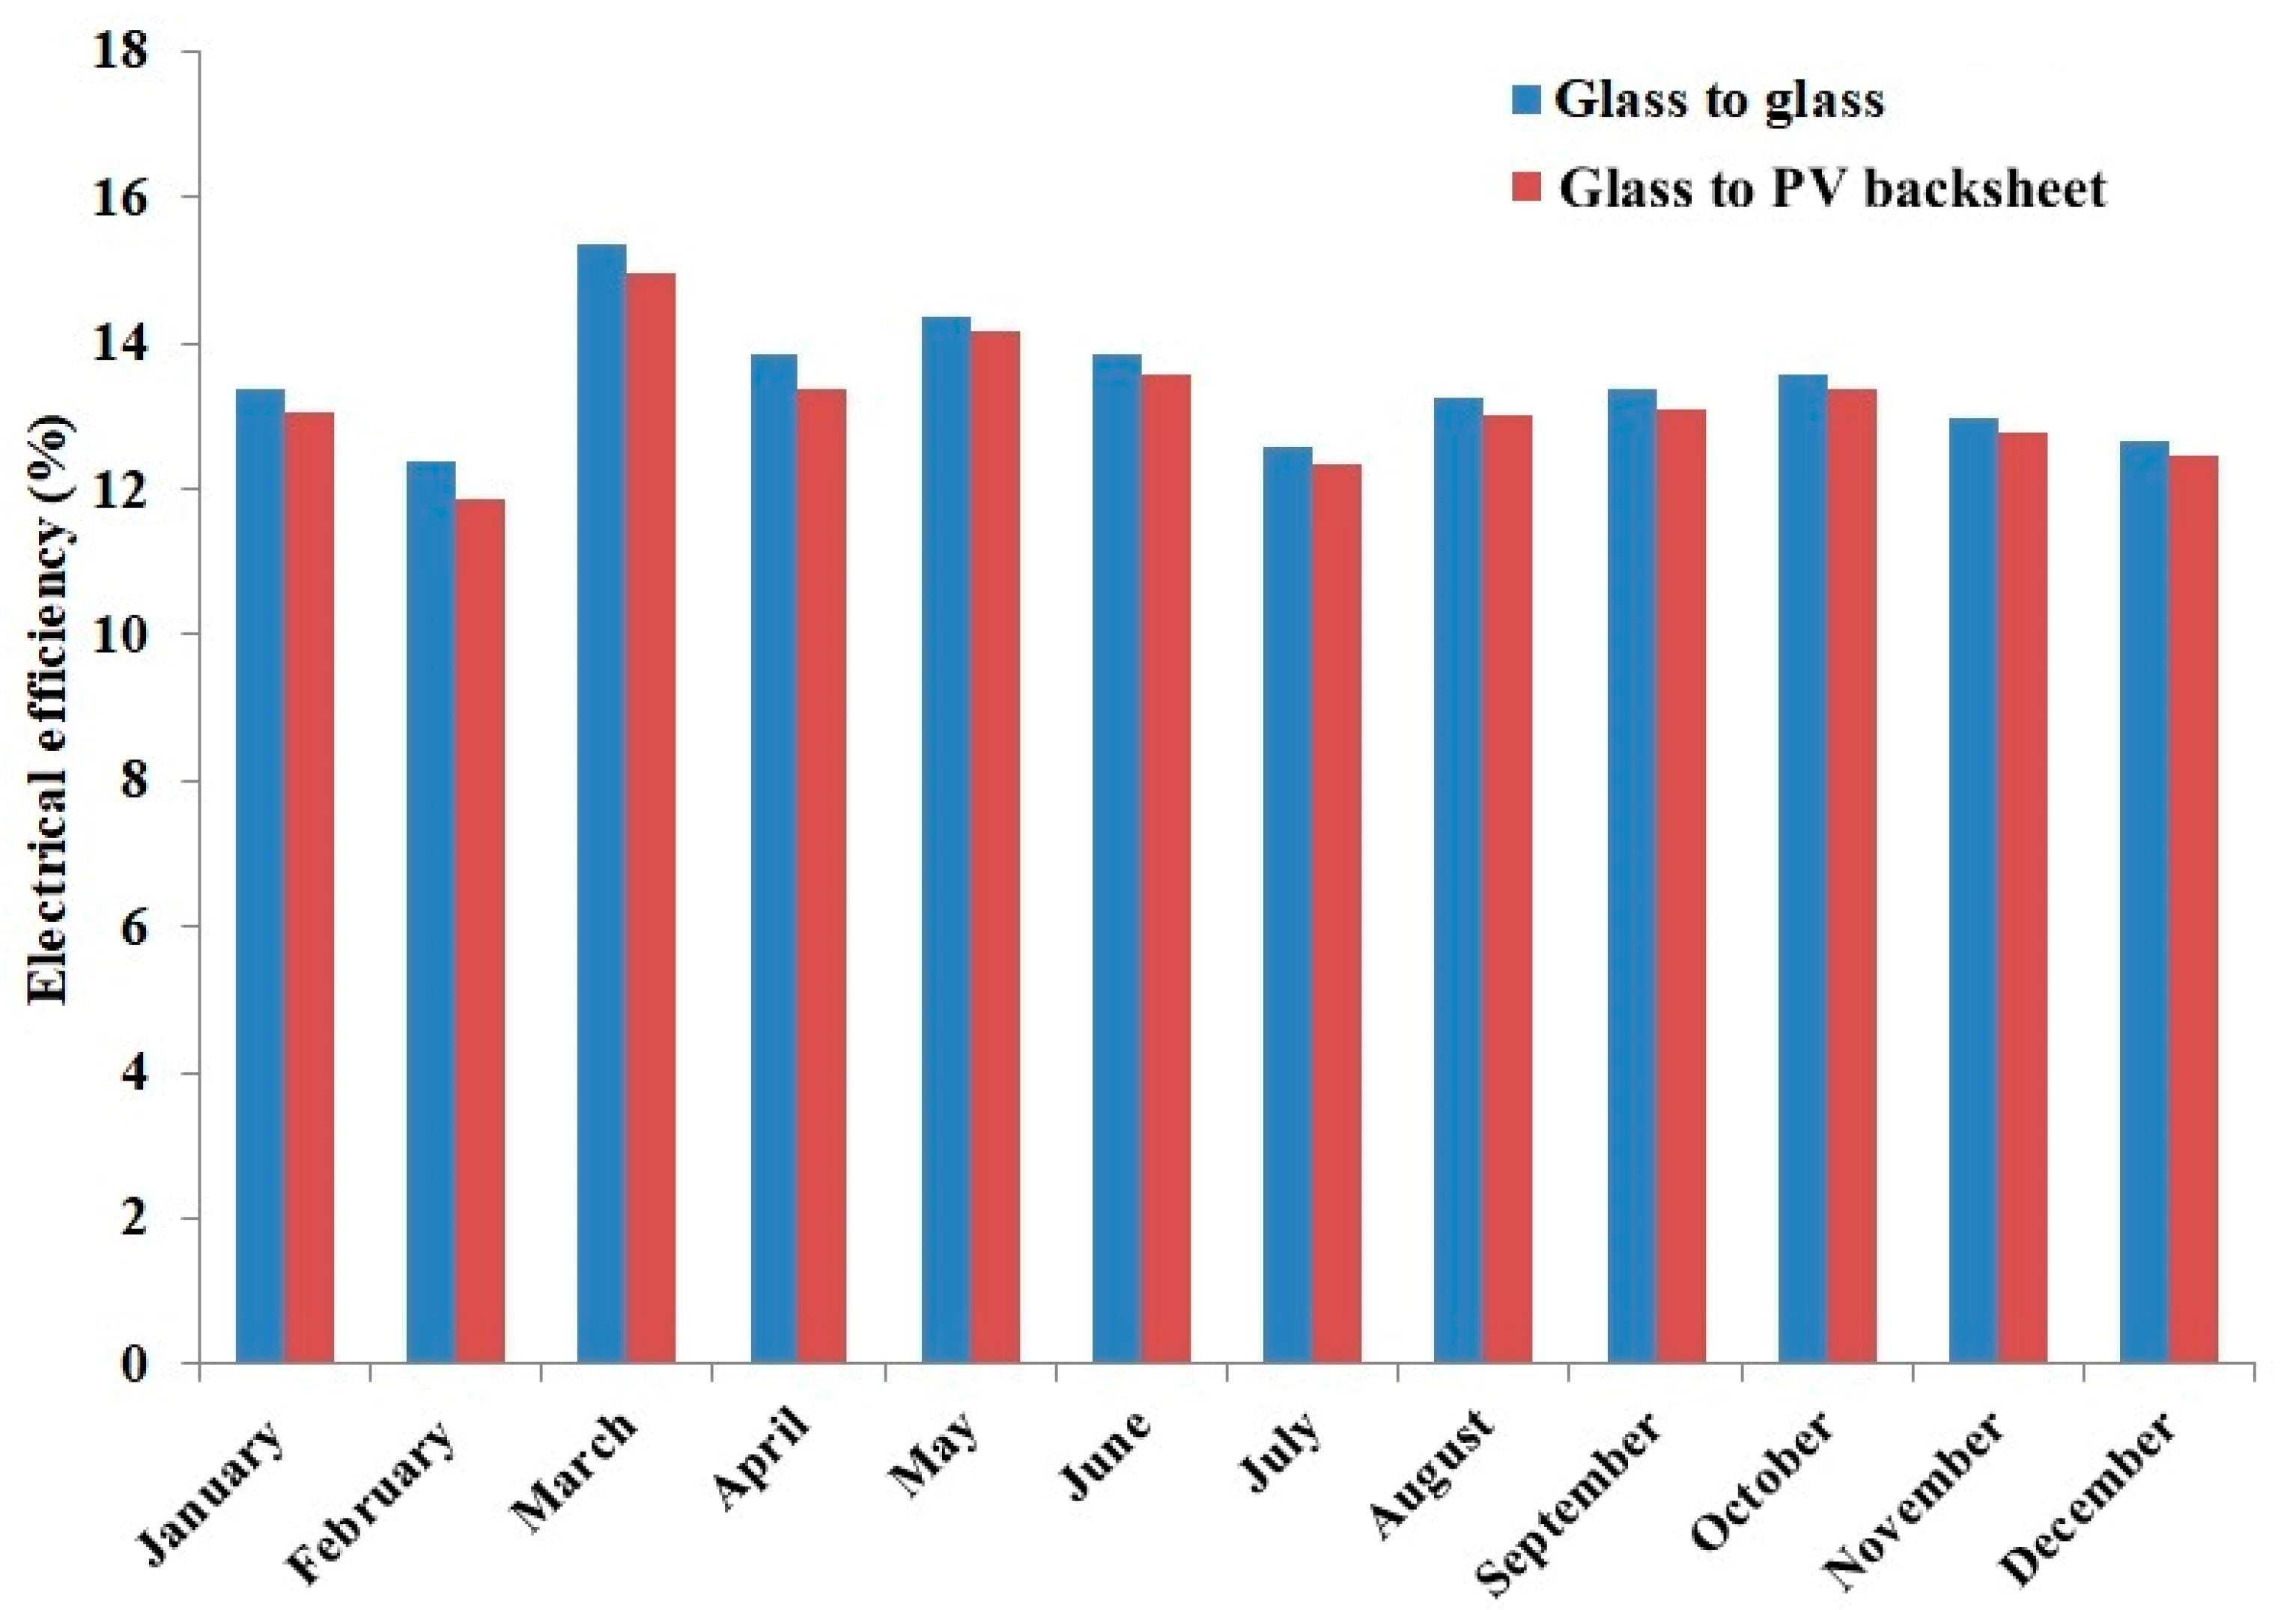
For the glass-to-glass case, the glass cover2 serves as a sheet for the copper tube (carrying water), while for the glass-to-PV backsheet case, the PV backsheet works as a sheet for the copper tube considering famous sheet and tube configuration.
Energy balances for glass-to-glass and glass-to-PV backsheet cases
Glass cover1
M g 1 C g 1 ( dT g 1 / dt ) = G α 1 + h pg 1 A pg 1 ( T s T g 1 ) h wind A g 1 ( T g 1 T ) h g 1 A g 1 ( T g 1 T )
PV cells (glass-to-PV backsheet)
M s C s ( dT s / dt ) = G α 2 E h sg 1 A sg 1 ( T s T g 1 ) h sp A sp ( T s T p )
PV cells (glass-to-glass)
M s C s ( dT s / dt ) = G α 2 E h sg 1 A sg 1 ( T s T g 1 ) h sg 2 A sg 2 ( T s T g 2 )
PV backsheet
M p C p ( dT p / dt ) = G α 3 + h sp A sp ( T s T p ) h pt A pt ( T p T t ) A pa   h pa ( T p T a ) h pb A pb ( T p T b )
Glass cover2
M g 2 C g 2 ( dT g 2 / dt ) = G α 4 + h sg 2 A sg 2 ( T s T g 2 ) h tg 2 A tg 2 ( T g 2 T t ) A ag 2   h ag 2 ( T g 2 T a ) h bg 2 A bg 2 ( T g 2 T b )
where G is the irradiance and E is the electrical power generated by the PV cells. h wind is the convection heat transfer coefficient due to wind [20]. h g is the radiation heat transfer coefficient between glass cover1 and ambient air, and h sg 1 is the conduction heat transfer coefficient between glass cover1 and the PV cells. h pt is the conduction heat transfer coefficient between PV cells and the tube, h pa is the convection heat transfer coefficient between PV cells and the circulating air, h pb is the radiation heat transfer coefficient between the PV cells and the back panel, and h sp is the conduction heat transfer coefficient between PV cells and the tube. h sg 2 is the conduction heat transfer coefficient between glass cover2 and PV cells. h tg 2 is the conduction heat transfer coefficient between PV cells and the tube, and h ag 2 is the convection heat transfer coefficient between glass cover2 and the circulating air.
E = GPF ŋ e
ŋ e = ŋ r [ 1 β r ( T p T r ) ]
where PF is the packing factor and T p is the PV plate temperature. β r is the temperature coefficient and ŋ e is the efficiency of the solar cells. T r and ŋ r are the reference cell temperature and efficiency, respectively.
h wind = 3 u a + 2.8
h g = ε g σ ( T g + T ) ( T g 2 + T 2 )
h pb = ( σ ( T p + T b ) ( T p 2 + T b 2 ) ) / ( 1 / ε p + 1 / ε b 1 )
where ε g is the emissivity of the glass and u a is the velocity caused by wind. ε p and ε b are the emissivity of the PV plate and back panel, respectively.
Back panel (glass-to-glass)
M b C b ( dT b / dt ) = G α 5 +   h tb A tb ( T t T b ) + h bg 2 A bg 2 ( T g 2 T b ) h ab A ab ( T b T a ) h b A b ( T b T )
Back panel (glass-to-PV backsheet)
M b C b ( dT b / dt ) = h tb A tb ( T t T b ) + h pb A pb ( T p T b ) h ab A ab ( T b T a ) h b A b ( T b T )
where h tb is the radiation heat transfer coefficient between the tube and back panel, and h ab is the convection heat transfer coefficient between the back panel and the circulating air. h b is the heat loss coefficient between the back panel and ambient air. h bg 2 is the radiation heat transfer coefficient between the glass cover2 and the back panel.
Considering only absorption losses, solar radiation absorbed across the PV/T system components is defined as follows:
α 1 = α g 1
α 2 = ( 1 α g 1 ) A s   α s
α 3 = ( 1 α g 1 ) ( 1 α s ) ( 1 A R )   α p
α 4 = ( 1 α g 1 ) ( 1 α s ) ( 1 A R )   α g 2
α 5 = ( 1 α g 1 ) ( 1 α g 2 ) ( 1 α s ) ( 1 A R )   α b
where A s is the area covered by solar cells and   α s are the absorptivity of the PV cells. A R is the ratio of area covered by the collector to the PV cells [21]. α p and   α b are the absorptivity of the PV backsheet and back panel, respectively. In glass-to-glass case, α g 1 and α g 2 are the absorptivity of the glass cover1 and glass cover2, respectively.
Tube
M t C t ( dT t / dt )   = h pt A pt ( T p T t )   A tf   h tf ( T t     T f )   A ta   h ta ( T t T a ) h tb A tb ( T t T b )
M t C t ( dT t / dt )   = h tg 2 A tg 2 ( T g 2 T t )   A tf   h tf ( T t     T f )   A ta   h ta ( T t T a ) h tb A tb ( T t T b )
h tf is the convection heat transfer coefficient between the tube and the fluid and h ta is the convection heat transfer coefficient between the tube and the circulating air.
Circulating water
M f C f ( dT f / dt ) = f C f   ( T f , o T f , in ) +   A tf   h tf ( T t     T f )
f and C f are the mass flow rate and specific heat of the pipe fluid. T f , in and T f , o are the inlet and outlet temperature of the pipe fluid. As reported by, the average convective heat transfer coefficient is important because it considers both convection modes (natural and forced) and entrance effects. It can be shown that
1 h tf A tf = 1 h f π D i L + 1 C bo L
h f is a convective heat transfer, for a fully developed laminar flow which can be given as:
h f = 4.364 k f D i
for a fully developed turbulent flow, which can be obtained from the Dittus–Boelter equation [22], k f is the thermal conductivity of the water and D i is the internal diameter of the tube.
Nu D = 0.023 R e D 0.8 P r 0.4
Nu , Re , and Pr are Nusselt, Reynolds, and Prantle numbers, respectively.
C bo = k bo   W bo δ bo
where C bo is the bond conductance and k bo is the thermal conductivity of the bond or adhesive. W bo and δ bo are the width and thickness of the bond.
Circulating air
M a C a ( dT a / dt ) = a C a   ( T a , o T a , in ) +   A pa   h pa ( T p T a ) +   A ta   h ta ( T t T a ) + h ab A ab ( T a T b )
a and C a are the mass flow rate and specific heat of the circulating air. T f , in and T f , o are the inlet and outlet temperature of the circulating air. The useful thermal energy and efficiency of the dual-fluid PV/T system are given as follows:
Q u = f C f   ( T f , o T f , in ) +   a C a   ( T a , o T a , in )
ŋ th = Q u A c G
where Q u and ŋ th are the useful thermal energy and efficiency of the dual-fluid PV/T system. The equivalent thermal efficiency can be calculated as:
ŋ PVT = ŋ th + ŋ e / ŋ pp
ŋ PVT and ŋ e are the equivalent thermal and electrical efficiencies, respectively. ŋ pp is the electric generation efficiency of the conventional power plant and its value is taken as 38%.

2.2. Exergy Analysis

Exergy is a thermodynamic concept which defines every transformation process that undergoes the loss of a measure of quality, especially considering low-quality energy such as thermal energy (heat) which involves temperature change. Exergy analysis becomes more important when the extraction of the maximum useful work from the system is concerned. The exergy balance for the single-fluid PV/T system given by Agrawal and Tiwari [23], is modified for the dual-fluid PV/T system for this study. The following equations show the inflow and outflow of exergy from the proposed system [24].
  Ex o =   E th +   Ex e
Ex o is the overall exergy gain, and E th and Ex e are the thermal and electrical exergy gains, respectively. For a dual-fluid PV/T system, the thermal exergy gain is the sum of thermal exergy against associated with circulating pipe fluid ( E th , f ) and air ( E th , a ), respectively, can be expressed as follows:
  E th =   E th , f +   E th , a
  E th , f = Q f f C f   ( T + 273 ) log ( T f , o + 273 T f , in + 273 )
  E th , a = Q a a C a   ( T + 273 ) log ( T a , o + 273 T a , in + 273 )
Q f and Q a are the useful thermal gain associated with circulating pipe fluid and air, respectively.
  Ex e = [ ŋ e GA c 1000 ]
Ex in = 0.933 G A c
ŋ Ex = [ Ex o Ex in ] 100
ŋ Ex is the exergy efficiency, Ex in and Ex o are exergy input and output to the system, respectively. The exergy inflow is dependent on the available solar radiation and the exergy outflow is associated with the thermal output. Therefore, exergy efficiency is more related to outlet temperature. This means that the higher the power output from the PV/T system lower is the entropy generation rate.

2.3. Description of Proposed PV/T Systems

The schematic and cross-section views of glass-to-PV backsheet and glass-to-glass dual-fluid PV/T systems are shown in Figure 1. In the glass-to-PV backsheet case, the PV cells are sandwiched between the glass cover and PV backsheet, whereas in a glass-to-glass case, PV cells are sandwiched between two glass covers. The solar cells are placed at an equal distance across the collector area, such as the distance between two neighboring solar cells, which was maintained by 20 mm. The PV/T system is comprised of two heat exchangers such as parallel arranged tubes to carry water as coolant and an underneath channel for air circulation. A set of baffles was arranged transverse to airflow on the channel surface with the intention to enhance turbulence and to diminish streamline flow. The tubes carrying water coolant were made of copper and the back panel or air channel was made of chlorinated polyvinyl chloride (CPVC). In order to increase the emissivity and heat transfer rate, both the air channel and copper tube were painted jet black. Both glass-to-PV backsheet and glass-to-glass cases had identical physical dimensions and were analyzed under similar operating conditions. Details of components dimensions and other parameters have been shown in Table 1.

2.4. Model Validation

The proposed mathematical model of the PV/T system has been validated using solely an air type heat exchanger. The selection of the air type heat exchanger can be explained by the fact that from the previously published studies, the authors found only single-fluid PV/T systems that had used glass-to-glass PV protection. For the purpose of model validation, identical physical dimensions and operating conditions have been used in the mathematical model as presented by Joshi et al. [25]. Figure 2 shows the PV temperatures derived from the proposed mathematical model and measured by Joshi et al. [25]. The depicted measured and predicted PV temperatures varied in accordance with the variable solar radiation reported by Joshi. It is obvious the PV temperature varied directly with the incident solar insolation, but the important point is numerical findings have good agreement with experimental data. In fact, the maximum difference between numerical and measured data is within an acceptable range. It can be deduced from the aforementioned comparison that the proposed model of the PV/T system can be employed for the performance prediction of a physical counterpart.

3. Results and Discussion

It is important to note that during analysis, fixed flow rates for both fluids were used, i.e., 0.024 kg/s and 0.042 kg/s for water and air, respectively. The daily variations of solar radiation and ambient temperature are shown in Figure 3. The interdependence temperature responses of the top glass cover, PV plate, copper tube, and back panel are shown in Figure 4. It can be seen that the variation of temperatures for the PV cells and the copper tube layers are very similar for the glass-to-glass PV/T system, which means there is excellent heat transfer between the aforementioned components. On the contrary, in the glass-to-PV backsheet based PV/T system, the incident solar radiation is trapped in the PV cells which cause a significant increase in its surface temperature. This shows that as the temperature went up, the PV cells lost heat to ambient air at a faster rate than the heat transfer to the copper tube. In addition, compared to the glass-to-PV backsheet case, the higher back panel temperature in the case of the glass-to-glass PV/T system is due to direct solar heating through the non-packing area.
The hourly variations of electrical efficiencies from glass-to-glass and glass-to-PV backsheet based PV/T systems are shown in Figure 5. The electrical efficiencies for both systems varied inversely to ambient temperature which is obvious. However, the electrical efficiency for the glass-to-glass PV module is significantly higher than that of the glass-to-PV backsheet case. Installation of the dual-fluid heat exchanger decreases the operating temperature of PV cells and increases the short circuit current and open-circuit voltage, and ultimately the enhancement in electrical efficiency was observed. The value of the average electrical efficiency for the glass-to-glass PV/T system is found to be 15.34%, whereas for the glass-to-PV backsheet case this value reduced to 14.85%. This can be explained by the fact that, due to the opaque nature of the PV backsheet, all of the incident solar radiation is intercepted by PV cells and the PV backsheet surface, which results in the generation of extra heat and hence reduction in electrical performance is observed.
Equivalent thermal efficiency terms are used to define the thermal performance of glass-to-glass and glass-to-PV backsheet based PV/T systems. Using dual-fluid as a coolant, the daily variations of equivalent thermal efficiency for both cases are presented in Figure 6. Under similar operating conditions, the daily average equivalent thermal efficiency for glass-to-glass and glass-to-PV backsheet cases are 81.06% and 78.86%, respectively. Whereas, the glass-to-glass PV/T system gives better results compared to the glass-to-PV backsheet case. This may be due to the accumulation or trapping of sun rays at the PV cells and the PV backsheet surfaces. Furthermore, daily useful thermal energy gains for both cases are depicted in Figure 7. The net heat gain depends on ambient temperature; the higher the temperature difference between PV cells and ambient air, the higher the heat losses. The glass-to-glass PV/T system has a maximum useful energy gain of a daily average value of 0.541 kWh, whereas the energy gain for the glass-to-PV backsheet case is 0.422 kWh. In the context of thermal performance, the glass-to-glass-based PV/T system supersedes the glass-to-PV backsheet case due to high heat extraction capacity. Moreover, in the glass-to-glass case, the black painted back panel gets heated directly from sun rays transmitting through the non-packing area of glass and also through conducted heat from the PV cells.
For the purpose of evaluation and optimization, the exergy analysis is also taken into consideration, which can provide detailed insight into the process for possible improvement in the performance of the dual-fluid PV/T system. In other words, the exergy analysis gives an idea about the maximum possible output that is achievable from the proposed PV/T system. Figure 8 shows the variations of overall exergy efficiency with respect to day time. It can be seen that the exergy efficiency varies linearly with the daily sunlight and depicted the maximum value for both cases during the peak sun intensity hours. The maximum exergy efficiencies for the glass-to-glass case and glass-to-PV backsheet case are 14.25% and 13.87%, respectively. It is observed that the exergy efficiency for the glass-to-glass case is higher than that of the glass-to-PV backsheet case. It can be explained by the fact that the maximum achievable power output or exergy rate from a solar collector varies inversely with the entropy generation rate or irreversibility. As the intensity of solar radiation increases, the PV cell temperature increases. Thereby, the trapped heat in the PV cells accelerates the heat losses to ambient or irreversibility. In glass-to-glass PV protection, the rate of heat extraction by the circulating fluid from the PV cells increased, which ultimately causes a reduction in heat losses.
The long-term performance evaluation of a dual-fluid PV/T system is performed by taking into consideration the monthly average solar radiation and ambient temperature. Figure 9 and Figure 10 show the variation trends of monthly average electrical and thermal efficiencies for both cases across the whole year. The maximum electrical efficiency for glass-to-PV backsheet and glass-to-glass cases are observed in March with values of 13.92% and 14.31%, respectively, whereas in July these values were reduced to a minimum level of 11.87% and 12.18%, respectively. The yearly average total thermal efficiency for glass-to-PV backsheet and glass-to-glass cases are observed to be 48.25% and 52.22%, respectively. Apart from different configurations, both cases produced reasonably good thermal efficiency in comparison with conventional single-fluid exchangers. However, due to direct sun rays transmission in the glass-to-glass PV/T system case, the blackened back panel was heated continuously by the incident solar radiation. Therefore, in the glass-to-glass case, the circulating fluids have a higher temperature and thermal efficiency than that of the glass-to-PV backsheet case. It can be noticed that the maximum overall efficiencies (electrical plus thermal) for both cases were observed in the spring months (March and April). This trend can easily be explained by a higher number of sunshine hours and lower ambient air temperatures.
Considering average weather conditions, the yearly (breakdown into months) variations of overall exergy efficiency for both cases are presented in Figure 11. The yearly average exergy efficiency for glass-to-PV backsheet and glass-to-glass cases are 13.23% and 13.85%, respectively. Since the electrical outputs from both PV/T configurations are in the form of exergy energy, therefore, the electrical part is more related to it than the thermal part. Due to this reason, the overall exergy efficiency variation pattern is similar to that of the electrical energy. Furthermore, from the derived results, it can clearly be seen that the glass-to-glass case has higher exergy efficiency than the glass-to-PV backsheet cases. This is because, due to better heat extraction capabilities, the glass-to-glass case has a lower operating temperature of the PV cells than the latter case. To sum up, the lower the PV cell temperature, the higher the overall exergy efficiency.

4. Conclusions

This study compared two configurations of the PV/T system in the context of evaluating their electrical and thermal performances. It is concluded that a glass-to-glass PV/T system is a better design compared to a glass-to-PV backsheet based PV/T system. The integration of glass-to-glass PV protection with a dual-fluid heat exchanger helps to minimize the PV cells’ temperature and consequently, increases the exergy and thermal efficiencies. It is observed that under similar conditions the average electrical efficiency of the glass-to-glass and glass-to-PV backsheet based PV/T systems are 15.34% and 14.85%, respectively. There is an improvement in equivalent thermal efficiency by 2.2% for a glass-to-glass case compared to a glass-to-PV backsheet case. The average useful energy outputs for glass-to-glass and glass-to-PV backsheet based PV/T systems are 0.541 kWh and 0.422 kWh, respectively, whereas yearly average total thermal efficiencies are 52.22% and 48.25%, respectively. The presented transient mathematical model is capable of providing a real-time simulation of the PV/T system similar to what a physical counterpart would. Using glass-to-glass PV protection, the circulated fluid can get direct and indirect solar heat. Additionally, a dual-fluid heat exchanger helps in optimizing the thermal output from the PV/T system, where either fluid can be used according to load requirements. In future studies, the thermal and optical models will be coupled to analyze the performance of a given PV/T system by introducing glazing. The main advantage is, with a smaller area, the suggested system can generate high-temperature heat, and the limitation is the integration of a dual-fluid heat exchanger and additional glass cover in a PV/T unit might cause extra production cost.

Author Contributions

M.I.H.—conception, design, analysis, interpretation of data and the drafting the work; J.-T.K. supported through reviewing the work critically, supervision, and the funding to the research work and its final formatting as an article in its current form. All authors have read and agreed to the published version of the manuscript.

Funding

This work was supported by Korea Research Fellowship Program through the National Research Foundation of Korea (NRF) funded by the Ministry of Science and ICT (2016H1D3A1938222) and The Korea Institute of Energy Technology Evaluation and Planning (KETEP) and the Ministry of Trade, Industry & Energy (MOTIE) of the Republic of Korea (No. 20188550000480).

Conflicts of Interest

The authors declare no conflict of interest. The funders had no role in the design of the study; in the collection, analyses, or interpretation of data; in the writing of the manuscript, or in the decision to publish the results.

Nomenclature

A surface area (m2)
C specific heat (J/kg °C)
E electrical power (W)
E x exergy rate
E x o overall exergy gain
G solar radiation (W/m2)
h heat transfer coefficient (W/m2 °C)
h w i n d wind velocity (W/m2 °C)
k thermal conductivity (W/m °C)
M mass (kg)
mass flow rate (kg/s)
P F packing factor
Q energy (W)
Q u useful energy gain (W)
T temperature (°C)
D i & D o tube inner & outer diameters
N u Nusselt number
R e Reynolds number
P r Prandtl number
Greek
α absorptivity
τ transmissivity
δ thickness (m)
σ stefan-boltzmann constant (W·m−2·K−4)
ŋ efficiency
ε emissivity
ŋ P V T primary energy saving efficiency
Subscripts
a circulating air
b back panel
b o bond or adhesive
c collector
e electrical
f circulating water
g 1 glass cover1
g 2 glass cover2
o & i n outlet & inlet
p PV backsheet or PVF film-based backsheet
p p power plant
s solar cells
t tube
t h thermal
ambient air

References

  1. Jewell, J.; McCollum, D.; Emmerling, J.; Bertram, C.; Gernaat, D.E.; Krey, V.; Paroussos, L.; Berger, L.; Fragkiadakis, K.; Keppo, I. Limited emission reductions from fuel subsidy removal except in energy-exporting regions. Nature 2018, 554, 229. [Google Scholar] [CrossRef] [PubMed] [Green Version]
  2. Perea-Moreno, M.-A.; Hernandez-Escobedo, Q.; Perea-Moreno, A.-J. Renewable Energy in Urban Areas: Worldwide Research Trends. Energies 2018, 11, 577. [Google Scholar] [CrossRef] [Green Version]
  3. Chow, T.T. A review on photovoltaic/thermal hybrid solar technology. Appl. Energy 2010, 87, 365–379. [Google Scholar] [CrossRef]
  4. Charalambous, P.; Maidment, G.; Kalogirou, S.; Yiakoumetti, K. Photovoltaic thermal (PV/T) collectors: A review. Appl. Therm. Eng. 2007, 27, 275–286. [Google Scholar] [CrossRef] [Green Version]
  5. Taylor, R.A.; Phelan, P.E.; Otanicar, T.P.; Adrian, R.; Prasher, R. Nanofluid optical property characterization: Towards efficient direct absorption solar collectors. Nanoscale Res. Lett. 2011, 6, 1–11. [Google Scholar] [CrossRef] [Green Version]
  6. Hussain, M.I.; Ménézo, C.; Kim, J.-T. Advances in solar thermal harvesting technology based on surface solar absorption collectors: A review. Sol. Energy Mater. Sol. Cells 2018, 187, 123–139. [Google Scholar] [CrossRef]
  7. Bhattarai, S.; Oh, J.-H.; Euh, S.-H.; Krishna Kafle, G.; Hyun Kim, D. Simulation and model validation of sheet and tube type photovoltaic thermal solar system and conventional solar collecting system in transient states. Sol. Energy Mater. Sol. Cells 2012, 103, 184–193. [Google Scholar] [CrossRef]
  8. Rommel, M.; Zenhäusern, D.; Baggenstos, A.; Türk, O.; Brunold, S. Development of glazed and unglazed PVT collectors and first results of their application in different projects. Energy Procedia 2015, 70, 318–323. [Google Scholar] [CrossRef] [Green Version]
  9. Vats, K.; Tomar, V.; Tiwari, G.N. Effect of packing factor on the performance of a building integrated semitransparent photovoltaic thermal (BISPVT) system with air duct. Energy Build. 2012, 53, 159–165. [Google Scholar] [CrossRef]
  10. Hosseinzadeh, M.; Sardarabadi, M.; Passandideh-Fard, M. Energy and Exergy Analysis of Nanofluid Based Photovoltaic Thermal System Integrated with Phase Change Material. Energy 2018, 147, 636–647. [Google Scholar] [CrossRef]
  11. Shahsavar, A.; Ameri, M.; Gholampour, M. Energy and exergy analysis of a photovoltaic-thermal collector with natural air flow. J. Sol. Energy Eng. 2012, 134, 011014. [Google Scholar] [CrossRef]
  12. Saidur, R.; BoroumandJazi, G.; Mekhlif, S.; Jameel, M. Exergy analysis of solar energy applications. Renew. Sustain. Energy Rev. 2012, 16, 350–356. [Google Scholar] [CrossRef]
  13. Pathak, M.J.M.; Sanders, P.G.; Pearce, J.M. Optimizing limited solar roof access by exergy analysis of solar thermal, photovoltaic, and hybrid photovoltaic thermal systems. Appl. Energy 2014, 120, 115–124. [Google Scholar] [CrossRef] [Green Version]
  14. Tripanagnostopoulos, Y. Aspects and improvements of hybrid photovoltaic/thermal solar energy systems. Sol. Energy 2007, 81, 1117–1131. [Google Scholar] [CrossRef]
  15. Abu Bakar, M.N.; Othman, M.; Hj Din, M.; Manaf, N.A.; Jarimi, H. Design concept and mathematical model of a bi-fluid photovoltaic/thermal (PV/T) solar collector. Renew. Energy 2014, 67, 153–164. [Google Scholar] [CrossRef]
  16. Jarimi, H.; Bakar, M.N.A.; Othman, M.; Din, M.H. Bi-fluid photovoltaic/thermal (PV/T) solar collector: Experimental validation of a 2-D theoretical model. Renew. Energy 2016, 85, 1052–1067. [Google Scholar] [CrossRef]
  17. Baljit, S.S.S.; Chan, H.Y.; Audwinto, V.A.; Hamid, S.A.; Fudholi, A.; Zaidi, S.H.; Othman, M.Y.; Sopian, K. Mathematical modelling of a dual-fluid concentrating photovoltaic-thermal (PV-T) solar collector. Renew. Energy 2017, 114, 1258–1271. [Google Scholar] [CrossRef]
  18. Chow, T. Performance analysis of photovoltaic-thermal collector by explicit dynamic model. Sol. Energy 2003, 75, 143–152. [Google Scholar] [CrossRef]
  19. Hussain, M.I.; Lee, G.H. Thermal performance comparison of line-and point-focus solar concentrating systems: Experimental and numerical analyses. Sol. Energy 2016, 133, 44–54. [Google Scholar] [CrossRef]
  20. Hussain, M.I.; Lee, G.H. Numerical and experimental heat transfer analyses of a novel concentric tube absorber under non-uniform solar flux condition. Renew. Energy 2017, 103, 49–57. [Google Scholar] [CrossRef]
  21. Garg, H.P.; Adhikari, R.S. Transient simulation of conventional hybrid photovoltaic/thermal (PV/T) air heating collectors. Int. J. Energy Res. 1998, 22, 547–562. [Google Scholar] [CrossRef]
  22. Holman, J.P. Heat Transfer; Metric, S.I., Ed.; McGraw-Hill: New York, NY, USA, 1989. [Google Scholar]
  23. Agrawal, S.; Tiwari, G. Energy and exergy analysis of hybrid micro-channel photovoltaic thermal module. Sol. Energy 2011, 85, 356–370. [Google Scholar] [CrossRef]
  24. Singh, S.; Agrawal, S.; Avasthi, D. Design, modeling and performance analysis of dual channel semitransparent photovoltaic thermal hybrid module in the cold environment. Energy Convers. Manag. 2016, 114, 241–250. [Google Scholar] [CrossRef]
  25. Joshi, A.S.; Tiwari, A.; Tiwari, G.N.; Dincer, I.; Reddy, B.V. Performance evaluation of a hybrid photovoltaic thermal (PV/T)(glass-to-glass) system. Int. J. Therm. Sci. 2009, 48, 154–164. [Google Scholar] [CrossRef]
Figure 1. Schematic of dual-fluid photovoltaic/thermal (PV/T) system with glass-to-glass and glass-to-PV backsheet cases.
Sustainability 12 09520 g001
Figure 2. Comparison of numerical and measured PV temperatures.
Sustainability 12 09520 g002
Figure 3. The climatic parameters.
Sustainability 12 09520 g003
Figure 4. Different layers temperatures across (a) glass-to-glass PV/T system (b) glass-to-PV backsheet based PV/T system.
Sustainability 12 09520 g004
Figure 5. Variations of electrical efficiency against day hours.
Sustainability 12 09520 g005
Figure 6. Variations of equivalent thermal efficiency against day hours.
Sustainability 12 09520 g006
Figure 7. Variations of useful energy gain against day hours.
Sustainability 12 09520 g007
Figure 8. Variations of overall exergy efficiency against day hours.
Sustainability 12 09520 g008
Figure 9. Yearly variations of electrical efficiency of PV/T system with glass-to-glass and glass-to-PV backsheet cases.
Sustainability 12 09520 g009
Figure 10. Yearly variations of total thermal efficiency of PV/T system with glass-to-glass and glass-to-PV backsheet cases.
Sustainability 12 09520 g010
Figure 11. Yearly variations of Overall exergy efficiency of PV/T system with glass-to-glass and glass-to-PV backsheet cases.
Sustainability 12 09520 g011
Table 1. Parameters details.
PV cells [17]Length & width1.62 m & 0.98 m
Absorptivity 0.9
Emissivity 0.88
Specific heat 900 J/(kg K)
Temperature coefficient 0.0045/°C
Reference PV panel temperature298.15 K
Thickness of EVA+PV cells1.2 mm
Thermal conductivity 148 W/(m K)
Glass coverGlass solar transmittance92%
Thickness of tempered glass 3 mm
Specific heat670 (J/kg)
Density 2200 (kg/m3)
Extinction coefficient26 (/m)
PV backsheetThickness of PV backsheet 0.5 mm
Thermal conductivity 0.2 W/(m K)
Absorptivity of PV backsheet0.5
Copper tubeInner diameter 0.008 m
Thickness0.0012 m
Specific heat 903 J/(kg K)
Density2702 kg/m3
No. of tubes9
Tube spacing0.11 m
MaterialCopper
Back panelDensity 1520 kg/m3
Specific heat840 J/(kg K)
Thermal conductivity 0.134 W/(m K)
Thickness of back panel4 mm
Fluids usedWater & air-
Publisher’s Note: MDPI stays neutral with regard to jurisdictional claims in published maps and institutional affiliations.

