Article

Type of Entrepreneurial Activity and Sustainable Development Goals

ISEG-Lisbon School of Economics and Management, Universidade de Lisboa, and ADVANCE/CSG, 1200-781 Lisbon, Portugal
*
Author to whom correspondence should be addressed.
Sustainability 2020, 12(22), 9368; https://doi.org/10.3390/su12229368
Submission received: 23 October 2020 / Revised: 5 November 2020 / Accepted: 9 November 2020 / Published: 11 November 2020

Abstract

:
In this study, we conduct an exploratory study with the aim to investigate whether the type of entrepreneurial activity contributes to the achievement of sustainable development goals (SDGs) in its five dimensions (people, prosperity, planet, peace, and partnership). In addition, we evaluate whether foreign direct investment (FDI) strengthens or reduces these relations. To do so, we apply a multivariate analysis to a sample of 67 countries and find that entrepreneurship contributes negatively to the achievement of SDGs. This effect is mostly due to necessity and non-innovative entrepreneurships, and is evident in the people, prosperity, and partnership dimensions. Nonetheless, FDI helps to diminish this negative effect, as it improves the relation between entrepreneurships, particularly necessity entrepreneurships, and SDG achievement. The main dimension which experiences an improvement due to FDI is people.

1. Introduction

Today, the United Nations’ Sustainable Development Goals (SDGs) provide a legitimate framework to guide the daily activities of businesses and society. The SDGs highlight the need to change the unsustainable path pursued up to now [1] and to address the main economic, social, and environmental challenges. Entrepreneurial activity may play a significant role in this change [2,3] by contributing to the three pillars of SDGs, namely, economic prosperity, social equity, and environmental protection.
Entrepreneurial action shapes the economic, social, and environmental context of a country. In fact, entrepreneurs create the change that incumbent firms fail to perform due to organisational inertia or the risk of cannibalising existing business models [4]. For this reason, entrepreneurship is usually associated with economic growth [5]. Nonetheless, the effects of entrepreneurship differ according to the type of activity, and in some cases, entrepreneurship only generates turbulence and deploys resources [6,7].
Different motivations exist for undertaking an entrepreneurial venture. Some studies distinguish between opportunity and necessity entrepreneurship activities: Positive factors, such as opportunities to socially develop or simply the desire to be independent; and negative motivations, such as unemployment or the general dissatisfaction with the current situation [8]. Other studies distinguish between innovative and non-innovative entrepreneurial activities and find that their effect on economic performance is different [9]. As the motivation to start a new venture affects its performance [8], the understanding of which type of entrepreneurial activity supports the transition towards sustainable development is of special interest [2].
Despite the increase in the sustainability-related entrepreneurship literature, the number of studies is still lacking, and those that exist remain mostly conceptual. The limited research on the role of start-ups in achieving SDGs is unfortunate, especially as the UN has identified entrepreneurship, together with innovation, as being key elements in addressing sustainable development challenges [10]. Therefore, a need exists for studies that empirically investigate the outcomes of entrepreneurship for sustainable development.
Our paper aims to fill this gap by exploring the relationship between the type of entrepreneurship and sustainability, contributing to the development of the theory of this phenomenon. We investigate whether and under what circumstances entrepreneurship can contribute to the economic, environmental, and social dimensions of SDGs. One of novelties of this study is that attention is devoted to evaluating the effect of the different types of entrepreneurial activity on SDGs. This study focuses on two classifications which have gained importance in classifying entrepreneurial motives; namely, opportunity versus necessity entrepreneurship [11] and innovative versus non-innovative entrepreneurship [12]. We also evaluate the role of foreign direct investment (FDI) in mediating the relation between the different types of entrepreneurial activity and SDGs. FDI plays a key role in financing the achievement of SDGs [13] and consequently, together with entrepreneurship, can contribute to achieving these goals. Additionally, our study contains countries under different economic conditions, which allow us to study the interactions of entrepreneurship with SDGs in different contexts.
Our research provides evidence that the type of entrepreneurship influences the achievement of the global index scores of SDGs, and that FDI may act as a moderator in these relations.
This study contributes to the sustainable development literature by attempting to respond to the call for a better understanding of the role of entrepreneurship in achieving SDGs. Hall, Daneke, and Lenox (2010) [14] find that although the UN recognizes entrepreneurship as an important driver of sustainable development, there is little knowledge about under what conditions entrepreneurs can simultaneously foster economic growth, advance environmental goals, and improve social conditions. Our study also contributes new insights to decision-makers for developing policies to support the achievement of SDGs. A better understanding of the conditions under which entrepreneurship can contribute to sustainable development is needed to enact better policies accordingly.
The paper is organised as follows: In the next section, we review the relevant literature. Section 3 presents the data, and in Section 4 we explain the empirical method. Section 5 presents the empirical results. Section 6 gives the conclusion and a discussion of the main results.

2. The Contribution of Entrepreneurship to the Sustainable Development

Entrepreneurship influences the achievement of SDGs in its three pillars: Economic prosperity, social equity, and environmental protection. Sustainable entrepreneurship intends to balance these three dimensions simultaneously, linking business and sustainable development [15,16]. Due to the difficulties inherent in trying to achieve these objectives simultaneously, sustainable entrepreneurship is a more complex phenomenon than entrepreneurship driven only by economic incentives [16].
Recently, researchers have applied the theory of planned behaviour [17] to explain intention formation in sustainable entrepreneurship [16,18]. According with this theory, an individual’s attitudes, motivations, and beliefs together shape said individual’s behaviours. Forming a new firm is usually triggered by profit expectations [19] or by the difference between expected profits and current wages [20,21]. However, certain individuals are reconsidering this economic motivation to strike a balance between the environment and society [22].
New ventures typically address the economic prosperity dimension, as they are considered as drivers of economic growth, employment generation, and technological upgrading [23,24]. New ventures exploit opportunities usually not well-understood by incumbent firms [25,26] that are displaced in a process of “creative destruction” [12]. Individual’s beliefs can help them to uncover new sustainable opportunities and address the social and environmental dimensions of the SDGs. Therefore, entrepreneurs can change the business environment by redesigning industries toward a sustainable path [26,27,28].
Entrepreneurship contributes to most of the individual SDGs [15]. In fact, entrepreneurship has a strong direct engagement with industry, innovation, and infrastructure (SDG 9); good health and well-being (SGD 3); responsible consumption and production (SGD 12) [29]; and economic development (SGD 8) [3]. Other SDGs are addressed either indirectly, or in an aggregated term. For instance, new ventures can indirectly influence the following: Causes of poverty (SDG1), a lack of education (SDG 4), affordable energy (SDG 7), and climate action (SDG 13) [3,29]. For example, Cohen and Winn (2007) [26] show that market failures contributed to environmental degradation, but also provided opportunities to entrepreneurs to introduce new business models. Nevertheless, some goals are less suitable for entrepreneurial contributions than others; for example, SDG 17 (partnership for the goals) and SDG 16 (peace, justice, and strong institutions), because the underlining indicators depend largely on governmental action [29]. Nonetheless, Pacheco, Dean, and Payne (2010) [30] argue that entrepreneurs can also influence their institutional context. However, importantly, entrepreneurial activities for sustainable development may run the risk of achieving one goal at the expense of another one. Therefore, it is important to evaluate the effects of entrepreneurial activity globally and per goal.
However, many new ventures might not be agents of change with regards to sustainability, and some might actually create negative effects. Unsustainable businesses that are triggered by profit expectations [19] usually misuse resources, negatively affecting the environment [31,32]. In many industries, start-ups can simply originate “turbulence” [6,7]. Marginal start-ups with a low likelihood of survival displace incumbent firms and other marginal start-ups. These “revolving door” start-ups are continuously entering and exiting the market destroying jobs and deploying resources that could be used more efficiently by other firms. This situation is even more pronounced in countries with weak institutions, which incentivises unproductive entrepreneurship [33].
Empirically, few studies have examined whether and how entrepreneurship can foster sustainable development. The literature finds that entrepreneurship does not contribute positively to all dimensions of sustainable development. Indeed, Youssef et al. (2018) [32] and Dhahri and Omri (2018) [34] find that entrepreneurship does not contribute to the environmental dimension goal. According to Youssef et al. (2018) [32], formal and informal entrepreneurships increase pollution, particularly in low-income countries [35]. In high-income countries, [35] finds an inverted U-shaped relation between entrepreneurship and pollution. On a positive note, [34] suggest that entrepreneurship positively contributes to economic and social dimensions, and Pansera and Sarkar (2016) [36] argue that resource-scarce entrepreneurs derive the maximum value from limited resources contributing positively to the achievement of SDGs.
To sum up, as entrepreneurship can positively and negatively influence the achievement of SDGs, we posit that:
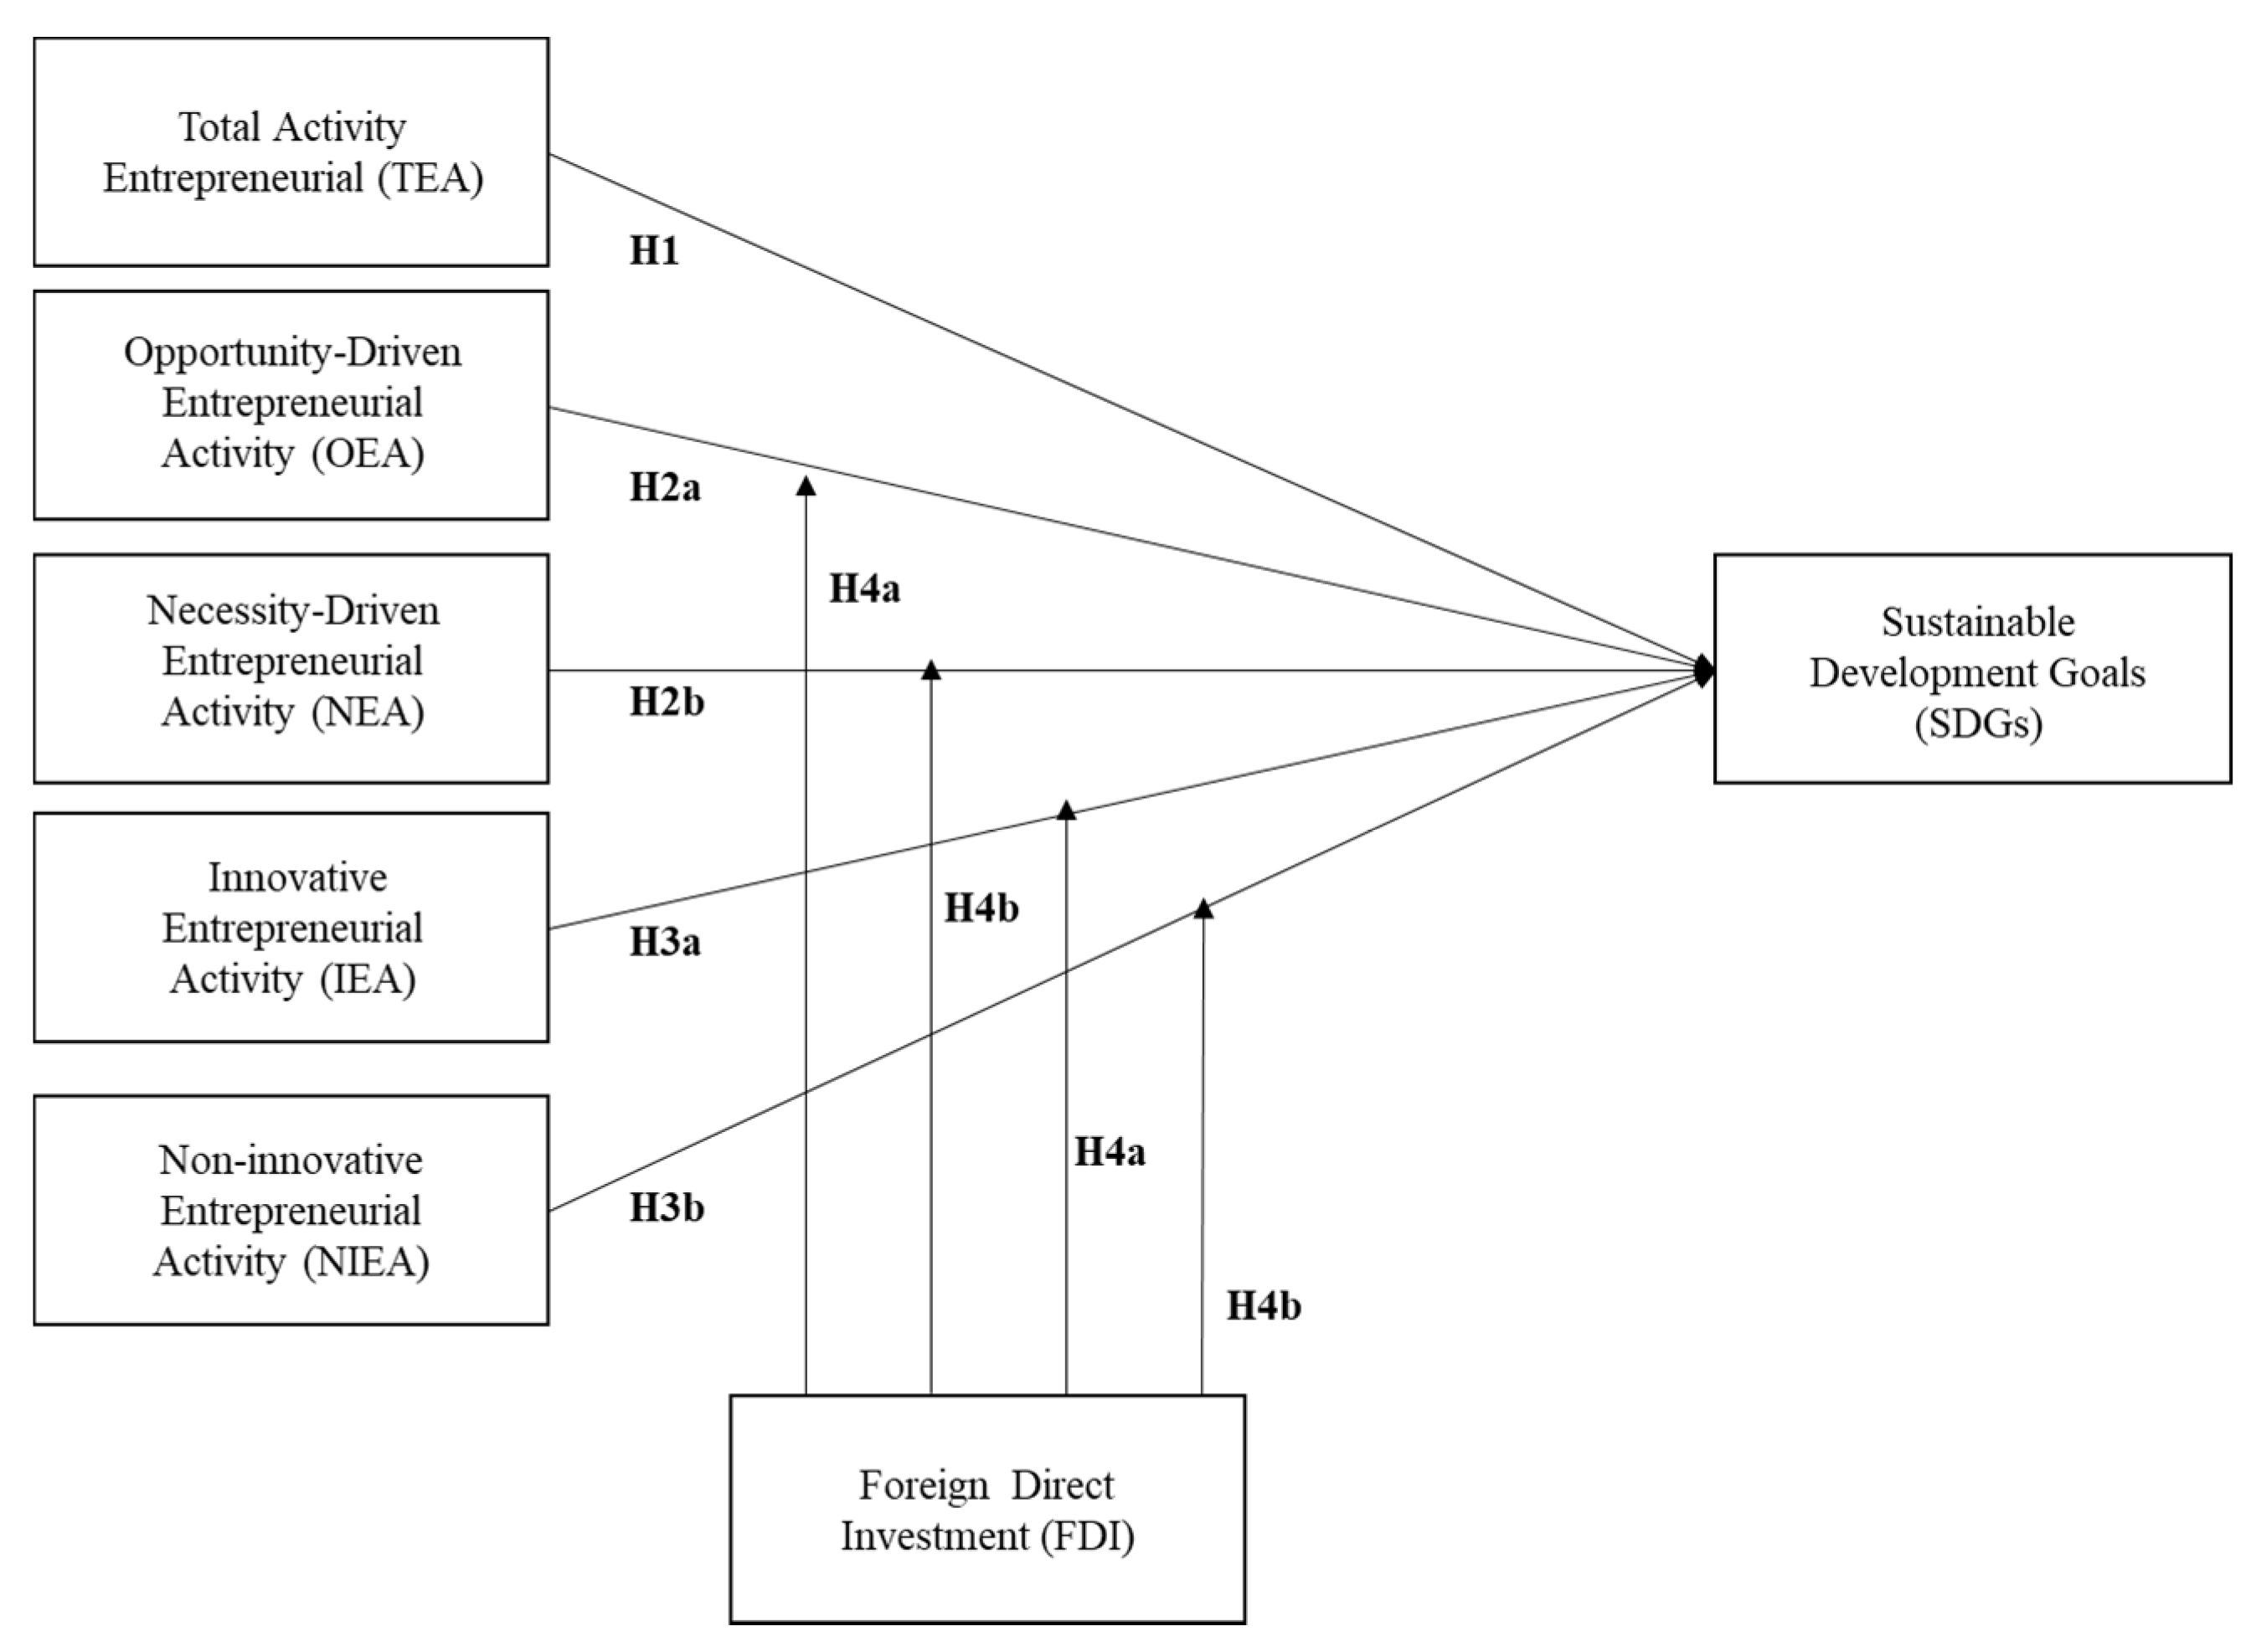
Hypothesis 1.
Entrepreneurship is likely to influence the achievement of SDGs.
The prevalence of the effect depends on the type of entrepreneurial activity. Indeed, not every kind of entrepreneurship has the same impact in the economy and society. Entrepreneurship is rather heterogeneous and complex, in which innovative and opportunity entrepreneurs occur along with non-innovators and escapees from unemployment [37]. Accordingly, new firm creation is not necessarily associated with economic growth and innovation, particularly in less-developed countries. The positive relation between economic growth and entrepreneurial activity only occurs when “opportunity entrepreneurs” (those motivated by market opportunities) are separate from “necessity entrepreneurs” (those motivated by a lack of opportunities in the labour market) [38]. Indeed, opportunity entrepreneurs take advantage of market opportunities and introduce new products, services, or processes [39], and can also tackle sustainable opportunities. Fostering opportunity entrepreneurship leads to economic growth [40] and job creation in both developed and developing economies [41]. Opportunity entrepreneurship reflects the creation of knowledge and technology, which in the end positively affects economic growth and social development. Therefore, countries with a higher level of opportunity entrepreneurship achieve faster growth and higher economic prosperity. In developing countries, where inequalities are more pronounced, opportunity entrepreneurship increases employment and economic growth, while reducing inequalities. In addition, opportunity entrepreneurs might see sustainable opportunities (in production efficiency, energy, and education, for example) as being a competitive advantage [14]. In fact, Shepherd and Patzelt (2011) [15] and York and Venkataraman (2010) [42] argue that entrepreneurship can be a solution to the environmental challenges by contributing to their preservation and biodiversity. However, balancing the desire to make profits with maintaining economic efficiency and environmental protection is not simple [43]. Entrepreneurs often emphasise individual rewards over sustainability goals by adopting behaviours that are harmful to the environment [34].
In contrast, entrepreneurs who start their businesses out of necessity due to the lack of alternative employment opportunities have different characteristics [44]. For example, they have inferior human capital endowments (in terms of formal education and relevant experiences) that negatively affect start-ups’ performance and economic growth [45]. As necessity entrepreneurship is replaced by opportunity entrepreneurship, the level of economic development increases [46]. Because necessity entrepreneurs are pushed into entrepreneurship, they usually have less time and fewer resources in terms of capital and knowledge [47,48]. Thereby, while opportunity entrepreneurship usually involves attempts to exploit new market opportunities, necessity entrepreneurship is more likely to be imitative ventures. Additionally, necessity and informal entrepreneurships make a higher contribution to environment pollution in comparison to opportunity and formal entrepreneurships [49].
To sum up, opportunity entrepreneurs are positively associated with economic prosperity and social equity, and contribute significantly to job creation, product innovation, and the exploitation of sustainable business opportunities. In contrast, necessity entrepreneurship can negatively affect the achievement of SDGs, because of their lower contribution to economic growth and social equity and their higher contribution to pollution. Therefore, we posit that:
Hypothesis 2a.
Opportunity-driven entrepreneurship is likely to positively influence the achievement of SDGs.
Hypothesis 2b.
Necessity-driven entrepreneurship is likely to negatively influence the achievement of SDGs.
By the same token, a new firm may not necessarily lead to a technological upgrade or industrial growth [50,51]. Therefore, it is important to distinguish between innovative entrepreneurs, (those who introduce product innovations, new processes, and new forms of organisations) and non-innovative entrepreneurs [12,52]. Further, Baumol (2005) [53] argues that most of the new firm entries are due to imitators or replicators, and that only a tiny minority are due to innovators.
Innovative and high growth entrepreneurs, also known as Schumpeterian entrepreneurs, positively affect economic growth [54]. These innovative entrepreneurs are distinguished by their ability to search for and create new market opportunities [55]. Their academic education allows them to develop knowledge-based technology or research-driven opportunities [56]. Innovative entrepreneurs thereby convert advances in knowledge into economic growth. In addition, innovative entrepreneurship can be a source of societal progress by reducing inequalities [57]. Nonetheless, the definition of innovative entrepreneurship highlights that these entrepreneurs temporarily take advantage of a monopoly position. In terms of environmental sustainability, Youssef et al. (2018) [32] argue that certain conditions have to be met to ensure the positive effect of entrepreneurship. Among these conditions, the authors show that the innovation when combined with entrepreneurship improves the quality of the environment.
Like necessity entrepreneurship, non-innovative entrepreneurship is less likely to foster economic growth and job creation. These entrepreneurs do not have the ability to introduce new production methods, such as technological products or services or even a new organisational form, because, in effect, they replicate previous ventures and mainly create “turbulence” in the market [6,7].
To sum up, innovative entrepreneurs positively contribute to the economic, environmental, and social dimensions of the SDGs; and non-innovative entrepreneurs make less of a contribution to economic growth and social equity. Therefore, we posit:
Hypothesis 3a.
Innovative entrepreneurship is likely to positively influence the achievement of SDGs.
Hypothesis 3b.
Non-innovative entrepreneurship is likely to negatively influence the achievement of SDGs.

3. The Role of FDI on the Relationship between the Type of Entrepreneurship and the Sustainable Development

Some studies provide conflicting evidence regarding the relation between FDI and entrepreneurship [58]. While Doytch and Epperson (2012) [59] find that FDI positively affects entrepreneurship, De Backer and Sleuwaegen (2003) [60] find that FDI discourages entry and even stimulates the exit of domestic entrepreneurs. On one hand, FDI can stimulate local entrepreneurship by reinforcing cooperation between foreign investors and host firms [61]. This cooperation contributes to the development of new products and new technology by diffusing knowledge and managerial practices [62]. These contributions help to create new markets and entrepreneurial opportunities that provide access to critical resources, such as financial capital [63]. FDI can also boost export competitiveness by bringing technical and knowledge externalities [64]. However, foreign investors can increase competition for local entrepreneurs that crowds out possible entrants and raises the barriers to entry, as foreign competitors are usually more technologically advanced and can better exploit economies of scale [65]. The prevalence of the effect depends on the structure of FDI inflows (inward versus outward FDI), types of entrepreneurship, and the technological gap or institutional support of the host country [65]. For example, Kim and Li (2014) [66] provide evidence that the positive impact of FDI on firm formation is most relevant in countries which are characterised by weak institutional support, particularly in the less-developed countries.
Turning now to the type of entrepreneurial activity, Albulescuab and Tămăşilă (2014) [65] conclude that the effect of FDI on the entrepreneurship depends on the motivations to start a new venture. FDI has a positive effect on opportunity entrepreneurs, as it leads to uncovering untapped market opportunities. Entrepreneurial activity can increase as multinational firms enter the market due to the demand effect. With regards to necessity entrepreneurs, while inward FDI does not influence this type of entrepreneurship, outward FDI can positively influence it. When capital leaves the country, it has a negative effect on job creation that stimulates the necessity of entrepreneurial activity.
Although the empirical literature presents mixed results regarding knowledge spill overs from FDI [67], the majority of empirical studies conclude that inward FDI has a positive influence on local innovative activities [68]. Using a large firm-level sample, Gorodnichenco, Svejanar, and Terrell (2020) [69] show that FDI has a positive spill over effect on product and technology innovations by domestic firms.
FDI influences entrepreneurship according to the motivations which underlie its activity, and in turn, entrepreneurship has an effect on sustainable development. Thus, we consider that it is relevant to assess the moderating effect that FDI might have between the type of entrepreneurship and the achievement of SDGs.
FDI plays a key role in providing access to capital and knowledge [64,68], and therefore foreign investors might reinforce the positive effect of opportunity and innovative entrepreneurship on SDGs. FDI can also reinforce the positive effect of entrepreneurship on the economic and social dimensions of SDGs. Furthermore, FDI brings about technical and informational externalities and promotes economic growth and fosters job creation. In addition, FDI can encourage new firms to develop new products due to increased demand in the host country [70].
FDI can offset the negative effect between necessity-driven entrepreneurs who have fewer capital- or knowledge-based resources available [47,48] and non-innovative entrepreneurs who are characterised by a lack of innovative products and services and the achievement of SDGs. Moreover, FDI can encourage knowledge diffusion and improve the managerial skills of both. This diffusion can occur directly when workers employed in foreign-owned firms transition to entrepreneurship. Additionally, both necessity and non-innovative entrepreneurs can offer comparable products by imitating their foreign competitors, while leveraging their local knowledge. With this knowledge, non-innovative entrepreneurs can more easily identify new markets, as they are comparatively more difficult and costly for foreign competitors to identify [70]. Overall, together with necessity entrepreneurship, FDI is likely to positively influence economic and social dimensions. Thus, we state the following hypotheses:
Hypothesis 4a.
FDI is likely to reinforce the positive effect between opportunity-driven and innovative entrepreneurship and the achievement of SDGs.
Hypothesis 4b.
FDI is likely to reduce the negative effect between necessity and non-innovative entrepreneurship and the achievement of SDGs.
Figure 1 shows the proposed model, including the hypothesised relationships. In this model, FDI has a moderating role between entrepreneurial activity and the achievement of SDGs.

4. Data

To implement our empirical analysis, we match data from the Sustainable Development Goals Index (SDG Index) [71] with the GEM Adult Population Survey. We supplement these data with information from the World Bank and the OECD national accounts data. GEM is a cross-national survey that uses standardised definitions and procedures on entrepreneurship and has existed since 1999 [72]. Regarding the SDG score, we use the 2019 Sustainable Development Report [71], which provides a score for 193 countries on their achievement of SDGs. For each SDG, the index integrates a wide range of statistical indicators.
Due to the lack of data, we do not include in our sample low-income countries. Our sample captures the variance across 67 lower-middle, upper-middle, or high-income countries for the period from 2015 and 2018. Thus, the dataset is a cross-section of 67 countries averaged over the period of 2015 to 2018 for all independent variables. See Table 1 for the definitions of variables, and Table A1 in the Appendix A for a list of countries included in the sample.
Table 2 provides the descriptive statistics by country and income group.
High-income countries present the highest percentage level of achievement in SDGs (75.89%), yet a lower level of total entrepreneurial activity (9.86%). The SDG index score ranks a country between 0 (the worst performance) and 100 (the best performance). For example, the average index score for high-income countries is 75.89 out of 100, which indicates that on average, these countries are 76% of the way to achieving their SDGs across all 17 goals. As Column 4 in Table 2 shows, the main type of activity is opportunity entrepreneurship (9.33% for opportunity entrepreneurship (OEA) vs. 3.30% for necessity entrepreneurship (NEA)). However, the percentage of necessity entrepreneurship is higher for lower-middle and upper-middle countries (32 and 27% of total entrepreneurial activity for lower-middle and upper-middle countries). This percentage is reduced to 19% for high-income countries. Regarding innovation, Column 4 shows that the great majority of the entrepreneurs are non-innovative, (3.44% for innovative entrepreneurship (IEA) vs. 9.67% for non-innovative entrepreneurship (NIEA)). The percentage of innovative entrepreneurship is higher for high-income countries. It accounts for 31% of the total entrepreneurial activity in high-incomes countries; while in lower-middle and upper-middle countries, this percentage is reduced to 20 and 26%, respectively. High-income countries are also characterised by having lower populations, greater government expenditure, but less FDI.

5. Research Design

To investigate whether entrepreneurial activity contributes to the achievement of SDGs, we first estimate the following model:
S D G i = α + β T E A i + λ F D I i + X i θ + ε i
in which i refers to the country.
The dependent variable is the SDG Index, which tracks country performance on the 17 SDGs for the year 2019. All goals are equally weighted in this index [71].
Our variable of interest is total entrepreneurial activity (TEA), measured as the percentage of the adult population (aged 18–64) which is actively involved in entrepreneurial start-up activity averaged between 2015 and 2018. According to our first hypothesis, we postulate that entrepreneurial activity is likely to affect the achievement of SDGs, however, the direction of the effect depends on the type of entrepreneurial activity.
To test the predictions that necessity entrepreneurship negatively affects the achievement of SDGs and that opportunity entrepreneurship positively affects the achievement of SDGs, we re-estimate Equation (1) by splitting the TEA by necessity and opportunity entrepreneurship activities. NEA is the proportion of total entrepreneurial activity, which reports no better options for work averaged between 2015 and 2018. In contrast, OEA is the average proportion of total entrepreneurial activity in which the main driver for being involved in entrepreneurship is to be independent or increase income.
Additionally, we also distinguish between innovative and non-innovative entrepreneurships. IEA is the average proportion of total entrepreneurial activity which offers new products or services to some, or all customers, which is offered by few or no other competitors. We predict that IEA is positively related to sustainable development, while NIEA is negatively related.
Finally, we also evaluate the direct and indirect effects of FDI on the achievement of SDGs. FDI is the net new investment inflows less disinvestment from foreign investors that is divided by GDP [73].
Several control variables, which are included in the X vector, reflect key trends which could affect SDGs. In all countries, the transformation of SDGs requires a huge increase in public and private investment [13] and therefore, government expenditure, GOVEXP, plays a fundamental role in the achievement of SDGs. GOVEXP is the sum of the general government’s final consumption and military, health, and education expenditures as a percentage of GDP. We also control for population, POP, which is measured as the natural logarithm of the population for each country. The variable of interest and control variables are averaged over the period from 2015 to 2018. By computing the average of the variables, we eliminate the short-to-medium term effects [74]. In addition, we include country income group (INCOMRG) fixed effects in order to control for countries’ economic conditions.

6. Results

Table 3 presents the OLS regression results for Equation (1). Model (1) evaluates the effect of TEA, while Models (2) and (3) analyse the influence of OEA and NEA, and IEA and NIEA, respectively.
Model (1) shows that TEA has a negative effect on the achievement of SDGs. The coefficient is negative and is statistically significant at the 1% level. Model (2) presents the results for NEA and OEA. We find that the coefficient for NEA is negative and statistically significant at the 1% level. In Model (3), we divide the TEA into the IEA and NIEA. The results show that the coefficient associated with NIEA is negative and statistically significant at the 1% level. Our results are in line with Hypotheses 2b and 3b. The influence of entrepreneurial activity on SDGs is negative when entrepreneurs are pushed to entrepreneurship due to the lack of job opportunities or create non-innovative businesses. In all the models, the coefficient associated with FDI is not statistically significant.
Regarding the control variables, we find that they are all consistent with the literature. GOVEXP is fundamental in mobilising capital and finance activities which could enhance sustainable development and the achievement of SDGs [75]. In all models, the coefficient for GOVEXP is statistically significant at the 5 or 10% level.
Next, we evaluate the influence of entrepreneurship on the main SDGs. For this purpose, we classify the SDGs according to Sachs et al.’s (2019) [71] classifications: People, prosperity, planet, peace, and partnership. Each category goal score is computed as being the sum of each goal score, divided by the total number of goals. We therefore re-estimate the previous regressions by using five dependent variables. The results of this analysis are presented in Table 4. Panels A, B, and C present the results for Models (1), (2), and (3) of Table 3, respectively.
Entrepreneurship negatively and significantly affects the following SDG dimensions: People, posterity, and partnership. For the planet and peace goals, the effect is also negative, but not statistically significant (Panel A of Table 4).
Similarly, NEA negatively and significantly affects the people and prosperity goals (Panel B of Table 4). Both coefficients are statistically significant, although the negative effect is larger for the people goal. Surprisingly, we do not find a significant and negative effect of NEA on the planet goal, as expected in the literature. For OEA, we find a negative and significant effect on the propensity dimension which suggests that opportunity-based start-ups can cause turbulence and therefore negatively affect economic growth. However, we do find a negative and significant effect on the partnership goal for both OEA and NEA. Although this goal depends primarily on the government, entrepreneurs can influence their institutional context.
By the same token, NIEA also negatively affects the partnership goal. Additionally, it negatively contributes to the achievement of the people and prosperity goals (Panel C of Table 4). Again, the negative effect is larger for the people goal, and we continue to not find any effect on the planet and peace goals. Surprisingly, IEA does not seem to have an effect on the goal of innovation. Nevertheless, it should be mentioned that the targets of goal 9 (industry, innovation, infrastructure) are mainly related to sustainable infrastructure and industrialisation, to an upgrade in the technological capabilities of industrial sectors, and an increase in access to information and communications technology. Considering that our sample of entrepreneurs includes mainly start-ups established in the retail sector, the effect on sustainable infrastructure and industrialisation is expected to be low.
Table 5 presents the results for the moderating role of FDI on the relation between entrepreneurial activities and the achievement of SDGs. For that purpose, we add several interaction terms between the variable FDI and the different types of TEA described above to Equation (1). Again, Model (1) gives the results for TEA, while Models (2) and (3) display the results for OEA and NEA, and IEA and NIEA, respectively. Due to its importance on raising capital and knowledge diffusion, FDI should positively affect the relation between entrepreneurship activities and the achievement of SDGs.
In Model (1), TEA continues to negatively affect the achievement of SDGs. Nevertheless, we find that the coefficient for the interaction term between FDI and TEA is positive and statistically significant at the 10% level, which means that in countries with a higher share of FDI, entrepreneurial activity promotes sustainable development. The same occurs with NEA. While the coefficient associated with NEA is negative, the coefficient for the interaction between FDI and NEA is positive, which indicates that FDI can motivate entrepreneurs to establish sustainable businesses when they have no alternative occupations. FDI could provide access to knowledge and capital. For NIEA, we continue to find a negative effect on sustainable development, although the interaction term between NIEA and FDI is positive, albeit non-significant. Thereby, we find partial support for Hypothesis 4b. We continue to find no significant effects for OEA and IEA on their interaction terms with FDI.
Table 6 shows the results for the interaction effects between FDI and entrepreneurship on the five SDG dimensions. Panels A, B, and C present the results for Models (1), (2), and (3) of Table 3, respectively.
In Panel A, we find that entrepreneurship continues to negatively affect the achievement of SDGs in the people, prosperity, and partnership dimensions. Nevertheless, the interaction effect between entrepreneurship and FDI is positive and significant for the people goal, which indicates that countries with more FDI and entrepreneurial activity are more likely to achieve the people index score. However, the total effect of entrepreneurship on the people goal is still negative.
In Panel B, we divide entrepreneurship into NEA and OEA. NEA continues to negatively affect the achievement of people, prosperity, and partnership goals. Nevertheless, the interaction effect between NEA and FDI is positive and is statistically significant for the people and partnership goals. Although the total effect of NEA is still negative, the countries with more FDI and NEA are more likely to improve their SDGs in terms of the people and partnership dimensions. Moreover, FDI has a positive effect on the partnership goal, which means that foreign investors can create valuable networks by building inter- and intra-industry alliances or partnerships to improve countries’ sustainability. Contrary to our expectation, the interaction effect between OEA and FDI is negative for the prosperity and partnership dimensions. This finding could be due to the fact that opportunity entrepreneurs want to take advantage of market opportunities and are reluctant to collaborate with foreign investors who could be responsible for the crowding effect that has a negative effect on economic growth and sustainable development [76]. In fact, foreign competitors crowd out entrepreneurial activity by absorbing potential entrepreneurs as employees [77].
By the same token, in Panel C, we find that NIEA negatively affects the achievement of the people, prosperity, and partnership goals. Like NEA, the interaction effect between FDI and OEA is positive for the people dimension. This result indicates that there is a positive spill over effect of FDI regarding ending poverty and enhancing the contribution of entrepreneurship for basic needs, such as nutrition, education, and access to water, sanitation, and electricity.
Although our study is explorative by nature, it is important to address an important issue, the endogeneity of the entrepreneurship variables. We estimated Equation (1) using OLS, however, there is a potential bi-directional relationship between entrepreneurship and sustainability. Entrepreneurship may influence SDGs, but SDGs may also have an impact on entrepreneurship. For example, SDGs may inspire entrepreneurs to launch new ventures with sustainable business models or products, which translates to more entrepreneurial activity. To account for this issue, in our previous analyses, we used the lagged proportion of individuals engaged in entrepreneurial activity averaged over the period 2015–2018 to explain the SDGs score achievement in 2019. Furthermore, we employ an instrumental variable (IV) approach. To instrument for the entrepreneurship variables, we used their lagged values averaged over the period 2012–2014. The reasoning is that the past prevalence of entrepreneurial activity in a country motivates potential entrepreneurs to move into entrepreneurship, but the past level of entrepreneurial activity is unlikely to account for the current SDGs´ score. Entrepreneurship has only begun to gain ground as a concept to promote the three pillars of sustainable development after 2014 [1].
Table 7 presents the IV regression results for TEA, OEA, and NEA, and IEA and NIEA, respectively, in Models (1), (2), and (3).
Table 8 presents the results for the moderating role of FDI on the relation between entrepreneurial activities and the achievement of SDGs using IV approach.
Table 7 and Table 8 show that our IV results are very similar to previous findings using OLS estimation. As shown previously, entrepreneurship contributes negatively to the achievement of SDGs, and FDI helps to diminish this negative effect, as it improves the relation between NEA and NIEA and SDGs´ achievement. The only difference in IV estimation is that the negative impact of NEA is not statistically significant in Model (2) of Table 7. This might be due to the substantial reduction in the number of observations (55 observations in IV vs. 67 observations in OLS). However, when we include the interaction effect between NEA and FDI, the coefficient associated with NEA becomes negative and statistically significant (see Model (2) of Table 8). The IV results for the five dimensions of the SDGs also maintain the same. The results are available by request.
For an instrument to be valid, the following conditions have to be satisfied. First, the instruments need to be correlated with the endogenous variables. In Appendix B, Table A8, we see that this condition is satisfied. Second, the lagged values of entrepreneurial activity should not be strongly correlated with the sustainability score in 2019, otherwise the estimated coefficient would still be biased. To test the relevancy of the instrument, we report the Kleibergen-Paap (2016) [78] wald F statistics. The results are reported on the bottom of Table 7 and Table 8. The rejection of the Kleibergen-Paap rk LM statistics indicates the validity of the instruments used.
At this point, we have to address one shortcoming of OLS and IV regressions: These estimations provide only mean estimates and consequently they are unable to capture the full conditional distribution of SDGs scores. Additionally, the test for normality based on skewness and kurtosis rejected that the residuals from OLS estimation were normal distributed. Non-normal errors can be problematic in smaller samples. To account for this issue, we employ Quantile Regression (QR). QR provides more information on the relationship between SDG scores and entrepreneurship as it estimates the coefficients in any point of the conditional distribution of the SDG scores. Furthermore, it does not require a no-distribution assumption and it is more robust to non-normal errors.
Models (1), (2), and (3) in Table 9 present the QR estimates of Equation (1) evaluated at the 25th, 50th, 75th percentile, respectively.
Interestingly the negative marginal effect of TEA, NEA, and NIEA is only statistically significant for those countries that have a relatively lower SDG score. The marginal effect of TEA, NEA, and NIEA is not statistically significant for those countries that have achieved a higher SDGs score.
In Table 10, we present the results for the moderating role of FDI on the relation between entrepreneurship and the achievement of SDGs using QR estimation approach. Again, Models (1), (2), and (3) provides the estimates at the 25th, 50th, 75th percentile, respectively.
Like in the previous table, the negative marginal effect of TEA, NTEA, and NIEA is statistically significant for those countries that have a SDG score below the 50th percentile. Although we find positive coefficients for the interaction effects between FDI and TEA, NTEA, and NIE, these coefficients are not statistically significant. Overall, these results support Hypotheses 2b and 3b, while providing further understanding of the role of entrepreneurship across the SDGs score distribution. These results can be justified by the fact that the impact of entrepreneurship on economic growth depends on the level of economic development of a country [41]. Descriptive statistics show that lower SDGs´ scores are registered in lower income countries. Thus, in relatively poor countries, where inequalities are more pronounced, necessity entrepreneurship may be more frequent with a negative effect on economic growth, contributing negatively to the achievement of SDGs.

7. Discussion and Conclusions

Research on entrepreneurship and sustainable development has experienced some progress over the last few years. However, the actual outcomes of entrepreneurship on sustainable development are largely unknown. We investigate the effects of entrepreneurship and its different types on the achievement of SDGs in a sample of 67 developed and developing countries. Additionally, as FDI plays a fundamental role in external finance for sustainable development [10] and leads entrepreneurial ventures towards SDGs, we also investigate the moderating role of FDI on the relation between entrepreneurship and sustainable development.
Although entrepreneurship is viewed as being a source of economic growth and employment creation [79], we conclude that entrepreneurship has an overall negative effect on the achievement of SDGs that harms sustainable development, particularly for countries with lower SDGs scores. Nevertheless, we observe that this negative effect is mainly due to necessity and non-innovative entrepreneurship. When entrepreneurs are motivated to start a new business by necessity, the influence of entrepreneurship on sustainable development is negative, because they have no other alternative occupations, or they introduce products or services which are very similar to those offered by other competitors. Thereby, they have a marginal contribution to economic prosperity dimension of the SDGs. When we disaggregate the results by the five dimensions goals of people, prosperity, planet, peace, and partnership, the negative effect is evident in the people and prosperity goals, while no type of entrepreneurship has any effect on the planet goals. Nevertheless, FDI helps diminish the negative effect of entrepreneurship and the achievement of SDGs, as it improves the relation between total and necessity entrepreneurships and the achievement of SDGs. This influence is particularly significant with regards to the goals of ending poverty and increasing basic needs, such as nutrition, education, access to water, sanitation, and electricity. These findings have mostly been confirmed by additional tests, namely by employing an instrumental variable (IV) approach and quantile egression (QR).
This study contributes to the literature in different ways. First, it provides empirical evidence of the effect that entrepreneurship has on countries´ sustainable development in a holistic way, by separating its effect for the five pillars of sustainable development. Second, by investigating the different types of entrepreneurship, this study highlights that the motivation underlying entrepreneurial activities can influence the ability of entrepreneurs to create sustainable businesses. Finally, it also highlights the role of foreign investors in the achievement of SDGs.
This study presents several limitations. First, our entrepreneurial measure is not limited to social or sustainable entrepreneurs, as it includes all types of entrepreneurship. Our entrepreneurship variables measure the proportion of individuals engaged in entrepreneurial activities without discriminating any social or sustainability orientation. Although we tried to measure social entrepreneurial activity, our results were not statistically significant. The results are available on request. Therefore, we are not able to effectively measure sustainability and social-oriented entrepreneurship. Second, measuring national SDG is challenging, as interaction effects, trade-offs, and vaguely defined goals exist [71]. Another limitation of this study is the relatively small number of countries considered in the analysis, and more specifically, the lack of low-income countries due to data unavailability. Considering that the low-income countries may be the ones that need the most investment in entrepreneurship and sustainable growth, further research should be conducted in this subject. Nevertheless, our results suggest that the negative impact of entrepreneurship is more prevalent in countries with lower SDGs scores. These countries are characterized by weak business environments and large skill gaps, therefore specific models and methodology should be applied in future works [80]. Nevertheless, this exploratory study advances the discussion of types of entrepreneurship and sustainability in countries with levels of development. Finally, we could have analysed the relationship between types of entrepreneurship and SDGs by grouping observations in a different way (e.g., countries grouped by population or income level). These types of analyses could potentially lead to different results, creating the modifiable areal unit problem, as described in [81]. Unfortunately, a lack of data prevents us from empirically testing these alternatives unit of analyses. Instead, we disaggregate SDGs in different dimensions (people, prosperity, planet, peace, and partnership) and evaluate the effect of entrepreneurship in points of the conditional distribution of the SDGs scores to ensure the stability of our data [81]. Empirical strategies using alternative units of analysis warrants further research when data becomes available.

Author Contributions

Conceptualization, A.V. and I.P.; methodology, A.V. and I.P.; software, A.V. and I.P.; writing—original draft preparation, A.V. and I.P.; writing—review and editing, A.V. and I.P. All authors have read and agreed to the published version of the manuscript.

Funding

We are gratefully acknowledge financial support from FCT- Fundação para a Ciencia e Tecnologia (Portugal), national funding through research grant UIDB/04521/2020.

Conflicts of Interest

The authors declare no conflict of interest. The funders had no role in the design of the study; in the collection, analyses, or interpretation of data; in the writing of the manuscript, or in the decision to publish the results.

Appendix A. List of Countries

Table A1. List of countries.
High Income LevelUpper-Middle Income LevelLower-Middle Income Level
ArgentinaBelizeAngola
AustraliaBosnia and HerzegovinaCameroon
AustriaBotswanaEgypt, Arab Rep.
BelgiumBrazilEl Salvador
CanadaBulgariaGeorgia
ChileChinaIndia
CroatiaColombiaIndonesia
CyprusEcuadorMorocco
GermanyGuatemalaPhilippines
GreeceIran, Islamic Rep.Sudan
HungaryJamaicaTunisia
IrelandJordanVietnam
IsraelKazakhstan
ItalyLebanon
JapanMalaysia
LatviaMexico
LuxembourgPeru
NetherlandsRomania
NorwayRussian Federation
PanamaSouth Africa
PolandThailand
PortugalTurkey
Qatar
Saudi Arabia
Slovak Republic
Slovenia
Spain
Sweden
Switzerland
United Arab Emirates
United Kingdom
United States
Uruguay
Total: 33 countriesTotal: 22 countriesTotal: 12 countries

Appendix B. Full Econometric Results Included in the Paper

Table A2. Econometric results of Panel A of Table 4.
Model 1Model 2Model 3Model 4Model 5
(People)(Prosperity)(Planet)(Peace)(Partnership)
TEA−0.087 *−0.152 ***−0.002−0.004−0.036 ***
(0.053)(0.028)(0.035)(0.014)(0.009)
FDI−0.028−0.0230.0160.0130.003
(0.028)(0.025)(0.034)(0.011)(0.005)
GOVEXPEND0.1010.0590.0060.064 **0.003
(0.083)(0.049)(0.046)(0.027)(0.010)
POP0.1580.0740.251 *−0.082−0.083 **
(0.187)(0.130)(0.143)(0.063)(0.035)
Constant26.460 ***17.814 ***18.995 ***2.221 **5.351 ***
(2.963)(1.723)(1.806)(1.060)(0.364)
Dummy Income LevelYesYesYesYesYes
Observations6767676767
R-squared0.4880.6850.1200.2110.666
This table shows the effect of entrepreneurial activity on the five dimensions of SDGs: People, prosperity, planet, peace, and partnership. The dependent variables are the sum of SDG index scores in each category divided by the total number of goals. All variables are defined in Table 1. Independent variables are computed as the annual average over the period from 2015–2018. Robust standard errors are in parentheses. *** p < 0.01; ** p < 0.05; * p < 0.1.
Table A3. Econometric results of Panel B of Table 4.
Model 1Model 2Model 3Model 4Model 5
(People)(Prosperity)(Planet)(Peace)(Partnership)
NTEA−0.527 ***−0.242 **0.0830.030−0.066 **
(0.153)(0.111)(0.103)(0.042)(0.031)
OTEA0.106−0.123 **−0.034−0.020−0.024 *
(0.086)(0.055)(0.057)(0.020)(0.015)
FDI−0.036−0.0240.0170.0140.002
(0.026)(0.025)(0.035)(0.011)(0.005)
GOVEXPEND0.0980.0580.0070.064 **0.002
(0.082)(0.049)(0.046)(0.027)(0.010)
POP0.1590.0740.253 *−0.083−0.083 **
(0.193)(0.135)(0.143)(0.064)(0.036)
Constant25.866 ***17.722 ***19.034 ***2.277 **5.312 ***
(2.906)(1.722)(1.816)(1.074)(0.358)
Dummy Income LevelYesYesYesYesYes
Observations6767676767
R-squared0.5290.6900.1260.2170.672
This table shows the effect of entrepreneurial activity on the five dimensions of SDGs: People, prosperity, planet, peace, and partnership. The dependent variables are the sum of SDG index scores in each category divided by the total number of goals. All variables are defined in Table 1. Independent variables are computed as the annual average over the period from 2015–2018. Robust standard errors are in parentheses. *** p < 0.01; ** p < 0.05; * p < 0.1.
Table A4. Econometric results of Panel C of Table 4.
Model 1Model 2Model 3Model 4Model 5
(People)(Prosperity)(Planet)(Peace)(Partnership)
NIEA−0.194 **−0.184 ***0.049−0.051 ***0.004
(0.081)(0.046)(0.050)(0.014)(0.020)
IEA0.189−0.070−0.1340.003−0.023
(0.121)(0.115)(0.127)(0.022)(0.053)
FDI−0.036−0.0260.0200.0020.013
(0.027)(0.025)(0.035)(0.005)(0.011)
GOVEXPEND0.1040.0600.0040.0030.063 **
(0.080)(0.049)(0.046)(0.009)(0.027)
POP0.2230.0940.219−0.074 **−0.087
(0.190)(0.132)(0.146)(0.036)(0.068)
Constant26.068 ***17.698 ***19.191 ***5.296 ***2.248 **
(2.877)(1.734)(1.819)(0.351)(1.084)
Dummy Income LevelYesYesYesYesYes
Observations6767676767
R-squared0.5110.6880.1410.6800.213
This table shows the effect of entrepreneurial activity on the five dimensions of SDGs: People, prosperity, planet, peace, and partnership. The dependent variables are the sum of SDG index scores in each category divided by the total number of goals. All variables are defined in Appendix A. Independent variables are computed as the annual average over the period from 2015–2018. Robust standard errors are in parentheses. *** p < 0.01; ** p < 0.05; * p < 0.1.
Table A5. Econometric results of Panel A of Table 6.
Model 1Model 2Model 3Model 4Model 5
(People)(Prosperity)(Planet)(Peace)(Partnership)
TEA−0.099 *−0.152 ***−0.003−0.004−0.036 ***
(0.038)(0.027)(0.034)(0.014)(0.009)
FDI−0.236 ***−0.017−0.0020.0130.003
(0.083)(0.051)(0.062)(0.022)(0.013)
FDI * TEA0.022 ***−0.0010.0020.0000.000
(0.008)(0.005)(0.005)(0.002)(0.002)
GOVEXPEND0.1050.0590.0060.0030.063 **
(0.083)(0.049)(0.046)(0.010)(0.028)
POP0.2100.0730.255 *−0.083 **−0.083
(0.196)(0.130)(0.147)(0.035)(0.065)
Constant26.143 ***17.824 ***18.968 ***2.222 ***5.352 ***
(2.944)(1.720)(1.825)(1.077)(0.362)
Dummy Income Levelyesyesyesyesyes
Nº of Observations6767676767
R—squared51.70%68.50%12.10%21.10%21.10%
This table shows the moderating role of FDI on the relation between entrepreneurial activity and the five dimensions of SDGs: People, prosperity, planet, peace, and partnership. The dependent variables are the sum of SDG index scores in each category divided by the total number of goals. All variables are defined in Table 1. Independent variables are computed as the annual average over the period from 2015–2018. Robust standard errors are in parentheses. *** p < 0.01; ** p < 0.05; * p < 0.1.
Table A6. Econometric results of Panel B of Table 6.
Model 1Model 2Model 3Model 4Model 5
(People)(Prosperity)(Planet)(Peace)(Partnership)
NEA−0.539 ***−0.359 ***0.1480.026−0.108 ***
(0.133)(0.130)(0.150)(0.057)(0.038)
OEA0.143−0.031−0.077−0.0140.009
(0.092)(0.063)(0.092)(0.037)(0.023)
FDI−0.0660.081−0.0540.0140.040 **
(0.091)(0.075)(0.087)(0.030)(0.020)
NEA * FDI0.054 **0.032−0.0020.0060.012 *
(0.026)(0.022)(0.021)(0.010)(0.006)
OEA * FDI−0.011−0.024 *0.011−0.002−0.009 **
(0.017)(0.012)(0.015)(0.007)(0.004)
GOVEXPEND0.1040.0600.0070.0030.064 **
(0.082)(0.048)(0.046)(0.009)(0.028)
POP0.1780.0570.269 *−0.089 ***−0.082
(0.192)(0.129)(0.145)(0.032)(0.065)
Constant25.332 ***17.304 ***19.117 ***2.217 **5.157 ***
(2.879)(1.700)(1.843)(1.133)(0.347)
Dummy Income Levelyesyesyesyesyes
Nº of Observations6767676767
R—squared52.90%70.01%13.30%22.00%69.70%
This table shows the moderating role of FDI on the relation between entrepreneurial activity and the five dimensions of SDGs: People, prosperity, planet, peace, and partnership. The dependent variables are the sum of SDG index scores in each category divided by the total number of goals. All variables are defined in Table 1. Independent variables are computed as the annual average over the period from 2015–2018. Robust standard errors are in parentheses. *** p < 0.01; ** p < 0.05; * p < 0.1.
Table A7. Econometric results of Panel C of Table 6.
Model 1Model 2Model 3Model 4Model 5
(People)(Prosperity)(Planet)(Peace)(Partnership)
NIEA−0.204 **−0.186 ***0.0710.000−0.056 ***
(0.080)(0.048)(0.055)(0.022)(0.014)
IEA0.271−0.063−0.252−0.0010.029
(0.198)(0.135)(0.188)(0.078)(0.030)
FDI−0.192 *0.000−0.0340.0100.012
(0.097)(0.054)(0.051)(0.021)(0.012)
NIEA * FDI0.032 *−0.003−0.0020.0020.001
(0.017)(0.009)(0.007)(0.005)(0.002)
IEA * FDI−0.032−0.0010.032−0.006−0.007
(0.040)(0.023)(0.022)(0.013)(0.005)
GOVEXPEND0.1140.0600.0000.0040.064 **
(0.082)(0.049)(0.047)(0.009)(0.029)
POP0.2290.0910.236 *−0.077 **−0.089
(0.186)(0.132)(0.141)(0.035)(0.069)
Constant25.519 ***17.736 ***19.376 ***2.188 *5.252 ***
(2.926)(1.732)(1.816)(1.142)(0.349)
Dummy Income Levelyesyesyesyesyes
Nº of Observations6767676767
R—squared51.10%68.90%14.10%21.70%68.60%
This table shows the moderating role of FDI on the relation between entrepreneurial activity and the five dimensions of SDGs: People, prosperity, planet, peace, and partnership. The dependent variables are the sum of SDG index scores in each category divided by the total number of goals. All variables are defined in Table 1. Independent variables are computed as the annual average over the period from 2015–2018. Robust standard errors are in parentheses. *** p < 0.01; ** p < 0.05; * p < 0.1.
Table A8. First stage results.
(1)(2)(3)
Instrumented VariableTEAOEAIEA
ivTEA0.811 *** (0.132)
ivOEA 0.995 ***
(0.131)
ivNEA −0.782 *
(0.399)
ivIEA 0.763 ***
(0.177)
ivNIEA −0.089
(0.061)
Observations555555
This table presents the first stage results for TEA, OEA, and IEA. The other results are available on request. All variables are defined in Table 1. Independent variables are computed as the annual average over the period 2015–2018. Control variables were included but not reported. Robust standard errors are in parentheses. *** p < 0.01; ** p < 0.05; * p < 0.1.

References

  1. UN General Assembly. Transforming our World. In The 2030 Agenda for Sustainable Development; Resolution Adopted by the General Assembly on 25 September 2015; United Nations: New York, NY, USA, 2015. [Google Scholar]
  2. Apostolopoulos, N.; Al-Dajani, H.; Holt, D.; Jones, P.; Newbery, R. Entrepreneurship and the sustainable development goals. In Entrepreneurship and the Sustainable Development Goals, Contemporary Issues in Entrepreneurship Research; Emerald Publishing Limited: Bradford, UK, 2018; Volume 8, pp. 1–7. [Google Scholar]
  3. Filser, M.; Kraus, S.; Roig-Tierno, N.; Kailer, N.; Fischer, U. Entrepreneurship as Catalyst for Sustainable Development: Opening the Black Box. Sustainability 2019, 11, 4503. [Google Scholar] [CrossRef] [Green Version]
  4. Hockerts, K.; Wüstenhagen, R. Greening Goliaths versus emerging Davids—Theorizing about the role of incumbents and new entrants in sustainable entrepreneurship. J. Bus. Ventur. 2010, 25, 481–492. [Google Scholar] [CrossRef] [Green Version]
  5. He, J.; Nazari, M.; Zhang, Y.; Cai, N.; Jinjiang, H.; Yingqian, Z.; Ning, C. Opportunity-based entrepreneurship and environmental quality of sustainable development: A resource and institutional perspective. J. Clean. Prod. 2020, 256, 153–177. [Google Scholar] [CrossRef]
  6. Beesley, M.E.; Hamilton, R.T. Small Firms’ Seedbed Role and the Concept of Turbulence. J. Ind. Econ. 1984, 33, 217. [Google Scholar] [CrossRef]
  7. Baptista, R.; Karaöz, M. Turbulence in growing and declining industries. Small Bus. Econ. 2009, 36, 249–270. [Google Scholar] [CrossRef]
  8. Van Der Zwan, P.; Thurik, R.; Verheul, I.; Hessels, J. Factors influencing the entrepreneurial engagement of opportunity and necessity entrepreneurs. Eurasian Bus. Rev. 2016, 6, 273–295. [Google Scholar] [CrossRef] [Green Version]
  9. Albert, M.G. Entrepreneurship, innovation and regional performance: Application for the Spanish regions. Entrep. Reg. Dev. 2016, 29, 271–291. [Google Scholar] [CrossRef]
  10. UN General Assembly. Entrepreneurship for Sustainable Development; Resolution adopted by the General Assembly on 21 December 2016; United Nations: New York, NY, USA, 2016. [Google Scholar]
  11. Reynolds, P.D.; Camp, S.M.; Bygrave, W.D.; Autio, E.; Hay, M. Global Entrepreneurship Monitor Global 2001 Executive Report; Kaufman Center: New York, NY, USA, 2001. [Google Scholar]
  12. Schumpeter, J.A. The Theory of Economic Development; Harvard University Press: Cambridge, MA, USA, 1934. [Google Scholar]
  13. UNCTAD. World Investment Report 2014—Investing in the SDGs: An Action Plan. Available online: https://unctad.org/en/PublicationsLibrary/wir2014_en.pdf (accessed on 8 April 2020).
  14. Hall, J.K.; Daneke, G.A.; Lenox, M.J. Sustainable development and entrepreneurship: Past contributions and future directions. J. Bus. Ventur. 2010, 25, 439–448. [Google Scholar] [CrossRef]
  15. Shepherd, D.A.; Patzelt, H. The New Field of Sustainable Entrepreneurship: Studying Entrepreneurial Action Linking “What Is to Be Sustained” With “What Is to Be Developed”. Entrep. Theory Pr. 2011, 35, 137–163. [Google Scholar] [CrossRef]
  16. Thelken, H.N.; De Jong, G. The impact of values and future orientation on intention formation within sustainable entrepreneurship. J. Clean. Prod. 2020, 266, 122052. [Google Scholar] [CrossRef]
  17. Ajzen, I. The Theory of planned behavior. Organ. Behav. Hum. Decis. Process. 1991, 50, 179–211. [Google Scholar] [CrossRef]
  18. Vuorio, A.M.; Puumalainen, K.; Fellnhofer, K. Drivers of entrepreneurial intentions in sustainable entrepreneurship. Int. J. Entrep. Behav. Res. 2018, 24, 359–381. [Google Scholar] [CrossRef] [Green Version]
  19. Geroski, P. What do we know about entry? Int. J. Ind. Organ. 1995, 13, 421–440. [Google Scholar] [CrossRef]
  20. Lucas, R.E. On the Size Distribution of Business Firms. Bell J. Econ. 1978, 9, 508. [Google Scholar] [CrossRef]
  21. Parker, S.C. The Effects of Risk on Self-Employment. Small Bus. Econ. 1997, 9, 515–522. [Google Scholar] [CrossRef]
  22. Porter, M.E.; Kramer, M.R. Creating Shared Value. Managing Sustainable Business; Springer: Dordrecht, The Netherlands, 2019; pp. 327–350. [Google Scholar]
  23. Van Stel, A.; Carree, M.; Thurik, R. The Effect of Entrepreneurial Activity on National Economic Growth. Small Bus. Econ. 2005, 24, 311–321. [Google Scholar] [CrossRef] [Green Version]
  24. Audretsch, D.B.; Keilbach, M.C.; Lehmann, E. Entrepreneurship and Economic Growth; Oxford University Press: Oxford, UK, 2006. [Google Scholar]
  25. Carree, M.; Thurik, A.R. Understanding the role of entrepreneurship for economic growth. In The Handbook of Entrepreneurship and Economic Growth; Carree, M., Thurik, A.R., Eds.; Edward Elgar Publishing: Cheltenham, UK, 2006; pp. ix–xix. [Google Scholar]
  26. Cohen, B.; Winn, M.I. Market imperfections, opportunity and sustainable entrepreneurship. J. Bus. Ventur. 2007, 22, 29–49. [Google Scholar] [CrossRef]
  27. Dean, T.J.; McMullen, J.S. Toward a theory of sustainable entrepreneurship: Reducing environmental degradation through entrepreneurial action. J. Bus. Ventur. 2007, 22, 50–76. [Google Scholar] [CrossRef]
  28. Hart, S.L.; Milstein, M.B. Global sustainability and the creative destruction of industries. MIT Sloan Manag. Rev. 1999, 41, 23. [Google Scholar]
  29. Horne, J.; Recker, M.; Michelfelder, I.; Jay, J.; Kratzer, J. Exploring entrepreneurship related to the sustainable development goals—mapping new venture activities with semi-automated content analysis. J. Clean. Prod. 2020, 242, 118052. [Google Scholar] [CrossRef]
  30. Pacheco, D.F.; Dean, T.J.; Payne, D.S. Escaping the green prison: Entrepreneurship and the creation of opportunities for sustainable development. J. Bus. Ventur. 2010, 25, 464–480. [Google Scholar] [CrossRef]
  31. Gast, J.; Gundolf, K.; Cesinger, B. Doing business in a green way: A systematic review of the ecological sustainability entrepreneurship literature and future research directions. J. Clean. Prod. 2017, 147, 44–56. [Google Scholar] [CrossRef]
  32. Youssef, A.B.; Boubaker, S.; Omri, A. Entrepreneurship and sustainability: The need for innovative and institutional solutions. Technol. Forecast. Soc. Chang. 2018, 129, 232–241. [Google Scholar] [CrossRef]
  33. Baumol, W.J. Entrepreneurship: Productive, Unproductive, and Destructive. J. Political Econ. 1990, 98, 893–921. [Google Scholar] [CrossRef] [Green Version]
  34. Dhahri, S.; Omri, A. Entrepreneurship contribution to the three pillars of sustainable development: What does the evidence really say? World Dev. 2018, 106, 64–77. [Google Scholar] [CrossRef] [Green Version]
  35. Omri, A. Entrepreneurship, sectoral outputs and environmental improvement: International evidence. Technol. Forecast. Soc. Chang. 2018, 128, 46–55. [Google Scholar] [CrossRef] [Green Version]
  36. Pansera, M.; Sarkar, S. Crafting Sustainable Development Solutions: Frugal Innovations of Grassroots Entrepreneurs. Sustainability 2016, 8, 51. [Google Scholar] [CrossRef] [Green Version]
  37. Vivarelli, M. Is entrepreneurship necessarily good? Microeconomic evidence from developed and developing countries. Ind. Corp. Chang. 2013, 22, 1453–1495. [Google Scholar] [CrossRef]
  38. Ghani, E.; Kerr, W.R.; O’Connell, S.D. Who Creates Jobs? Econ. Premises 2011, 70, 1–7. [Google Scholar]
  39. Gaglio, C.M. The Role of Mental Simulations and Counterfactual Thinking in the Opportunity Identification Process*. Entrep. Theory Pr. 2004, 28, 533–552. [Google Scholar] [CrossRef]
  40. Urbano, D.; Aparicio, S. Entrepreneurship capital types and economic growth: International evidence. Technol. Forecast. Soc. Chang. 2016, 102, 34–44. [Google Scholar] [CrossRef] [Green Version]
  41. Van Stel, A.; Storey, D. The Link between Firm Births and Job Creation: Is there a Upas Tree Effect? Reg. Stud. 2004, 38, 893–909. [Google Scholar] [CrossRef]
  42. York, J.G.; Venkataraman, S. The entrepreneur–environment nexus: Uncertainty, innovation, and allocation. J. Bus. Ventur. 2010, 25, 449–463. [Google Scholar] [CrossRef]
  43. Zahra, S.A.; Gedajlovic, E.; Neubaum, D.O.; Shulman, J.M. A typology of social entrepreneurs: Motives, search processes and ethical challenges. J. Bus. Ventur. 2009, 24, 519–532. [Google Scholar] [CrossRef]
  44. Block, J.H.; Wagner, M. Necessity and Opportunity Entrepreneurs in Germany: Characteristics and Earning s Differentials. Schmalenbach Bus. Rev. 2010, 62, 154–174. [Google Scholar] [CrossRef] [Green Version]
  45. Kautonen, T.; Palmroos, J. The impact of a necessity-based start-up on subsequent entrepreneurial satisfaction. Int. Entrep. Manag. J. 2009, 6, 285–300. [Google Scholar] [CrossRef]
  46. Acs, Z.J. Foundations of high impact entrepreneurship. In Foundations and Trends in Entrepreneurship; Now Publishers Inc.: Delft, The Netherlands, 2008; Volume 4, pp. 535–620. [Google Scholar]
  47. Dencker, J.C.; Gruber, M.; Shah, S.K. Individual and Opportunity Factors Influencing Job Creation in New Firms. Acad. Manag. J. 2009, 52, 1125–1147. [Google Scholar] [CrossRef]
  48. Solymossy, E. Push/Pull Motivation: Does It Matter in Terms of Venture Performance? Reynolds, P., Bygrave, W.D., Carter, N.C., Manigart, S., Mason, C., Meyer, G., Shaver, K., Eds.; Frontiers of Entrepreneurship Research: Babson Park, FL, USA; Babson College: Wellesley, MA, USA, 1997; pp. 204–217. [Google Scholar]
  49. Omri, A.; Afi, H. How can entrepreneurship and educational capital lead to environmental sustainability? Struct. Chang. Econ. Dyn. 2020, 54, 1–10. [Google Scholar] [CrossRef]
  50. Acs, Z.J.; Audretsch, D.B. Innovation and Small Firms; MIT Press: Cambridge, MA, USA, 1990. [Google Scholar]
  51. Colombo, M.G.; Delmastro, M.; Grilli, L. Entrepreneurs’ human capital and the start-up size of new technology-based firms. Int. J. Ind. Organ. 2004, 22, 1183–1211. [Google Scholar] [CrossRef]
  52. Schumpeter, J.A. Business Cycles. In A Theoretical, Historical and Statistical Analysis of the Capitalist Process; McGraw-Hill: New York, NY, USA, 1939. [Google Scholar]
  53. Baumol, W.J. Entrepreneurship and invention: Toward their microeconomic value theory. AEI Brook. Jt. Cent. Regul. Stud. Relat. Publ. 2005, 5–38. [Google Scholar]
  54. Shane, S. Why encouraging more people to become entrepreneurs is bad public policy. Small Bus. Econ. 2009, 33, 141–149. [Google Scholar] [CrossRef] [Green Version]
  55. Wennekers, S.; Thurik, A. Linking Entrepreneurship and Economic Growth. Small Bus. Econ. 1999, 13, 27–56. [Google Scholar] [CrossRef]
  56. Acs, Z.J.; Braunerhjelm, P.; Audretsch, D.B.; Carlsson, B. The knowledge spillover theory of entrepreneurship. Small Bus. Econ. 2009, 32, 15–30. [Google Scholar] [CrossRef] [Green Version]
  57. Aghion, P.; Howitt, P. A Model of Growth through Creative Destruction. Econometrica 1992, 60, 323. [Google Scholar] [CrossRef]
  58. Wach, K.; Wojciechowski, L. Inward FDI and entrepreneurship rate: Empirical evidence on selected effects of FDI in Visegrad countries. J. Econ. Manag. 2016, 24, 42–54. [Google Scholar] [CrossRef]
  59. Doytch, N.; Epperson, N. FDI and Entrepreneurship in Developing Countries. Glob. Sci. Technol. Forum Bus. Rev. 2012, 1, 120–125. [Google Scholar]
  60. De Backer, K.; Sleuwaegen, L. Does Foreign Direct Investment Crowd Out Domestic Entrepreneurship? Rev. Ind. Organ. 2003, 22, 67–84. [Google Scholar] [CrossRef]
  61. Danakol, S.H.; Estrin, S.; Reynolds, P.; Weitzel, G. Foreign direct investment via M&A and domestic entrepreneurship: Blessing or curse? Small Bus. Econ. 2016, 48, 599–612. [Google Scholar] [CrossRef]
  62. Javorcik, B.S. Does Foreign Direct Investment Increase the Productivity of Domestic Firms? In Search of Spillovers through Backward Linkages. Am. Econ. Rev. 2004, 94, 605–627. [Google Scholar] [CrossRef] [Green Version]
  63. De Maeseneire, W.; Claeys, T. SMEs, foreign direct investment and financial constraints: The case of Belgium. Int. Bus. Rev. 2012, 21, 408–424. [Google Scholar] [CrossRef]
  64. Meyer, K. Perspectives on multinational enterprises in emerging economies. J. Int. Bus. Stud. 2004, 35, 259–276. [Google Scholar] [CrossRef]
  65. Albulescu, C.T.; Tămăşilă, M. The Impact of FDI on Entrepreneurship in the European Countries. Procedia Soc. Behav. Sci. 2014, 124, 219–228. [Google Scholar] [CrossRef] [Green Version]
  66. Kim, P.H.; Li, M. Injecting demand through spillovers: Foreign direct investment, domestic socio-political conditions, and host-country entrepreneurial activity. J. Bus. Ventur. 2014, 29, 210–231. [Google Scholar] [CrossRef]
  67. Rojec, M.; Knell, M. Why is there a lack of evidence on knowledge spillovers from foreign direct investment? J. Econ. Surv. 2017, 32, 579–612. [Google Scholar] [CrossRef] [Green Version]
  68. Ascani, A.; Balland, P.-A.; Morrison, A. Heterogeneous foreign direct investment and local innovation in Italian Provinces. Struct. Chang. Econ. Dyn. 2020, 53, 388–401. [Google Scholar] [CrossRef]
  69. Gorodnichenco, Y.; Svejanar, J.; Terrell, K. Do foreign investment and trade spur innovation? Eur. Econ. Rev. 2010, 121, 1–27. [Google Scholar] [CrossRef]
  70. O’Malley, E.; O’Gorman, C. Competitive advantage in the Irish indigenous software industry and the role of inward foreign direct investment. Eur. Plan. Stud. 2001, 9, 303–321. [Google Scholar] [CrossRef]
  71. Sachs, J.; Schmidt-Traub, G.; Kroll, C.; Lafortune, G.; Fuller, G. Sustainable Development Report; SDSN: New York, NY, USA, 2019. [Google Scholar]
  72. Reynolds, P.; Bosma, N.; Autio, E.; Hunt, S.; De Bono, N.; Servais, I.; Lopez, P.-G.; Chin, N. Global entrepreneurship monitor: Data collecting design and implementation 1998–2003. Small Bus. Econ. 2005, 24, 205–231. [Google Scholar] [CrossRef]
  73. Sarkodie, S.A.; Strezov, V. Effect of foreign direct investments, economic development and energy consumption on greenhouse gas emissions in developing countries. Sci. Total. Environ. 2019, 646, 862–871. [Google Scholar] [CrossRef]
  74. Fölster, S.; Henrekson, M. Growth elects of government expenditure and taxation in rich countries. Eur. Econ. Rev. 2001, 45, 1501–1520. [Google Scholar] [CrossRef] [Green Version]
  75. Aust, V.; Morais, A.I.; Pinto, I. How does foreign direct investment contribute to Sustainable Development Goals? Evidence from African countries. J. Clean. Prod. 2020, 245, 118823. [Google Scholar] [CrossRef]
  76. Pathaka, S.; Laplume, A.; Xavier, E.-O. Crafting sustainable development solutions: Frugal innovations of grassroots entrepreneurs. Entrep. Reg. Dev. 2015, 27, 334–356. [Google Scholar]
  77. Caves, R.E. Multinational Enterprise and Economic Analysis, Cambridge Surveys of Economic Literature, 2nd ed.; Cambridge University Press: Cambridge, UK, 1996. [Google Scholar]
  78. Kleibergen, F.; Paap, R. Generalized Reduced Rank Tests Using the Singular Value Decomposition. J. Econom. 2006, 133, 97–126. [Google Scholar] [CrossRef] [Green Version]
  79. Martínez-Rodriguez, I.; Callejas-Albiñana, F.E.; Callejas-Albiñana, A.I. Economic and Socio-Cultural Drivers of Necessity and Opportunity Entrepreneurship Depending on the Business Cycle Phase. J. Bus. Econ. Manag. 2020, 21, 373–394. [Google Scholar] [CrossRef] [Green Version]
  80. Brixiova, Z.; Égert, B. Entrepreneurship, institutions and skills in low-income countries. Econ. Model. 2017, 67, 381–391. [Google Scholar] [CrossRef] [Green Version]
  81. Buzzelly, M. Modifiable Areal Unit Problem. Int. Encycl. Hum. Geogr. 2020, 169–173. [Google Scholar]
Figure 1. Type of entrepreneurial activity and Sustainable Development Goals (SDGs) model.
Sustainability 12 09368 g001
Table 1. Variable definitions.
VariablesDefinition
Panel A: Dependent Variables
SDG ScoresSDG index on a country’s performance on the 17 SDGs (Sachs et al., 2019) for the year of 2019.
PeopleSDGs’ score for the following goals: No poverty, zero hunger, good health, quality education, gender equality, clean water, and sanitation.
ProsperitySDGs’ score for the following goals: Affordable and clean energy; decent work and economic growth; industry, innovation, and infrastructure; reduced inequality.
PlanetSDGs’ score for the following goals: Sustainable cities and communities, responsible consumption and production, climate action, life below water, life on land.
PeaceSDGs’ score for the following goals: Peace, justice, and strong institutions.
PartnershipSDGs’ score for the following goal: Partnerships.
Panel B: Independent Variables
Total Entrepreneurial Activity (TEA)Proportion of 18–64 population who are nascent entrepreneurs or owner-managers.
Necessity Entrepreneurship (NEA)Proportion of total entrepreneurial activity which reported no better option for work.
Opportunity Entrepreneurship (OEA)Proportion of total entrepreneurial activity that is driven by opportunity.
Innovative Entrepreneurship (IEA)Proportion of total entrepreneurial activity that offers new products or services to some or all customers and is offered by few or no other competitors.
Non-innovative Entrepreneurship (NIEA)Proportion of total entrepreneurial activity that does not offer new products or services.
Government Expenditure (GOVEXP)Sum of the general government’s final consumption and military, health, and education expenditures as a percentage of the GDP.
Foreign Direct Investment (FDI)Net inflows (new investment inflows less disinvestment) from foreign investors divided by the GDP.
Population (POP)Country’s population in millions.
Table 2. Descriptive Statistics.
HICUMICLMICAll Sample
(1)(2)(3)(4)
SDG SCORE75.8968.6963.4271.25
TEA9.8616.0816.6413.12
NEA1.924.335.253.30
OEA7.4611.2910.839.33
IEA3.034.133.303.44
NIEA6.8211.9513.349.67
FDI −0.722.582.430.91
GOVEXP29.9018.6223.9425.92
POP (millions)35.00107.52168.5382.03
Nº Countries33221267
This table presents the mean of several variables by country income group (HIC—high income country; UMIC—upper-middle income country; LMIC—lower-middle income country). All variables are defined in Table 1. Independent variables are computed as the annual average over the period from 2015–2018.
Table 3. Impact of entrepreneurial activity on the achievement of SDGs.
Model 1 (TEA)Model 2 (NEA and OEA)Model 3 (NIEA and IEA)
TEA−0.281 ***
(0.087)
NEA −0.721 ***
(0.270)
OEA −0.094
(0.137)
NIEA −0.377 **
(0.137)
IEA −0.034
(0.197)
GOVEXPEND0.231 *0.229 *0.234 **
(0.126)(0.126)(0.124)
FDI−0.019−0.027−0.027
(0.047)(0.045)(0.047)
POP0.3180.3200.375
(0.278)(0.298)(0.291)
Constant70.841 ***70.210 ***70.501 ***
(4.369)(0.270)(4.289)
Dummy Income LevelYesYesYes
Observations676767
R—squared61.90%63.20%62.60%
This table presents the effect of different types of entrepreneurial activity on the achievement of SDGs. All variables are defined in Table 1. Independent variables are computed as the annual average over the period 2015–2018. Robust standard errors are in parentheses. *** p < 0.01; ** p < 0.05; * p < 0.1.
Table 4. Impact of entrepreneurial activity on SDGs’ five dimensions.
Model 1 (People)Model 2 (Prosperity)Model 3 (Planet)Model 4 (Peace)Model 5 (Partnership)
Panel A—Model 1 of Table 3
TEA−0.087 *−0.152 ***−0.002−0.004−0.036 ***
(0.053)(0.028)(0.035)(0.014)(0.009)
R—squared48.80%68.50%12.00%21.10%66.60%
Panel B—Model 2 of Table 3
NEA−0.527 ***−0.242 **0.0830.030−0.066 **
(0.153)(0.111)(0.103)(0.042)(0.031)
OEA0.106−0.123 **−0.034−0.020−0.024 *
(0.086)(0.055)(0.057)(0.020)(0.015)
R—squared52.90%69.00%12.60%21.70%67.20%
Panel C—Model 3 of Table 3
NIEA−0.194 **−0.184 ***0.0490.004−0.051 ***
(0.081)(0.046)(0.050)(0.020)(0.014)
IEA0.189−0.070−0.134−0.0230.003
(0.121)(0.115)(0.127)(0.053)(0.022)
R—squared52.90%69.00%12.60%21.70%67.20%
Control VariablesYesYesYesYesYes
Dummy Income LevelYesYesYesYesYes
Observations6767676767
This table shows the effect of entrepreneurial activity on the five dimensions of SDGs: People, prosperity, planet, peace, and partnership. The dependent variables are the sum of SDG index scores in each category divided by the total number of goals. Panels A, B, and C present the results for Models (1), (2), and (3) of Table 3. All variables are defined in Table 1. Independent variables are computed as the annual average over the period 2015–2018. Control variables, intercept, and income level fixed effects are included but not reported. Robust standard errors in parentheses. *** p < 0.01; ** p < 0.05; * p < 0.1.
Table 5. The moderating role of FDI on the relationship between entrepreneurship activities and the achievement of SDGs.
Model 1 (TEA)Model 2 (NEA and OEA)Model 3 (NIEA and IEA)
TEA−0.294 ***
(0.075)
TEAxFDI0.024 *
(0.012)
NEA −0.833 ***
(0.238)
OEA 0.030
(0.136)
NEAxFDI 0.102 **
(0.036)
OEAxFDI −0.034
(0.024)
NIEA −0.340 **
(0.141)
IEA −0.106
(0.294)
NIEAxFDI 0.028
(0.023)
IEAxFDI 0.000
(0.051)
FDI−0.239 *0.053−0.194
(0.113)(0.155)(0.156)
Intercept70.509 ***69.127 ***70.071 ***
(0.075)(4.405)(4.464)
Control VariablesYesYesYes
Dummy Income LevelYesYesYes
Observations676767
R—squared63.00%64.80%63.40%
This table presents the moderating role of FDI on the relation between entrepreneurial activity and the achievement of SDGs. All variables are defined in Table 1. Independent variables are computed as the annual average over the period 2015–2018. Robust standard errors are in parentheses. *** p < 0.01; ** p < 0.05; * p < 0.1.
Table 6. The moderating role of FDI on the relationship between entrepreneurship activities and the five dimensions of SDGs.
Model 1 (People)Model 2 (Prosperity)Model 3 (Planet)Model 4 (Peace)Model 5 (Partnership)
Panel A—Model 1 of Table 3
TEA−0.099 **−0.152 ***−0.003−0.004−0.036 ***
(0.038)(0.027)(0.034)(0.014)(0.009)
FDI−0.236 ***−0.017−0.0020.0130.003
(0.083)(0.051)(0.062)(0.022)(0.013)
FDIxTEA0.022 ***−0.0010.002−0.000−0.000
(0.008)(0.005)(0.005)(0.002)(0.001)
R-squared51.70%68.50%12.10%21.10%66.60%
Panel B—Model 2 of Table 3
NEA−0.539 ***−0.359 ***0.1480.026−0.108 ***
(0.133)(0.130)(0.150)(0.057)(0.038)
OEA0.143−0.031−0.077−0.0140.009
(0.092)(0.063)(0.092)(0.037)(0.023)
FDI−0.0660.081−0.0540.0140.040 **
(0.091)(0.075)(0.087)(0.030)(0.020)
NEAxFDI0.054 **0.032−0.0020.0060.012 *
(0.026)(0.022)(0.021)(0.010)(0.006)
OEAxFDI−0.011−0.024 *0.011−0.002−0.009 **
(0.017)(0.012)(0.015)(0.007)(0.004)
R-squared54.50%70.10%13.30%22.00%69.70%
Panel C—Model 3 of Table 3
NIEA−0.204 **−0.186 ***0.071−0.000−0.056 ***
(0.080)(0.048)(0.055)(0.022)(0.014)
IEA0.271−0.063−0.252−0.0010.029
(0.198)(0.135)(0.188)(0.078)(0.030)
FDI−0.192 *0.000−0.0340.0100.012
(0.097)(0.054)(0.051)(0.021)(0.012)
NIEAxFDI0.032 *−0.003−0.0020.0020.001
(0.017)(0.009)(0.007)(0.005)(0.002)
IEAxFDI−0.032−0.0010.032−0.006−0.007
(0.040)(0.023)(0.022)(0.013)(0.005)
R-squared53.90%68.90%15.90%21.70%68.60%
Control VariablesYesYesYesYesYes
Dummy Income LevelYesYesYesYesYes
Observations6767676767
This table shows the moderating role of FDI on the relation between entrepreneurial activity and the five dimensions of SDGs: People, prosperity, planet, peace, and partnership. The dependent variables are the sum of SDG index scores in each category divided by the total number of goals. Panels A, B, and C present the results for Models (1), (2), and (3) of Table 3, respectively. All variables are defined in Table 1. Independent variables are computed as the annual average over the period 2015–2018. Control variables, intercept, and income level fixed effects are included but not reported. Robust standard errors in parentheses. *** p < 0.01; ** p < 0.05; * p < 0.1.
Table 7. Impact of entrepreneurial activity on the achievement of SDGs.
Model 1 (TEA)Model 2 (NEA and OEA)Model 3 (NIEA and IEA)
TEA−0.266 **
(0.125)
NEA −0.893
(0.546)
OEA 0.083
(0.190)
NIEA −0.353 **
(0.170)
IEA 0.157
(0.341)
Constant70.570 ***68.532 ***69.045 ***
(4.072)(3.679)(4.394)
Dummy Income LevelYesYesYes
Observations555555
R—squared68.50%69.80%67.90%
Kleibergen-Paap F-statistics12.7211.572.689
This table presents the effect of different types of entrepreneurial activity on the achievement of SDGs using instrumental variable (IV) regression. All variables are defined in Table 1. Independent variables are computed as the annual average over the period 2015–2018. TEA, NEA, OEA, NIEA, and IEA are instrumented using their lagged values averaged over the period 2012–2014. Control variables, intercept, and income level fixed effects are included but not reported. Robust standard errors are in parentheses. *** p < 0.01; ** p < 0.05; * p < 0.1.
Table 8. The moderating role of FDI on the relationship between entrepreneurship activities and the achievement of SDGs.
Model 1 (TEA)Model 2 (NEA and OEA)Model 3 (NIEA and IEA)
TEA−0.279 **
(0.124)
TEAxFDI0.036 *
(0.021)
NEA −1.125 **
(0.530)
OEA 0.215
(0.196)
NEAxFDI 0.105 *
(0.062)
OEAxFDI −0.028
(0.028)
NIEA −0.364 **
(0.176)
IEA 0.126
(0.370)
NIEAxFDI 0.039 *
(0.022)
IEAxFDI 0.045
(0.060)
FDI−0.345 *−0.035−0.400 **
(0.206)(0.179)(0.158)
Intercept70.112 ***67.946 ***68.563 ***
(4.272)(3.657)(4.556)
Control VariablesYesYesYes
Dummy Income LevelYesYesYes
Observations555555
R—squared70.10%71.70%68.10%
Kleibergen-Paap F-statistics10.9217.065.355
This table presents the moderating role of FDI on the relation between entrepreneurial activity and the achievement of SDGs using IV regression. All variables are defined in Table 1. Independent variables are computed as the annual average over the period 2015–2018. TEA, NEA, OEA, NIEA, IEA, and the interactions variables are instrumented using their lagged values averaged over the period 2012–2014. Control variables, intercept, and income level fixed effects are included but not reported. Robust standard errors are in parentheses. *** p < 0.01; ** p < 0.05; * p < 0.1.
Table 9. Impact of entrepreneurial activity on the achievement of SDGs.
Model 1Model 2Model 3
Q 25Q 50Q 75
Panel A—Model 1 of Table 3
TEA−0.285 **−0.307 *−0.130
(0.114)(0.171)(0.130)
Pseudo R—squared41.36%43.66%45.24%
Panel B—Model 2 of Table 3
NEA−0.694 **−0.957 *−0.639
(0.323)(0.494)(0.558)
OEA−0.108−0.123−0.033
(0.201)(0.254)(0.160)
Pseudo R—squared44.06%43.92%46.71%
Panel C—Model 3 of Table 3
NIEA−0.384 **−0.462 *−0.302
(0.148)(0.261)(0.262)
IEA0.077−0.154−0.074
(0.292)(0.274)(0.252)
Pseudo R—squared42.56%44.41%45.61%
Control VariablesYesYesYes
Dummy Income LevelYesYesYes
Observations676767
This table shows the effect of entrepreneurial activity using Quantile Regression (QR) estimation. Panels A, B, and C present the results for Models (1), (2), and (3) of Table 3, respectively. All variables are defined in Table 1. Independent variables are computed as the annual average over the period 2015–2018. Control variables, intercept, and income level fixed effects are included but not reported. Robust standard errors in parentheses. *** p < 0.01; ** p < 0.05; * p < 0.1.
Table 10. Moderating role of FDI on the relationship between entrepreneurship activities and the achievement of SDGs.
Model 1Model 2Model 3
Q 25Q 50Q 75
Panel A—Model 1 of Table 3
TEA−0.234 *−0.382 *−0.123
(0.140)(0.223)(0.186)
FDIxTEA0.0160.020−0.004
(0.031)(0.043)(0.064)
Pseudo R—squared42.75%44.42%45.25%
Panel B—Model 2 of Table 3
NEA−0.862 *−0.754 *−0.921
(0.463)(0.434)(0.572)
OEA−0.003−0.0010.037
(0.247)(0.233)(0.215)
NEAxFDI0.1240.1130.091
(0.111)(0.091)(0.155)
OEAxFDI−0.026−0.033−0.022
(0.056)(0.045)(0.058)
Pseudo R—squared44.91%47.01%49.09%
Panel C—Model 3 of Table 3
NIEA−0.365 *−0.495 *−0.434
(0.189)(0.279)(0.348)
IEA−0.0340.1180.099
(0.689)(0.411)(0.683)
NIEAxFDI0.0080.0290.052
(0.076)(0.066)(0.079)
IEAxFDI0.014−0.050−0.081
(0.142)(0.102)(0.133)
Pseudo R—squared43.66%45.75%46.03%
Control VariablesYesYesYes
Dummy Income LevelYesYesYes
Observations676767
This table presents the moderating role of FDI on the relation between entrepreneurial activity and the achievement of SDGs using QR estimation. All variables are defined in Table 1. Independent variables are computed as the annual average over the period 2015–2018. Control variables, intercept, and income level fixed effects are included but not reported. Robust standard errors are in parentheses. *** p < 0.01; ** p < 0.05; * p < 0.1.
Publisher’s Note: MDPI stays neutral with regard to jurisdictional claims in published maps and institutional affiliations.

