Comparison of Product Sustainability of Conventional and Low-Carbon Apples in Korea
Abstract
:1. Introduction
2. Materials and Methods
2.1. Research Subject Selection
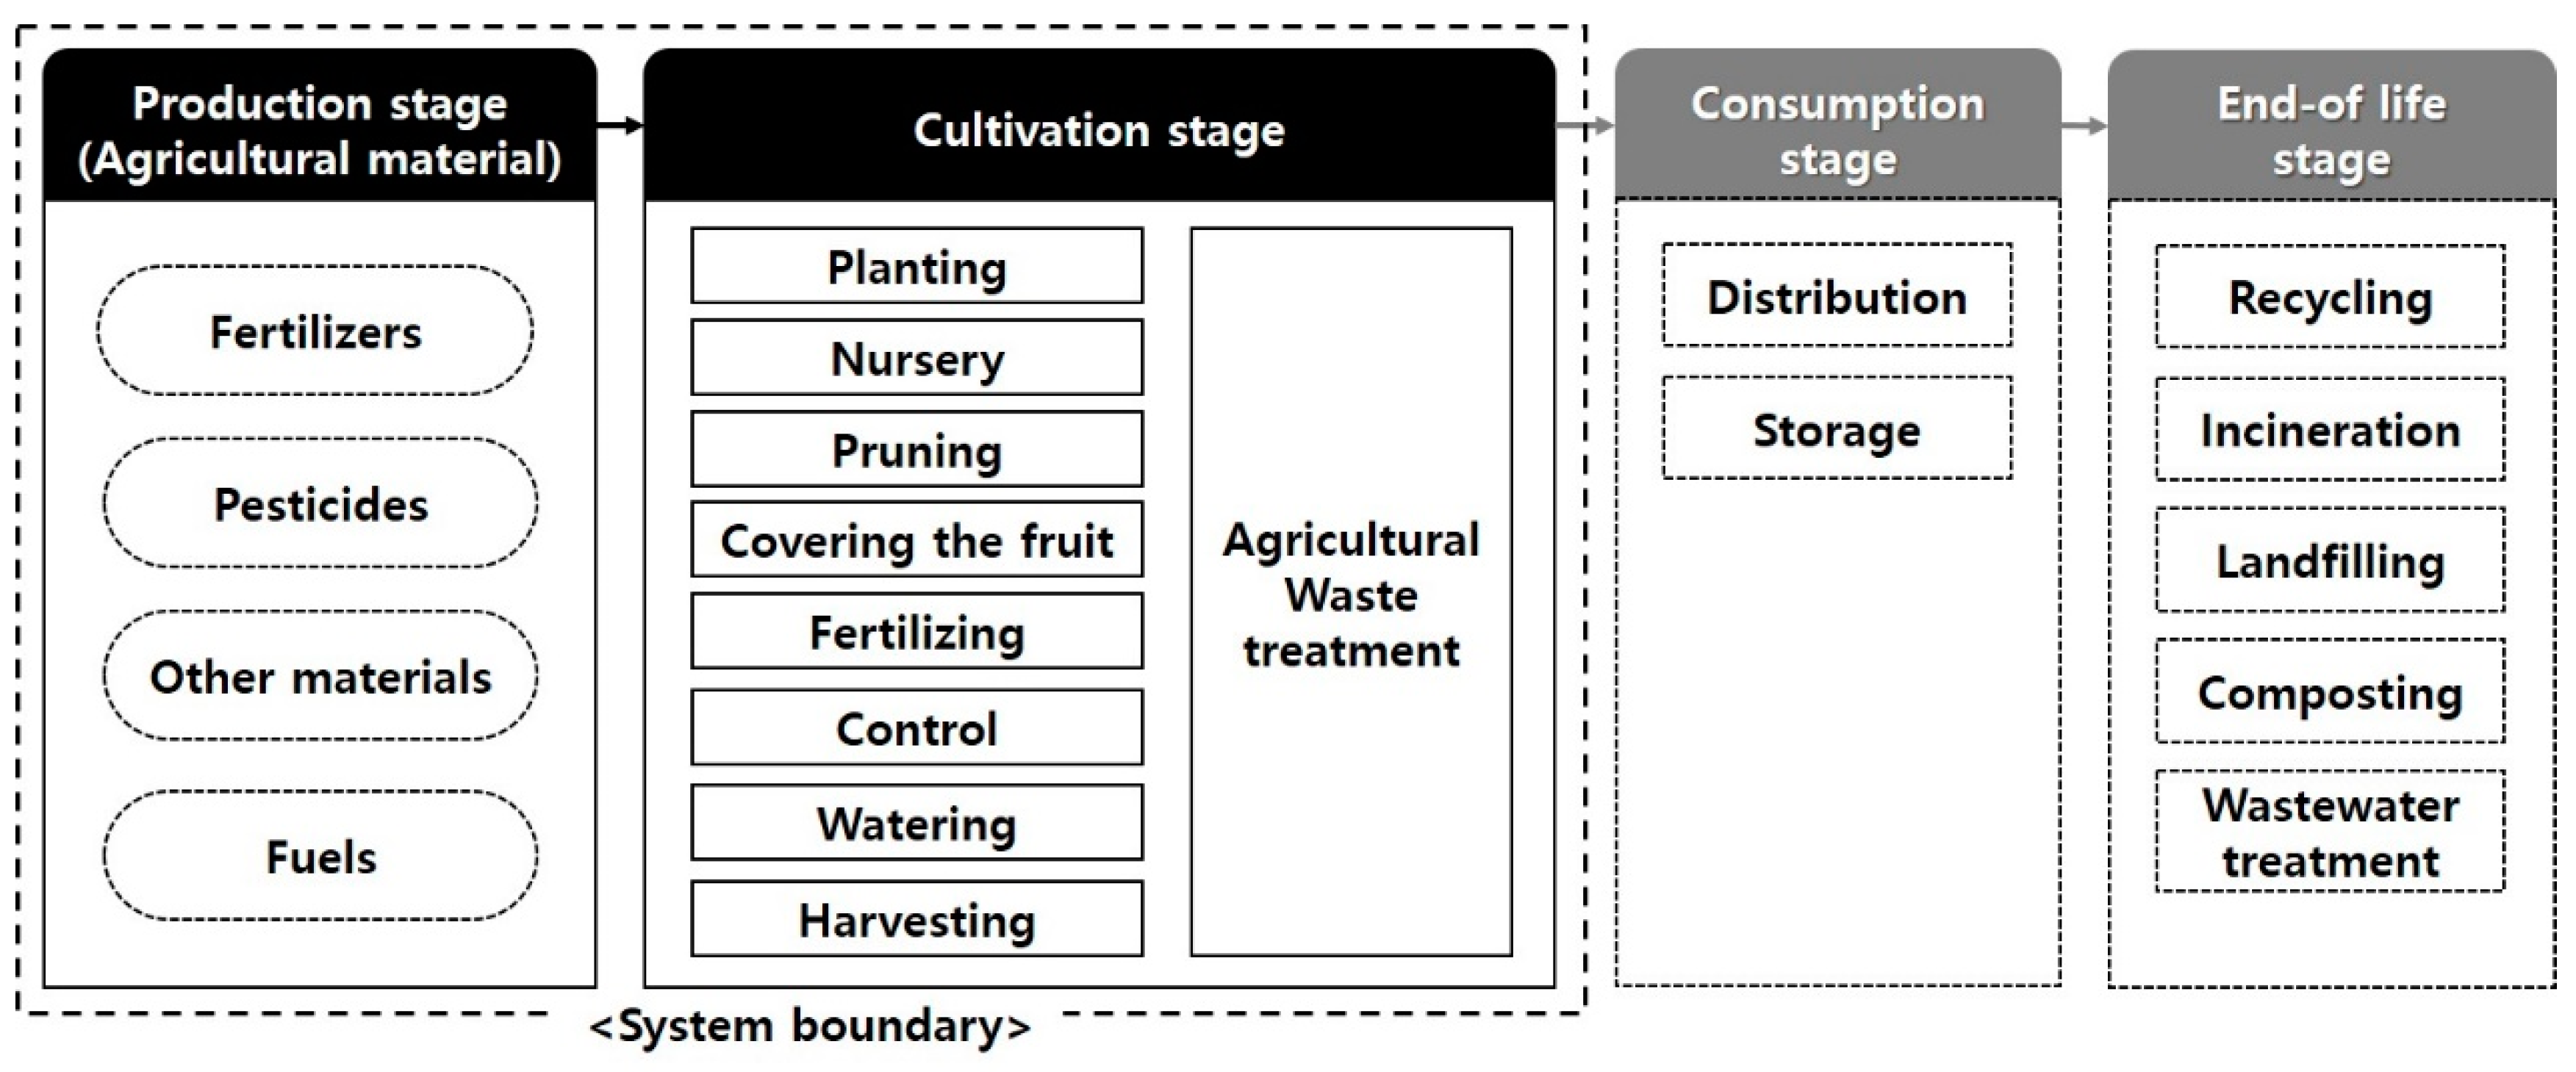
2.2. Environmental Assessment of Apples
2.3. Cost Analysis of Apples
2.4. Product Sustainability Assessment of Apples
3. Results and Discussion
3.1. Comparing Primary Data between Conventional and Low-Carbon Farming
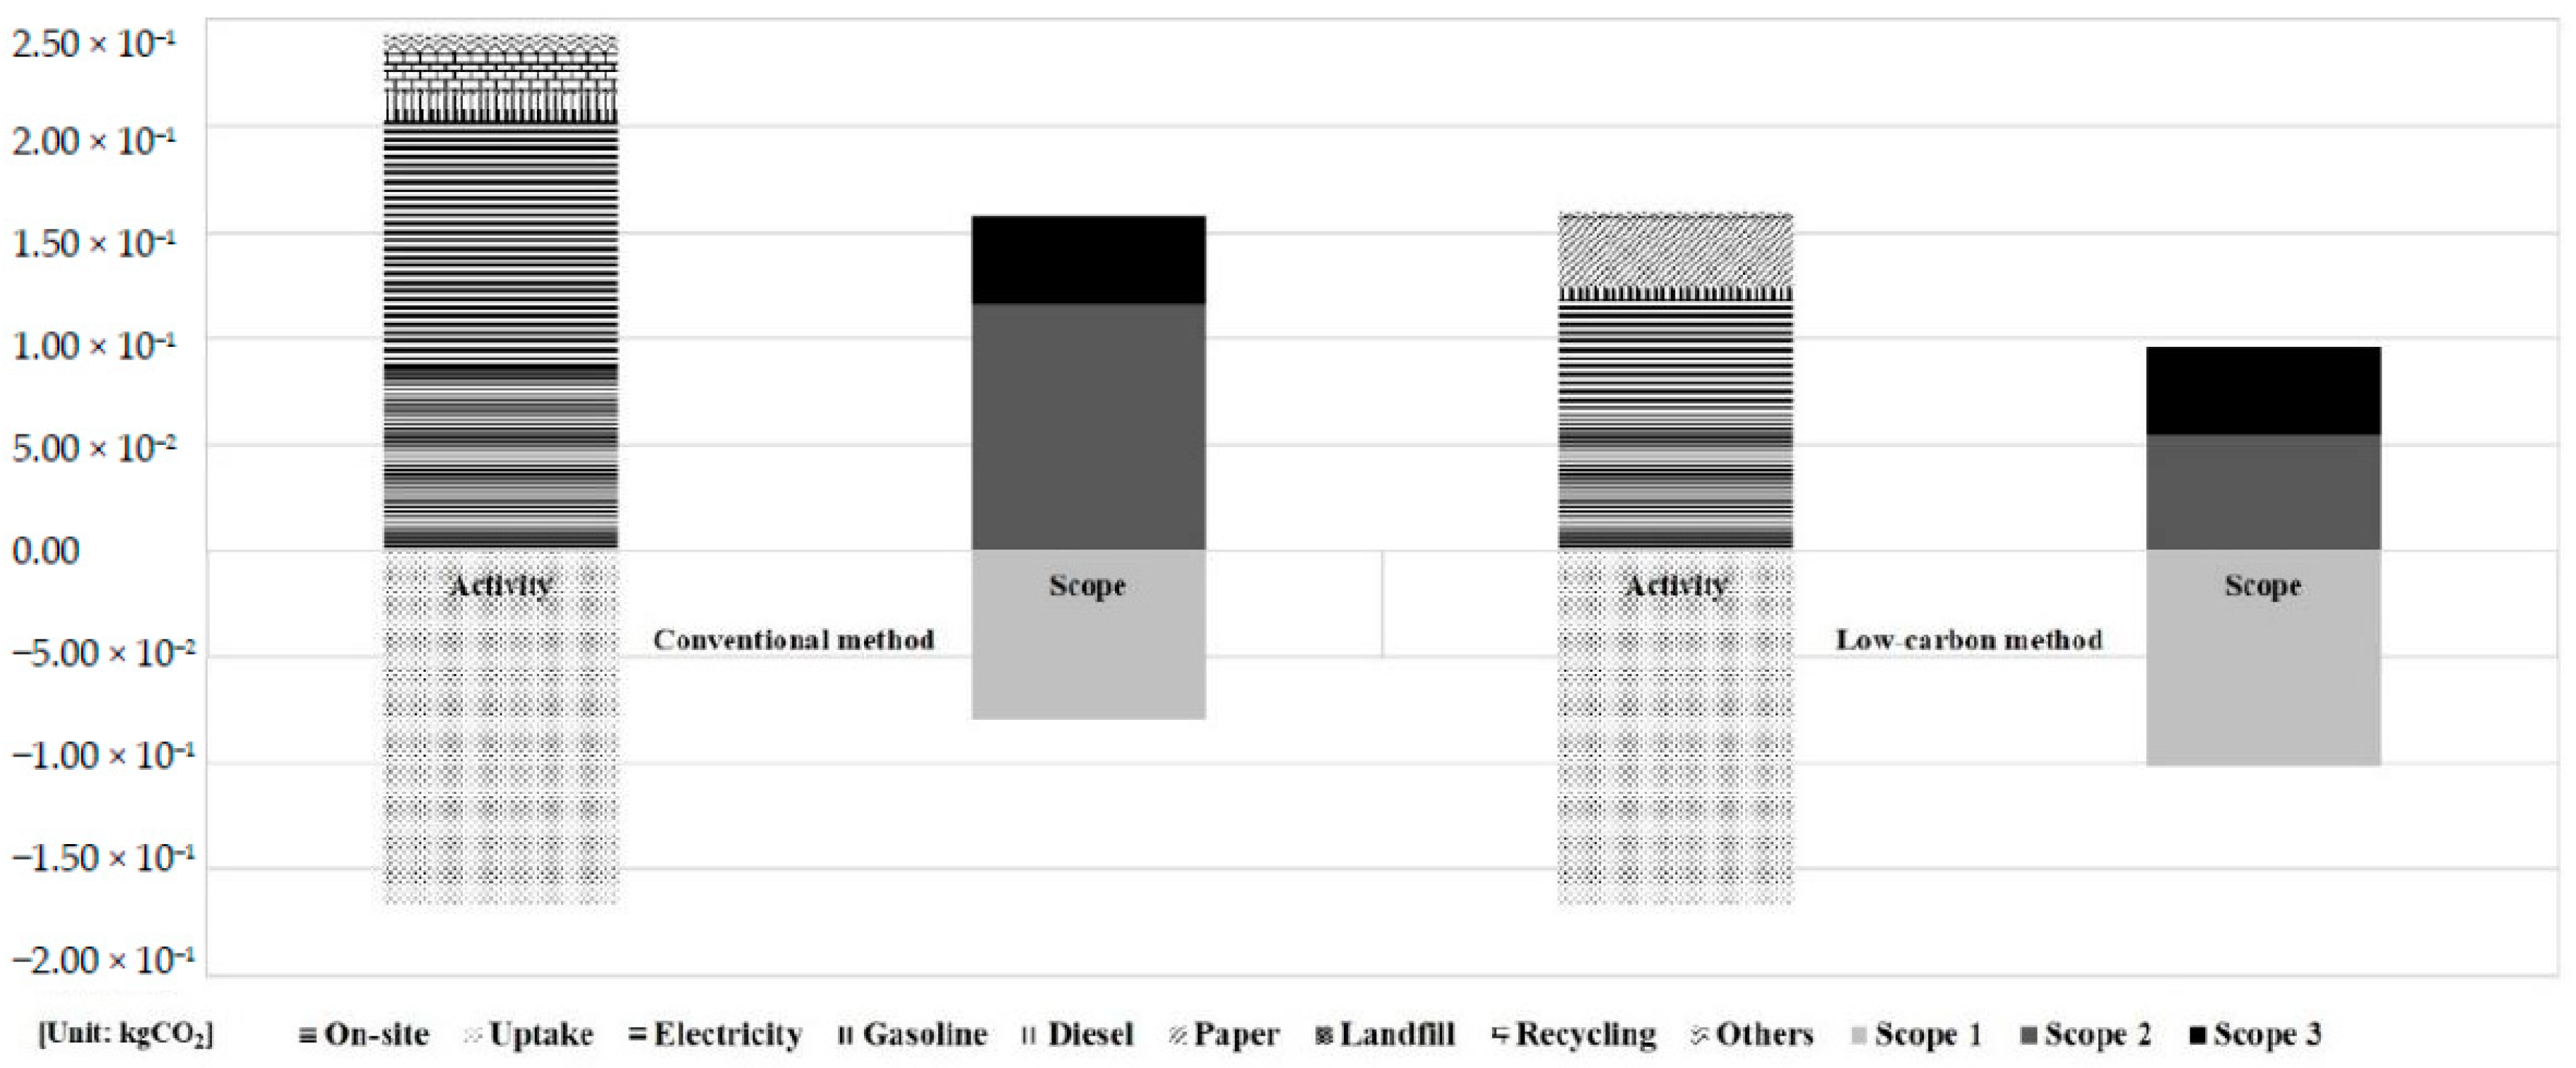
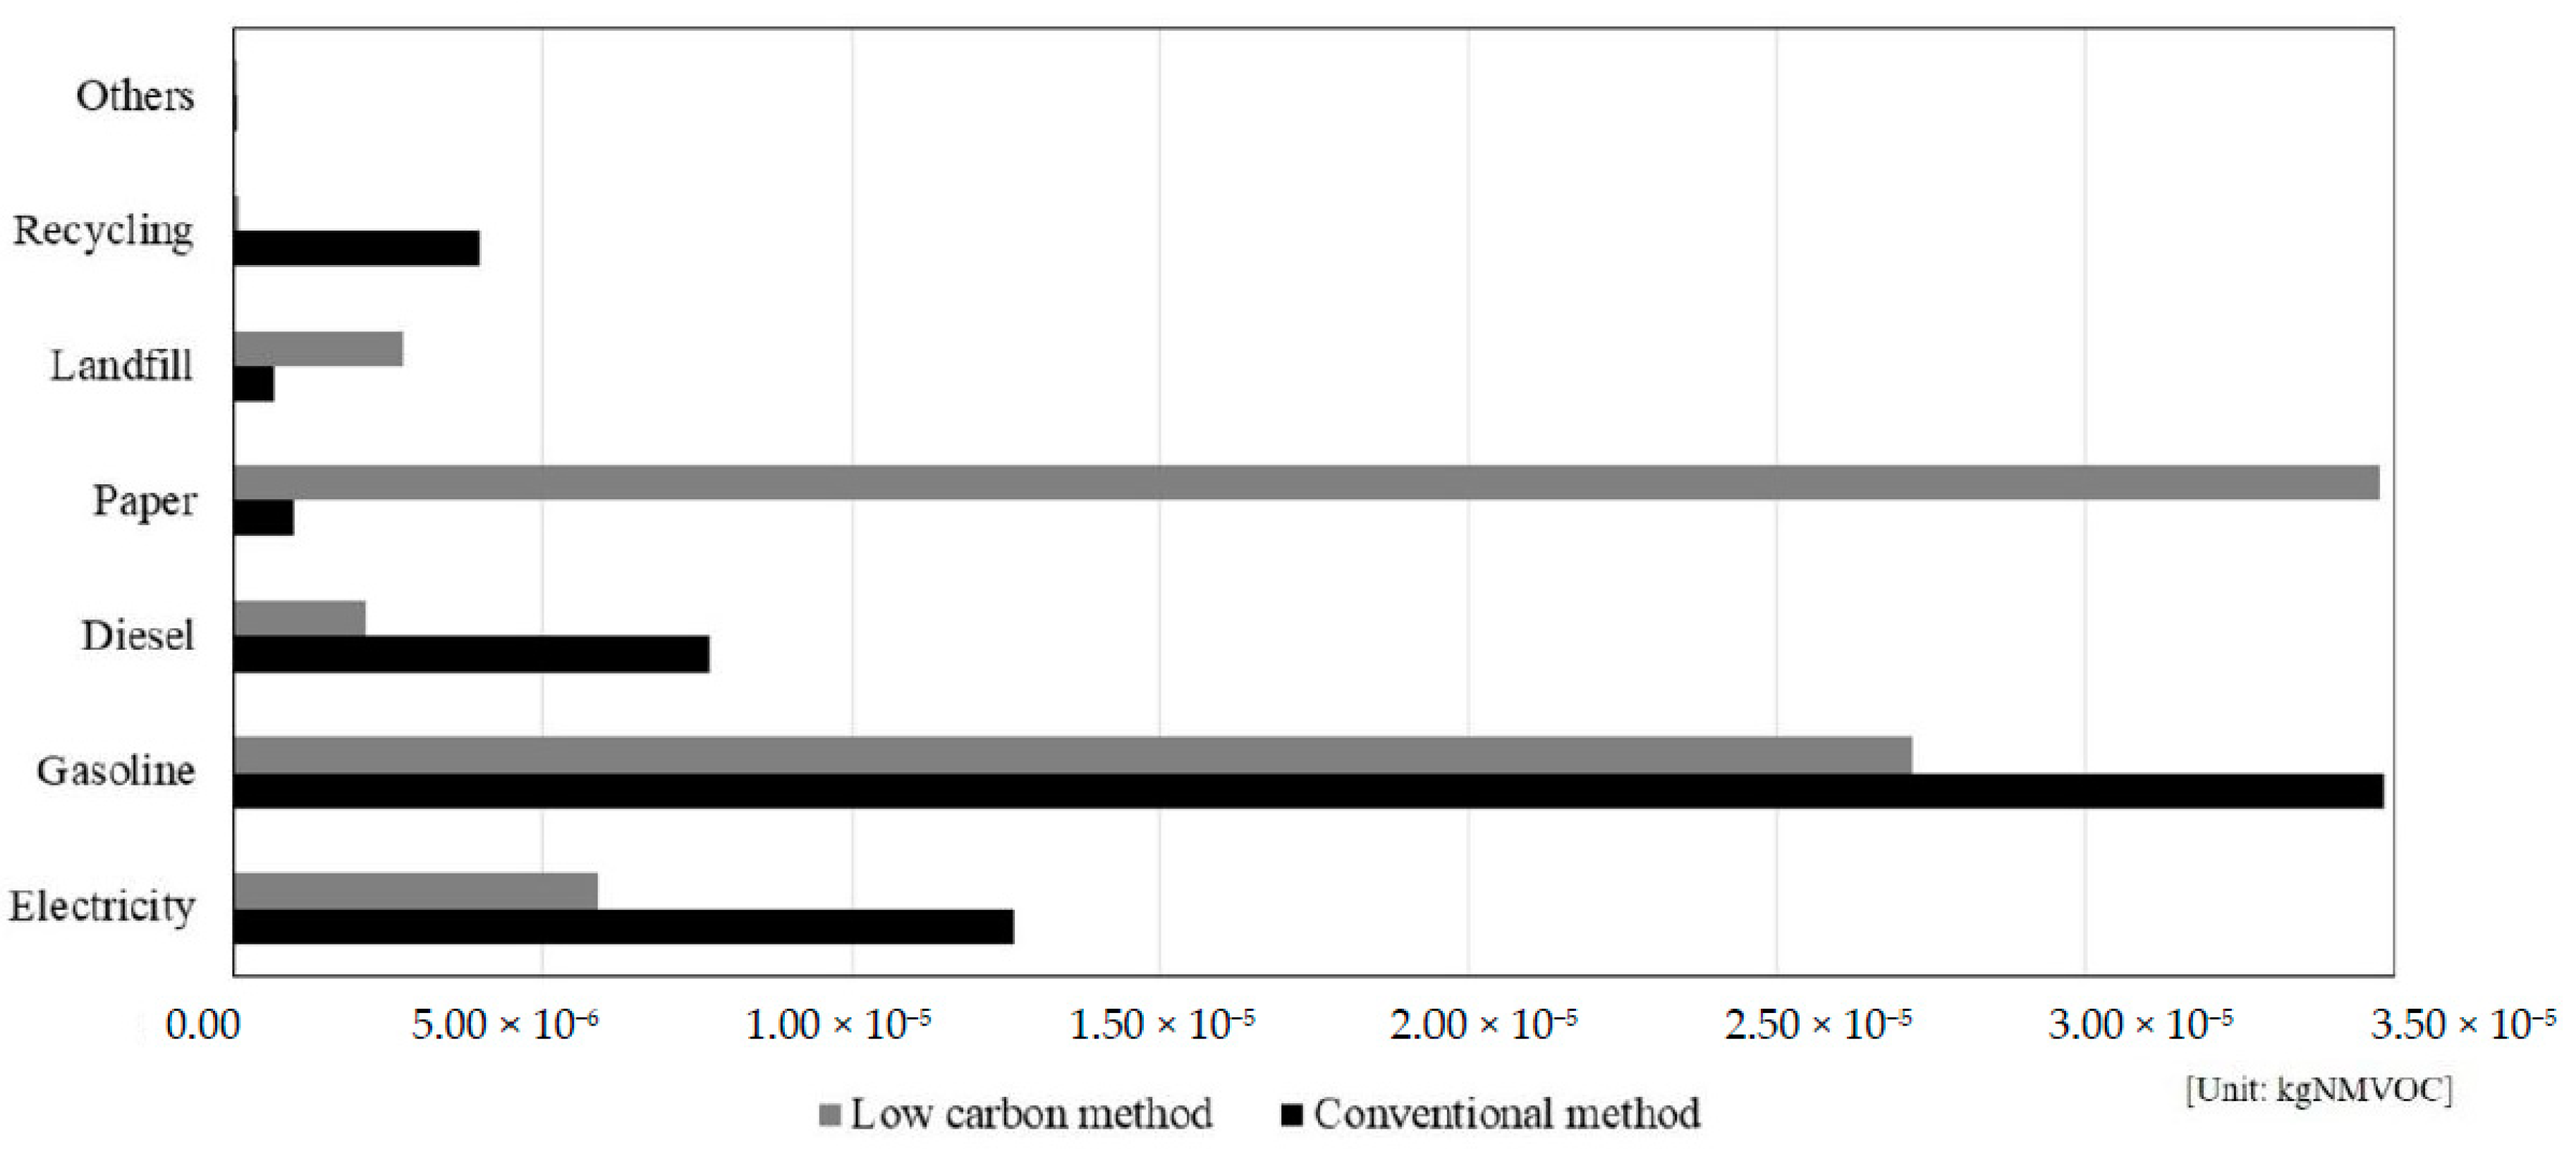
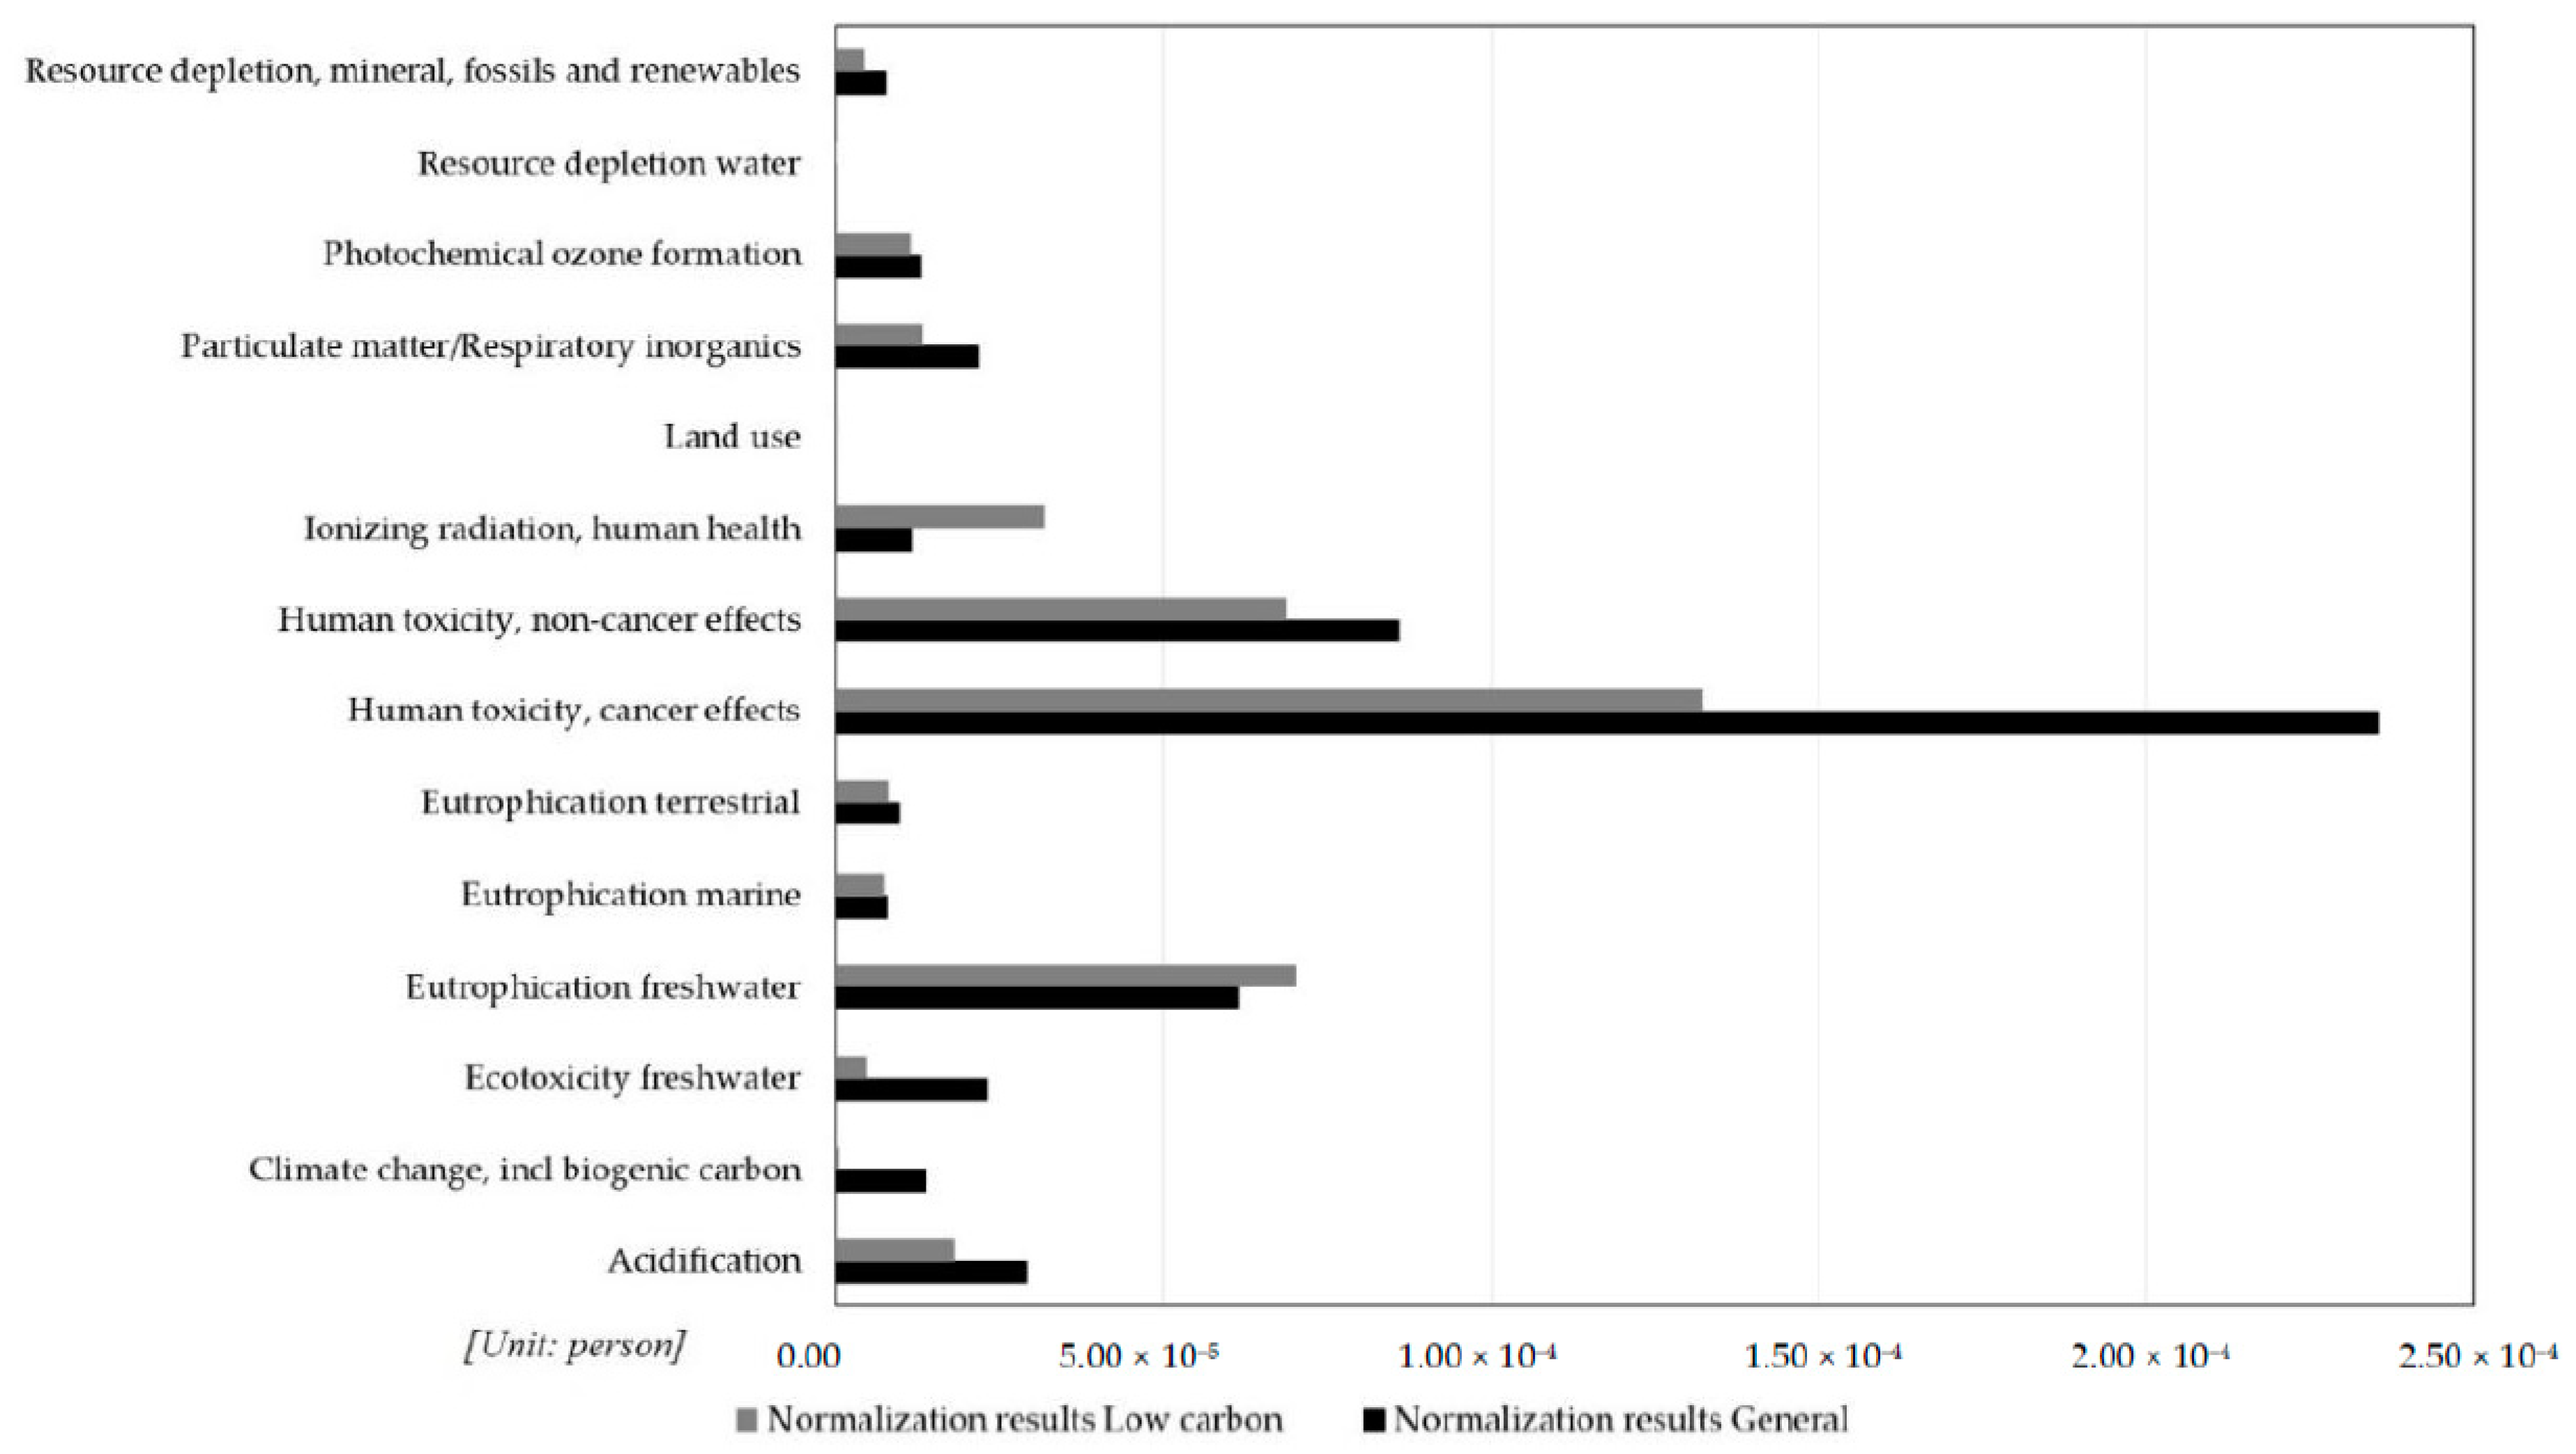
3.2. Environmental Assessment between Conventional and Low-Carbon Farming
3.3. Economic Assessment between Conventional and Low-Carbon Farming
3.4. Product Sustainability of Apples Cultivated through Conventional and Low-Carbon Farming
3.5. Product Sustainability of Apples Cultivated through Conventional and Low-Carbon Farming
4. Conclusions
Author Contributions
Funding
Acknowledgments
Conflicts of Interest
References
- United Nations Development Programme. Goal 12: Responsible Consumption and Production. Available online: https://www.undp.org/content/undp/en/home/sustainable-development-goals/goal-12-responsible-consumption-and-production.html (accessed on 5 November 2020).
- United Nations, Population. Available online: https://www.un.org/en/sections/issues-depth/population/ (accessed on 5 November 2020).
- Food and Agriculture Organization of the United Nations. Global and Regional Food Consumption Patterns and Trends. Available online: http://www.fao.org/3/ac911e/ac911e05.htm (accessed on 5 November 2020).
- Organization for Economic Co-operation and Development. Water and Agriculture. Available online: https://www.oecd.org/agriculture/topics/water-and-agriculture (accessed on 5 November 2020).
- Tukker, A.; Huppes, G.; Guinee, J.; Heijungs, R.; Koning, A.; Oers, L.; Suh, S.; Geerken, T.; Holderbeke, M.V.; Jansen, B.; et al. Environmental Impact of Products (EIPRO); European Commission Joint Research Centre: Ispra, Italy, 2006. [Google Scholar]
- European Commission. The European Green Deal; European Commission: Brussels, Belgium, 2019. [Google Scholar]
- Won, S.H.; Choi, H. The Agricultural Products Consumer Attitude Survey; Korea Agro-Fisheries & Food Trade Corporation: Naju, Korea, 2018. [Google Scholar]
- Masakazu, I.; Sangmin, N.; Sophie, B.; Hitomi, R.; Brian, C.; Ying, Q.; Rujira, K. Eco-Efficiency Indicators: Measuring Resource-Use Efficiency and He Impact of Economic Activities on the Environment; UN Economic and Social Commission for Asia and the Pacific (ESCAP): Bangko, Thailand, 2009. [Google Scholar]
- Changwichan, K.; Silalertruka, T.; Gheewala, S. Eco-efficiency assessment of bioplastics production systems and end-of-life options. Sustainability 2018, 10, 952. [Google Scholar] [CrossRef] [Green Version]
- Putri, W.H.; Sari, N.Y. Eco-efficiency and eco-innovation: Strategy to improve sustainable environmental performance. IOP Conf. Ser. Earth Environ. Sci. 2019, 245, 12049. [Google Scholar] [CrossRef]
- Thu, T.L.; Jan, E.; Gretchen, A.M. Measuring product sustainability: A literature review. In Proceedings of the Industrial and System Engineering Research Conference, Anaheim, CA, USA, 21–24 May 2016. [Google Scholar]
- Taeko, A.; Ryoichi, Y.; Toshiharu, I.; Yasuyuki, K. Factor X (eco-efficiency) assessment on global warming for one household in Japan. J. Inst. Energy 2010, 89, 1070–1087. [Google Scholar] [CrossRef] [Green Version]
- Rodrigo, C.; Lisiane, V.M.; Raquel, F.D.; Osvaldo, G.Q. Towards sustainable development through the perspective of eco-efficiency: A systematic literature review. J. Clean. Prod. 2017, 165, 890–904. [Google Scholar] [CrossRef]
- Misung, P.; Misook, L.; Sungwoo, K. In-Depth Research to Understand the Major Fruits Conditions; Korea Rural Economic Institute: Naju, Korea, 2018. [Google Scholar]
- Song, C.Y. Climate & Environmental Analysis and Economic Effect of Low Carbon Agricultural Technology Using LCA and Eco-Effieicncy; Sejong University: Seoul, Korea, 2020. [Google Scholar]
- Kim, C.G. Statistical Report on Food Consumption Behavior; Korea Rural Economic Institute: Naju, Korea, 2018; pp. 856–862. [Google Scholar]
- KOSIS. Fruit Production, Korean Statistical Information Service (KOSIS). 2018. Available online: htttp://kosis.kr/statHtml/statHtml.do?orgId=101&tblId=DT_1ET0292 (accessed on 21 June 2020).
- ISO. ISO 14040: Environmental Management–Life Cycle Assessment–Principles and Framework; ISO: Geneva, Switzerland, 1997. [Google Scholar]
- ISO 14044: Environmental Management–Life Cycle Assessment–Requirements and Guidelines; ISO: Geneva, Switzerland, 2006.
- Camillo, D.C.; Christian, B.; Urs, S.; Nicolas, M.; Henry, K.; Coen, B.; Jean, C.B.; Lars, L.; Øyvind, V.; Anna, P.; et al. ENVIFOOD Protocol: Environmental Assessment of Food and Drink Protocol; European Food Sustainable Consumption & Production Round Table: Ixelles, Belgium, 2013. [Google Scholar]
- EC. Commission Recommendation on the Use of Common Methods to Measure and Communicate the Life Cycle Environmental Performance of Products and Organizations; European Commission: Brussels, Belgium, 2013. [Google Scholar]
- BSI. PAS 2050: Specification for the Assessment of the Life Cycle Greenhouse Gas Emissions of Goods and Services; British Standards Institution (BSI): London, UK, 2011. [Google Scholar]
- ISO 14067: Greenhouse Gases–Carbon Footprint of Products–Requirements and Guidelines for Quantification; ISO: Geneva, Switzerland, 2018.
- Ra, S.Y. Crop Income Report; Rural Development Administration (RDA): Naju, Korea, 2018. [Google Scholar]
- Manfredi, S.; Allacker, K.; Chomkhamsri, K.; Pelletier, N.; Souza, D.M. Product Environmental Footprint (PEF) Guide; European Commission: Brussels, Belgium, 2012. [Google Scholar]
- Spatari, S.; Betz, M.; Florin, H.; Baitz, M.; Flatenbacher, M. Using GaBi 3 to perform life cycle assessment and life cycle engineering. Int. J. Life Cycle Assess. 2001, 6, 81–84. [Google Scholar] [CrossRef]
- Eco-Invent: LCI Datasets & LCIA Results. Available online: www.ecoinvent.org/database/how-to-use-ecoinvent-3-online/lci-datasets-and-lcia-results/lci-datasets-and-lcia-results.html (accessed on 20 June 2020).
- Eunjung, C.; Sangwook, S.; Hyunchul, J.; Jongsik, L.; Kunyeup, K.; Gyugo, S. A review on the carbon exchange estimation in fruit orchard. J. Clim. Chang. Res. 2014, 5, 339–348. [Google Scholar]
- Ranganathan, J.; Corbier, L.; Bhatia, P.; Schmitz, S.; Gage, P.; Oren, K. The Greenhouse Gas Protocol: A Corporate Accounting and Reporting Standard; World Business Council for Sustainable Development and World Resource Institute: Geneva, Switzerland, 2004. [Google Scholar]
- Serenella, S.; Eleonora, C.; Michela, S.; Rana, P. Global Normalization for the Environmental Footprint and Life Cycle Assessment; EC JRC Technical Report; Publications Office of the European Union: Brussels, Belgium, 2017. [Google Scholar]
- Sala, S.; Cerutti, A.K.; Pant, R. Development of a Weighting Approach for the Environmental Footprint; European Commission: Luxembourg, 2018. [Google Scholar]
- Return on Investment (ROI). Available online: www.investopedia.com/terms/r/returnoninvestment.asp (accessed on 11 October 2020).
- Seo, H.W.; Kim, J.H. 2030 Greenhouse Gas Reduction Roadmap Amendment and 2018–2020 Emission Permit Allocation Plan Confirmed; Press Release of Ministry of Environment: Sejong, Korea, 2018.
| Input (Activity) | Unit | Amounts | Ratio (a/b) (%) | ||
|---|---|---|---|---|---|
| Conventional Farming (a) | Low-Carbon Farming (b) | ||||
| Organic fertilizer | Livestock manure | kg | 5.81 × 10⁻¹ | 2.34 × 10⁻¹ | 247.9 |
| Oil cake | kg | 4.05 × 10⁻² | 9.66 × 10⁻³ | 419.0 | |
| Raw straw | kg | 9.20 × 10⁻⁴ | 0.00 | - | |
| Liquid fertilizer | kg | 5.06 × 10⁻³ | 1.51 × 10⁻¹ | 3.3 | |
| Eco-fertilizer | kg | 4.60 × 10⁻⁴ | 7.82 × 10⁻³ | 5.9 | |
| Others | kg | 0.00 | 0.00 | - | |
| Inorganic fertilizer | Complex fertilizer | kg | 9.20 × 10⁻³ | 5.52 × 10⁻³ | 166.7 |
| Urea | kg | 3.68 × 10⁻³ | 1.38 × 10⁻³ | 266.7 | |
| Fused Phosphate fertilizer | kg | 4.60 × 10⁻⁴ | 4.60 × 10⁻⁴ | 100 | |
| Potassium chloride | kg | 4.60 × 10⁻⁴ | 0.00 | - | |
| Potassium sulfate | kg | 3.22 × 10⁻³ | 4.60 × 10⁻³ | 70.0 | |
| Boron | kg | 4.60 × 10⁻⁴ | 0.00 | - | |
| Agricultural lime | kg | 5.06 × 10⁻³ | 3.13 × 10⁻² | 16.2 | |
| Calcium silicate | kg | 0.00 | 0.00 | - | |
| Magnesium sulfate | kg | 4.60 × 10⁻⁴ | 1.84 × 10⁻³ | 25.0 | |
| Nutrients | kg | 0.00 | 5.06 × 10⁻³ | - | |
| Others | kg | 0.00 | 0.00 | - | |
| Crop protection agent | Pesticide | kg | 2.16 × 10⁻² | 2.30 × 10⁻³ | 940.0 |
| Disinfectant | kg | 5.52 × 10⁻³ | 2.76 × 10⁻³ | 200.0 | |
| Herbicide | kg | 1.20 × 10⁻² | 4.60 × 10⁻⁴ | 2600.0 | |
| Others | kg | 0.00 | 0.00 | - | |
| Oil and Energy | Electricity | kWh | 2.00 × 10⁻¹ | 9.34 × 10⁻² | 214.3 |
| Diesel | L | 1.43 × 10⁻² | 8.74 × 10⁻³ | 163.2 | |
| Gasoline | L | 1.47 × 10⁻² | 1.98 × 10⁻² | 74.4 | |
| Kerosene | L | 9.20 × 10⁻⁴ | 0.00 | - | |
| Agricultural material | Reflective film | kg | 4.83 × 10⁻² | 1.01 × 10⁻² | 477.3 |
| Drip hose | kg | 5.06 × 10⁻³ | 9.20× 10⁻⁴ | 550.0 | |
| Apple cover | kg | 3.68 × 10⁻³ | 3.08 × 10⁻² | 11.9 | |
| Vinyl film | kg | 0.00 | 0.00 | - | |
| Others | kg | 4.60 × 10⁻⁴ | 0.00 | - | |
| Activity Name | Dataset Name | Source | Year |
|---|---|---|---|
| Electricity | Korea electricity mix | SMaRT-Eco | 2020 |
| Diesel | Diesel mix at refinery | US LCI | 2018 |
| Gasoline | Gasoline at refinery | US LCI | 2018 |
| Crop protection agent | Pesticide, corn, 2022 | US LCI | 2017 |
| Nitrogen fertilizer | Nitrogen fertilizer, production mix at plant | US LCI | 2017 |
| Phosphate fertilizer | Phosphate fertilizer, production mix at plant | US LCI | 2017 |
| Reflective film | Al-foiled plastic film | K-EPD ** | 2019 |
| Drip hose | Chlorine, PVC producer average at plant | US LCI | 2018 |
| Apple cover | Kraft paper (EN15804-A1-A3) | GaBi | 2018 |
| Steel pin | Iron and steel, production mix | US LCI | 2018 |
| Recycling (film) | Mixed recyclables, at collection | NREL * US | 2018 |
| Recycling (plastic) | Plastic recycling (unspecified) | US LCI | 2018 |
| Recycling (paper) | Mixed recyclables, at collection | NREL * US | 2018 |
| Recycling (steel) | Mixed recyclables, at collection | US LCI | 2018 |
| Incineration (paper) | Paper waste in waste incineration plant | US LCI | 2018 |
| Incineration (steel) | Ferro metals in waste incineration plant | NREL * US | 2018 |
| Landfill (paper) | Paper waste on landfill, post-consumer | US LCI | 2018 |
| Landfill (steel) | Ferro metals on landfill, post-consumer | US LCI | 2018 |
| Parameter | Unit | On-Site | Uptake | Electricity | Gasoline | Diesel | Paper | Landfill | Recycling | Others |
|---|---|---|---|---|---|---|---|---|---|---|
| Energy resources | kg | 5.98 × 10⁻² | 1.85 × 10⁻² | 2.21 × 10⁻² | 3.19 × 10⁻⁴ | 1.42 × 10⁻⁴ | 6.36 × 10⁻³ | 1.83 × 10⁻⁵ | ||
| Non-renewable energy | kg | 5.98 × 10⁻² | 1.85 × 10⁻² | 2.21 × 10⁻² | 3.19 × 10⁻⁴ | 1.42 × 10⁻⁴ | 6.36 × 10⁻³ | 1.83 × 10⁻⁵ | ||
| Renewable energy | kg | 0.00 | 0.00 | 0.00 | 0.00 | 0.00 | 0.00 | 0.00 | ||
| Material resources | kg | 3.22 × 101 | 3.96 × 10⁻⁵ | 2.32 | 1.35 | 1.93 × 10⁻¹ | 8.51 | −7.77 × 10⁻⁴ | ||
| Non-renewable elements | kg | 2.63 × 10⁻⁵ | 0.00 | 7.13 × 10⁻⁵ | 5.31 × 10⁻⁷ | 8.33 × 10⁻⁶ | 4.44 × 10⁻⁵ | −2.53 × 10⁻⁴ | ||
| Non-renewable resources | kg | 2.22 × 10⁻³ | 0.00 | 5.38 × 10⁻³ | 1.83 × 10⁻³ | 1.64 × 10⁻³ | 2.73 × 10⁻² | −8.84 × 10⁻⁵ | ||
| Renewable resources | kg | 3.22 × 101 | 3.96 × 10⁻⁵ | 2.31 | 1.35 | 1.92 × 10⁻¹ | 8.49 | −4.36 × 10⁻⁴ | ||
| Antimony | kg | 5.87 × 10⁻¹⁰ | 7.03 × 10⁻¹² | 2.82 × 10⁻¹¹ | 2.12 × 10⁻¹² | 3.72 × 10⁻¹³ | 1.15 × 10⁻⁷ | 4.53 × 10⁻¹⁰ | ||
| Iron | kg | 7.38 × 10⁻¹⁰ | 0.00 | 5.44 × 10⁻⁹ | 3.47 × 10⁻¹¹ | 4.88 × 10⁻¹¹ | 2.23 × 10⁻⁹ | 9.98 × 10⁻¹² | ||
| Aluminum | kg | 1.67 × 10⁻⁹ | 0.00 | 1.94 × 10⁻¹² | 3.88 × 10⁻¹² | 7.53 × 10⁻¹³ | 1.24 × 10⁻¹¹ | −1.28 × 10⁻¹⁴ | ||
| Ammonia | kg | 8.93 × 10⁻⁸ | 3.42 × 10⁻⁷ | 4.85 × 10⁻⁷ | 2.78 × 10⁻⁸ | 2.36 × 10⁻⁷ | 3.48 × 10⁻⁷ | 7.42 × 10⁻⁶ | ||
| Carbon dioxide | kg | 8.60 × 10⁻² | −2.02 × 10⁻¹ | 1.16 × 10⁻¹ | 6.14 × 10⁻³ | 6.88 × 10⁻³ | 8.49 × 10⁻⁴ | 6.52 × 10⁻⁴ | 1.73 × 10⁻² | 9.71 × 10⁻³ |
| Carbon monoxide | kg | 6.64 × 10⁻⁵ | 2.22 × 10⁻⁴ | 7.38 × 10⁻⁶ | 6.74 × 10⁻⁶ | 7.36 × 10⁻⁶ | 6.88 × 10⁻⁶ | 7.62 × 10⁻⁷ | ||
| Nitrogen dioxide | kg | 1.03 × 10⁻⁸ | 0.00 | 2.68 × 10⁻⁹ | 7.31 × 10⁻⁹ | 8.93 × 10⁻¹⁰ | 5.27 × 10⁻⁹ | 1.85 × 10⁻¹¹ | ||
| Nitrogen monoxide | kg | 8.89 × 10⁻⁸ | 0.00 | 9.13 × 10⁻⁸ | 8.68 × 10⁻⁸ | 9.22 × 10⁻⁹ | 4.64 × 10⁻⁸ | 1.31 × 10⁻¹⁰ | ||
| Nitrogen oxides | kg | 2.83 × 10⁻⁴ | 4.84 × 10⁻⁵ | 1.90 × 10⁻⁵ | 3.67 × 10⁻⁶ | 1.70 × 10⁻⁶ | 1.60 × 10⁻⁵ | 2.94 × 10⁻⁶ | ||
| Sulfur dioxide | kg | 8.31 × 10⁻⁴ | 7.15 × 10⁻⁵ | 1.28 × 10⁻⁵ | 1.27 × 10⁻⁶ | 5.76 × 10⁻⁷ | 2.66 × 10⁻⁵ | 6.58 × 10⁻⁵ | ||
| Sulfur hexafluoride | kg | 1.21 × 10⁻¹⁶ | 0.00 | 1.40 × 10⁻¹⁵ | 2.24 × 10⁻¹⁶ | 1.53 × 10⁻¹⁷ | 1.83 × 10⁻¹⁴ | 3.43 × 10⁻¹⁷ | ||
| Sulfur trioxide | kg | 6.04 × 10⁻⁹ | 0.00 | 1.30 × 10⁻⁹ | 1.49 × 10⁻¹⁰ | 1.60 × 10⁻¹¹ | 3.46 × 10⁻¹⁰ | 5.85 × 10⁻¹³ | ||
| Group NMVOC to air | kg | 1.26 × 10⁻⁵ | 3.48 × 10⁻⁵ | 7.73 × 10⁻⁶ | 9.62 × 10⁻⁷ | 6.30 × 10⁻⁷ | 3.97 × 10⁻⁶ | 6.38 × 10⁻⁹ | ||
| Methane | kg | 3.04 × 10⁻⁴ | 7.26 × 10⁻⁵ | 3.43 × 10⁻⁵ | 1.38 × 10⁻⁶ | 1.45 × 10⁻⁶ | 4.08 × 10⁻⁵ | 4.09 × 10⁻⁶ | ||
| Dust (> PM10) | kg | 4.51 × 10⁻⁷ | 0.00 | 1.66 × 10⁻⁷ | 2.26 × 10⁻⁷ | 4.62 × 10⁻⁸ | 1.65 × 10⁻⁶ | −1.05 × 10⁻⁷ | ||
| Dust (PM10) | kg | 6.20 × 10⁻⁵ | 5.18 × 10⁻⁶ | 1.36 × 10⁻⁹ | 1.05 × 10⁻⁹ | 2.49 × 10⁻⁹ | 8.72 × 10⁻⁹ | 5.27 × 10⁻⁶ | ||
| Dust (PM2.5–PM10) | kg | 6.46 × 10⁻⁶ | 1.11 × 10⁻⁶ | 8.61 × 10⁻⁷ | 1.90 × 10⁻⁷ | 3.51 × 10⁻⁸ | 3.20 × 10⁻⁷ | 5.02 × 10⁻⁸ | ||
| Dust (PM2.5) | kg | 2.59 × 10⁻⁷ | 0.00 | 4.21 × 10⁻⁷ | 1.19 × 10⁻⁷ | 5.29 × 10⁻⁸ | 5.29 × 10⁻⁷ | 5.36 × 10⁻⁹ | ||
| BOD | kg | 9.57 × 10⁻⁶ | 1.14 × 10⁻⁵ | 3.12 × 10⁻⁷ | 6.43 × 10⁻⁸ | 1.35 × 10⁻⁸ | 1.04 × 10⁻⁶ | 1.37 × 10⁻⁶ | ||
| COD | kg | 1.66 × 10⁻⁵ | 2.17 × 10⁻⁵ | 7.32 × 10⁻⁶ | 1.00 × 10⁻⁵ | 1.62 × 10⁻⁷ | 1.45 × 10⁻⁵ | 9.24 × 10⁻⁹ | ||
| TOC | kg | 6.89 × 10⁻¹⁰ | 0.00 | 2.95 × 10⁻⁷ | 6.63 × 10⁻⁹ | 9.51 × 10⁻¹⁰ | 3.46 × 10⁻⁸ | −1.86 × 10⁻¹¹ |
| Parameter | Unit | On-Site | Uptake | Electricity | Gasoline | Diesel | Paper | Landfill | Recycling | Others |
|---|---|---|---|---|---|---|---|---|---|---|
| Energy resources | kg | 2.80 × 10⁻² | 1.44 × 10⁻² | 6.07 × 10⁻³ | 1.15 × 10⁻² | 3.09 × 10⁻⁴ | 1.34 × 10⁻⁴ | 1.55 × 10⁻⁴ | ||
| Non-renewable energy | kg | 2.80 × 10⁻² | 1.44 × 10⁻² | 6.07 × 10⁻³ | 1.15 × 10⁻² | 3.09 × 10⁻⁴ | 1.34 × 10⁻⁴ | 1.55 × 10⁻⁴ | ||
| Renewable energy | kg | 0.00 | 0.00 | 0.00 | 0.00 | 0.00 | 0.00 | 0.00 | ||
| Material resources | kg | 1.51 × 101 | 3.09 × 10⁻⁵ | 6.36 × 10⁻¹ | 4.89 × 101 | 3.53 × 10⁻¹ | 1.79 × 10⁻¹ | −7.97 × 10⁻³ | ||
| Non-renewable elements | kg | 1.23 × 10⁻⁵ | 0.00 | 1.95 × 10⁻⁵ | 1.92 × 10⁻⁵ | 2.28 × 10⁻⁵ | 9.34 × 10⁻⁷ | −2.15 × 10⁻³ | ||
| Non-renewable resources | kg | 1.04 × 10⁻³ | 0.00 | 1.48 × 10⁻³ | 6.62 × 10⁻² | 3.86 × 10⁻³ | 5.74 × 10⁻⁴ | −7.58 × 10⁻⁴ | ||
| Renewable resources | kg | 1.51 × 101 | 3.09 × 10⁻⁵ | 6.35 × 10⁻¹ | 4.88 × 101 | 3.49 × 10⁻¹ | 1.78 × 10⁻¹ | −5.06 × 10⁻³ | ||
| Antimony | kg | 2.75 × 10⁻¹⁰ | 5.49 × 10⁻¹² | 7.73 × 10⁻¹² | 7.67 × 10⁻¹¹ | 8.49 × 10⁻¹³ | 2.42 × 10⁻⁹ | 3.85 × 10⁻⁹ | ||
| Iron | kg | 3.46 × 10⁻¹⁰ | 0.00 | 1.49 × 10⁻⁹ | 1.25 × 10⁻⁹ | 1.63 × 10⁻¹⁰ | 4.70 × 10⁻¹¹ | 8.45 × 10⁻¹¹ | ||
| Aluminum | kg | 7.82 × 10⁻¹⁰ | 0.00 | 5.31 × 10⁻¹³ | 1.40 × 10⁻¹⁰ | 1.30 × 10⁻¹² | 2.61 × 10⁻¹³ | −1.11 × 10⁻¹³ | ||
| Ammonia | kg | 4.18 × 10⁻⁸ | 2.67 × 10⁻⁷ | 1.33 × 10⁻⁷ | 1.01 × 10⁻⁶ | 1.98 × 10⁻⁶ | 7.31 × 10⁻⁹ | 2.40 × 10⁻⁶ | ||
| Carbon dioxide | kg | 6.40 × 10⁻² | −2.02 × 10⁻¹ | 5.44 × 10⁻² | 4.79 × 10⁻³ | 1.89 × 10⁻³ | 3.07 × 10⁻² | 7.17 × 10⁻⁴ | 3.64 × 10⁻⁴ | 3.05 × 10⁻³ |
| Carbon monoxide | kg | 3.11 × 10⁻⁵ | 1.73 × 10⁻⁴ | 2.03 × 10⁻⁶ | 2.44 × 10⁻⁴ | 3.10 × 10⁻⁶ | 1.45 × 10⁻⁷ | 1.23 × 10⁻⁶ | ||
| Nitrogen dioxide | kg | 4.81 × 10⁻⁹ | 0.00 | 7.36 × 10⁻¹⁰ | 2.64 × 10⁻⁷ | 2.43 × 10⁻⁹ | 1.11 × 10⁻¹⁰ | 1.57 × 10⁻¹⁰ | ||
| Nitrogen monoxide | kg | 4.16 × 10⁻⁸ | 0.00 | 2.50 × 10⁻⁸ | 3.14 × 10⁻⁶ | 2.44 × 10⁻⁸ | 9.76 × 10⁻¹⁰ | 1.11 × 10⁻⁹ | ||
| Nitrogen oxides | kg | 1.33 × 10⁻⁴ | 3.78 × 10⁻⁵ | 5.20 × 10⁻⁶ | 1.33 × 10⁻⁴ | 3.10 × 10⁻⁶ | 3.37 × 10⁻⁷ | 3.85 × 10⁻⁶ | ||
| Sulfur dioxide | kg | 3.89 × 10⁻⁴ | 5.58 × 10⁻⁵ | 3.51 × 10⁻⁶ | 4.59 × 10⁻⁵ | 1.37 × 10⁻⁶ | 5.60 × 10⁻⁷ | 7.46 × 10⁻⁵ | ||
| Sulfur hexafluoride | kg | 5.66 × 10⁻¹⁷ | 0.00 | 3.84 × 10⁻¹⁶ | 8.11 × 10⁻¹⁵ | 4.43 × 10⁻¹⁷ | 3.84 × 10⁻¹⁶ | 2.91 × 10⁻¹⁶ | ||
| Sulfur trioxide | kg | 2.83 × 10⁻⁹ | 0.00 | 3.57 × 10⁻¹⁰ | 5.38 × 10⁻⁹ | 3.38 × 10⁻¹¹ | 7.28 × 10⁻¹² | 4.93 × 10⁻¹² | ||
| Group NMVOC * to air | kg | 5.91 × 10⁻⁶ | 2.72 × 10⁻⁵ | 2.12 × 10⁻⁶ | 3.48 × 10⁻⁵ | 2.72 × 10⁻⁶ | 8.35 × 10⁻⁸ | 2.43 × 10⁻⁸ | ||
| Methane | kg | 1.42 × 10⁻⁴ | 5.67 × 10⁻⁵ | 9.41 × 10⁻⁶ | 4.98 × 10⁻⁵ | 1.62 × 10⁻⁶ | 8.57 × 10⁻⁷ | 2.54 × 10⁻⁶ | ||
| Dust (>PM10) | kg | 2.11 × 10⁻⁷ | 0.00 | 4.56 × 10⁻⁸ | 8.16 × 10⁻⁶ | 1.11 × 10⁻⁷ | 3.47 × 10⁻⁸ | −8.97 × 10⁻⁷ | ||
| Dust (PM10) | kg | 2.90 × 10⁻⁵ | 4.04 × 10⁻⁶ | 3.74 × 10⁻¹⁰ | 3.80 × 10⁻⁸ | 1.94 × 10⁻⁸ | 1.83 × 10⁻¹⁰ | 1.80 × 10⁻⁶ | ||
| Dust (PM2.5–PM10) | kg | 3.02 × 10⁻⁶ | 8.68 × 10⁻⁷ | 2.36 × 10⁻⁷ | 6.87 × 10⁻⁶ | 9.40 × 10⁻⁸ | 6.73 × 10⁻⁹ | −4.85 × 10⁻⁷ | ||
| Dust (PM2.5) | kg | 1.21 × 10⁻⁷ | 0.00 | 1.16 × 10⁻⁷ | 4.32 × 10⁻⁶ | 1.00 × 10⁻⁷ | 1.11 × 10⁻⁸ | 4.54 × 10⁻⁸ | ||
| BOD | kg | 4.48 × 10⁻⁶ | 8.91 × 10⁻⁶ | 8.56 × 10⁻⁸ | 2.32 × 10⁻⁶ | 6.15 × 10⁻⁹ | 2.18 × 10⁻⁸ | 2.10 × 10⁻⁸ | ||
| COD | kg | 7.78 × 10⁻⁶ | 1.69 × 10⁻⁵ | 2.01 × 10⁻⁶ | 3.62 × 10⁻⁴ | 3.28 × 10⁻⁷ | 3.04 × 10⁻⁷ | 7.76 × 10⁻⁸ | ||
| TOC | kg | 3.23 × 10⁻¹⁰ | 0.00 | 8.10 × 10⁻⁸ | 2.40 × 10⁻⁷ | 3.11 × 10⁻⁹ | 7.28 × 10⁻¹⁰ | −1.66 × 10⁻¹⁰ |
| Impact Category | Unit | Characterization Results | Ratio (a/b) | |
|---|---|---|---|---|
| Conventional (a) | Low Carbon (b) | |||
| Acidification | mol H+-eq | 1.63 × 10⁻³ | 1.00 × 10⁻³ | 163% |
| Climate change, including biogenic carbon | kg CO2-eq | 1.11 × 10⁻¹ | 3.99 × 10⁻³ | 2780% |
| Eco-toxicity freshwater | CTUe | 9.87 × 10⁻¹ | 1.99 × 10⁻¹ | 496% |
| Eutrophication freshwater | kg P-eq | 9.90 × 10⁻⁵ | 1.13 × 10⁻⁴ | 88% |
| Eutrophication marine | kg N-eq | 1.54 × 10⁻⁴ | 1.40 × 10⁻⁴ | 110% |
| Eutrophication terrestrial | mol N-eq | 1.72 × 10⁻³ | 1.45 × 10⁻³ | 119% |
| Human toxicity, cancer effects | CTUh | 4.38 × 10⁻⁹ | 2.46 × 10⁻⁹ | 178% |
| Human toxicity, non-cancer effects | CTUh | 1.98 × 10⁻⁸ | 1.58 × 10⁻⁸ | 125% |
| Ionizing radiation, human health | kBq U235-eq | 1.58 × 10⁻³ | 4.38 × 10⁻³ | 36% |
| Land use | kg Cdeficit | 3.63 × 10⁻² | 7.53 × 10⁻¹ | 5% |
| Particulate matter/Respiratory inorganics | kg PM2.5-eq | 8.30 × 10⁻⁵ | 5.04 × 10⁻⁵ | 165% |
| Photochemical ozone formation | kg C2H4-eq | 5.32 × 10⁻⁴ | 4.58 × 10⁻⁴ | 116% |
| Resource depletion water | m3-eq | 3.66 × 10⁻⁴ | 1.16 × 10⁻³ | 32% |
| Resource depletion, mineral, fossils | kg Sb-eq | 4.85 × 10⁻⁷ | 2.83 × 10⁻⁷ | 171% |
| Impact Category | Unit | Weighting Result | Ratio (a/b) | |
|---|---|---|---|---|
| Conventional (a) | Low Carbon (b) | |||
| Acidification | point | 1.82 × 10⁻⁴ | 1.12 × 10⁻⁴ | 163% |
| Climate change, including biogenic carbon | point | 2.91 × 10⁻⁴ | 1.05 × 10⁻⁵ | 2780% |
| Eco-toxicity freshwater | point | 4.44 × 10⁻⁵ | 8.95 × 10⁻⁶ | 496% |
| Eutrophication freshwater | point | 1.72 × 10⁻⁴ | 1.97 × 10⁻⁴ | 88% |
| Eutrophication marine | point | 2.34 × 10⁻⁵ | 2.13 × 10⁻⁵ | 110% |
| Eutrophication terrestrial | point | 3.61 × 10⁻⁵ | 3.04 × 10⁻⁵ | 119% |
| Human toxicity, cancer effects | point | 5.02 × 10⁻⁴ | 2.82 × 10⁻⁴ | 178% |
| Human toxicity, non-cancer effects | point | 1.58 × 10⁻⁴ | 1.26 × 10⁻⁴ | 125% |
| Ionizing radiation, human health | point | 5.74 × 10⁻⁵ | 1.59 × 10⁻⁴ | 36% |
| Land use | point | 1.29 × 10⁻⁷ | 2.68 × 10⁻⁶ | 5% |
| Particulate matter/Respiratory inorganics | point | 1.96 × 10⁻⁴ | 1.19 × 10⁻⁴ | 165% |
| Photochemical ozone formation | point | 6.25 × 10⁻⁵ | 5.38 × 10⁻⁵ | 116% |
| Resource depletion water | point | 2.71 × 10⁻⁷ | 8.58 × 10⁻⁷ | 32% |
| Resource depletion, mineral, fossils | point | 5.76 × 10⁻⁵ | 3.36 × 10⁻⁵ | 171% |
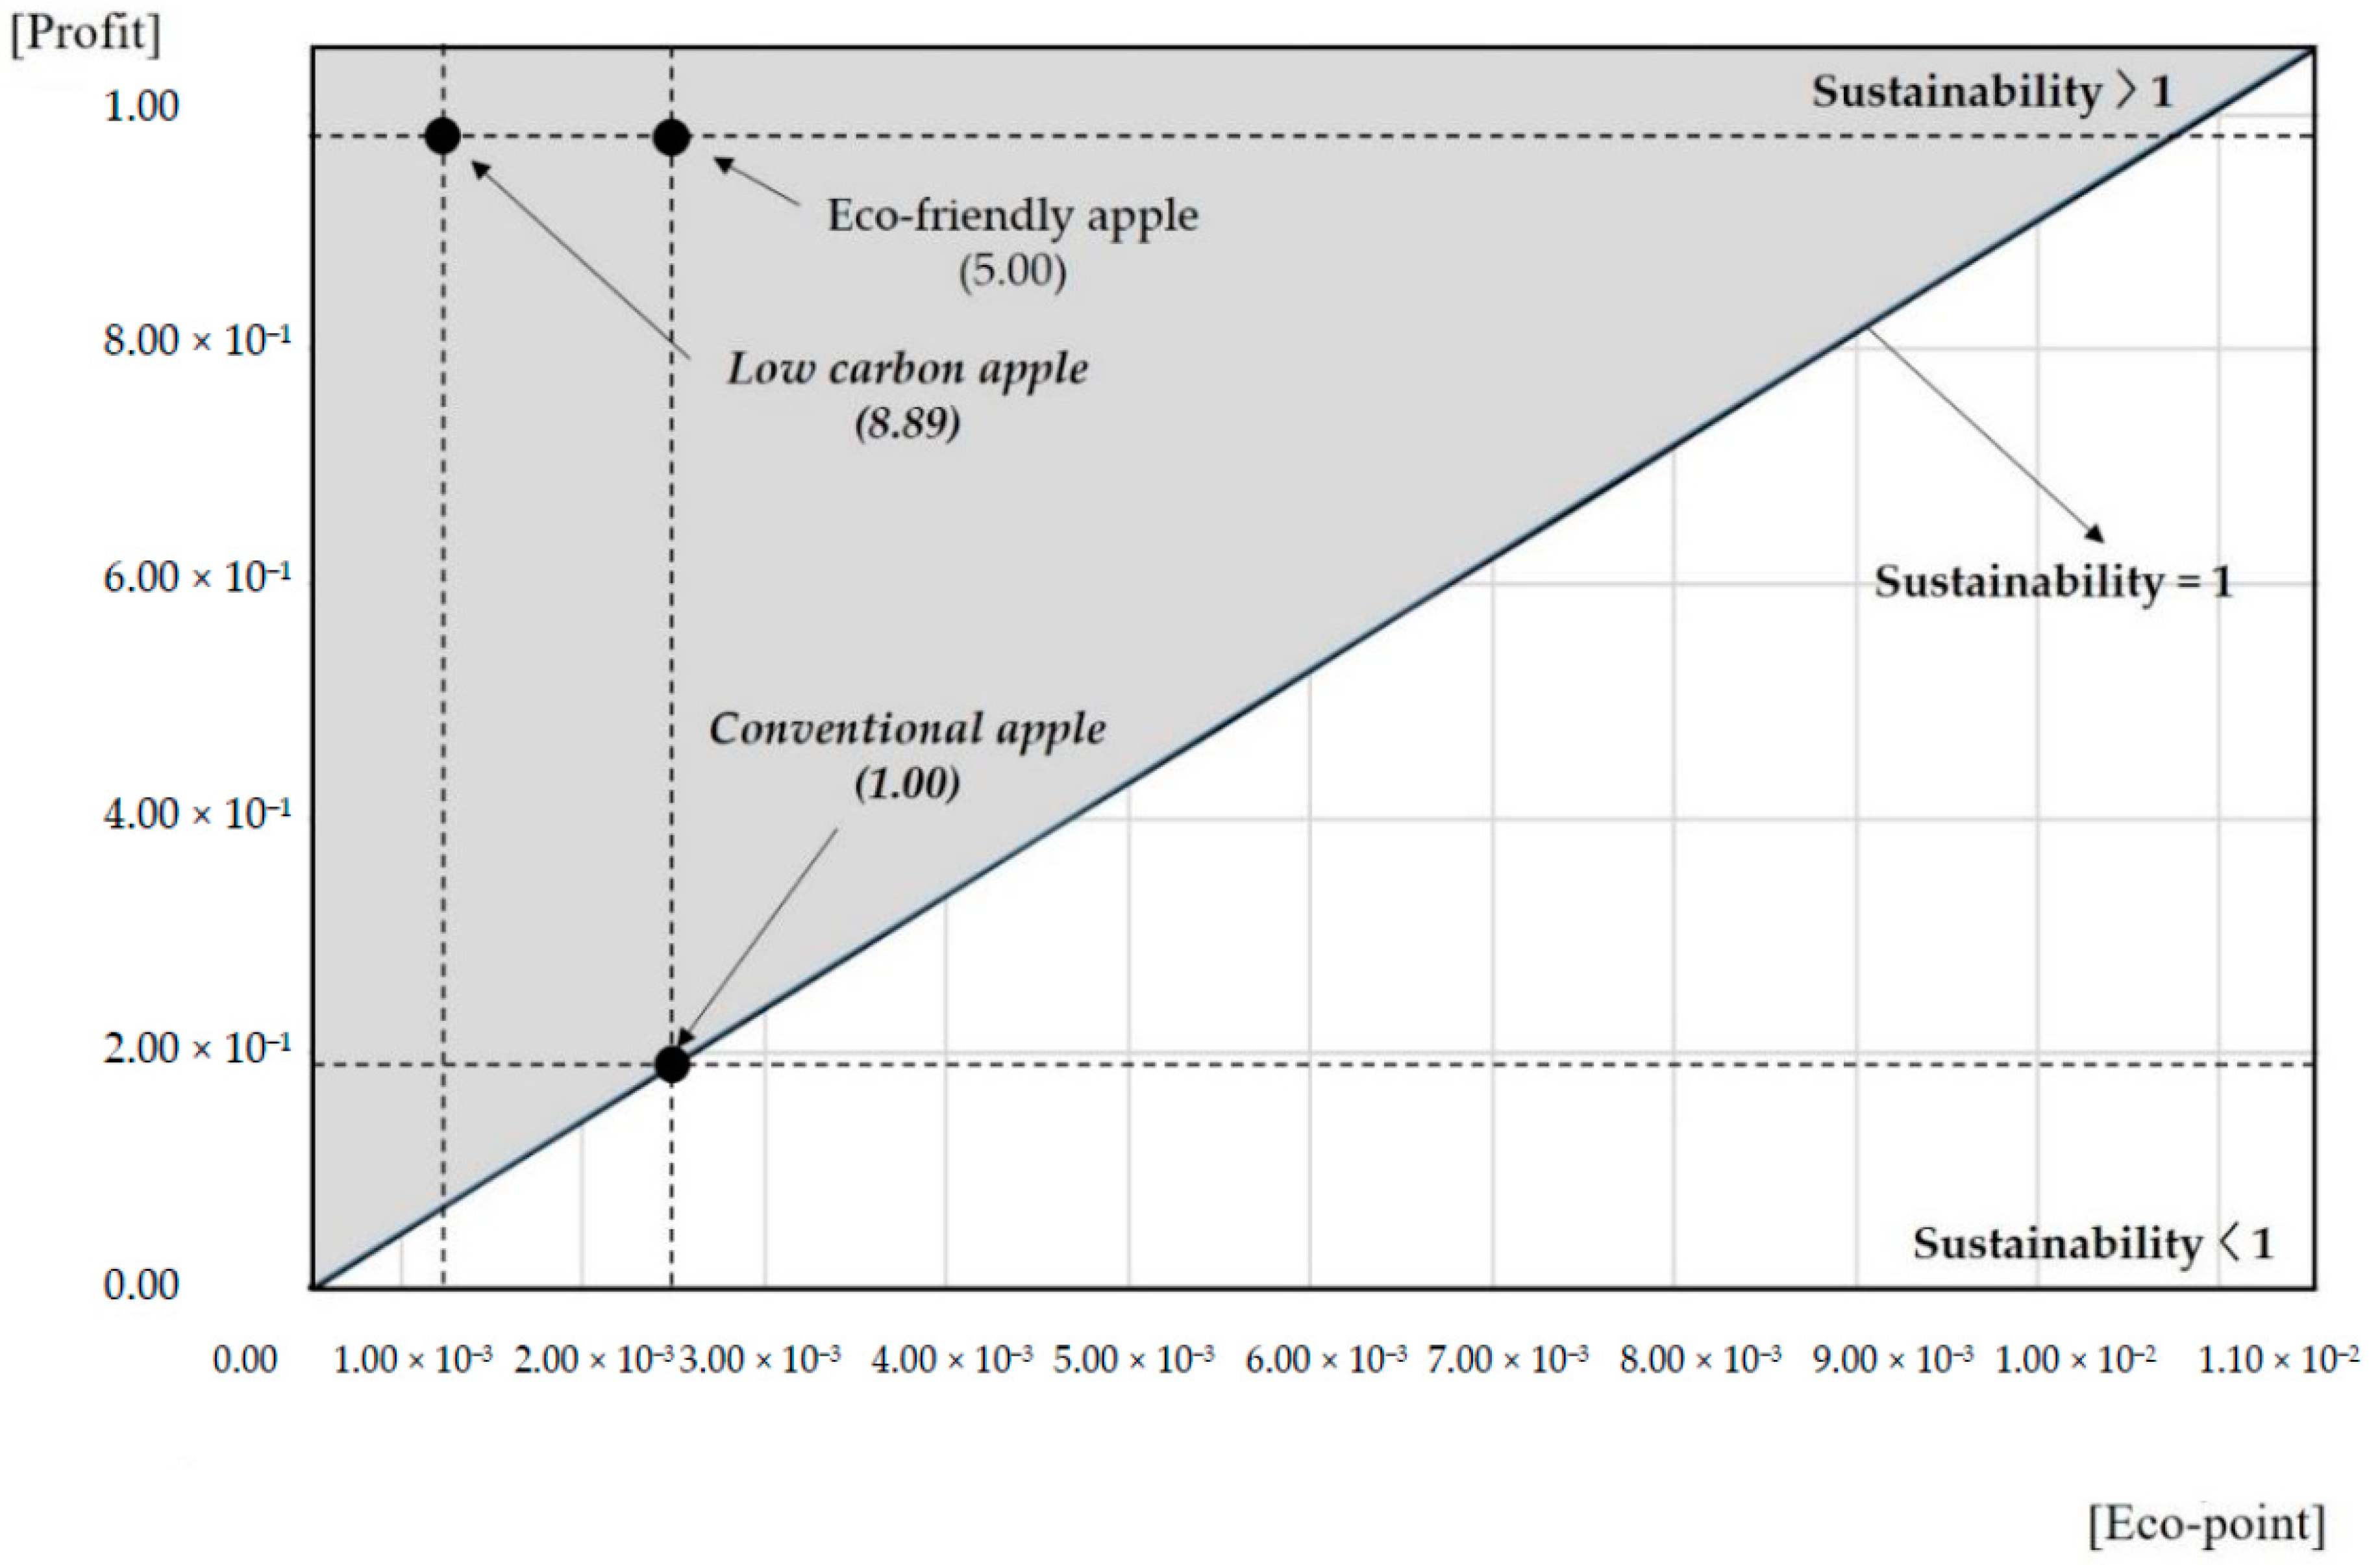
| The sum of weighting result (Eco-point) | point | 2.07 × 10⁻³ | 1.17 × 10⁻³ | 178% |
| Cost Items | Unit | Actual Cost | Ratio (a/b) | ||
|---|---|---|---|---|---|
| Conventional (a) | Low Carbon (b) | ||||
| Cost | Operating | USD/kg | 9.65 × 10⁻¹ | 1.59 | 60.9% |
| Inorganic fertilizer | USD/kg | 2.37 × 10⁻² | 1.20 × 10⁻¹ | 19.7% | |
| Organic fertilizer | USD/kg | 3.69 × 10⁻² | 1.09 × 10⁻¹ | 33.9% | |
| Crop protection agent | USD/kg | 1.37 × 10⁻¹ | 4.19 × 10⁻² | 326.5% | |
| Fuel and energy | USD/kg | 3.47 × 10⁻² | 2.74 × 10⁻² | 126.6% | |
| Agricultural material | USD/kg | 1.25 × 10⁻¹ | 1.62 × 10⁻¹ | 77.0% | |
| Small farm equipment | USD/kg | 3.96 × 10⁻³ | 9.62 × 10⁻³ | 41.2% | |
| Large farm equipment | USD/kg | 1.46 × 10⁻¹ | 1.46 × 10⁻¹ | 100.0% | |
| Facility depreciation | USD/kg | 7.40 × 10⁻² | 7.40 × 10⁻² | 100.0% | |
| Maintenance | USD/kg | 1.78 × 10⁻² | 1.78 × 10⁻² | 100.0% | |
| Land development | USD/kg | 1.20 × 10⁻¹ | 1.20 × 10⁻¹ | 100.0% | |
| Machine rental | USD/kg | 1.73 × 10⁻³ | 1.73 × 10⁻³ | 100% | |
| Land rental | USD/kg | 2.18 × 10⁻² | 2.4 × 10⁻² | 89.3% | |
| Consigned farming | USD/kg | 3.59 × 10⁻³ | 4.98 × 10⁻¹ | 0.7% | |
| Labor cost | USD/kg | 2.02 × 10⁻¹ | 1.71 × 10⁻¹ | 118.0% | |
| Other | USD/kg | 1.59 × 10⁻² | 5.35 × 10⁻² | 29.7% | |
| Total cost (c) | USD/kg | 1.93 | 3.17 | 60.9% | |
| Selling price (d) | USD/kg | 2.13 | 4.17 | 51.1% | |
| Profit (d–c) | USD/kg | 1.99 × 10⁻¹ | 9.95 × 10⁻¹ | 20.0% | |
Publisher’s Note: MDPI stays neutral with regard to jurisdictional claims in published maps and institutional affiliations. |
© 2020 by the authors. Licensee MDPI, Basel, Switzerland. This article is an open access article distributed under the terms and conditions of the Creative Commons Attribution (CC BY) license (http://creativecommons.org/licenses/by/4.0/).
Share and Cite
Kim, I.; Song, C.-y.; Jeon, E.-c. Comparison of Product Sustainability of Conventional and Low-Carbon Apples in Korea. Sustainability 2020, 12, 9364. https://doi.org/10.3390/su12229364
Kim I, Song C-y, Jeon E-c. Comparison of Product Sustainability of Conventional and Low-Carbon Apples in Korea. Sustainability. 2020; 12(22):9364. https://doi.org/10.3390/su12229364
Chicago/Turabian StyleKim, Ik, Chan-young Song, and Eui-chan Jeon. 2020. "Comparison of Product Sustainability of Conventional and Low-Carbon Apples in Korea" Sustainability 12, no. 22: 9364. https://doi.org/10.3390/su12229364
APA StyleKim, I., Song, C.-y., & Jeon, E.-c. (2020). Comparison of Product Sustainability of Conventional and Low-Carbon Apples in Korea. Sustainability, 12(22), 9364. https://doi.org/10.3390/su12229364


