Article

Runway Veer-Off Risk Analysis: An International Airport Case Study

Department of Civil, Building and Environmental Engineering, Sapienza-University of Rome, Via Eudossiana 18, 00186 Rome, Italy
*
Author to whom correspondence should be addressed.
Sustainability 2020, 12(22), 9360; https://doi.org/10.3390/su12229360
Submission received: 27 October 2020 / Revised: 8 November 2020 / Accepted: 9 November 2020 / Published: 11 November 2020
(This article belongs to the Special Issue Toward Sustainability: Airport Risk Assessment)

Abstract

:
Runway excursions are the main risk for runway safety: operational protection areas mitigate the effects of events classified as veer-off, overrun, and undershoot. This paper presents a methodology for the quantitative risk assessment of runway veer-off in an international airport whose name will not be revealed for privacy reasons. The proposed methodology is based on similar principles adopted in other aviation risk analyses. The Real Level of Safety (RLS) related to the veer-off accident was calculated through the implementation of a retrospective analysis that permits to define a frequency model, a location model and a consequence model. Instead, Target Level of Safety (TLS) was defined through the risk matrix and acceptability criteria present in the International Civil Aviation Organization (ICAO) Safety Management Manual. Finally, the risk of veer-off accidents in the airport under evaluation was determined by using primary data provided by the airport management body. Risk values were calculated in more than 1300 points around the runway and they were used to assess the current level of safety. The authors present a risk map that allows identifying the areas in the strip with the highest risk of a veer-off accident. The obtained results demonstrate that the developed methodology represents a useful tool to define TLS and to assess whether infrastructural and operational modification need to obtain the required level of safety.

1. Introduction

In the last decades, the issue of Runway Safety has been identified by the International Civil Aviation Organization (ICAO) as a priority for achieving global safety in the air transport system, as about half of accidents and serious incidents occurred nearby the runway [1]. Such a high percentage of aviation occurrences has prompted ICAO to adopt a series of actions needed to improve runway safety. An example is represented by the Amendment Proposals of Annex 14 which refers to a new monitoring and evaluation system able to assess and report about runway surface conditions in order to reduce the risk of accidents related to runway contamination [2].
When it comes to runway safety, Annex 14 describes a series of occurrence categories (e.g., undershoot/overshoot, loss of control on the ground, runway incursion). In particular, a category to be monitored is runway excursion, which nowadays represents the main risk for runway safety due to the high number of recorded events. De Couto [3] explained that runway excursions continue to be an absolute priority because of their high frequency of occurrence. Indeed, they represent the most significant source of aviation accidents in the world, approximately 40–50% of accidents recorded by ICAO each year. Although in most cases, these events do not lead to fatal accidents, the risk of death for passengers and crew is still important [4]. From the analysis of data collected in a database available to the authors containing aeronautical events that occurred around the world from 1996 to 2019, about 52% of accidents occurred near the runway, of which 41% of them belong to runway excursions, equally divided between veer-off and overrun, and most of them occurred during the landing phase (83%).
Studies in the literature shown that en-route flight involves only 12% of total accidents, even if it represents on average 57% of flight duration [5]. In particular, the accidents are concentrated mainly in the initial and in the final phase of the flight. For this reason, it is extremely important to ensure large runway safety areas in each airport and to avoid the emergence of obstacles around the airport in order to reduce the number of air disasters and their consequences. The runway safety and operational protection areas constitute an effective mitigation element of the effects related to events classified as veer-off, overrun, and undershoot. In particular, the runway strip has the purpose of reducing the risk of damage to an aircraft diverting from the runway (veer-off accident) through specific requirements relating to the longitudinal and transversal slope of the Cleared and Graded Area (CGA) together with the strips and subgrade bearing capacity. The physical dimensions and all the characteristics of this surface are defined by [6]. However, several airports have deviations related to the provision of a runway strip. The most common deviations concern the presence of non-frangible objects in the strips or a width not compliant with the values prescribed by ICAO. Additionally, regarding the Italian situation, almost all Italian airports were built during World War II as military airports. Therefore, the physical-territorial context and the anthropic development that has occurred over the years have influenced the airport/territory relationship and the potential expansion of infrastructures and/or adaptations of the runway safety areas.
These highlighted problems are common to most airports worldwide and have led international aviation authorities to consider the possibility of design solutions to manage non-conformities relating to airport infrastructures [7]. ICAO standards substantially outline a prescriptive design approach, but [6] allows the use of a more objective-based approach in some circumstances (e.g., aeronautical studies can support the aerodrome design process when there are deviations from Annex 14 prescriptions). Neither the nature of aeronautical studies nor any quantitative risk criteria are defined by [6], even if it is specified that it has to include studies on quantitative risk analysis and the achievement of an appropriate target level of safety (TLS) [8] to be compared to the real level of service (RLS). TLS is defined as a level of how far safety is to be pursued in a given context, assessed with the reference to an acceptable or tolerable risk [9]; RLS is the maximum risk allowed for a veer-off accident. Having regard to the veer-off accident, in the literature, some research analyzes the associated variables and their categories of severity [10], the probability [11,12] and the operational risk [13]. Particularly, different approaches have been proposed to risk analysis in runway excursion (e.g., Bayesian-network based [14], multiple Logistic regression method [15], frequency model [16,17,18]). This paper presents a quantitative risk assessment methodology from [16,17,18] and the definition of the objective level of safety linked to the veer-off accident as well as its application to a case study; an international airport whose name will not be disclosed for privacy reasons. The study was carried out using the ICAO Safety Management Manual as a regulatory reference [19] to assume the TLS. In the literature, there are lists of Target Level of Safety measures to be considered in civil aviation [20], or under specified scenarios (e.g., collision between a landing plane and an aircraft located on a parallel taxiway or the wing collision between two taxiing aircraft on two parallel taxiways) [21,22]. TLS values defined by ICAO All-Weather Operational Panel (AWOP ICAO) and the Obstacle Clearance Panel (OCP ICAO) are related to:
  • Risk of hull loss during all phases from all causes: 1.00 × 10⁻⁷ per flight hour or 1.50 × 10⁻⁷ per mission (ICAO AWOP).
  • Risk of accident on approach and landing from all causes: 1.00 × 10⁻⁸ per mission (ICAO AWOP).
  • Risk of collision with obstacle due to aircraft being laterally off-path or beneath the approach path: 1.00 × 10⁻⁷ per approach (ICAO OCP).
The implementation of this technique permits to define objectively the level of risk associated to the considered accident; to establish if the infrastructural requirements can satisfy the required safety levels according to the specific data of a given airport; to adopt measures to mitigate the risk in order to bring the event back on acceptable levels of risk tolerance if necessary. Furthermore, the methodology herein presented to assess the level of risk in an airport allows airport operators to take objective decisions on infrastructural measures or operating procedures. Moreover, it significantly reduces the investments necessary to ensure an equivalent level of safety when a full compliance with the infrastructure requirements prescribed by Standards and Recommended Practices (SARPs) is not possible or feasible.

2. Analytical Methodology

The quantitative risk assessment of runway veer-off has been carried out with a methodology inspired by the one developed by the Italian Civil Aviation Authority (ENAC) with University of Rome La Sapienza, based on assessing the risk deriving from aeronautical activities in surrounding areas of airports [23,24,25]. This methodology involves the creation of a structured set of methods and models to represent the risk through the product of the probability of occurrence with the damage severity.
The first model created is a veer-off accident frequency model to define the accident occurrence frequency, expressed through the ratio between the number of events recorded on total movements, which occurred in 20 years, between 1999 and 2018 [5]. The value of 1.02 × 10⁻⁷, approximately 1 event every 10 million movements, has been obtained considering among all the veer-off events occurred within Europe and North America to commercial aviation aircrafts with Maximum Take Off Weight (MTOW) over 60,000 pounds. Having regard to operations that took place in Asian countries, the frequency of occurrence of veer-off accidents would be higher, equal to 1.87 × 10⁻⁷; it would grow even more, up to 3.2 × 10⁻⁷, considering the accidents that have occurred all over the world. However, the Norwegian Civil Aviation Authority (NCAA) [8] suggests considering only operations that took place within Europe and North America to define the accident occurrence frequency: this criterion considers a homogeneous sample for aircraft, airport standards and procedures. According to the value of 1.02 × 10⁻⁷ and the database information about veer-off at landing and take-off or occurred veer-offs on instrumental or non-instrumental runways, it was possible to obtain the rates for flight phases and available instrumentation.
The second proposed model defines the geographic distribution of veer-off incidents in the runway strips. It permits to assess the probability that a veering aircraft exceeds a certain distance x measured across the runway axis. This model provides a subdivision into classes of the space inside the runway strip. According to the data collected from previous accidents about final positions of the aircraft wreckage diverting from the runway, the complementary cumulative probability of the continuous random variable has been calculated for each class, called Location. It expresses the distance measured transversely between runway centerline and the final position of the diverting aircraft. The analysis was conducted in a differentiated way for take-off and landing phases, and in both cases, the statistical regression model deduced was a negative exponential type. This approach complies with that proposed by [26]:
P   { Location > x } = e a x n
where a and n are regression coefficient.
Frequency and location models allow estimating the probability for an aircraft to have a veer-off accident and to exceed a certain distance x during the veer-off. The probability that one of the two events occur is independent of the occurrence of the other, therefore, according to the Probability Multiplicative Theorem [27], it is possible to combine the results obtained from the models described above and to obtain the probability that the aircraft is subjected to the veer-off incident and that it exceeds a certain distance x in diversion.
From the analysis of data collected in the database described in the Introduction, Equations (2)–(5) were derived to calculate the veer-off probability Equations (2)–(5) are valid for landings on instrument runways, for landings on non-instrument runways, for take-offs from instrument runways, and for take-offs from non-instrument runways, respectively:
f = 1.37 × 10⁻⁷ × e−0.025x
f = 6.57 × 10⁻⁷ × e−0.025x
f = 1.94 × 10⁻⁸ × e−0.0185x
f = 4.95 × 10⁻⁸ × e−0.0185x
where f is the frequency of an aircraft running beyond a certain distance, x, measured from the runway (RWY) centerline.
The examined airport has one instrument runway for air operations, so the adopted frequency curves are described in Equations (2) and (4).
Furthermore, the probability that an aircraft veers depends on the considered movement. Landing and take-off events are mutually exclusive (i.e., they cannot occur at the same time): according to the Additive Theorem of Probability [27], the probability that an event will occur is given by Equation (6):
f = 1.37 × 10⁻⁷ × e−0.025x + 1.94 × 10⁻⁸ × e−0.0185x
Lastly, a damage model of the veer-off accidents has been developed, which defines the average damage associated with the event. This model provides the Identification of the Hazards as a first step (i.e., the consequences associated with the veer-off) and, subsequently, the risk assessments associated with each hazard identified [28]. Through the analysis of the investigation reports of aviation accidents collected in the database and published by National Investigative Agencies [29,30,31,32], it was possible to identify seven main events: crossing of the airfield perimeter fence; collision with obstacles; crossing of the taxiway, apron etc.; impact against a drainage channel, an embankment or other; damage to the landing gear; fire; mechanical damage to engines, propellers.
For each identified event, in accordance with the model proposed by Moretti et al. [16,17], Equation (7) permits to assess the severity of damage D in terms of the effects on the health of people (both passengers and crew members) on board the diverted aircraft:
D = e v e n t ,   j     ( N f a t a l i t i e s       +       N i n j u r i e s ) e v e n t ,   j     ( N o c c u p a n t s )   ×   100
where Nfatalities is the number of deaths, Ninjuries is the number of injured people, Noccupants is the total number of people on board the diverted aircraft.
In the damage model, the frequency of occurrence and the severity of the associated damage are calculated for each event; the average damage associated with the veer-off accident is defined according to Equation (8):
D average   =   D j   ·   p e v e n t , j   p e v e n t , j   ×   100
The damage level D obtained is equal to 18%: despite having different databases, this value complies with [17,18].
The risk Rij associated with a hazard derives from Equation (9):
Rij = pj × Di
where:
pj = pveer-off × pevent,j = 1.02 × 10⁻⁷ × pevent,j
where Di severity of the i-th consequence associated to j-th hazard is considered.
According to Equation (9), Table 1 lists the average level of risk obtained for each event.
Subsequently, the Risk Matrix has been defined, within which the risk is structured according to acceptability criteria. In the literature, there are different proposals for structuring risk and its acceptability. In this study, the authors considered the ICAO Safety Management Manual [10] as a regulatory reference. The risk matrix in Table 2 consists of five levels of risk probability and risk severity, while the identified acceptability criteria are three: the red characters refer to “intolerable” risks; the yellow ones to tolerable risks (i.e., acceptable based on risk mitigation); the green ones to “acceptable” risks (i.e., consequences are unlikely or not serious enough to worry). Table 3 shows the safety risk tolerability matrix.
Given the results in Table 1, frequency and damage scales are defined for the assessment of the risk tolerability. Secondly, every single hazard is assigned to a class according to previously calculated frequency and damage values. The selection of the frequency scale, as well as that of damage, is left to the safety analyst. He should attribute an alpha-numeric code to each hazard identified (Table 4), place it on the risk matrix, and establish whether the risk is “acceptable”, “tolerable”, or “not tolerable”.
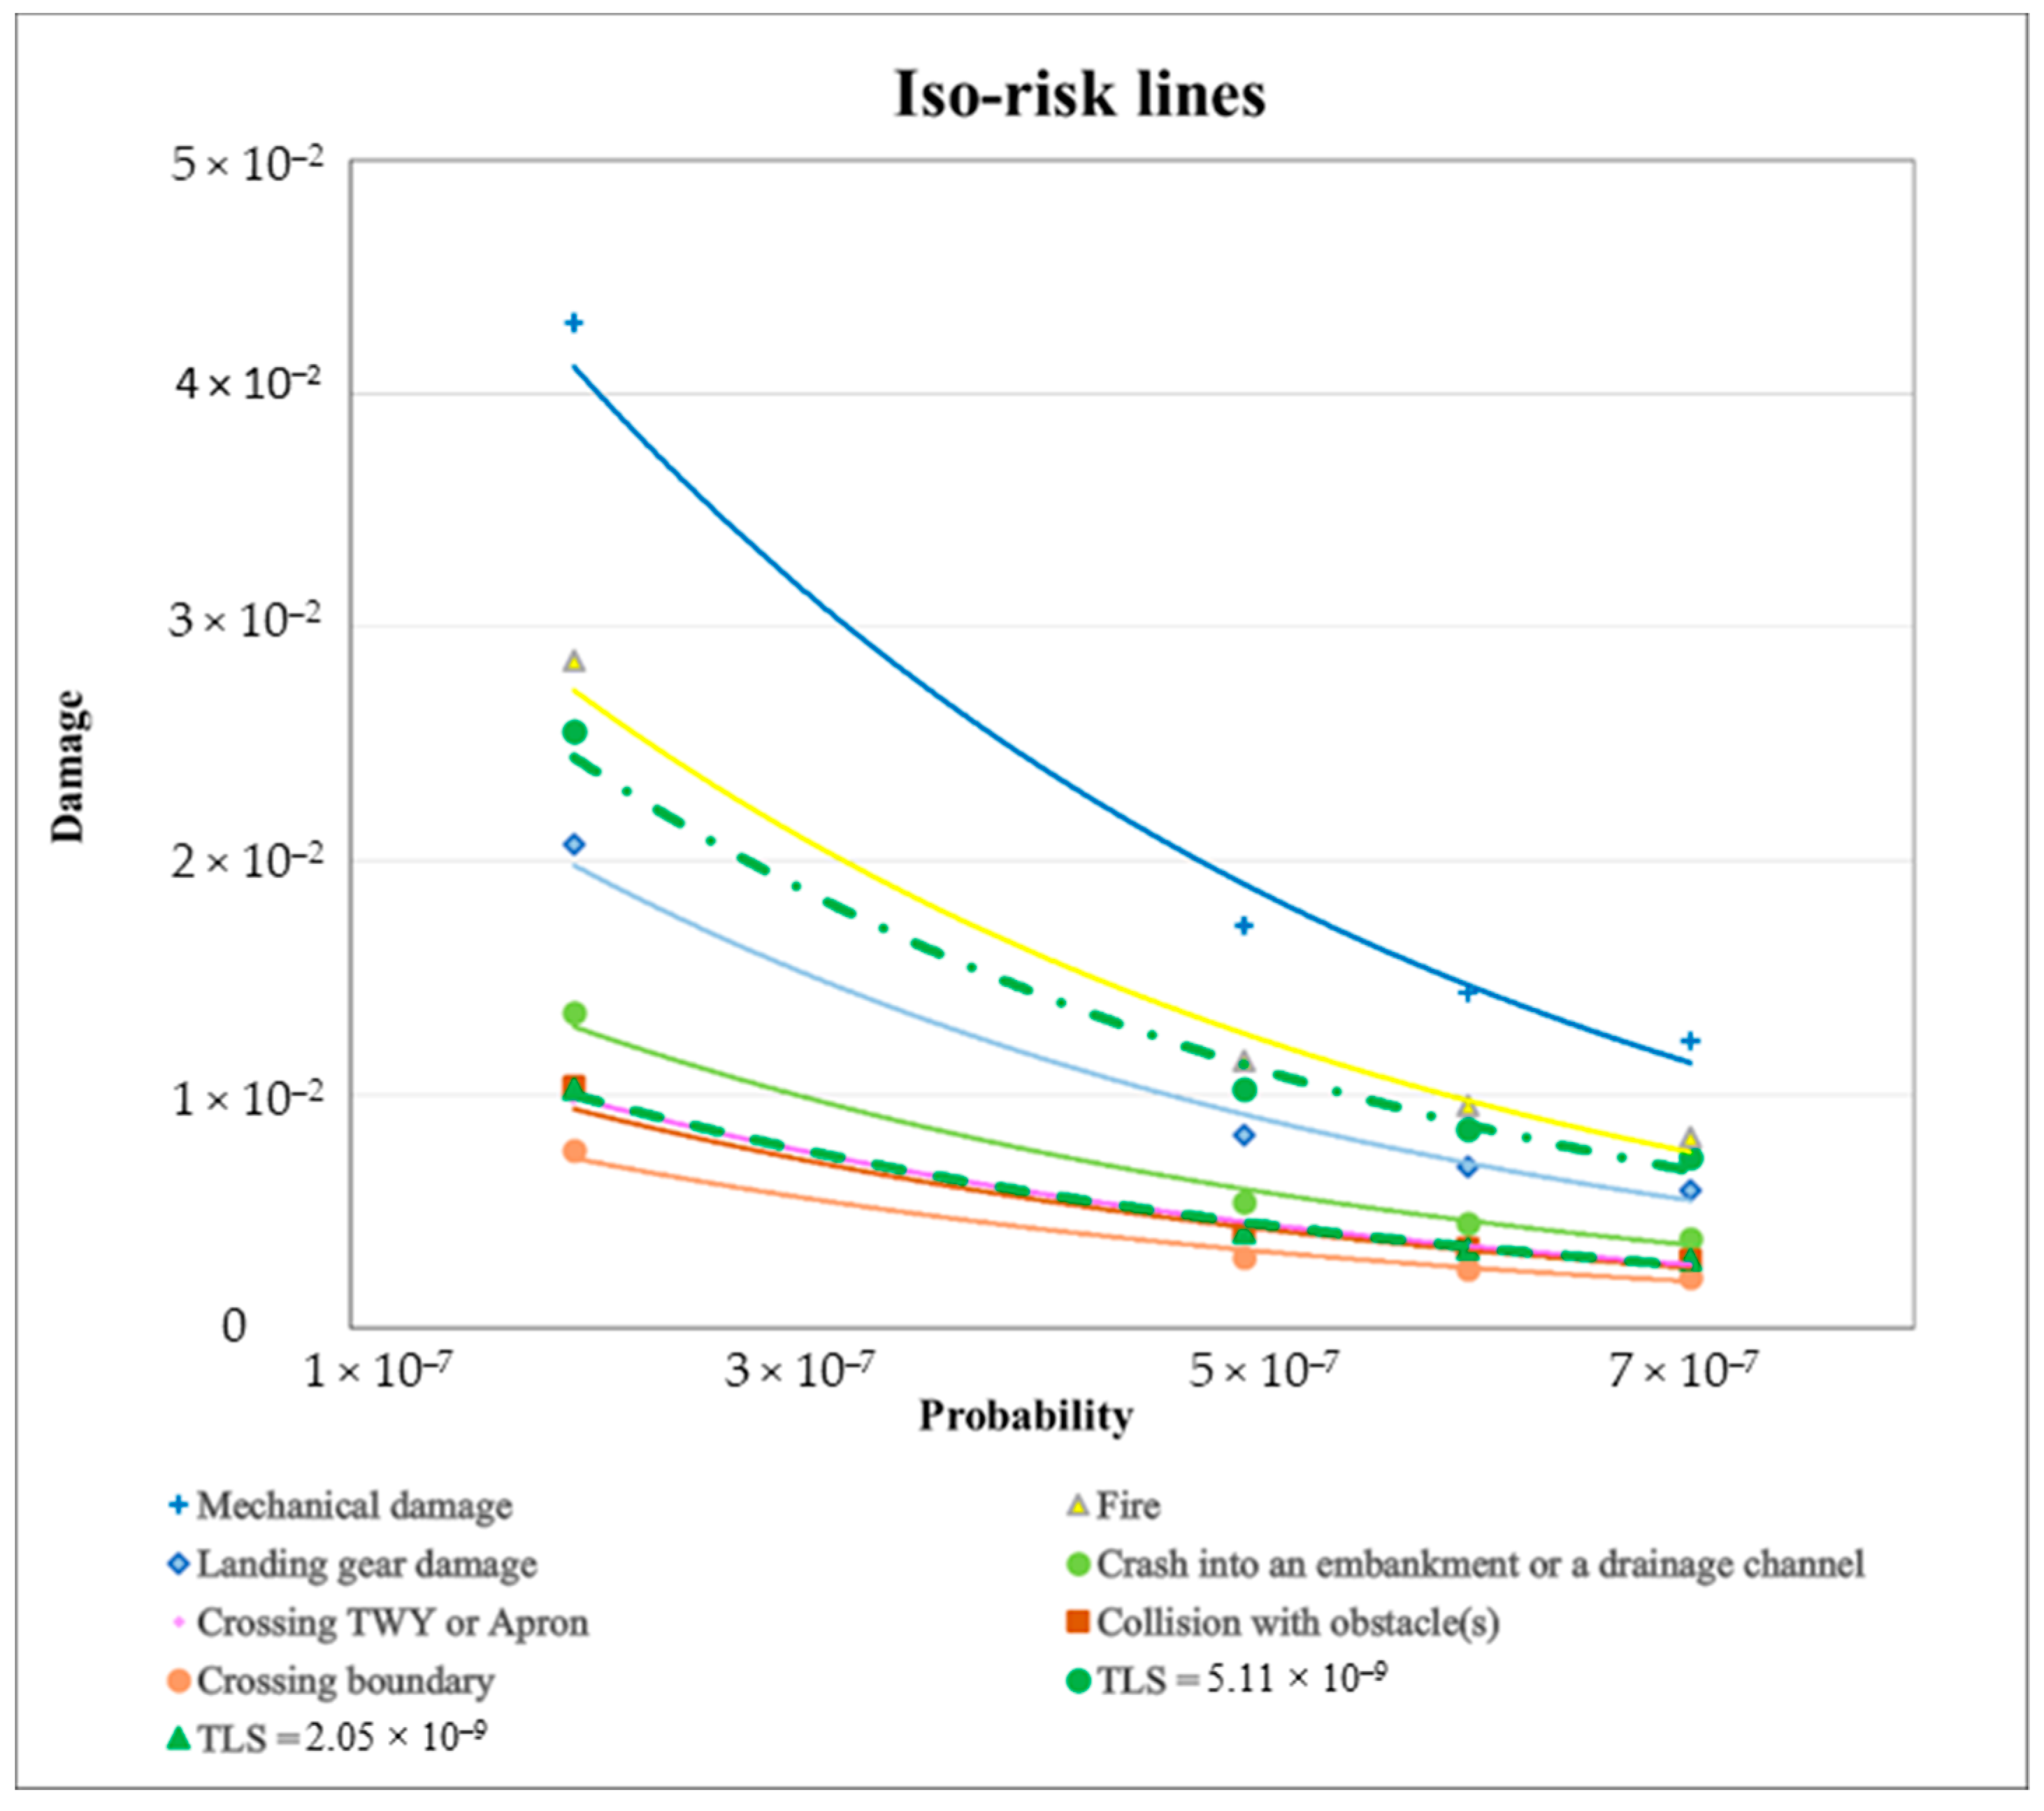
Furthermore, the risk matrix and the acceptability criteria are an analytical tool to define the Target Level of Safety (TLS), a measure of the level of safety that should be guaranteed in a given context. Therefore, in order to manage all “intolerable” risks of veer-offs, it is necessary to reduce the risk associated to aircraft fire and mechanical damage of engines, acting on both occurrence probability and damage severity. This implies that TLS is assumed equal to 5.11 × 10⁻⁹ and mitigation interventions need to achieve D equal to 5%: under such conditions, these risks are under a “tolerable” level (i.e., one veer-off incident for every 200 million movements).
On the other hand, to manage “tolerable” risks considered acceptable only based on risk mitigation, we should adopt more strict measures that allow us to achieve a TLS equal to 2.05 × 10⁻⁹, i.e., among the dangers identified, the overall risk result is “acceptable” if the accident can occur once every 500 million movements.
Based on the obtained results, the risk associated with the single identified consequences can be represented by iso-risk curves (Figure 1), i.e., curves that connect all the points with the same risk value. In Figure 1, the curve of TLS (i.e., 5.11 × 10⁻⁹) represents the tolerability limit beyond which the risk appears “intolerable”; on the other hand, TLS equal to 2.05 × 10⁻⁹ represents a tolerance limit below which risks are “acceptable”.
Once the TLS has been defined, it is possible to compare it with the overall current risk level deriving from the consequences model of the veer-off accident defined as Real Level of Safety (RLS) according to Equation (11):
RLS = p v e e r - o f f × D average = 1.02 × 10 7 × D j · p e v e n t , j p e v e n t , j
RLS equal to 1.85 × 10⁻⁸ represents the maximum risk allowed for a veer-off accident: it is associated to D equal to 18% (i.e., damage severity classified as Major). Therefore, to reduce the risk and to reach a tolerable or acceptable level of safety, it is necessary to undertake a series of actions. Identified hazards should be managed to avoid conditions of catastrophic severity and to satisfy the proposed TLS.
The presented methods and models were adopted to assess the veer-off risk and compare it to RLS and TLS in order to identify the hazards connected to the event and use risk matrix and risk acceptability criteria introduced by ICAO Safety Management Manual [19]. Given primary data provided by an airport operator, the methodology has been implemented in a case study to manage the damage risk.

Primary Data

Airport local conditions were considered to assess the risk of veer-off accident: primary data provided by the aerodrome operator refer to 2019 and concern the following aspects:
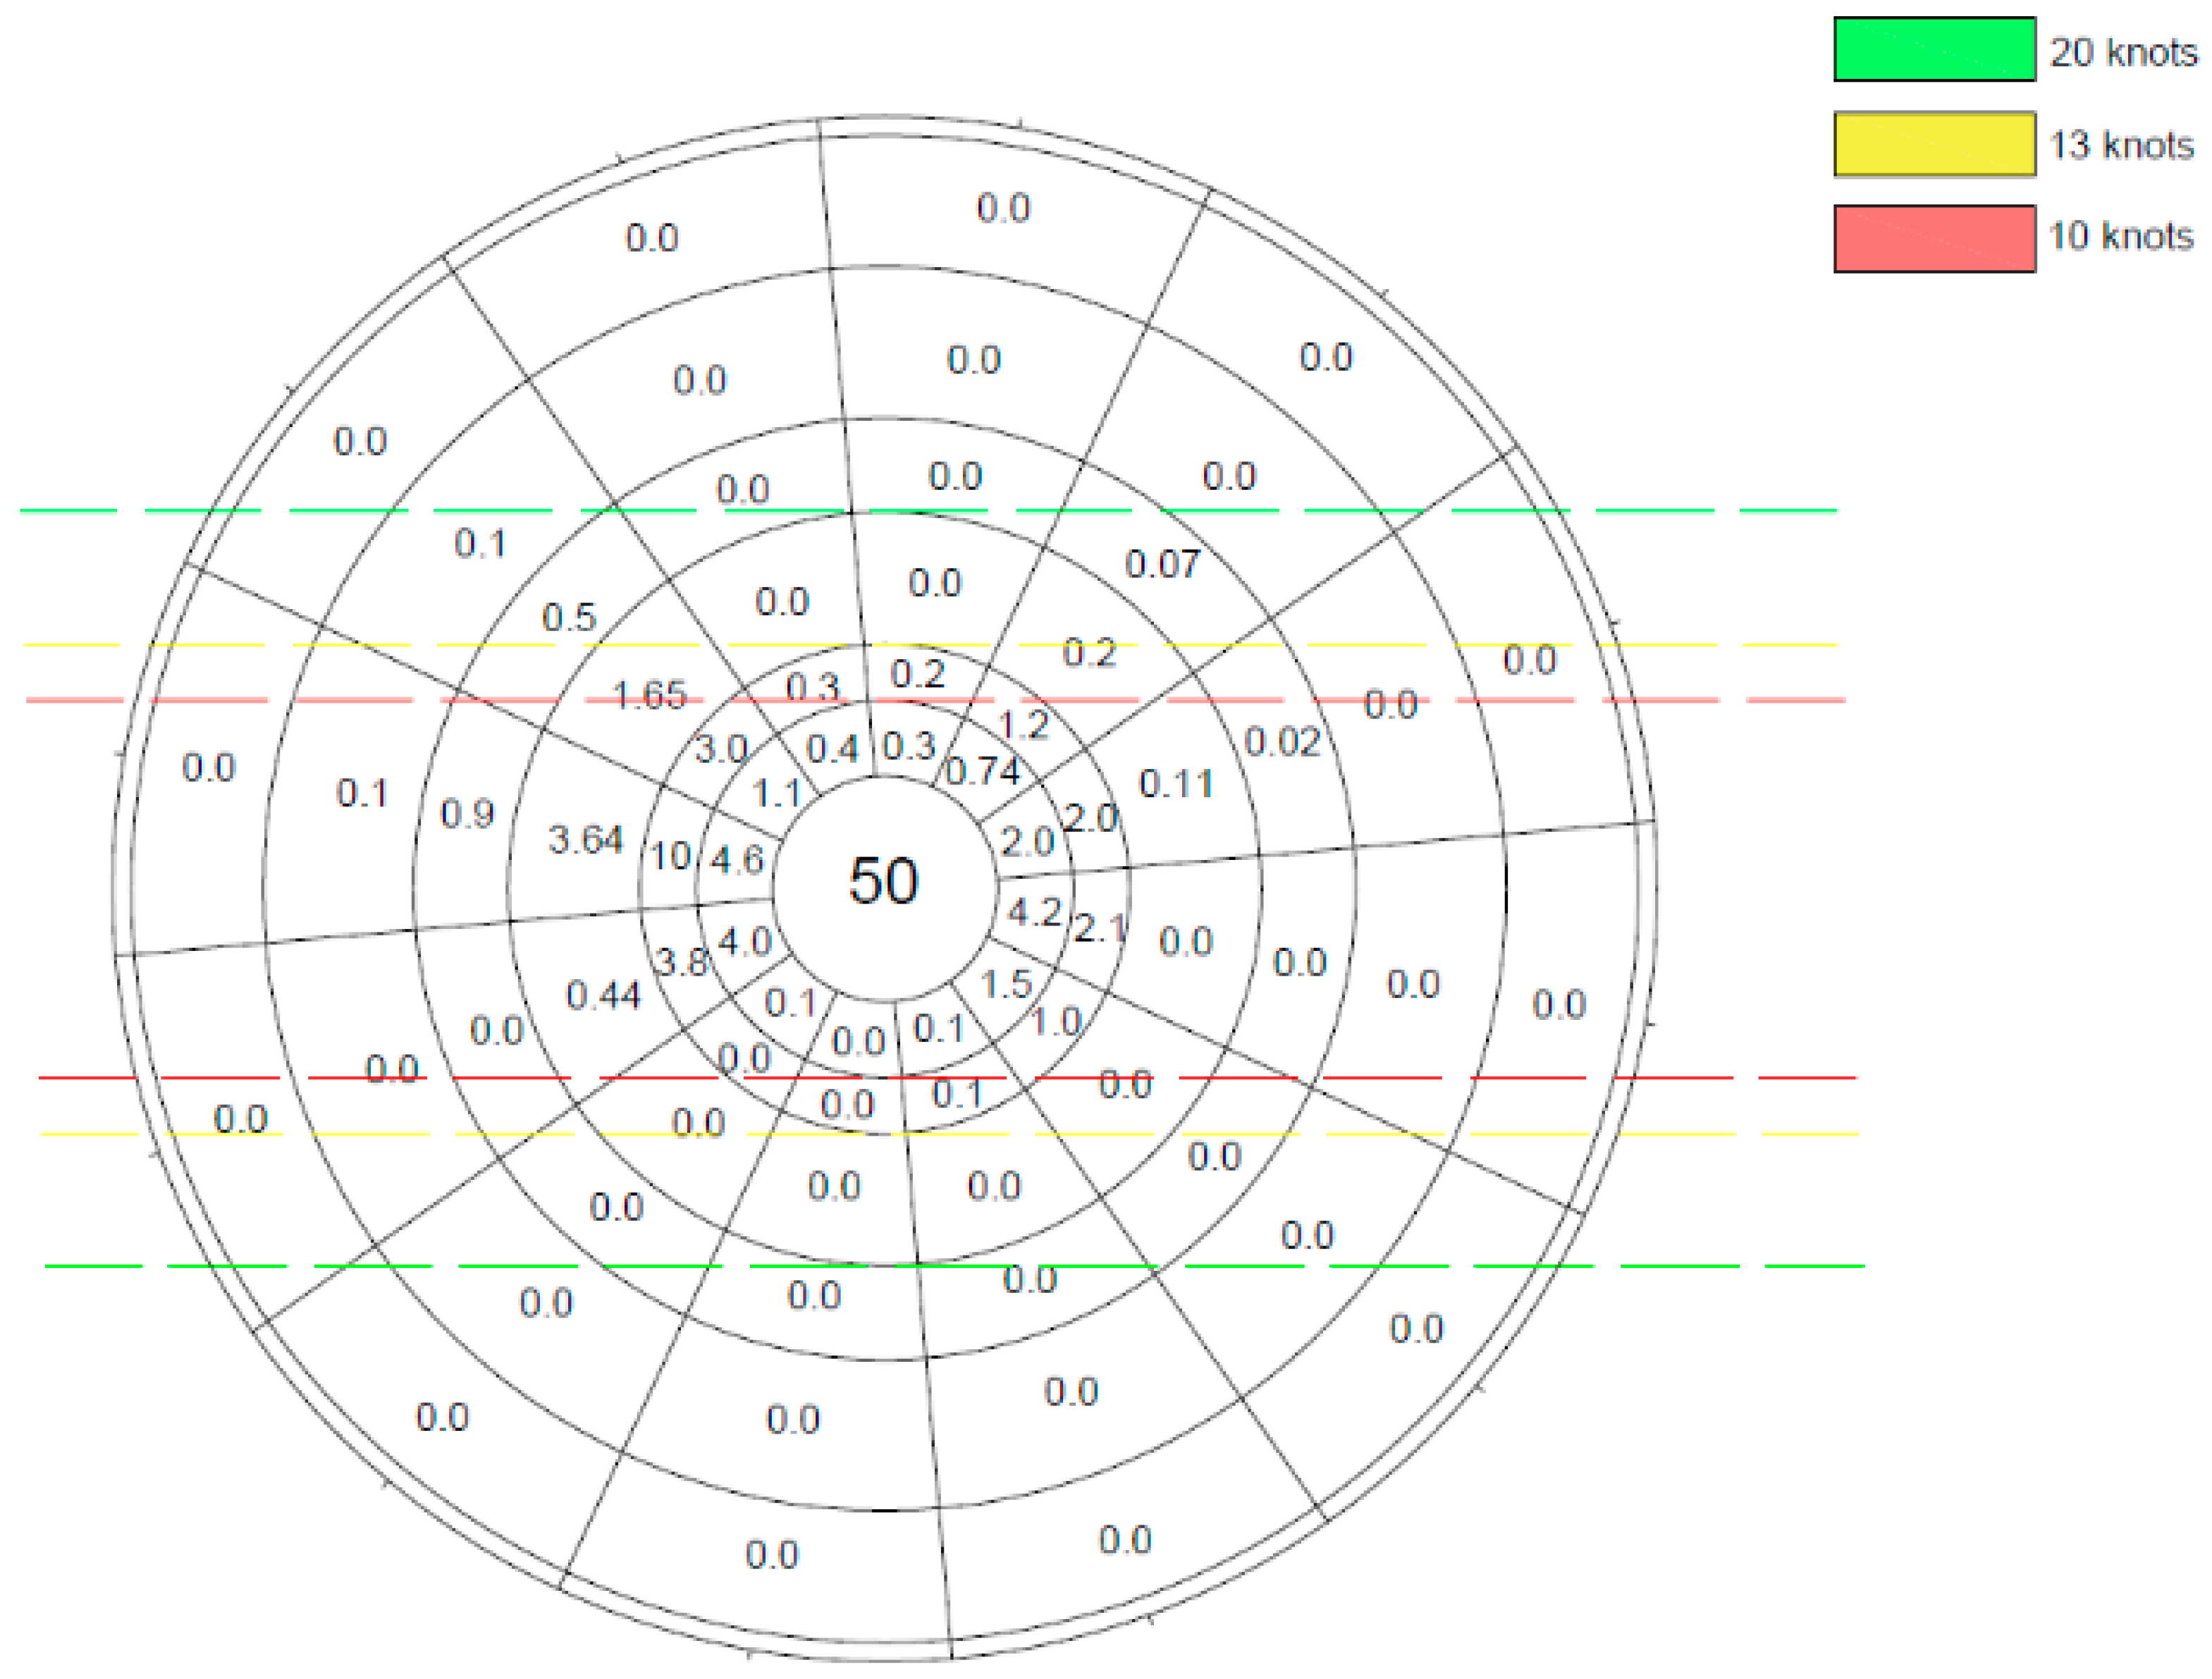
  • Wind: Hourly observations of wind direction and speed, for a total of 144,579 h, permit to calculate the usability factor of the aerodrome through the graphic method of the wind rose [33] and to identify the prevailing direction of crosswind that is one of the main environmental factors that contribute to veer-off;
  • Traffic composition: This information includes the number of movements per ICAO category [6] and MTOW of each aircraft;
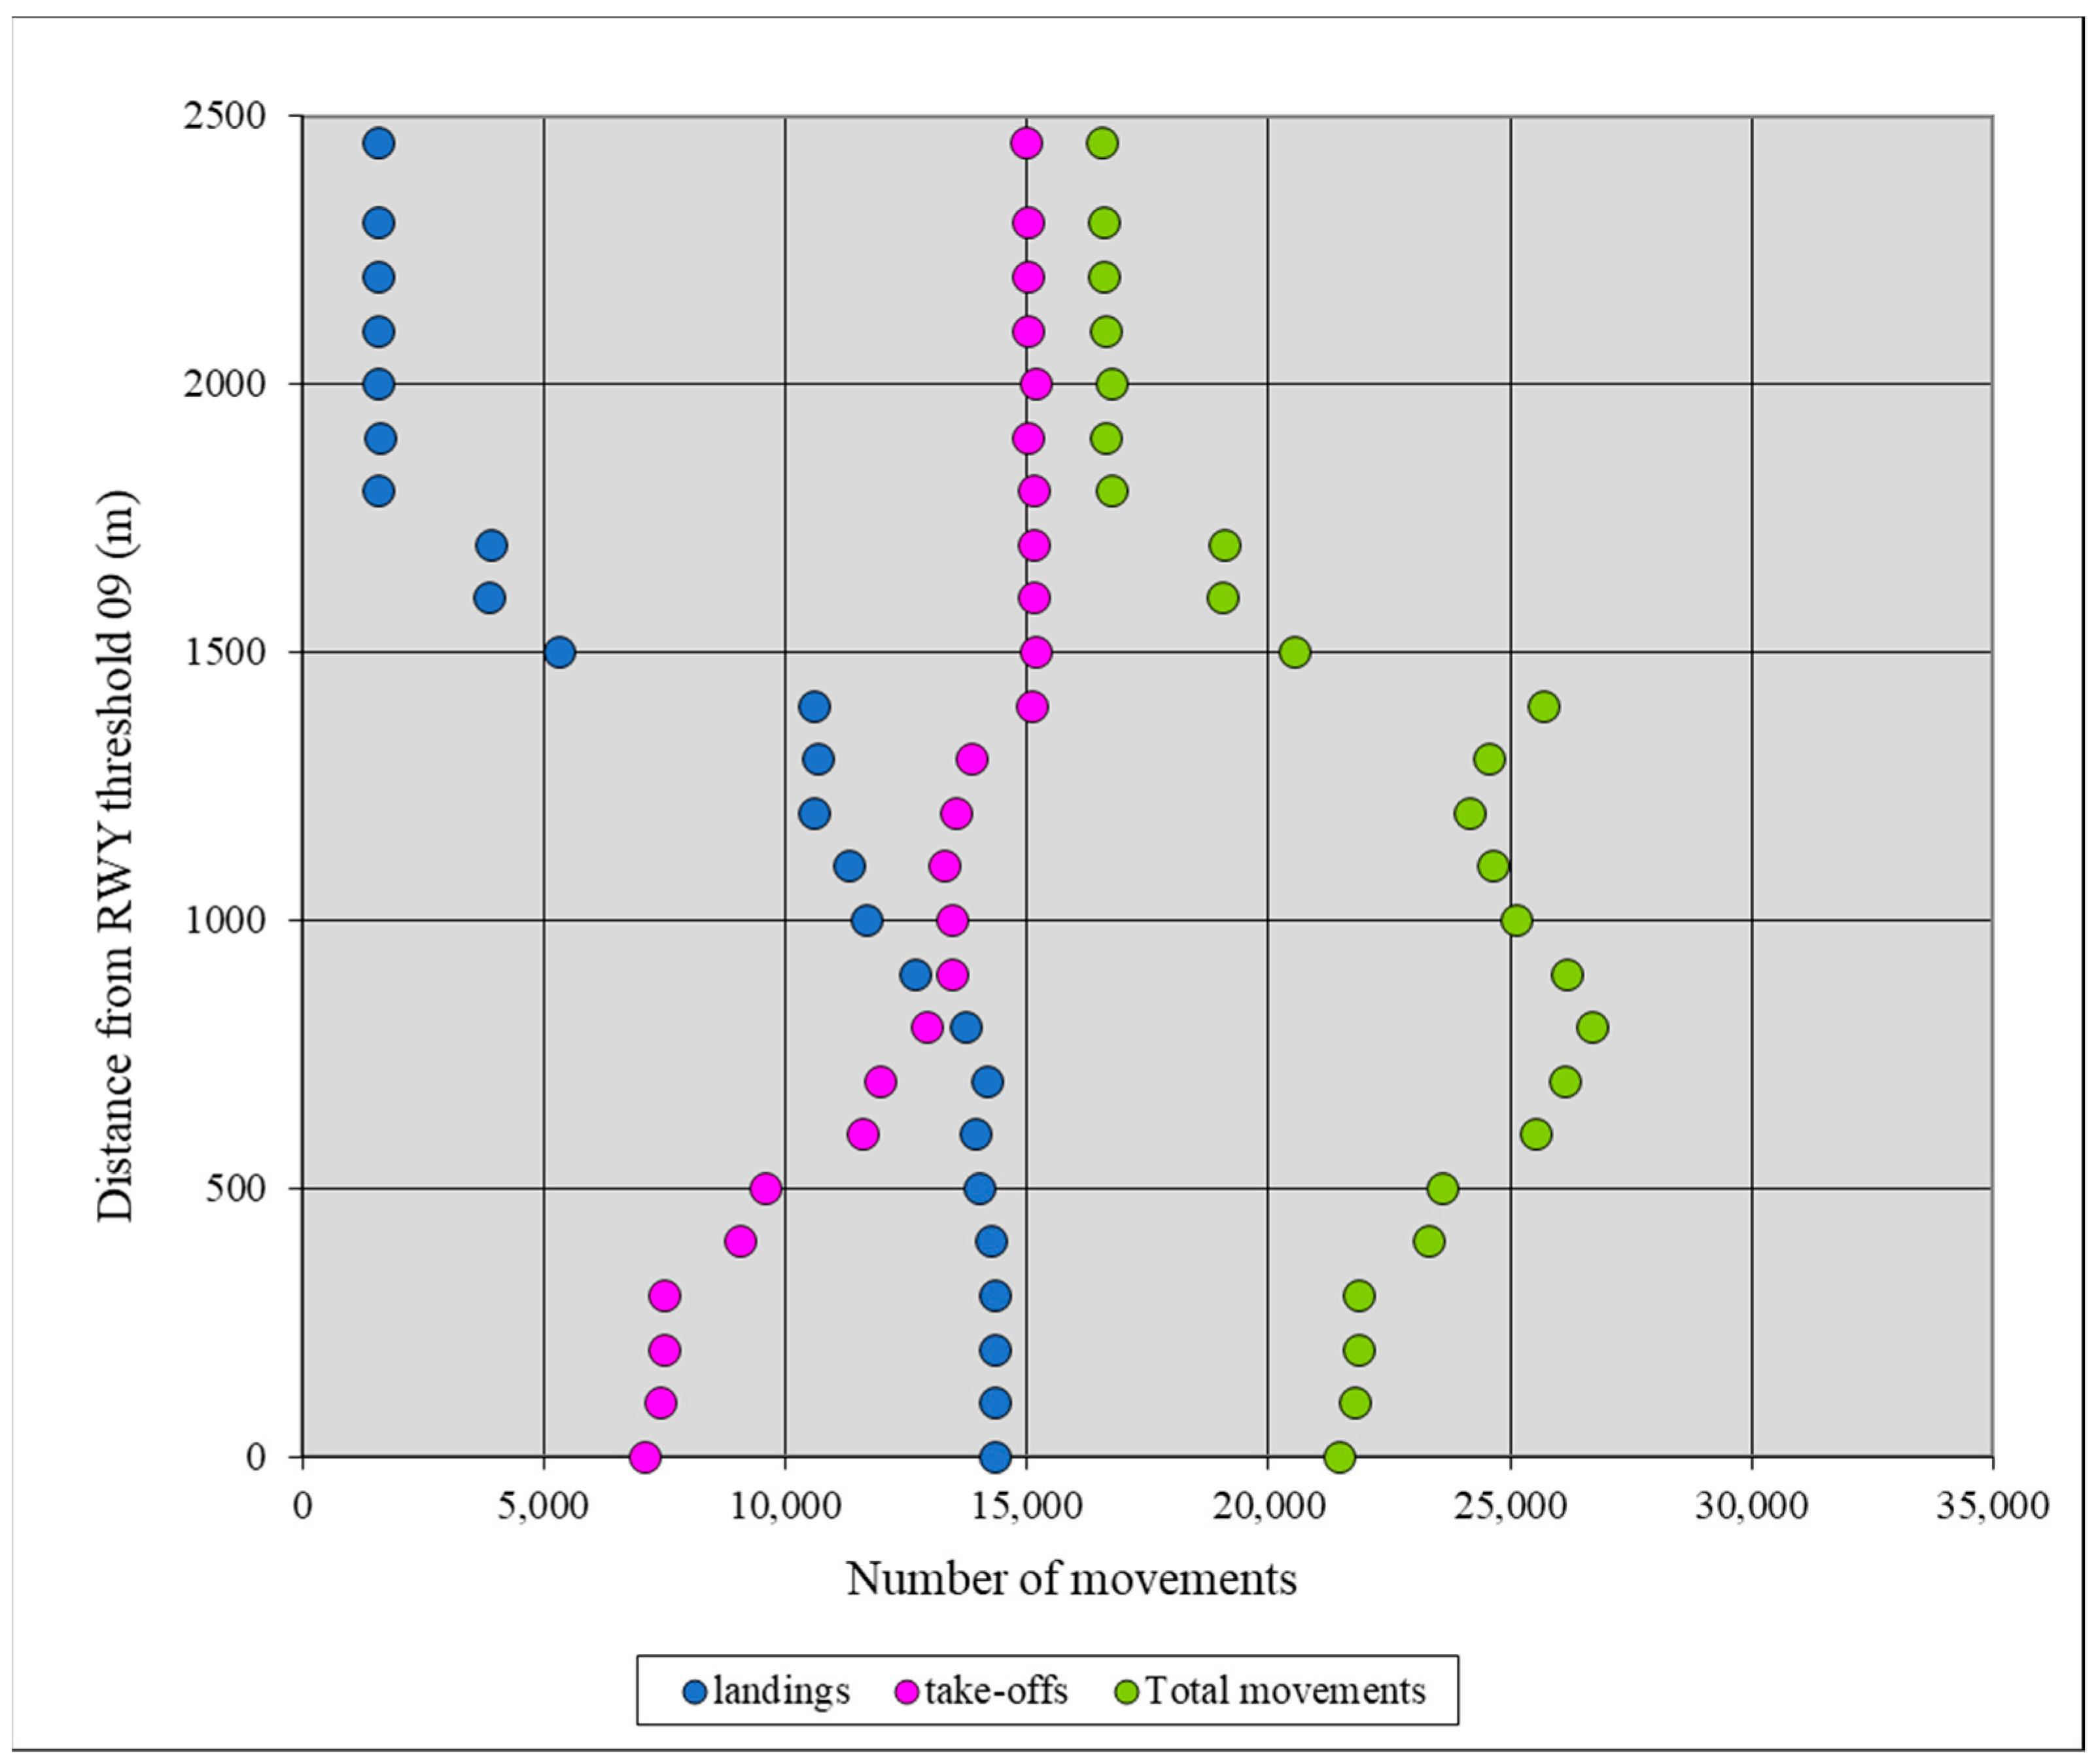
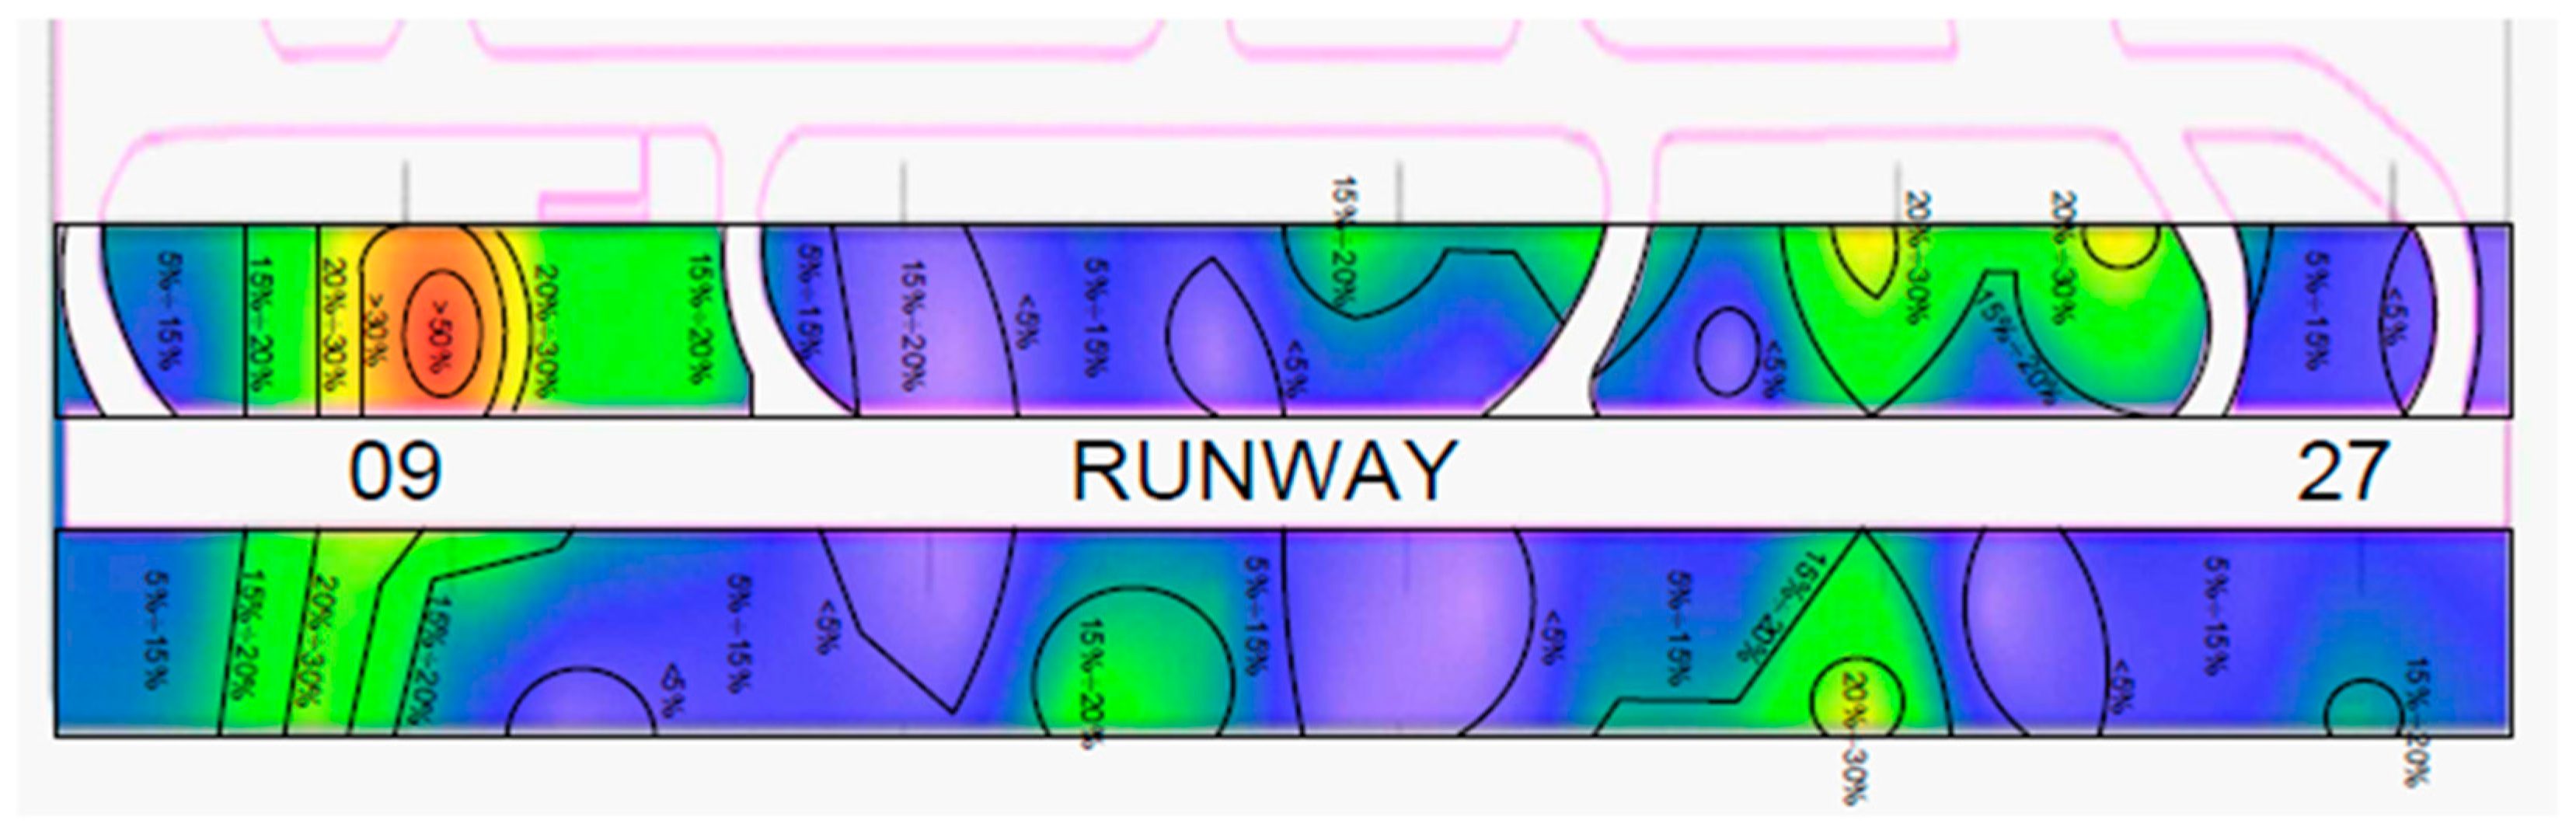
  • Runway usage for take-off and landing operations: This information combined with traffic composition led to identify which points of the runway are most affected by aircraft movements and veer-off risk.
  • Presence of buildings inside the airport grounds: The equipment, the control tower, and the hangars can increase the risk of damage suffered by an aircraft diverted from the runway.
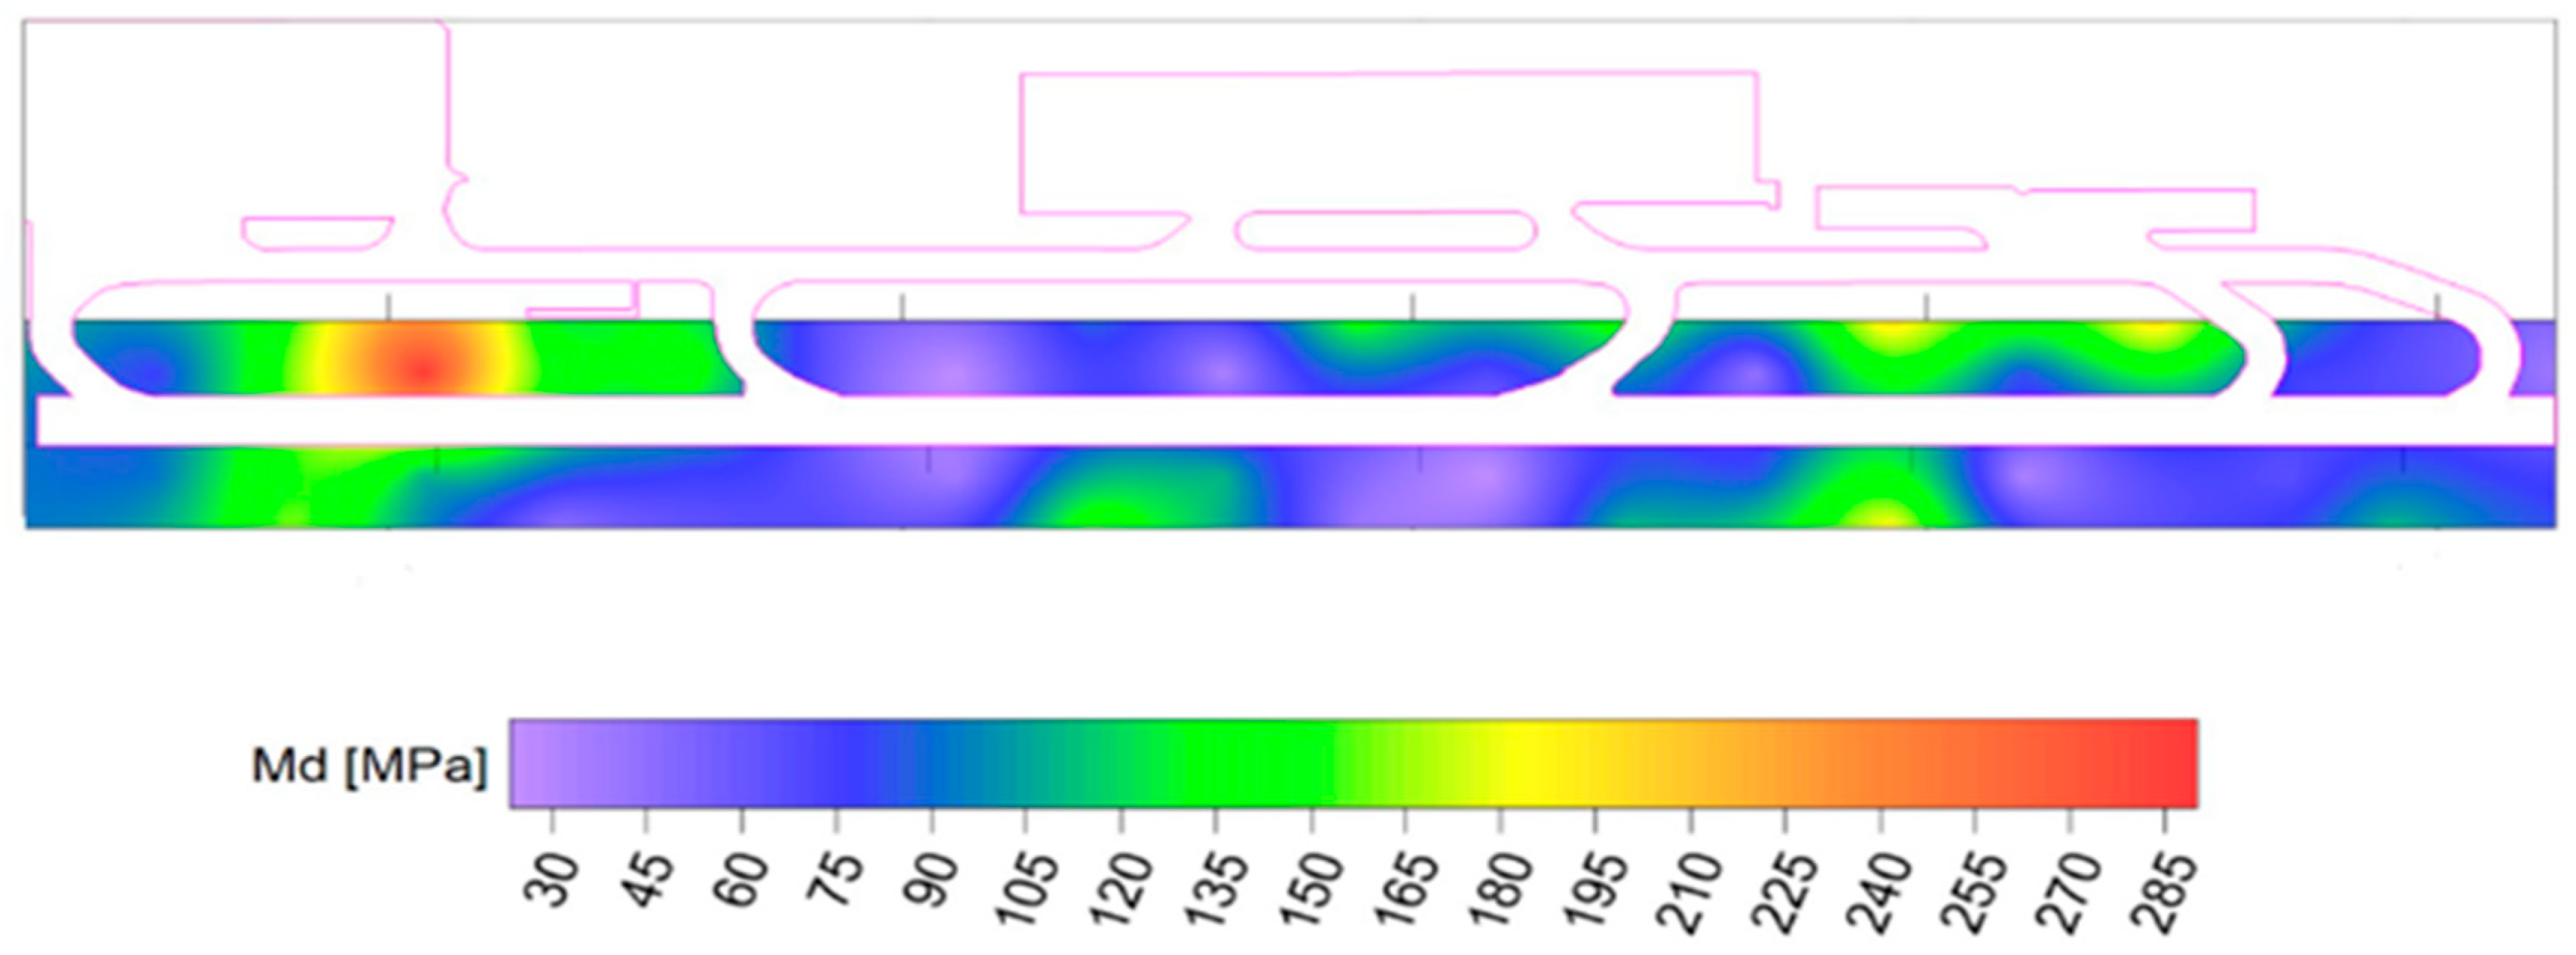
  • Geotechnical characteristics of the strip areas: These data contribute to calibrate the damage model and propose the damage matrix according to Moretti et al. [18]. Therefore, human health, mechanical consequences for the aircraft, and subgrade bearing capacity were considered [34].
Ultimately, wind conditions, traffic composition and runway use affect the probability of occurrence of the veer-off accident; while presence of buildings and subgrade bearing capacity affect the expected damage. The processing of all these data allows specializing the risk assessment of the veer-off accident defined in general terms in a risk assessment associated to the examined airport.

3. Case Study

The implementation of this methodology concerns a case study: an international airport equipped by a single runway: RWY 09/27 (Figure 2). This runway is bidirectional: 90% of take-offs take place from threshold 27 (and 10% from threshold 09); 90% of landings take place from threshold 09 (and 10% from threshold 27). The runway is 2450 m long, 45 m wide with stabilized runway shoulders on both sides of the runway extending an additional 15 m outward from the runway edge. There is a parallel taxiway running the full length of the runway. The runway strip is a rectangular area measuring 2570 × 300 m and it is surrounding the runway. The strips are free of obstacles, except for frangible objects. Other safety areas comply with the current requirements in [6].
This airport is a medium-sized European airport: it has an average traffic of 2,500,000 passengers/year and more than 30,000 movements/year.

3.1. Wind

The usability factor of an aerodrome represents the percentage of time during which the runway usage is not limited by the crosswind component: it should be not less than 95%. According to [6], landing or take-off of airplanes is precluded when the crosswind component exceeds: 37 km/h (20 kts), 24 km/h (13 kts), 19 km/h (10 kts) in the case of airplanes whose reference field length is 1500 m or over; 1200 m or up to but not including 1500 m or less than 1200 m, respectively. According to the wind rose in Figure 3, Table 5 lists the usability factor results and confirms the correct orientation of the runway. Table 6 lists crosswind components greater than 95%. Subsequently, the direction in which this transverse wind predominantly blows has been evaluated: there is a prevalence in the N direction compared to the S direction (Table 7).
Table 5 and Table 6 demonstrate that a crosswind can increase the occurrence probability of the veer-off accident in the South runway safety area. Therefore, a coefficient of 1.026 for the strip area located at S of the runway has been assumed: it derives from the highest frequency of N crosswind that avoid movements (i.e., 2.6%).

3.2. Traffic Composition and Runway Usage

Given the traffic composition, the largest number of movements relates to aircraft belonging to the ICAO C category (Table 8); movements of only 5 aircraft models cover more than half of the total movements (Table 9).
In order to determine the runway usage percentages, the authors calculated the take-off and landing field length of each airplane model (Table 10 and Table 11, respectively): the runway usage was defined as the ratio between the number of movements of each aircraft and the total number of movements. The last column of Table 10 and Table 11 gives the cumulative percentage of aircraft exceeding the distance x indicated in the first column.
As mentioned above, the runway has a bidirectional usage: Figure 4 shows the distribution of the movements along the runway, where the y-axis represents the distance from threshold 09 (i.e., threshold 27 is at 2450 m); the x-axis represents the number of yearly movements. Therefore, each point in Figure 5 indicates how many movements (landings, take-offs, and total movements) have been recorded at a certain distance from threshold 09.
Data in Figure 4 highlight the probability that veer-off will be greater within the first 1500 m of runway 09 rather than in the remainder.
So, it is possible to combine the results obtained from Table 10 and Table 11 with the distribution of the movements along the runway shown in Figure 5, and to obtain corrective coefficients to apply to Equation (6). Table 12 lists these coefficients:

3.3. Buildings Nearby the Runway

In the examined airport, all the buildings are in the landside apart from the airside, in the North-North-West area concerning the runway; the aviation fuel depots are in the South-South-East direction, near the fencing of the airport grounds and the fire station. The buildings located near the runway do not constitute a full-blown danger for the diverted aircraft and do not increase the severity of the damage associated with aircraft veer-off.

3.4. Soil Bearing Capacity

Plate load tests were carried out by airport management body to define the geotechnical performances of the strip by the deformation module (Md), defined as the ratio of the pressure transmitted from the plate to the soil and the corresponding settlement. The results expressed through the planimetric distribution of the deformation module (Md) are shown in Figure 5.
According to [35], a minimum CBR (Californian Bearing Ratio) value between 15% and 20% reduces the sinking of the aircraft wheel into the ground, thus reducing the risk of collapse of the nose gear. CBR is a conventional index expressed by the percentage ratio between the loads producing a defined penetration of a piston in the tested soil and a reference Californian soil. Furthermore, the same Guidelines require, in the event that an aircraft leaves the runway, that the ground ensure adequate support for the aircraft. For this purpose, CBR values have been calculated for the NW and SE strip sides according to Equation (12) [36]:
CBR [%] = 0.20 × Md
Having regard to [35], the results show non-compliances in many areas of the strip where the CBR value is lower than the minimum required of 15 ÷ 20% (Figure 6).
The severity of the damage is the measure of how negative the effects of the event are: based on it and the analysis of the investigation reports, a correlation between the geotechnical characteristics of the subsoil and the corresponding damage reported by a diverting aircraft was defined (Table 13).
Given Table 13, a new categorization of damage severity has been adopted to consider geotechnical performance of strip, mechanical consequences on the airplane and effects on people (Table 14):
Given the probability of occurrence, the severity of the damage, and having regard to a Cartesian reference system with the y-axis coinciding with the runway axis and the x-axis orthogonal to it placed on the edge of runway 09, the authors calculated 1300 risk values around the runway, distributed over 13 alignments parallel to the runway axis. The average risk value of this airport is 5.49 × 10⁻⁹, lower than RLS; however, the risk distribution within the strip (Figure 7) is crucial. The risk values in red boxes exceed RLS. On the other hand, the risk values in the orange boxes exceed TLS; in green boxes the risk values that satisfy TLS. Finally, risks of less than 10−9 are considered low (white boxes). Figure 7 shows that at 150 m away from the axis of the runway, the risk for the veered-off aircraft to exceed the edge of the strip remains at widely tolerable levels. The same occurs if the width of the strip is reduced to 140 m, as foreseen in the latest edition of [6]. On the contrary, the requirements of subgrade bearing capacity are not respected in many areas of the strip: in these areas, actions to enhance the airport strips’ bearing capacity will be necessary, such as improvement of soil or stabilization.

4. Conclusions

The most significant source of accidents in the world of aviation is due to events that occur near the runway: runway excursions (i.e., veer-offs and overruns) represent the main risk of runway safety. Through the Global Aviation Safety Plan, ICAO pursues the objective of reducing the number of accidents worldwide both in absolute value and in terms of rate. Airport compliance with requirements of SARPs contributes to guarantee adequate levels of safety in the performance of aircraft operations; however, many airports are unable to guarantee it. Therefore, SARPs allow deviations from prescriptions if these are accompanied by quantitative risk assessments.
This study focused on the development of a methodology that can define objectively the target level of safety to achieve within veer-off accidents. The methodology allows airport operators to carry out a rigorous risk assessment about the infrastructural requirements to guarantee, so that airport operations can be safely carried out. This methodology has also been applied to an international airport which presented variable bearing capacity of the runway strip. In this way, it was possible to relate the risk assessment associated with the veer-off event with those infrastructural requirements whose purpose is to reduce the risk of damage associated with the diversion of the aircraft within the airport. The results showed an average risk value equal to 5.49 × 10⁻⁹ within the strip, able to satisfy the reference TLS for a risk considered tolerable. However, the risk calculation of 1300 points inside the strip permitted to observe the real level of risk associated with the event: in many cases, the calculated risk exceeds the maximum level of allowed risk and requires the adoption of countermeasures (e.g., alternative design, procedural or technical solutions). The methodology presented by the authors can be a valid tool for aerodrome operators to manage deviations registered in airport infrastructures and to obtain the Airport Certification from the competent aeronautical Authority.

Author Contributions

Conceptualization, P.D.M., L.M., R.F. and M.C.; methodology, M.C.; software, M.C.; validation, L.M. and M.C.; formal analysis, P.D.M., L.M. and M.C.; investigation, M.C.; data curation, P.D.M. and M.C.; writing—original draft preparation, M.C.; review and editing, P.D.M., M.C., R.F. and L.M.; supervision, P.D.M. All authors have read and agreed to the published version of the manuscript.

Funding

This research received no external funding.

Conflicts of Interest

The authors declare no conflict of interest.

References

  1. ICAO. International Civil Aviation Organization. Annual Safety Report 2019. Available online: https://www.icao.int/safety/Documents/ICAO_SR_2019_29082019.pdf (accessed on 9 October 2020).
  2. ICAO. International Civil Aviation Organization. Global Aviation Safety Plan 2020–2022. Available online: https://www.icao.int/Meetings/anconf13/Documents/Doc_10004_GASP_2020_2022_Edition.pdf (accessed on 9 October 2020).
  3. De Couto, B. Implementation support officer safety, air navigation bureau at ICAO. 2018. Available online: www.futureairport.com (accessed on 9 October 2020).
  4. IATA. International Air Transport Association. Safety Report 2019. Available online: https://www.iata.org/en/publications/safety-report/ (accessed on 9 October 2020).
  5. Boeing. Statistical Summary of Commercial Jet Airplane Accidents-Worldwide Operations 1999–2018. Available online: http://www.boeing.com/resources/boeingdotcom/company/about_bca/pdf/statsum.pdf (accessed on 9 October 2020).
  6. ICAO. International Civil Aviation Organization. Annex 14—Aerodromes, Volume I Aerodrome Design and Operations, 8th ed.; International Civil Aviation Organization (ICAO): Montreal, QC, Canada, 2018. [Google Scholar]
  7. Cacciabue, C.; Oddone, I.; Rizzolo, I. Sicurezza nel Trasporto Aereo, 2nd ed.; Springer: Berlin/Heidelberg, Germany, 2019; ISBN 9788847039889. [Google Scholar]
  8. Norwegian Civil Aviation Authority. Final Report on the Risk Analysis in Support of Aerodrome Design Rules. 2001. Available online: https://aci.aero/Media/c0640b44-fa65-4cab-b2b0-6c4d5a97dfa7/About%20ACI/Priorities/Technical%20Issues/Common%20Agreement%20Document%20-%20AACG/AEAT-Risk-Analysis-for-CAA-Norwegian-AACG_pdf (accessed on 9 October 2020).
  9. Eurocontrol Safety Regulatory Requirement. Risk assessment and Mitigation in ATM. 2001. Available online: https://www.eurocontrol.int/publication/esarr-4-risk-assessment-and-mitigation-atm (accessed on 9 October 2020).
  10. Leonardi, S.; Distefano, N. Apriori algorithm for association rules mining in aircraft runway. Civ. Eng. Archit. 2020, 8, 206–217. [Google Scholar]
  11. Galagedera, S.D.B.; Pasindu, H.R.; Adikariwattage, V.V. Analysis of Aircraft Veer off Probability at Runway High Speed Exits. In Proceedings of the 5th International Multidisciplinary Moratuwa Engineering Research Conference, Moratuwa, Sri Lanka, 3–5 July 2019; pp. 527–532. [Google Scholar]
  12. Szabo, S.; Vittek, P.; Kraus, J.; Plos, V.; Lališ, A.; Štumper, M.; Vajdová, I. Probabilistic model for airport runway safety areas. Transp. Probl. 2017, 12, 89–97. [Google Scholar] [CrossRef] [Green Version]
  13. Galagedera, S.D.B.; Pasindu, H.R.; Adikariwattage, V.V. Evaluation of Operational Risk Factors at Runway High Speed Exits. Transp. Res. Procedia 2020, 48, 32–46. [Google Scholar] [CrossRef]
  14. Calle-Alonso, F.; Pérez, C.J.; Ayra, E.S. A Bayesian-Network-based Approach to Risk Analysis in Runway Excursions. J. Navig. 2019, 72, 1121–1139. [Google Scholar] [CrossRef]
  15. Wei, Y.Z.; Chong, X.L.; Liu, W.; Guo, S.F.; Guo, L.G. Risk Assessment of Separation between Runway and Taxiway Not Meeting Standard during Take-off. IOP Conf. Ser. Earth Environ. Sci. 2018, 153, 0320132018. [Google Scholar] [CrossRef]
  16. Moretti, L.; Cantisani, G.; Di Mascio, P.; Nichele, S. A runway veer-off risk assessment based on frequency model: Part I. probability analysis. In Proceedings of the International Congress on Transport Infrastructure and Systems, Rome, Italy, 10–12 April 2017. [Google Scholar]
  17. Moretti, L.; Di Mascio, P.; Nichele, S.; Cokorilo, O. Runway veer-off accidents: Quantitative risk assessment and risk reduction measures. Saf. Sci. 2018, 104, 157–163. [Google Scholar] [CrossRef]
  18. Moretti, L.; Cantisani, G.; Di Mascio, P.; Nichele, S. A runway veer-off risk assessment based on frequency model: Part II. risk analysis. In Proceedings of the International Congress on Transport Infrastructure and Systems, Rome, Italy, 10–12 April 2017. [Google Scholar]
  19. ICAO. International Civil Aviation Organization. Doc 9859 Safety Management Manual. Available online: https://www.skybrary.aero/index.php/ICAO_Safety_Management_Manual_Doc_9859 (accessed on 9 October 2020).
  20. Xinguo, L.; Fulton, N.; Westcott, M. Target Level of Safety Measures in Air Transportation—Review, Validation and Recommendations. In Proceedings of the IASTED International Conference Modelling, Simulation, and Identification (MSI 2009), Beijing, China, 12–14 October 2009. [Google Scholar]
  21. FAA. Federal Aviation Administration. FAA Airports (ARP) Safety Management System (SMS). Available online: https://www.faa.gov/documentlibrary/media/order/order_5200_11_arp_sms.pdf (accessed on 9 October 2020).
  22. ACRP. Airport Cooperative Research Program. Risk Assessment Method to Support Modification of Airfield Separation Standards. 2011. Available online: https://www.icao.int/SAM/Documents/2011/AGAASEROSTUDIES/ACRP_rpt_051.pdf (accessed on 9 October 2020).
  23. Attaccalite, L.; Di Mascio, P.; Loprencipe, L.; Pandolfi, C. Risk Assessment around Airport. Procedia Soc. Behav. Sci. 2012, 53, 852–861. [Google Scholar] [CrossRef] [Green Version]
  24. Di Mascio, P.; Loprencipe, G. Risk analysis in the surrounding areas of one-runway airports: A methodology to preliminary calculus of PSZs dimensions. ARPN J. Eng. Appl. Sci. 2016, 11, 13641–13649. [Google Scholar]
  25. Di Mascio, P.; Perta, G.; Cantisani, G.; Loprencipe, G. The Public Safety Zones around Small and Medium Airports. Aerospace 2018, 5, 46. [Google Scholar] [CrossRef] [Green Version]
  26. ACRP. Airport Cooperative Research Program. Analysis of Aircraft Overruns and Undershoots for Runway Safety Areas. 2008. Available online: https://www.icao.int/SAM/Documents/2011/AGAASEROSTUDIES/ACRP_rpt_003.pdf (accessed on 9 October 2020).
  27. Scozzafava, R. Primi Passi in Probabilità e Statistica; Zanichelli Editore: Bologna, Italy, 1995. [Google Scholar]
  28. ENAC. Integrazione del Safety Management System nel Sistema di Gestione Dell’organizzazione; Ente Nazionale Aviazione Civile: Rome, Italy, 2013. [Google Scholar]
  29. National Transportation Safety Board. 2019. Available online: https://www.ntsb.gov/Pages/default.aspx (accessed on 9 October 2020).
  30. Australian Transport Safety Bureau. 2019. Available online: www.atsb.gov.au (accessed on 9 October 2020).
  31. Centro de Investigação e Prevenção de Acidentes Aeronáuticos. 2019. Available online: www2.fab.mil.br/cenipa/ (accessed on 9 October 2020).
  32. Agenzia Nazionale per la Sicurezza del Volo. 2019. Available online: https://ansv.it/ (accessed on 9 October 2020).
  33. Bellasio, R. Analysis of wind data for airport runway design. JAIRM J. Airl. Airpt. Manag. 2014, 4, 97–116. [Google Scholar] [CrossRef]
  34. Moretti, L.; Cantisani, G.; Caro, S. Airport veer-off risk assessment: An Italian case study. ARPN J. Eng. Appl. Sci. 2017, 12, 900–912. [Google Scholar]
  35. ENAC. Linee Guida per L’adeguamento Delle Strip Aeroportuali; Ente Nazionale Aviazione civile: Rome, Italy, 2007. [Google Scholar]
  36. Ferrari, P.; Giannini, F. Ingegneria Stradale, Corpo Stradale e Pavimentazioni—Vol. II; ISEDI: Torino, Italy, 1992. [Google Scholar]
Figure 1. Iso-risk for each consequence.
Sustainability 12 09360 g001
Figure 2. Airport plan.
Sustainability 12 09360 g002
Figure 3. Wind rose of the airport.
Sustainability 12 09360 g003
Figure 4. Number of yearly movements along the runway.
Sustainability 12 09360 g004
Figure 5. Distribution of Md (deformation module) in the runway strip.
Sustainability 12 09360 g005
Figure 6. CBR (Californian Bearing Ratio) level curves.
Sustainability 12 09360 g006
Figure 7. Risk assessment of runway veer-off in runway strip. Note: Red boxes refer to a risk > RLS (Real Level of Safety); orange boxes refer to a risk > TLS (Target Level of Safety); green boxes refer to a risk < TLS; white boxes refer to a risk < 10 × 10−9.
Sustainability 12 09360 g007
Table 1. Level of risk for each hazard.
HazardLevel of Risk
Crossing of airfield perimeter fence1.52 × 10−9
Collision with obstacle(s)1.96 × 10⁻⁹
Crossing of taxiway, apron2.07 × 10−9
Crash against an embankment or against a drainage channel2.70 × 10−9
Landing gear damages4.15 × 10−9
Fire5.71 × 10−9
Mechanical damages8.61 × 10−9
Table 2. Safety risk assessment matrix [19].
Risk ProbabilityRisk Severity
CatastrophicAHazardousBMajorCMinorDNegligibleE
Frequent55A5B5C5D5E
Occasional44A4B4C4D4E
Remote33A3B3C3D3E
Improbable22A2B2C2D2E
Extremely Improbable11A1B1C1D1E
Note: red means “Risk not tolerable”, yellow means “Risk tolerable”, green means “Risk acceptable”.
Table 3. Safety risk tolerability matrix.
Tolerability descriptionAssessed Safety Risk IndexCriteria of Acceptability Risk
Not tolerable5A, 5B, 5C, 4A, 4B, 3AProbability and/or severity of the consequences of the event are intolerable. Cease or cut back operation promptly if necessary. Perform priority safety risk mitigation to ensure additional or enhanced preventative controls are in place to bring down the safety risk index to moderate or low.
Tolerable5D, 5E, 4C, 4D, 4E, 3B, 3C, 3D, 2A, 2B, 2C, 1ASchedule performance of a safety risk assessment to bring down the safety risk index to low range if viable. It may require management decision.
Acceptable3E, 2D, 2E, 1B, 1C, 1D, 1ERisks are negligible, or so small that they can be managed by routine procedures and no additional risk treatment are needed.
Note: red means “Risk not tolerable”, yellow means “Risk tolerable”, green means “Risk acceptable”.
Table 4. Alpha-numeric code for each hazard.
HazardAlpha-Numeric Code
Mechanical damages5C
Fire3A
Landing gear damages4D
Crossing of taxiway, apron3D
Crash against an embankment or against a drainage channel2B
Collision with obstacle(s)1B
Crossing of airfield perimeter fence1B
Note: red means “Risk not tolerable”, yellow means “Risk tolerable”, green means “Risk acceptable”.
Table 5. Usability factors.
Crosswind Component (knots)Usability factor (%)
≤1097.3
≤1399.1
≤2099.9
Table 6. Crosswind frequency.
Crosswind Component (knots)Hourly Observations (-)100-Usability Factor (%)
>1039252.7
>1313660.9
>20970.1
Table 7. Crosswind frequency for sectors.
Crosswind Component (knots)Frequency of SSE Crosswind (%)Frequency of NNW Crosswind (%)
>100.12.6
>130.00.9
>200.00.1
Table 8. Aircraft categories in the airport.
ICAO Category A/C%
Category A11.82
Category B16.59
Category C71.24
Category D0.24
Category E0.11
Table 9. Most frequent aircraft models in the airport.
Aircraft Model%
B 737–80028
A32011
A31910
B737–6005
B7174
Table 10. Runway usage percentages at take-off.
Runway UsageCumulative Number of MovementsMovements (%)% of Movements Exceeding the Distance x
Progressive x (m)Number of Movements
30015150.1100
4002292441.599.9
5001353792.498.5
600394182.697.6
7001065243.397.4
80085323.396.7
9001296614.196.7
10001363202412.795.9
1100384240815.187.3
1200310271817.084.9
13004272217.083.0
14009273117.183.0
1500580331120.782.9
16001092440327.679.3
1700406480930.172.4
18002245705344.269.9
1900589764247.955.8
20001741938258.852.1
210029941158.941.2
220065947659.441.1
2300366984261.640.6
2450612315,96510038.4
Table 11. Runway usage percentages at landing.
Runway UsageCumulative Number of MovementsMovements (%)% of Movements Exceeding the Distance x
Progressive (m)Number of Movements
20015150.1100
3001121270.899.9
4002493762.499.2
5001024783.097.6
600104883.197.0
7004789666.096.9
8001361232614.694.0
9001826415226.085.4
1000388454028.474.0
1100819535933.671.6
12002536133.666.4
1300121548234.366.4
1400607611,55772.465.7
1500175313,31083.427.6
1600259515,90599.616.6
18004515,95099.910.4
20001015,96099.970.09
2100115,96199.970.03
2200115,96299.980.03
2300315,9651000.02
Table 12. Corrective coefficients.
Corrective Coefficients
RWY Progressive (m)Take-Off (-)Landing (-)
24500.900.10
23000.900.10
22000.900.10
21000.900.10
20000.900.10
19000.900.10
18000.900.10
17000.790.21
16000.800.20
15000.740.26
14000.590.41
13000.560.44
12000.560.44
11000.540.46
10000.540.46
9000.510.49
8000.480.52
7000.460.54
6000.450.55
5000.410.59
4000.390.61
3000.340.66
2000.340.66
1000.340.66
00.330.67
Table 13. Correlation between CBR and damage.
CBR of Runway Strip (%)Damage Associated with Veer-Off (-)
>30Negligible
20 ÷ 30Minor
15 ÷ 20Major
5 ÷ 15Hazardous
<5Catastrophic
Table 14. Matrix of damage.
SeverityConsequencesCBR [%]D [-]
Passenger and CrewAircraft
ANegligibleNo injuriesNeed for airplane revisions>301%
BMinorSlight injuriesSlight damages>205%
CMajorInjuries or health effectsDamage accounting to less than 2 million €15 ÷ 2018%
DHazardousSerious injuries or health effectsDamages between 2 million to 50 million €≤15100%
ECatastrophicMany fatalitiesHull loss—Damages over 50 million €≤5200%
Publisher’s Note: MDPI stays neutral with regard to jurisdictional claims in published maps and institutional affiliations.

