Article

Investor Attention from Internet Search Volume and Underreaction to Earnings Announcements in Korea

1
Business School, Seoul National University, Seoul 08826, Korea
2
School of Business, Chungbuk National University, Cheongju 28644, Korea
3
David Eccles School of Business, University of Utah, Salt Lake City, UT 84112, USA
*
Author to whom correspondence should be addressed.
Sustainability 2020, 12(22), 9358; https://doi.org/10.3390/su12229358
Submission received: 9 September 2020 / Revised: 5 October 2020 / Accepted: 12 October 2020 / Published: 11 November 2020
(This article belongs to the Section Economic and Business Aspects of Sustainability)

Abstract

:
Recent studies have used internet search volume as a measure of investor attention. In addition, literature argues that limited investor attention contributes to market underreaction to public information such as earnings announcements. We show that firms with more investor attention captured by abnormal internet search frequency have stronger announcement-day reactions and weaker post-earnings-announcement drift. The effect of abnormal search frequency is stronger for medium and small-sized firms, which usually receive insufficient attention. Our evidence indicates that firms with higher search intensity are traded more, especially by individual investors. Moreover, we imply that it is a sustainable development for investors to be able to use public information through the internet for investment in stock markets.

1. Introduction

Traditional asset pricing models are typically based on the assumption that information is instantaneously incorporated into prices; however, insufficient attention to the asset can prevent investors from engaging in this process because attention is a limited cognitive resource [1,2,3,4]. Thus, investor attention may affect stock prices, which is a view supported by several theoretical and empirical studies [4,5,6,7,8,9,10,11]. Furthermore, prior studies, such as those of Peng and Xiong [2], Hirshleifer et al. [9], and Loh [12], suggest that limited investor attention can cause investors to underreact to public information.
Recent studies investigate the positive relation between underreaction to earnings news and inattention. Most test the condition of investors being distracted, and find that the market underreacts to earnings announcements, and post-earnings-announcement drift (PEAD) is stronger [8,13,14,15]. Whereas most of these studies analyze the relation between attention and reactions to earnings news using proxies for inattention, Ben-Rephael et al. [4] propose a direct measure of abnormal institutional investor attention using news searching and news reading activity for specific stocks on Bloomberg terminals. Likewise, Drake et al. [16] argue that more access to EDGAR (Electronic Data Gathering, Analysis, and Retrieval) on the day of and the day after an earnings announcement is associated with smaller PEAD. In line with these studies, we examine the impact of attention on investor reactions to earnings announcements using firms’ internet search frequency as another direct proxy for investor attention.
An earnings announcement is a supply of information, though not all earnings announcements may fully attract investor attention, as attention is a scarce cognitive resource. According to Ben-Rephael et al. [4], even abnormal institutional attention does not follow all earnings announcements. Internet search volume on the earnings announcement date can directly reveal how much the firm attracts attention, and people look for the firm on this date. Since literature argues that market underreaction to news, perhaps partly due to investor neglect or gradual recognition, may cause post-earnings-announcement drift, we expect that firms with higher search intensity will have a lower underreaction. Specifically, we predict that firms with abnormally high searches will have higher abnormal returns and trading volume on the announcement date as well as weaker post-earnings-announcement drift. This is because information about firms with enough attention may be less slowly processed and incorporated into their prices via significant trading. As a result, our study contributes to the literature by shedding light on the relationship between search frequency and post-earnings-announcement drift, supplementing the emerging literature with the impact of search frequency on the market response to earnings news.
We use stocks listed on Korean markets, that is, KOSPI and KOSDAQ stocks. The Korean stock market (especially the KOSDAQ) has a far higher proportion of individual trading than other markets do. On average, individual trading volumes account for 49.6% and 87.1% of total trading volume in the KOSPI and KOSDAQ markets during the sample period, respectively. Furthermore, the proportions of shares traded by individual investors in the KOSPI and KOSDAQ markets are 82.2% and 93.5%, respectively. Retail traders are generally thought to be less informed. Hence, using Korean stocks, which mainly have retail traders, enables us to reveal the effect of individual investor attention captured by search frequency on the stock market because individual investors with insufficient information may demand information about the firm through the internet and thus indicate their degree of attention. If search frequency influences individual investors’ trading activity, it may also strongly affect stock price movements in the Korean market, which is dominated by individual investors. Moreover, in Korea, local portal sites have a far higher market share as search engines than Google, which is a worldwide search engine and continues to be the favorite. NAVER (https://www.naver.com) is a notable representative internet portal and search engine in Korea. InternetTrend (http://www.internettrend.co.kr) reports that NAVER appears to be the favored search engine in the Korean market. It had an average market share of about 82% during the sample period in this study in January 2016–July 2019. In the same period, Daum (https://www.daum.net) and Google had market shares of approximately 10% and 5%, respectively. That is, search activity is highly concentrated in NAVER in Korea compared with the market share of Google in the U.S. of generally less than 80%, as an example. Furthermore, NAVER is available in Korean only; thus, almost all NAVER users will be Koreans rather than foreigners. It is rare for a firm to be searched on NAVER for different underlying objects of the same name in foreign languages such as English. Therefore, data on search term frequency from NAVER should indicate domestic individual investor attention more directly and independently than prior literature using Google Trends. As Korean markets have high proportions of individual traders, a substantial portion of traders in the markets search for firm information in NAVER, and abnormal search traffic from NAVER may be closely associated with market reactions.
We first review whether Korean stocks have post-earnings-announcement drift. After confirming post-earnings announcement drift in the KOSPI and KOSDAQ markets, we examine how abnormal search frequency from NAVER influences market reactions to earnings announcements and post-earnings-announcement drift. We sort stocks quarterly into deciles based on each firm’s earnings surprise and into tertiles based on abnormal search frequency on the day of the firm’s earnings announcement. We find that stock price reactions to earnings news on the announcement date are significantly stronger when investors search more for firms with both the best and worst earnings surprises. While the interdecile spread of the announcement period abnormal returns between firms with the best and worst earnings news is not significantly different from zero for firms with low abnormal search frequency, the announcement abnormal returns for firms with the best earnings news are significantly larger than for firms with the worst earnings news when the firms have high abnormal search frequency. Moreover, the post-earnings-announcement drift for more intensely searched firms is significantly weaker, especially for firms with good earnings surprises. As other attention variables, such as abnormal returns on the announcement date, may lead searching activity and thus mitigate the post-earnings-announcement drift, we run panel regressions of the post-announcement cumulative abnormal returns on the abnormal search frequency and other attention variables. The evidence indicates that higher abnormal search frequency is associated with weaker post-earnings-announcement drift for firms with good earnings surprises, even after controlling for other attention variables, such as abnormal returns and abnormal turnover. These results mean that increased attention on firms may drive the reaction, which reflects earnings news more and reduces market underreaction, supporting studies finding that investor inattention contributes to post-earnings-announcement drift. When we sort stocks by firm size, the impact of abnormal search frequency on post-earnings-announcement drift is stronger for medium and small firms than for large firms. This may be because large firms already received enough attention due to their visibility.
We also explore whether the abnormal trading volume and turnover response to earnings news vary with abnormal search frequency. We find that announcement trading volume and turnover abnormally increase (decrease), regardless of the earnings surprise, when announcement abnormal search is higher (lower). Most spreads in announcement abnormal trading volume and turnover between the best and worst earnings news are insignificant for all abnormal search frequency tertiles. In the regression analysis, abnormal search frequency has a positive relation with abnormal trading activity, even after including control variables, whereas earnings surprise does not have a certain association. Since the coefficients of earnings surprise are positive in the univariate test, our findings suggest that investor attention affects trading activity more than public information itself does (i.e., earnings announcement). However, earnings surprise influences trading activity by interacting with abnormal search frequency because we find that their interaction term is significant. Consequently, consistently with results from announcement stock price reactions, firms with increased attention are traded at abnormally high volumes. This ample trading may induce the stock price around the announcement to reflect the earnings news and lead to weaker post-earnings-announcement drift.
We classify trading activity by retail, institutional, and foreign investors. As retail investors mainly use internet searches to acquire information about a firm, we expect that announcement retail trading increases with abnormal search frequency more than that for institutional or foreign investors. The evidence indicates that both individual buying and selling have a positive association with abnormal searches, and their coefficients are larger and more significant than those for institutional or foreign investors in the regression analysis are. Thus, internet search reflects retail attention rather than institutional or foreign attention.
We also test whether portfolio trading strategies based on announcement abnormal searches and earnings surprises outperform. The returns of the portfolio that are long best earnings news firms and short worst earnings news firms are significantly higher for firms with lower search frequency than the base post-earnings-announcement drift portfolio returns. For firms with lower search frequency, the returns of the equivalent portfolio strategies are not significantly different from zero. Furthermore, the long–short profits from KOSDAQ stocks are larger than those from KOSPI stocks. These findings confirm that investor attention captured by abnormal search frequency can reduce market underreaction and lead to weaker post-earnings-announcement drift, especially for firms that received less attention.
Although several studies argue that investor inattention may cause market underreaction to earnings news and, thus, post-earnings-announcement drift, they do not have direct measures of investor attention. Non-trading hours or days, the number of earnings announcements, and trading volume are indirect proxies for investor attention or inattention that require some assumptions. Thus, we contribute to the literature that focuses on the impact of investor attention on underreaction to public information and post-earnings-announcement drift. Our findings broaden this literature by using a direct attention proxy and internet search frequency; these have implications for the market reaction at the earnings announcement and for a period after the announcement. Furthermore, we also contribute to the growing literature on the impact of internet technologies on capital markets. As internet use is increasing as a means to acquire financial information and ‘big data’ are collected from this activity, our study provides evidence that clarifies the effect of the internet on stock markets and suggests one way to use data driven by the internet.
Moreover, our findings suggest that this can be a sustainable development in highly competitive stock markets for individual investors who are likely to be relatively inferior. Most institutional traders and insiders have their own or private information about stocks and can often exploit this information to generate more excess returns than retail investors. Thus, individual traders seem to be in an unfavorable position. Public information from simple internet technologies, such as searching or using big data that are available to all investors, is expected to improve retail traders’ investment and to lead to sustainable and balanced trading in financial markets, and our results support this expectation.
The rest of the paper is organized as follows. Section 2 summarizes a literature review, and Section 3 describes the data and variables in our study and reports our analysis of the characteristics of portfolios formed by earnings surprises and search frequency. Section 4 explains the announcement date returns and post-earnings-announcement drift of our sample and investigates them based on abnormal search frequency. Section 5 examines announcement trading responses to abnormal search frequency. Section 6 reports the performance of portfolios based on abnormal search volume and earnings surprises. Section 7 tests whether the impacts of turnover on investor reactions to earnings announcements are significant, and Section 8 concludes the study.

2. Literature Review

According to Kahneman [1], information needs to attract investor attention before it can be processed and incorporated into asset prices via trading, but attention is a limited cognitive resource. As traditional asset pricing models are typically based on the assumption that information is instantaneously incorporated into prices, we need to take investor attention into account to reveal the relationship between any events and investor reactions in stock markets.
Prior studies suggest that limited investor attention can cause investors to underreact to public information. Peng and Xiong [2] indicate in their model that limited investor attention leads to category-learning behavior; consequently, investors focus on market- and industry-wide information rather than on firm-specific information. This implies that investors may underreact to firm-specific information. Hirshleifer et al. [9] find that investor neglect of information signals can lead to earnings-related anomalies in their model. Loh [12] also shows that low-attention stocks show less reaction to stock recommendations.
Recent studies investigate the positive relation between underreaction to earnings news and inattention. Most test the condition that investors are distracted. DellaVigna and Pollet [13] find less immediate response and higher delayed response for earnings announcements on Friday when investor inattention is more likely. Hirshleifer et al. [8] also show that the immediate market reaction to earnings surprise is weaker, and that PEAD is stronger on days with higher numbers of earnings announcements. Some studies exploit other various proxies for investor inattention, such as non-trading hours [14], low turnover [15], and down market state [15], to reveal their relation to investor underreaction to earnings news.
Whereas most of the studies above analyze the relation between attention and reactions to earnings news using proxies for inattention, Ben-Rephael et al. [4] propose more a direct measure using news searching and news reading activity for specific stocks on Bloomberg terminals. They find that institutional attention facilitates information incorporation at the announcement and alleviates future drift. Drake et al. [16] argue that more access to EDGAR on the day of and the day after an earnings announcement is associated with smaller PEAD.
Searching for information about a firm on the internet is a way for investors to actively pay attention to the firm, although the literature uses different variables to proxy for investor attention. Barber and Odean [7] use extreme returns, trading volume, and news as the investor attention proxy; Gervais et al. [6] use trading volume, Fang and Peress [10] use news coverage, Frieder and Subrahmanyam [17] use brand visibility, Grullon et al. [18] and Chemmanur and Yan [19] use advertising expense, and Seasholes and Wu [20] use price limits. However, Da et al. [3] argue that although these proxies make the critical assumption that investors should pay attention to the firm after extreme stock returns or trading volume, extreme returns or trading volume can have factors unrelated to attention.
Da et al. [3] introduce search frequency in Google as a new and direct measure of (retail) investor attention, and show that search frequency is correlated with, but different from, existing proxies for investor attention in the U.S. In the same vein, Bank et al. [11] find that search frequency in Google to capture investor attention affects the liquidity and returns of German stocks. Mondria et al. [21] and Cziraki et al. [22] also use aggregate search volume as a measure of attention. By extension, Vlastakis and Markellos [23] and Drake et al. [24] use search frequency as a proxy of information demand. Compared to media coverage as a representative investor attention variable, search frequency is a more direct investor attention variable. According to Da et al. [3], a news article does not guarantee attention unless investors actually read it. In addition, Ben-Rephael et al. [4] illustrate that news coverage and institutional attention are correlated; however, news coverage does not guarantee attention, and abnormal institutional attention directly identifies the news that attracts institutional attention. Thus, Vlastakis and Markellos [23] define news headlines as information supply as distinct from search frequency in terms of information demand. Moreover, Herbert Simon, a Nobel laureate, states in Greenberger [25] that “a wealth of information creates a poverty of attention and a need to allocate that attention efficiently among the overabundance of information sources that might consume it.” Search activity may be one way to allocate attention, and search volume can directly reveal the degree of investor attention to the firm. In addition, this may be a sustainable development in that investors, especially individual investors who are likely to be inferior in capturing qualified information in comparison with institutional traders, can use public information through the internet for investment in very competitive stock markets. By extension, Guijarro et al. [26] analyzes the impact of investors’ mood captured from Twitter on market liquidity and on the trading costs.
Some studies examine the relation between internet searching and earnings announcements. Drake et al. [24] consider abnormal Google searching as a measure of investor information demand, and find that it increases before earnings announcements and continues at high levels for a period after the announcements. Furthermore, preannouncement price and trading volume changes reflect the upcoming earnings news more than a news announcement does. Da et al. [27] also show that the search volume for a firm’s most popular product predicts earnings surprises. They all investigate the relation between search frequency and earnings around earnings announcements, but not post-earnings-announcement drift. Therefore, our study contributes to the literature by shedding light on the relationship between search frequency and post-earnings-announcement drift, supplementing the emerging literature with the impact of search frequency on the market response to earnings news.

3. Data and Variables

3.1. Data

3.1.1. Internet Search Volume

We use aggregate search volume (SV) in NAVER as a direct measure of investor attention for Korean stocks, which was provided by NAVER DataLab (https://datalab.naver.com/keyword/trendSearch.naver). NAVER is a representative internet portal and search engine in Korea. InternetTrend (http://www.internettrend.co.kr) reports that the average market share of NAVER was about 82% during the sample period of January 2016~July 2019. NAVER is available in Korean only, and thus, nearly all NAVER users will be Koreans rather than foreigners.
NAVER DataLab provides daily, weekly, and monthly data on the search volume of up to five specific keywords for the corresponding time interval. The offered volume includes searches through mobiles and computers, and it can be classified. In this study, we include search frequency through both mobiles and computers. In addition, NAVER DataLab classifies the frequency data based on users’ ages. We look at searches by adults over 19 years old because most younger people who search for firms may have other purposes besides securities investment. As NAVER DataLab provides data on search term frequency dating back to January 2016, the sample period of our study is from January 2016 to July 2019.
The search volume for a keyword provided by NAVER DataLab is not given in absolute terms, but as a value relative to the maximum number of searches on NAVER in the corresponding time interval set previously. During the set period, the biggest search frequency is scaled as 100 in NAVER DataLab; thus, search volume varies between 100 and 0. Since we use daily search volume data for all firms listed in the Korean stock market, the stock–day observation of the highest search frequency is 100, and the other observations have values relative to this search frequency.
An important choice is the identification of a stock in the search engine to extract the search frequency for firms. For instance, Bank et al. [11] use firm names and Da et al. [3] use stock ticker symbols. Da et al. [3] document that identifying search frequencies by company name may be problematic because investors may search the company name for reasons unrelated to investing, and some company names have multiple meanings (e.g., “Apple”). In their sample, however, some tickers also have multiple meanings, such as “DNA” and “ALL,” and using tickers can cause noise like when using company names. Furthermore, the stock ticker symbols for firms listed in the Korean stock market (KOSPI and KOSDAQ) consist of six numbers and an alphabet (e.g., A005930 for Samsung Electronics). Thus, investors (especially individual investors) rarely search for firms using these complicated tickers to get information in Korea. They usually search by firm name, which is easy to remember. Therefore, we employ the number of internet search queries for firm names as provided by NAVER DataLab, and the searched firm names are limited to names listed in the Korean Exchange (KRX). To reduce the noise in the search volume, we eliminate firms with names that have multiple meanings. For example, firm names such as “NICE” or “NEW” are usually associated with abnormally high search volumes that may have nothing to do with investor attention to the stocks with these names. We report results for a sample that excludes firms with names that have multiple meanings, which is about 2.21% of all KOSPI and KOSDAQ stocks. As excluding these firms is based on a subjective judgment, we conduct an equal analysis with all stocks, and the results are robust to the whole sample.
Finally, we exclude firms for which search volumes are not provided for more than one year. Of the remaining observations, we drop firms if the search volume in six or more consecutive months equals zero.

3.1.2. Earnings Announcement

We collected the quarterly earnings announcement day data from the Korea Investor’s Network for Disclosure System (KIND) via hand-collection. KIND is an official website that contains all listed companies’ disclosures. Among them, we consider the most practical and earliest disclosure containing the last quarter’s earnings performance as an effective disclosure. Effective disclosure means that it includes not only the apparent earnings performance, like the annual report, but also practical earnings performance, like tentative earnings performance or disclosures of changes in the profit/loss structure. Therefore, we take the day of effective disclosure as the earnings announcement day. We chose effective disclosure over apparent disclosure because, whether apparent or effective, only the earlier disclosure can act as useful information for investors; the following disclosure is no longer investment information because the stock price already includes the earlier information. Meanwhile, if disclosure is published after the stock market closed, we adjust the earnings announcement day to the next trading day because we expect that such information will be applied on the next trading day.
We use unexpected earnings as a measure of the earnings surprise. Foster [28], Foster et al. [29], and Bernard and Thomas [30,31] employ standardized unexpected earnings (SUE). Their models account for seasonality and the AR(1) process in the earnings series. We forecast earnings by estimating the Foster [28] model with historical net income data, and calculate unexpected earnings (or forecast error) as the difference between announced earnings and the forecasted earnings, as follows:
U E i q = N I i q E ( N I i q ) = N I i q [ N I i q 4 + ϕ i ( N I i q 1 N I i q 5 ) + δ i ] ,
where U E i q is the unexpected earnings of firm i in quarter q, N I i q is the net income of firm i in quarter q, and E ( N I i q ) is expected earnings. We estimate the ϕ i and δ i (drift term) parameters using the most recent sixteen quarters of data. Then, the difference between actual and expected earnings is divided by the standard deviation of unexpected earnings over the estimation period to obtain SUE. We use only the unexpected earnings observed prior to the quarter examined to estimate the standard deviation of unexpected earnings. The maximum and minimum number of observations to compute the standard deviation is four and sixteen, respectively.

3.1.3. Other Variables and Data

We define abnormal returns associated with the market reaction to earnings announcements as size-adjusted returns throughout the study. We sort all stocks daily into five portfolios based on the market capitalization for the KOSPI and KOSDAQ markets. We match each stock daily with 1 of 10 size–market portfolios; hence, the abnormal return is the difference between the return on the announcing firm and that of the size and market matching portfolio. We define the cumulative abnormal returns in period [t, T], and CAR[t, T] as the cumulative return on the announcing firm minus the cumulative return on the size and market matching portfolio over the window [t, T] in trading days relative to the announcement date.
We exploit trading activity variables such as the log trading volume, LnTV, and turnover, TO, which is the number of shares traded divided by the number of shares outstanding for the stock. Since literature such as Bank et al. [11], Da et al. [3], Dimpfl and Jank [32], and Ben-Rephael et al. [4] documents that search frequency can capture retail investor attention, we expect a different relationship between search and trading activity by type of investor. Thus, we separate the trading activity variables into individual, institutional, and foreign investors’ trading activities. For example, LnTVj is the natural log of trading volume for investor j, TOj is the turnover for investor j, and j is a retail (retail), institutional (insti), or foreign (forg) investor. We calculate the trading volume and the number of shares traded for investor j as the average of j’s buying and selling.
We define the representative investor attention variables as follows. MadjRet is the market-adjusted return, and the market return is an index return for the market on which the stock is listed. AbsMadjRet is the absolute market-adjusted return. The market-adjusted trading volume on a given day, MadjLnTV, is the log trading volume minus the log of the average trading volume of all stocks in the market on which the stock is listed on that day. MadjTO is the market-adjusted turnover, which is the turnover minus the average TO of all stocks in the market on that day. PrcHL is a proxy for intra-day stock fluctuation defined as the highest price minus the lowest price divided by the close price on a given day. We add the natural log of market-cap, LnSize, and the book-to-market value of equity, BM, as firm characteristic variables. Table 1 defines all variables used in this paper.
We use all firms traded on the KOSPI and KOSDAQ market of the Korean Exchange during the sample period, which cover all listed Korean stocks. We exclude mutual funds, REITs (Real Estate Investment Trust), ETFs (Exchange Traded Fund), SPACs (Special Purpose Acquisition Company), and preferred stocks, as well as stock–day observations one year after listing and before delisting in the KOSPI/KOSDAQ. To reduce the bias related to the market microstructure, such as the bid–ask spread effects and the infrequent trading effect, we only consider stocks with a price consistently above 1000 KRW during the sample period. We exclude firms that changed their listing market during the sample period. Note that we include only the firms with earnings data available for more than 17 quarters to eliminate unexpected earnings. When we also account for search volume, the data filtering yields a final sample of 613 and 837 firms on the KOSPI and KOSDAQ, respectively, for the investigation.
All capital market data employed, such as firms’ general information, stock returns, earnings, size, investors’ trading information, and interest rates, come from DataGuide. Since we require stock trading and return data one month before and three months after extracting the search frequency for our analysis, we obtain capital market data for December 2015 to October 2019. Table 2 reports the descriptive statistics on the variables included in this study.
In Table 2, RetM is the daily market return, which is the average of daily returns on the KOSPI and KOSDAQ indexes. Considering that the average and standard deviation of market returns from 1980 through 2019 in Korean markets are 0.035% and 1.385%, the average return and volatility of stock markets during the sample period are relatively low and stable.

3.2. Search Volume and Earnings Surprise Portfolio Characteristics

3.2.1. Search Volume and Earnings Surprise Portfolios

To investigate the relation between firm characteristics or stock trading activity and search frequency, we construct five portfolios by sorting stocks into search frequency quintiles and calculate the means of the variables for each of the five search frequency quintiles. In Panel A of Table 3, SV1 comprises stocks with the lowest search frequency, and SV5 comprises stocks with the highest search frequency. It presents the results for the whole sample period, including the period not associated with earnings announcements, and reveals the general characteristics of firms’ search frequencies. The results indicate that search frequencies are positively correlated with investor attention variables such as MadjRet, AbsMadjRet, MadjLnTV, MadjTO, and PrcHL in the Korean stock market, in accord with Bank et al. [11], Da et al. [3], and Kim [33]. That is, firms with higher search intensity have higher returns and absolute returns than market returns, are traded more than average, and experience excessive stock price changes. The differences between the SV1 and SV5 for the investor attention variables are reliably different from zero. Firms with higher search frequency have larger market capitalization and smaller book-to-market ratios in all markets. The positive correlation between search volume and firm size seems to be reasonable because large firms can attract investor attention more than small firms. Additionally, both the trading volume and turnover of retail/institutional/foreign investors increase with search volume. Their buying and selling increase with search frequency, which we do not present in the table. While the trading volume difference between SV5 and SV1 for retail investors is slightly smaller than that for institutional and foreign investors, the turnover difference between SV5 and SV1 for retail investors is far larger in both markets. This might be because individuals have a tendency to trade smaller firms on average, especially when they intensely search. Therefore, the individual turnover difference from SV5−SV1 in the KOSDAQ market is much larger than that for the KOSPI market.
Panel A of Table 3 reports the results for the KOSPI and KOSDAQ for the SV1–SV5 portfolios of each market. The positive relationship between search frequency and most variables appears in both markets. The differences for all investor attention variables in the KOSDAQ market between the SV1 and SV5 are bigger than for the KOSPI market, except for LnSize. Accounting for the fact that values of the investor attention variables for SV1 are similar in both markets, the bigger differences between the SV1 and SV5 KOSDAQ portfolios are driven by high search intensity for the SV5 portfolio. This means that the relation between internet search frequency and stock prices or trading activity is stronger in the KOSDAQ market, where participants are mostly retail investors.
As we aim to find the impact of search frequency on market reaction to earnings announcements, we investigate the means of the variables for quintiles based on abnormal search volume on the announcement date. Following Da et al. [3], our key variable, ASV, is defined as
A S V i t = ln ( S V i t ) ln [ M e d ( S V i t 1 ,     ,   S V i t 14 ) ] ,
where ln(SVit) is the natural logarithm of SV for stock i on day t, and ln[Med(SVit−1, …, SVit−14)] is the natural logarithm of the median value of SV during the prior two weeks. According to Da et al. [3], the median captures the normal level of attention in a way that is robust to recent jumps. They also argue that ASV has an advantage in that the time trends and other low-frequency seasonalities are removed. In our study, since SV is correlated with firm size, as in Panel A of Table 3, the results may involve the effect of usual attention driven by the firm’s visibility, as well as investor attention related to earnings announcements when we use SV. Moreover, SV is also positively correlated with SUE and AbsSUE in our test. Therefore, ASV is more independent and a better proxy for investor attention on the earnings announcement than SV. As Da et al. [3] explain, a large positive ASV clearly represents a surge in investor attention on the announcement date, and we can compare this across stocks in the cross-section.
ASV1–ASV5 in Panel B of Table 3 are formed with stocks sorted using ASV on the announcement date. Almost all results are similar to Panel A: MadjRet, AbsMadjRet, MadjLnTV, and PrcHL monotonically increase with ASV in every market. SUE and AbsSUE do not have a monotonic relationship, as explained above. Nevertheless, the spread in SUE between abnormal search frequency quintiles 5 and 1 (ASV5−ASV1) is significant in both markets. The averages of Lnsize and BM in the ASV quintiles also do not monotonically change. Overall, ASV on the announcement date is correlated with the investor attention variables, but nearly irrelevant to a firm’s fundamental variables. The results for LnTVj and TOj are nearly equivalent to those in Panel A, which we do not report to save space. Interestingly, the average net turnover for individual investors, NetTOretail, in ASV quintile 5 (ASV5) is significantly larger than in ASV quintile 1 (ASV1), while net turnovers for institutional and foreign investors are insignificantly negative, except for foreign investors in the KOSDAQ market. This supports arguments by Barber and Odean [7], Da et al. [3], and Kim [33] that attention shocks lead to net buying by retail traders because buying allows individuals to choose from a larger set of alternatives, while selling does not due to the constraint on short sales.

3.2.2. Earnings Surprise Portfolios

Table 4 presents the averages of the variables for five earnings surprise portfolios based on sorts by SUE. SUE1 comprises stocks with the smallest SUE, and SUE5 comprises stocks with the biggest SUE. SV increases from SUE2 to SUE5, and the SV of SUE1, with the worst earnings news, is the second largest. That is, the larger the earnings surprise is, the more investors search the firms, and people search for firms with extreme earnings surprises more. We present this pattern of means across earnings surprise quintiles for other investor attention variables, such as AbsMadjRet and MadjTO. On the contrary, the average abnormal search frequency (ASV) does not vary monotonically with the SUE quintiles, and the difference in abnormal search frequency between the best and worst earnings news is not significant. Hence, abnormal search frequency not only captures increased investor attention, but is also relatively independent from the earnings surprise.

4. Announcement Date Returns and Post-Earnings-Announcement Drift

4.1. Total Sample

First, we examine whether the post-earnings-announcement drift is significant in the Korean stock market. We sort all stocks each quarter into deciles according to SUE: SUE10 contains the stocks with the best earnings surprise and SUE1 contains the stocks with the worst earnings news. Then, we calculate the CARs for SUE deciles.
Our findings indicate significant post-earnings-announcement drift in the Korean stock market, which is consistent with other studies such as by Lee and Lee [34], Nah [35], and Lee and Choe [36]. Figure 1 shows the cumulative abnormal returns for the ten portfolios (SUE1–SUE10) with different earnings news. In Figure 1, the post-earnings-announcement abnormal returns vary approximately monotonically with the SUE deciles, and, crucially, SUE10 and SUE1 in the figure obviously identify the post-earnings-announcement drift.
According to Table 5, which shows the cumulative abnormal returns for the two extreme SUE deciles, SUE1 and SUE10, the post-earnings-announcement drift in Figure 1 is significant. Panel A of the table presents a significant CAR[2, 61] for SUE1 and SUE10. Furthermore, their abnormal announcement day returns are also significant; thus, the extreme earnings surprise deciles significantly produce CAR[0, 0], CAR[0, 1], and CAR[0, 61].
In Panels B and C of Table 5, the announcement and post-announcement cumulative abnormal returns are statistically significant in both of KOSPI and KOSDAQ markets. These results imply that earnings information is not instantaneously incorporated into prices, and investors may underreact to the earnings news in both Korean stock markets. Most investors in Korean markets are individual investors, as explained above; hence, their insufficient attention to all securities can contribute to this underreaction because attention is a limited cognitive resource and they may pay less attention to the stock market. We examine the effect of retail attention on price reactions to earnings news.

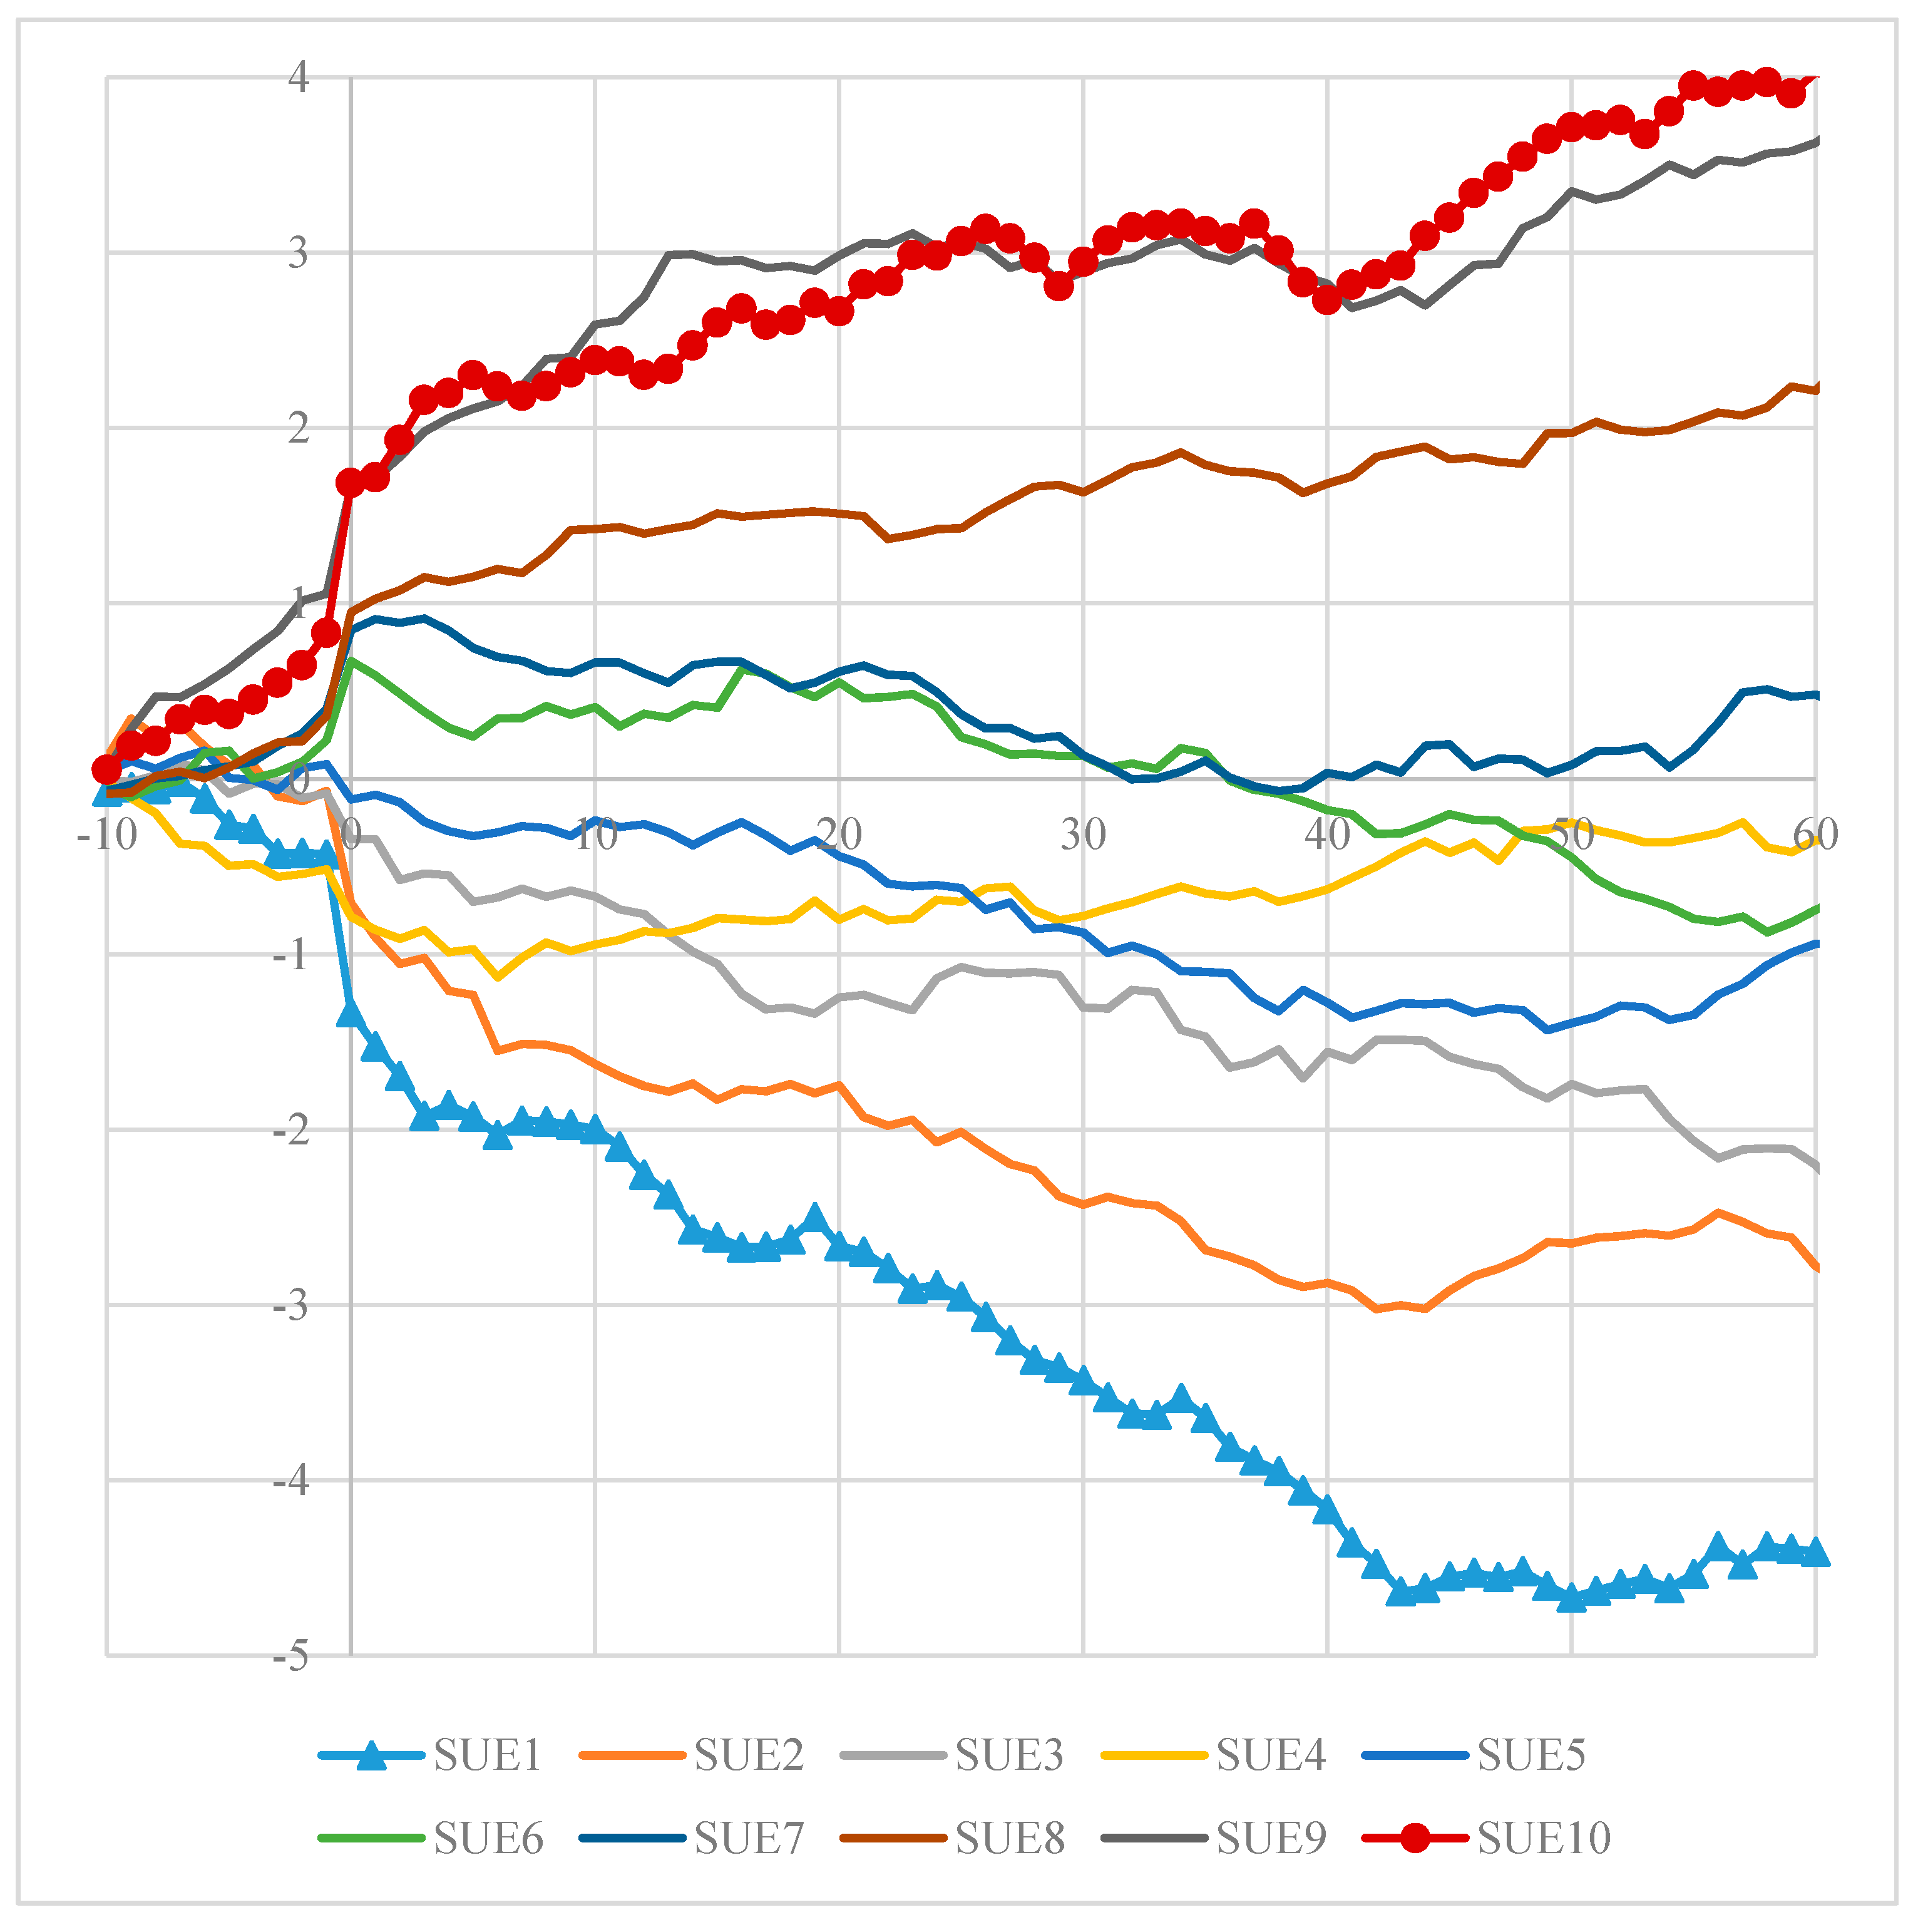
4.2. Subsamples by Abnormal Search Volume

We divide price reactions to earnings news by abnormal search frequency. The SUE1–SUE10 firms are independently sorted within SUE deciles into three groups, ASV1, ASV2, and ASV3, based upon abnormal search frequency on the earnings announcement day in each calendar quarter. ASV3 includes stocks with the largest abnormal search frequency. For each abnormal search frequency tertile, we calculate the CARs for the best and the worst earnings surprise deciles and the difference in CARs between the two extreme earnings surprise deciles.
Abnormal announcement day returns measure the stock price response to earnings news; higher abnormal announcement day returns for the best earnings surprise deciles and lower abnormal announcement returns for the worst earnings surprise deciles indicate that investors react more strongly to earnings news on the announcement date. The post-announcement abnormal returns of the two deciles measure underreaction to earnings news, as reflected in the subsequent drift. Our hypothesis predicts a stronger announcement-day reaction and a weaker post-announcement drift for intensive search frequency.
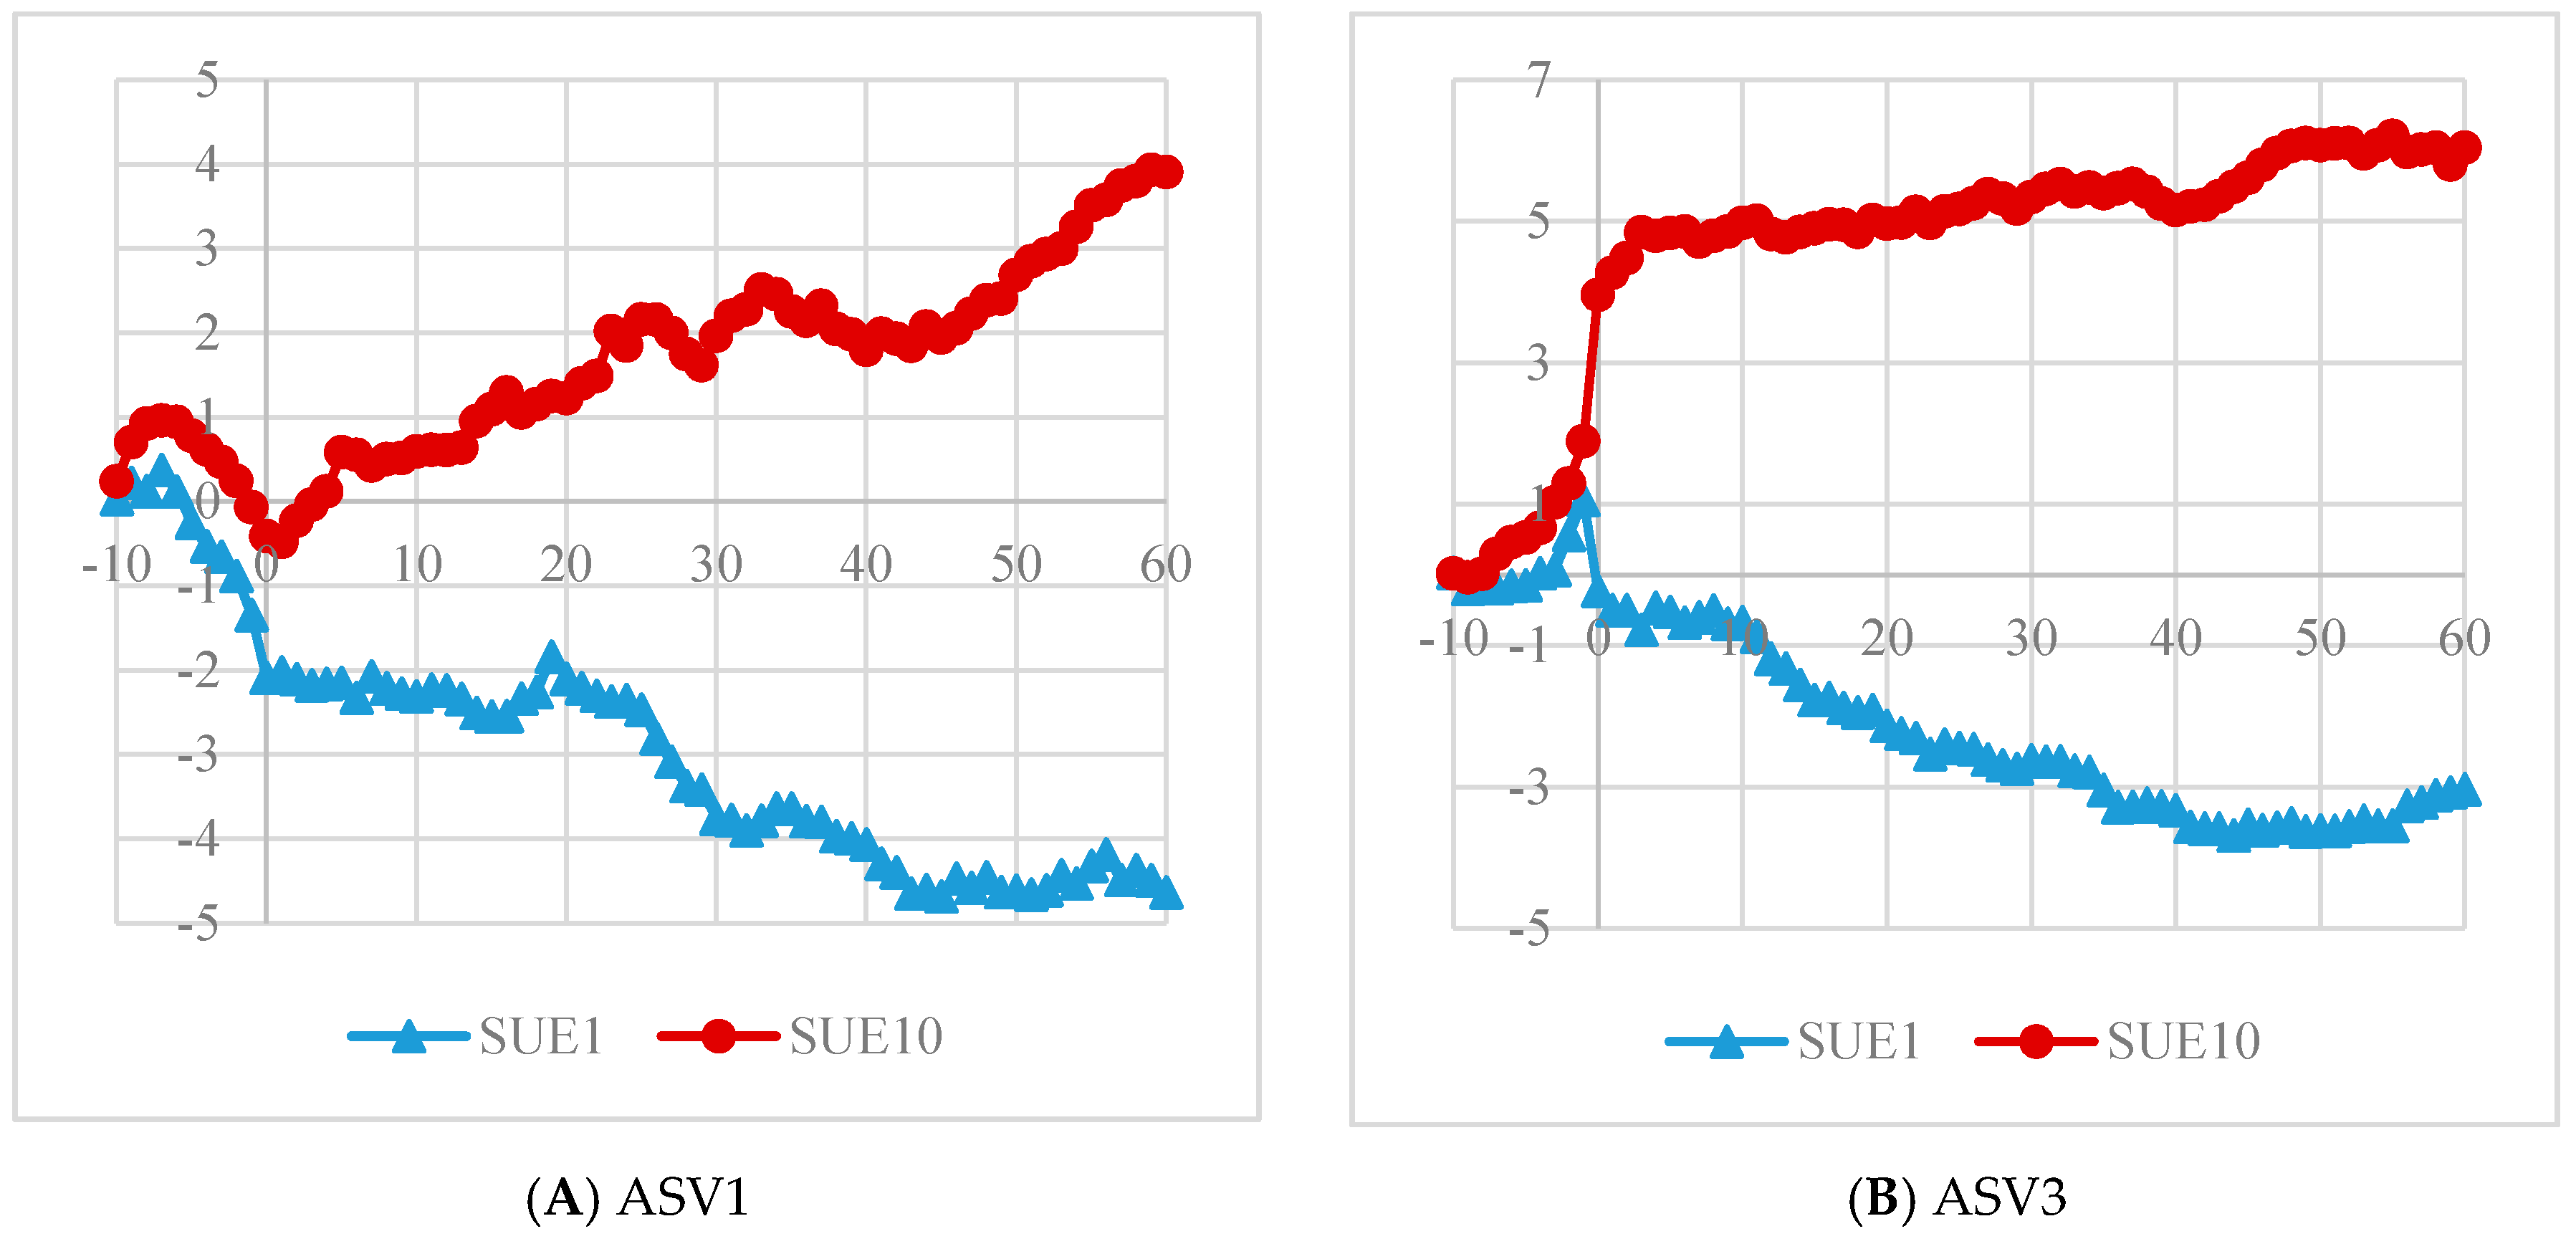
Figure 2 shows the CAR[−10, 61] for SUE1 and SUE10 for ASV1 and ASV3, and provides graphical evidence supporting our hypothesis. The post-announcement drift for the most intensively abnormally searched firms (ASV3) in Panel B is weaker than for the least abnormally searched firms (ASV1) in Panel A. Especially, for SUE10 for ASV3, post-announcement drift seems to be insignificant, and announcement-day reaction is stronger. Hence, we expect that firms with good news and that have higher searches on the announcement day than usual have higher announcement date returns but lower post-announcement drift.
Panel A of Table 6, which includes all stocks in both markets, reports results consistent with Figure 2. It shows that two-day announcement investor reactions to earnings news are stronger for firms with higher search volume. The differences in CAR[0, 1] between the most searched firms (ASV3) and the least searched firms (ASV1) are 2.79% for firms with good earnings news (SUE10) and −0.879% for firms with bad earnings news (SUE1), both of which are significant. However, although the two-day announcement abnormal returns of the least searched firms (ASV1) are significant for both SUE10 and SUE1, the differences in CAR[0, 1] between ASV3 and ASV1 are insignificant for firms with both good earnings news (SUE10) and bad earnings news (SUE1). For SUE10, the average abnormal return on only ASV3 is significantly positive. These results suggest that the market reactions to earnings news are more sensitive when investors search for these firms’ information. It also supports this that the difference between the most and least searched firms in the interdecile spreads (SUE10−SUE1) of CAR[0, 1] is 3.668% and significant. For ASV3, the mean spread in CAR[0, 1] between SUE10 and SUE1 is 3.935% and significant, while for ASV1, the mean spread is 0.266% and insignificant. That is, the market reaction to earnings news for less searched firms (ASV1) rarely varies with the degree of the earnings surprise. Therefore, our hypothesis of stronger announcement-day reactions to earnings news for more searched firms is empirically verified. In addition, the effect of search volume on CAR[0, 1] for the two extreme earnings news deciles is monotonic.
Search intensity is also related with weaker post-earnings announcement drift. The spread in the mean 60-day post-announcement abnormal returns (CAR[2, 61]) between the good and bad earnings news deciles indicates weaker underreaction to earnings news for more searched firms (ASV3) than for less searched firms (ASV1). For ASV1, the post-announcement abnormal return spread between the extreme earnings surprise deciles is 6.503% and significant, while the ASV3 spread is smaller (4.324%). The spread in the post-announcement abnormal returns is monotonic across the abnormal search frequency tertiles. These results imply that the investors may underreact less to earnings news by paying attention to the firms, such as by searching for information. It also supports our argument that the difference between the most and least searched firms in the interdecile spreads of CAR[2, 61] is −2.178% and marginally significant at the 10% level. The sources of this difference are the firms with good earnings news. For ASV3, the 60-day post-announcement cumulative abnormal returns on the best earnings news deciles are −2.27% smaller than for ASV1 and significant, whereas the difference between ASV3 and ASV1 in SUE1 is insignificant. Since Da et al. [3] and Kim [33] document that internet search volume primarily captures retail investor attention and retail investors are limited in a short sale, the degree of underreaction to firms with good earnings news may be reduced more than with bad news when the firms are highly searched.
According to Panels B and C in Table 6, the differences in market reactions to earnings surprises between more and less abnormally searched firms are significant for both the KOSPI and KOSDAQ markets, like in Panel A. For instance, the two-day cumulative announcement return differences between the most and least searched firms are similar and significant for both markets, regardless of whether the news is good or bad. Additionally, the spreads in the CAR[2, 61] between SUE10 and SUE1 monotonically decrease from ASV1 and ASV3 in both markets. However, the source of the difference in the CAR[2, 61] between the most and least searched firms (ASV3−ASV1) varies for SUE10 and SUE1. For SUE1, market underreaction to bad earnings news is remarkably moderated for ASV3 in the KOSPI market. For SUE10, the market underreaction to good earnings news is larger for ASV1 in the KOSDAQ market than for any other group. These results imply that investors can more quickly react to bad earnings news from intensely searched firms in KOSPI than to bad news from other firms due to their searching and the market effect, and that rarely searched firms in the KOSDAQ attract little attention, even when they have good earnings news.
Overall, the differences between the most and least searched firms in the interdecile spreads (SUE10SUE1) of CAR[0, 1] and CAR[2, 61] are 3.668% and −2.178%, and are significant. Furthermore, for KOSPI stocks, the differences are 3.736% and −3.460%. Considering that average of daily market returns is 0.035% during the same period and that the differences indicate returns on zero-investment portfolios, the calculated CARs are high enough to earn excess returns with the economic significance. In particular, the differences of the ASV3ASV1 in the SUE10SUE1 for CAR[0, 1] are about five times higher than market returns.
To control for the other possible determinants of investor responses to earnings news, we perform panel regressions of CAR[0, 1] and CAR[2, 61] on the earnings surprise decile rank (SUE), the abnormal search frequency decile rank (ASV), the interaction term SUE × ASV, and control variables in Table 7. We include firm- and day-fixed effects in the regressions to capture the within-firm effect, and the t-statistics are adjusted for both heteroskedasticity and within correlation clustered by firm. Hirshleifer et al. [8] estimate regressions using the decile rank of forecast error as opposed to the forecast error itself, since small negative surprises have a big influence. Thus, we expect that this approach will reduce the outlier effect. We control for other investor attention proxies and characteristics that might be related to cumulative abnormal returns. They include: firm size (LnSize), the book-to-market value of equity (BM), where the book value of equity is from the latest available accounting statement and the market value of equity is the market-cap on the announcement date, market-adjusted return (MadjRet), absolute market-adjusted return (AbsMadjRet), market-adjusted turnover (MadjTO), intra-day stock fluctuation (PrcHL) on the announcement date, the one-week (five trading days) return prior to the announcement date (Ret[t−5, t−1]), the stock return between one month and one week prior to the announcement date (Ret[t−20, t−6]), and the standard deviation of the return estimated from daily returns for one week prior to the announcement date (σ[t−5, t−1]). MadjRet and AbsMadjRet are excluded in regressions of CAR[0, 1].
Column (1) in Table 7 confirms a positive relation between earnings surprise and earnings announcement day returns. However, the significantly positive effects of not only earnings surprise, but also abnormal search frequency disappear after adding the interaction term (SUE × ASV) and control variables in Column (2). The interaction term has a significantly positive coefficient, which shows that the announcement return is more sensitive to earnings news for firms with higher abnormal searches. This evidence indicates that investor attention is required for good news to be incorporated into prices.
As a linear relationship in bad earnings news groups between abnormal search frequency and CAR[2, 61] is not observed in Table 6, inconsistently with good news groups, we separate positive earnings surprises from negative earnings surprises and conduct panel regressions in Columns (3) and (4) of Table 7. According to Column (3), the positive and significant coefficient on SUE confirms the existence of post-earnings-announcement drift for firms with better earnings news. The significantly negative coefficient on the interaction term SUE × ASV implies that investor attention alleviates upside post-earnings-announcement drift with control variables such as market-adjusted returns and market-adjusted turnover. Although other attention variables, such as abnormal returns on the announcement date, may lead searching activity and, thus, mitigate the post-earnings-announcement drift, the evidence indicates that the relation between the abnormal search frequency and the post-earnings-announcement drift for firms with good earnings surprises is robust to the inclusion of the other attention variables. As expected from the non-monotonicity of a relationship in bad earnings news groups between ASV and CAR[2, 61] in Table 6, the coefficient on the interaction term SUE × ASV in Column (4) is insignificant. This asymmetric result may be caused by short-sale constraint to retail investors who use internet search engines to acquire firm information. In addition, the results are comparable to those of Ben-Rephael et al. [4], who propose a proxy for institutional attention. They find that institutional attention facilitates information incorporation on the announcement day and induces fewer upside and downside drifts in the future.

4.3. Search Volume Effect across Firm Size

The aggregate search frequency is correlated with firm size, as in Panel A of Table 3, although abnormal search frequency is not. This is acceptable because people can search for firms that they already know, and large firms are probably known more. Thus, firm size is one of the attention proxies and may be associated with the degree of post-earnings-announcement drift. Studies such as that of Bernard and Thomas [30] find that post-earnings-announcement drift is stronger for smaller firms. Therefore, we investigate how the abnormal search frequency effect on market reaction to earnings news varies by firm size.
Earnings surprise deciles and firm size tertiles are formed based on quarterly independent double sorts of quarterly earnings announcements by the corresponding SUE and the market-cap on the day of the announcement. We also form abnormal search frequency tertiles within the earnings surprise deciles based upon the ASV on the announcement day in each calendar quarter. Table 8 shows the announcement and post-announcement cumulative abnormal returns of portfolios.
According to the results, the spread in cumulative abnormal announcement day returns between earnings surprise deciles 10 and 1 (SUE10−SUE1) are significantly positive for all size tertiles. Moreover, the spread in post-announcement cumulative abnormal returns between earnings surprise deciles 10 and 1 is significantly negative, except for the large size tertiles. Therefore, the abnormal search volume effect on reaction to earnings surprise is largely robust to firm size. However, the difference between more and less searched firms in the interdecile spreads (SUE10−SUE1) of the CAR[2, 61] for large firms is insignificant, because large firms have enough attention and, thus, search intensity cannot have a significant effect on post-announcement reaction, though it affects only announcement reaction. This result is consistent with Hirshleifer et al. [8].
The CAR[0, 61], the total effect of earnings news on stock prices, of the more searched firms (ASV3) is larger for firms with the best earnings news and smaller for firms with the worst news than less searched firms (ASV1), but is not significantly different. For medium-sized firms, the CAR[0, 61] of the more searched firms is also not significantly different from that of the less searched firms. Nevertheless, the announcement cumulative abnormal returns of the more searched firms in portfolios with good news (SUE10) are significantly higher than for less searched firms in all size tertiles. Furthermore, the post-announcement cumulative abnormal returns of the more searched firms in SUE10 are lower than for ASV1, but significant only in the median tertiles. For SUE1, the post-announcement CARs of ASV1 are also significantly lower than for ASV3 only in the median tertiles, while the differences in announcement CARs between ASV3 and ASV1 are significant for both large and medium firms.
Overall, the results confirm our hypothesis best for medium firms. The sources of the abnormal search volume effect on post-earnings announcement drift are median stocks and small firms. As we argued above, large firms have sufficient attention. Additionally, it is not easy to sell the stocks of small firms, even when their worst earnings surprises are uncovered. Note that Korean stocks are mainly traded by retail investors. Their short-sale constraints, particularly for small firms, may inhibit them from reacting to bad news. As supporting evidence, we find that the difference in the CAR[0, 1] of SUE1 between ASV3 and ASV1 is bigger for larger firms.

5. Trading Activity Response to Earnings News by Search Volume

5.1. Total Trading Activity

We analyze trading activity as another measure of investor reaction to earnings news. Reasonably, firms that are abnormally searched on the internet more intensely may be traded more. We employ two variables as a proxy for trading activity: abnormal trading volume, AbnLnTV, and abnormal turnover, AbnTO. Cumulative abnormal trading volume of the stock i over days [0, 1] relative to the announcement date t is defined as the natural log of trading volume for periods [0, 1] minus the natural log of two times the average trading volume over trading days [−20, −1]:
A b n L n T V [ 0 ,   1 ] i t = ln ( T V i t + T V i t + 1 ) ln ( 2 20 k = 1 20 T V i t k )
where TVit is trading volume of stock i on day t. Cumulative abnormal turnover for period [0, 1] is defined as the number of shares traded divided by the number of shares outstanding for stock i for period [0, 1] minus two times the average number of shares traded divided by the number of shares outstanding over trading days [−20, −1]:
A b n T O [ 0 ,   1 ] i t = T S i t N O S it + T S i t + 1 N O S it + 1 2 20 × k = 1 20 T S it k N O S it k
where TSit is the number of shares of stock i traded on day t, and NOSit is the number of shares outstanding of stock i on day t.
We follow the same approach as in Section 3.2 for period [0, 1] using these two trading activity variables rather than CARs. That is, we sort firms into ten portfolios based on standardized unexpected earnings (SUE1–SUE10), and then sort within the deciles to form three portfolios (ASV1–ASV3) based upon abnormal search frequency on the announcement day in each calendar quarter. For each abnormal search frequency tertile, we calculate the abnormal trading volume and abnormal turnover for the best and the worst earnings surprise deciles and their differences.
Panel A of Table 9 reports the results for all stocks in the Korean market. The evidence indicates that the trading spreads between earnings surprise deciles 10 and 1 are not significant, and the abnormal trading volume and abnormal turnover for more intensely searched firms are significantly much larger than for the less searched firms for both the best and worst earnings surprise deciles for the announcement window. Furthermore, the trading activity variables for earnings surprise deciles 10 and 1 monotonically increase across the abnormal search frequency tertiles. Firms abnormally searched more are definitely traded more than usual. For ASV3, the spread in abnormal trading volume between earnings surprise deciles 10 and 1 is marginally significant. This is because it is easier for retail investors to buy attention-grabbing stocks with good news than to sell such stocks with bad news, according to Barber and Odean [7] and Da et al. [3].
These findings are similar for both the KOSPI and KOSDAQ markets. Abnormal trading volume and abnormal turnover for the best and worst earnings surprise deciles and their interdecile spreads monotonically increase across ASV tertiles in each market. The KOSPI firms induce the significant spread between earnings surprise deciles 10 and 1 for ASV3.
To verify the positive correlations between abnormal search frequency and abnormal trading activity, controlling for the other investor attention variables and possible determinants of investor responses to earnings news, we perform a multivariate regression analysis. That is, we run panel regressions of two-day announcement abnormal trading volume (AbnLnTV[0, 1]) and abnormal turnover (AbnTO[0, 1]) on the earnings surprise decile rank (SUE), the abnormal search frequency decile rank (ASV), the interaction term SUE × ASV, and control variables. The control variables include the decile rank of absolute earnings surprises (AbsSUE), firm size, the book-to-market value of equity, market-adjusted return, absolute market-adjusted return, PrcHL, Ret[t−5, t−1], Ret[t−20, t−6], and σ[t−5, t−1].
The panel regression results are reported in Panel A of Table 10. Each model includes both firm- and day-fixed effects, and the t-statistics are adjusted for both heteroskedasticity and within correlation clustered by firm. The dependent variable of Columns (1) and (2) is the two-day announcement abnormal trading volume, and that of Columns (3) and (4) is the two-day announcement abnormal turnover. Whatever dependent variable we use, abnormal search frequency has a very significant positive relation with abnormal trading activity. The earnings surprise decile rank (SUE) or the decile rank of absolute earnings surprises (AbsSUE) are expected to have a positive relation with abnormal trading volume or turnover on the announcement date; however, we cannot find a clear linear relationship. This means that an increase in trading on the announcement has a stronger association with investor attention captured by search frequency rather than the earnings news itself (i.e., information supply). Moreover, the coefficient on the interaction term of the earnings surprise decile rank and the abnormal search frequency decile rank (SUE × ASV) is significant, suggesting that earnings surprises interacted with ASV (not earnings news itself) affects trading activity. For instance, the coefficient estimates on SUE and SUE × ASV in Column (2) imply that when firms are more intensely searched and the larger their earnings surprise is, the more the firms are traded, while when firms are less intensely searched, this is not the case.
The representative investor attention variables MadjRet, AbsMadjRet, and PrcHL have a positive relation with abnormal trading volume; however, their coefficients are smaller than for ASV. While they have a positive relation with abnormal turnover as well, in Column (4), their coefficients are negative and the coefficients of the variables interacted with ASV are positive. The evidence implies that the investor attention variables along with high search activity have a positive relation with abnormal turnover on the announcement.
Panel B of Table 10 presents the results from a Fama–MacBeth [37] cross-sectional regression to account for time-specific economy-wide shocks. Each quarter, we regress abnormal trading volume or abnormal turnover on the abnormal search frequency decile rank (ASV), the earnings surprise decile rank (SUE), the interaction term SUE × ASV, and other control variables. The regression results are not very different from the results in Panel A. In Column (5)–(8), the coefficients of ASV are significantly positive. In the univariate Fama–MacBeth [37] regression, the coefficients of SUE are insignificant, but they are largely negative with the control variables in Panel B of Table 9. In accord with Panel A, the coefficient on the interaction term SUE × ASV is significant.

5.2. Trading Activity by Investor Type

We divide abnormal trading variables into buying and selling activity by individual, institutional, and foreign investors. Then, we run panel regressions of abnormal buying or selling turnover (AbnTOlong,j[0, 1] or AbnTOshort,j[0, 1]) for individual, institutional, and foreign investors. The results are reported in Table 11.
The results show that all of the coefficients of buy-side and sell-side abnormal turnovers by investors are significantly positive before including interaction terms as control variables. With the interaction terms, the coefficients of abnormal turnovers by retail investor are significantly positive. Moreover, coefficients for individual investors are far larger than those for other investors. For example, the coefficient estimates on ASV in Columns (1), (5), and (9) imply that the retail buy-side turnover is more sensitive to abnormal search frequency by 4391% and 1842% compared to institutional and foreign investors, respectively. Therefore, retail investor trading is overwhelmingly more related with search frequency even after controlling for other investor attention variables and variables affecting announcement trading activity. In addition, the difference in the coefficients of retail investors between buy-side and sell-side abnormal turnover is small.
The earnings surprise decile rank (SUE) and the absolute earnings surprise decile rank (AbsSUE) do not have any significant linear relationship, even on the announcement date: Although they have a positive relation with retail buy-side turnover in the univariate regression, the relation is insignificant after controlling for the abnormal search frequency variable. This evidence again supports our argument that an increase in individual buying on the announcement is directly influenced by cognized information (investor attention captured by ASV) instead of earnings news information itself.

6. Abnormal Search Volume Portfolio Trading Strategy

We now investigate whether trading strategies using abnormal search frequency can capture stronger post-earnings-announcement drift than general post-earnings-announcement drift. In our strategy, long-shot portfolios are formed based on the standard unexpected earnings and abnormal search frequency, following Hirshleifer et al. [8]. Our portfolio trading strategy is as follows. We independently sort KOSPI and KOSDAQ stocks into 5 × 5 portfolios based on their most recent earnings surprises (SUE) within the last three months and abnormal search frequency (ASV) on the earnings announcement date at the end of each month from January 2016 to June 2019. If the day of the announcement is the last day of the month or one day before the last day, then we remove the stocks because market reactions to the announcement can confuse our strategy to capture post-earnings-announcement drift. We then estimate the monthly equal-weighted returns of each portfolio during the following month. Our long–short portfolios buy stocks with the best earnings news portfolio and sell stocks with the worst news portfolio, and we construct these long–short portfolios (SUE5−SUE1) in every abnormal search frequency quintile (ASV1–ASV5).
Panel A of Table 12 presents the returns on the 25 portfolios and long–short portfolios calculated with all stocks in our sample. The monthly return of the long–short portfolio for the lowest abnormal search frequency (ASV1) is 0.947% and significant and larger than the base post-earnings-announcement drift portfolio return in the first low of 0.642%, whereas its return for the most abnormal search frequency (ASV5) is 0.093% and insignificant. That is, investors may underreact more to rarely searched firms due to inattention, and, on the contrary, post-earnings-announcement drift is inadequate for intensely searched firms. The difference in returns on the long–short portfolios between ASV1 and ASV5 is also significant. The last row of Panel A shows the difference in portfolio returns between ASV1 and ASV5 within each earnings news quintile (SUE1–SUE5). For the best and the worst earnings news quintiles, the differences in returns between ASV1 and ASV5 are significant at the 10% level. Therefore, the source of the difference in returns on the long–short portfolios (SUE5−SUE1) between ASV1 and ASV5 is from both best and worst earnings news.
As the KOSPI and KOSDAQ markets have different characteristics, in that KOSDAQ stocks tend to be less-established small- and medium-sized firms and to have a larger proportion of retail investors, we separate the long–short portfolios into two groups by market. Panels B and C of Table 12 show the long–short profits by market. With KOSDAQ stocks, the difference in the long–short profits (SUE5−SUE1) between ASV1 and ASV5 is 1.179%, which is larger than with KOSPI stocks and more significant. Furthermore, the difference for KOSPI stocks is marginally significant. Thus, KOSDAQ stocks drive the performance of the long–short portfolios in Panel A. Accounting for the results in Table 8 showing that the effect of investor attention on reaction to news is stronger for medium-sized firms, this result is reasonable. Additionally, the difference in the best news quintile returns (SUE5) between ASV1 and ASV5 for KOSDAQ stocks is larger and has the highest significance among the four differences between the best and worst news quintile returns (SUE5 and SUE1) between ASV1 and ASV5 for KOSPI and KOSDAQ stocks. This implies that the decrease in post-earnings-announcement drift from investor attention captured by internet search frequency is the biggest for KOSDAQ firms with good news.
In conclusion, the performance of our portfolio strategies based on earnings surprises and abnormal search frequency confirm our results that post-earnings-announcement drift is stronger for firms with low internet searches (i.e., inattention). Furthermore, the evidence shows that internet searches can be used to obtain improved post-earnings-announcement drift results.

7. Robustness

Literature [12,15] uses turnover as a proxy for investor attention. Hou et al. [15] show that an earnings momentum strategy is less profitable for firms with higher turnover. Thus, we examine the impact of turnover on market reaction to earnings announcements and compare the results with those in Table 6 related to search frequency. This comparison provides a test that directly assesses the potential effectiveness of abnormal search volume as a proxy for investor attention.
We employ market-adjusted turnover (MadjTO), as in Table 1, as a measure of turnover in this analysis, and form portfolios as in Section 3.2. That is, we sort stocks quarterly into ten portfolios (SUE1SUE10) by earnings surprise (SUE) during the quarter, and then sort SUE1SUE10 firms within the deciles into three groups, MadjTO1, MadjTO2, and MadjTO3, based upon market-adjusted turnover (MadjTO) in the earnings announcement day for the quarter. MadjTO3 includes stocks with the highest market-adjusted turnover. For each earnings surprise decile and market-adjusted turnover tertile, we calculate the CARs of the announcement and post-announcement windows. Table 13 presents the results.
According to the table, the two-day announcement investor reactions to earnings news are indifferent to whether it is based on abnormal search frequency in Panel A of Table 6; the differences in the CAR[0, 1] between firms with the highest and the lowest market-adjusted turnover (MadjTO3‒MadjTO1) are 1.51% for firms reporting good earnings news (SUE10) and −0.95% for firms reporting bad earnings news (SUE1), and they are significant. Therefore, the difference between the firms with the highest and the lowest market-adjusted turnover in the interdecile spreads (SUE10−SUE1) of CAR[0, 1] is 2.46% and significant. The evidence indicates a significant effect of turnover on market reaction on earnings announcement days; however, the differences are smaller than those for abnormal search frequency in Panel A of Table 6, especially for firms reporting good earnings news, SUE10. Moreover, the differences in 60-day post-announcement abnormal returns (CAR[2, 61]) between MadjTO3 and MadjTO1 are insignificant for SUE1, SUE10, and the interdecile spread (SUE10−SUE1). Hence, investor attention captured by turnover does not have a practical influence on post-earnings-announcement drift, in contrast to abnormal search frequency, even though it does on announcement days. The results support that finding that abnormal search frequency is a more direct and better proxy for investor attention; furthermore, retail investors may be able to collect information by searching online to determine the firm value.

8. Conclusions

We employ internet search frequency as a direct proxy of investment attention and expand on these studies. In a sample of firms from Korean stock markets (KOSPI and KOSDAQ) for January 2016 to July 2019, we analyze how internet search frequency affects stock price, post-earnings-announcement drift, and trading activity after earnings announcements.
First, we confirm that earnings information is not instantaneously incorporated into prices, and investors may underreact to the earnings news in Korean stock markets. When we distinguish firms by size, the overall outcome is similar; however, this effect is remarkable for medium-sized firms because large firms already have intense attention, and small firms’ stocks are illiquid in terms of trading and short-sale constraints on retail investors. In examining the relationship between trading activity and search volume, abnormal trading activity increased along with larger abnormal search volume, regardless of the earnings surprise.
Investigating the association between investor attention in terms of search volume and trading activity by investor type (individual, institution, and foreigner), we find that trading activity has a positive and significant relation with abnormal search frequency and not with earning surprise overall, as in the result above. However, institutional trading activity is not actually related to investor attention, and foreign trading activity has a weaker relation to abnormal search volume compared with individual investors. This outcome enhances our argument that announcement day retail buying comes from investor attention rather than earnings surprise.
Our findings confirm PEAD in Korean stock markets and prior studies that argue that PEAD may occur because information is not instantaneously incorporated into prices due to insufficient attention and market underreaction. DellaVigna and Pollet [13], Hirshleifer et al. [8], and Hou et al. [15] find less immediate response for earnings announcements when investor inattention is more likely. However, they use indirect measures, such as trading on Fridays or days with higher numbers of earnings announcements, non-trading hours, or low turnover, to reveal their relation to investor underreaction to earnings news. However, we employ more direct measures, such as search volume, as searching is the action investors take when they pay attention to the firm. Although some prior studies, including Hou et al. [15], use turnover as the measure for investor attention, high (low) turnover may be caused by high (low) attention or other factors, such as extreme trading by a minority. Our robustness test using it shows that turnover does not have a practical influence on post-earnings-announcement drift, in contrast to our search frequency. The evidence indicates that search frequency is a more direct and better proxy for investor attention. These have been investigated by only some studies. Literature related to investor attention and search frequency does not separate trading by retail investors and others. They cannot reveal the direct reasons in the relation between search frequency and market reactions. However, we show in Korean stock markets, where, unusually, more retail investors participate, that the degree of their attention can affect stock prices more. Furthermore, our results of significant association between search volume and trading activity by investor type directly demonstrate whose attention search volume primarily indicates.
We contribute to the literature on the impact of investor attention on underreaction to public information and post-earnings-announcement drift. We directly reveal that investor attention captured by internet search frequency as an attention proxy leads to a lower delay in the reaction to the earnings announcement and for a period after the announcement. We also contribute to the emerging literature on the impact of internet technologies and the use of internet-based big data in capital markets. Moreover, our findings suggest that that this can be sustainable development in highly competitive stock markets for individual investors who are likely to be relatively inferior. Public information from simple internet technologies, such as searching or using big data that are available to all investors, are expected to improve retail traders’ investment and to lead sustainable and balanced trading in financial markets, and our results support this expectation.
Our research has certain limitations. Although associations between search volume and retail trading are shown, we do not identify that retail trading really causes abnormal stock returns on announcement dates. Further research should aim to analyze the relationships between searching activity and retail investors. In addition, we need to examine additional disadvantages when retail investors employ internet search volume in an extreme way as an investor herding behavior.

Author Contributions

Conceptualization, J.C. and R.K.; methodology, R.K.; software, R.K.; validation, J.C., R.K., and J.H.; formal analysis, R.K.; investigation, R.K.; resources, R.K.; data curation, R.K. and J.H.; writing—original draft preparation, R.K. and J.H.; writing—review and editing, R.K.; visualization, R.K.; supervision, J.C. and R.K.; project administration, R.K.; funding acquisition, J.C. and R.K. All authors have read and agreed to the published version of the manuscript.

Funding

This work was supported by the Ministry of Education of the Republic of Korea and the National Research Foundation of Korea (NRF-2020S1A5A8046351). This research is financially supported by the Institute of Finance and Banking and the Institute of Management Research at the Seoul National University.

Conflicts of Interest

The authors declare no conflict of interest.

References

  1. Kahneman, D. Attention and Effort; Prentice-Hall: Englewood Cliffs, NJ, USA, 1973. [Google Scholar]
  2. Peng, L.; Xiong, W. Investor attention, overconfidence and category learning. J. Financ. Econ. 2006, 80, 563–602. [Google Scholar] [CrossRef] [Green Version]
  3. Da, Z.; Engelberg, J.; Gao, P. In Search of Attention. J. Financ. 2009, 66, 1461–1499. [Google Scholar] [CrossRef]
  4. Ben-Rephael, A.; Da, Z.; Israelsen, R.D. It depends on where you search: Institutional investor attention and underreaction to news. Rev. Financ. Stud. 2017, 30, 3009–3047. [Google Scholar] [CrossRef]
  5. Merton, R.C. A simple model of capital market equilibrium with incomplete information. J. Financ. 1987, 42, 483–510. [Google Scholar] [CrossRef]
  6. Gervais, S.; Kaniel, R.; Mingelgrin, D.H. The high-volume return premium. J. Financ. 2001, 56, 877–919. [Google Scholar] [CrossRef] [Green Version]
  7. Barber, B.M.; Odean, T. All that glitters: The effect of attention the buying behavior of individual and institutional investors. Rev. Financ. Stud. 2008, 21, 785–818. [Google Scholar] [CrossRef] [Green Version]
  8. Hirshleifer, D.; Lim, S.S.; Teoh, S.H. Driven to distraction: Extraneous events and underreaction to earnings news. J. Financ. 2009, 64, 2289–2325. [Google Scholar] [CrossRef] [Green Version]
  9. Hirshleifer, D.; Lim, S.S.; Teoh, S.H. Limited investor attention and stock market misreactions to accounting information. Rev. Asset Pricing Stud. 2011, 1, 35–73. [Google Scholar] [CrossRef]
  10. Fang, L.; Peress, J. Media coverage and the cross-section of stock returns. J. Financ. 2009, 64, 2023–2052. [Google Scholar] [CrossRef]
  11. Bank, M.; Larch, M.; Peter, G. Google search volume and its influence on liquidity and returns of German stocks. Financ. Mark. Portf. Manag. 2011, 25, 239–264. [Google Scholar] [CrossRef]
  12. Loh, R.K. Investor inattention and the underreaction to stock recommendations. Financ. Manag. 2010, 39, 1223–1252. [Google Scholar] [CrossRef]
  13. DellaVigna, S.; Pollet, J.M. Investor inattention and Friday earnings announcements. J. Financ. 2009, 64, 709–749. [Google Scholar] [CrossRef] [Green Version]
  14. Francis, J.; Pagach, D.; Stephan, J. The stock market response to earnings announcements released during trading versus nontrading periods. J. Account. Res. 1992, 30, 165–184. [Google Scholar] [CrossRef]
  15. Hou, K.; Peng, L.; Xiong, W. A Tale of Two Anomalies: Attention for Price and Earnings Momentum. SSRN 2009. [Google Scholar] [CrossRef] [Green Version]
  16. Drake, M.S.; Roulstone, D.T.; Thornock, J.R. The determinants and consequences of information acquisition via EDGAR. Contemp. Account. Res. 2015, 32, 1128–1161. [Google Scholar] [CrossRef]
  17. Frieder, L.; Subrahmanyam, A. Brand perceptions and the market for common stock. J. Financ. Quant. Anal. 2005, 40, 57–85. [Google Scholar] [CrossRef]
  18. Gustavo, G.; Kanatas, G.; Weston, J.P. Advertising, breath of ownership, and liquidity. Rev. Financ. Stud. 2004, 17, 439–461. [Google Scholar]
  19. Thomas, C.; Yan, A. Advertising, Attention, and Stock Returns. SSRN 2009. [Google Scholar] [CrossRef] [Green Version]
  20. Seasholes, M.S.; Wu, G. Predictable behavior, profits, and attention. J. Empir. Financ. 2007, 14, 590–610. [Google Scholar] [CrossRef]
  21. Mondria, J.; Wu, T.; Zhang, Y. The determinants of international investment and attention allocation: Using internet search query data. J. Int. Econ. 2010, 82, 85–95. [Google Scholar] [CrossRef] [Green Version]
  22. Cziraki, P.; Mondria, J.; Wu, T. Asymmetric Attention and Stock Returns. Manag. Sci. 2020. [Google Scholar] [CrossRef]
  23. Vlastakis, N.; Markellos, R.N. Information demand and stock market volatility. J. Bank. Financ. 2012, 36, 1808–1821. [Google Scholar] [CrossRef]
  24. Drake, M.; Roulstone, D.T.; Thornock, J.R. Investor information demand: Evidence from google searches around earnings announcements. J. Account. Res. 2012, 50, 1001–1040. [Google Scholar] [CrossRef]
  25. Greenberger, M. Computers, Communication, and the Public Interest; Johns Hopkins Press: Baltimore, MD, USA, 1971; pp. 40–41. [Google Scholar]
  26. Guijarro, F.; Moya-Clemente, I.; Saleemi, J. Liquidity risk and Investors’ mood: Linking the financial market liquidity to sentiment analysis through Twitter in the S&P500 index. Sustainability 2019, 11, 7048. [Google Scholar]
  27. Da, Z.; Engelberg, J.; Gao, P. In Search of Earnings Predictability; Working Paper; University of Notre Dame: Notre Dame, IN, USA; University of North Carolina: Chapel Hill, NC, USA, 2010. [Google Scholar]
  28. Foster, G. Quarterly accounting data: Time-series properties and predictive ability results. Account. Rev. 1977, 52, 1–21. [Google Scholar]
  29. Foster, G.; Olsen, C.; Shevlin, T. Earning releases, anomalies, and the behavior of security returns. Account. Rev. 1984, 59, 574–603. [Google Scholar]
  30. Bernard, V.; Thomas, J. Post-earnings announcement drift: Delayed price response or risk premium? J. Account. Res. 1989, 27, 1–48. [Google Scholar] [CrossRef]
  31. Bernard, V.; Thomas, J. Evidence that stock prices do not fully reflect the implication of current earnings for future earnings. J. Account. Econ. 1990, 13, 305–340. [Google Scholar] [CrossRef] [Green Version]
  32. Dimpfl, T.; Jank, S. Can internet search queries help to predict stock market volatility? Eur. Financ. Manag. 2016, 22, 171–192. [Google Scholar] [CrossRef] [Green Version]
  33. Kim, R. An empirical study on the relation between search volume, investors trading, and stock returns. Korean J. Financ. Eng. 2018, 17, 53–85. [Google Scholar]
  34. Lee, K.T.; Lee, Y.J. A study of factors affecting post-earnings-announcement drift. Korean Account. Rev. 2008, 33, 61–101. [Google Scholar]
  35. Nah, C.K. Post Earnings announcement drift and time-series properties of quarterly earnings. Korean Account. Rev. 2008, 33, 111–139. [Google Scholar]
  36. Lee, H.J.; Choe, H. The effects of individual investor trading on post-earnings announcement drift. Korean J. Financ. 2012, 41, 393–436. [Google Scholar]
  37. Fama, E.F.; MacBeth, J.D. Risk return and equilibrium: Empirical tests. J. Political Econ. 1973, 81, 607–636. [Google Scholar] [CrossRef]
Figure 1. Cumulative abnormal returns for 10 SUE portfolios. This figure presents the cumulative abnormal returns summed over 70 trading days surrounding the earnings announcement date. Earnings announcements are assigned to deciles based on the standing of standardized unexpected earnings (SUE). SUE10 includes firms with the highest SUE ranking. The sample includes all stocks traded on KOSPI and KOSDAQ from January 2016 to July 2019.
Sustainability 12 09358 g001
Figure 2. Cumulative abnormal returns for three search volume portfolios. This figure presents the cumulative abnormal returns summed over 70 trading days surrounding the earnings announcement date. SUE10 includes firms with the highest SUE ranking. Panels (A) and (B) show the results for stocks in the ASV1 and ASV3 portfolios. ASV3 includes stocks with the highest abnormal search frequency.
Sustainability 12 09358 g002
Table 1. Variable definitions.
VariableDefinition
Variables for internet search frequency
SVAggregated search volume from NAVER DataLab based on stock name
ASVNatural log of SV on a given day minus the log of median SV during the previous two weeks
Variables related to post-earnings announcement drift
SUEDifference between announced earnings and the forecasted earnings divided by the standard deviation of the forecast errors in Foster (1977)
AbsSUEAbsolute value of the standardized unexpected earnings (SUE)
Variables related to stock price and trading activity
CARSize and market matched portfolio-adjusted cumulative return. Five size-matching portfolios are formed daily based on market capitalization within the KOSPI or KOSDAQ market
MadjRetMarket-adjusted return. Market returns are index returns on the market in which the stock is listed
AbsMadjRetAbsolute value of the market-adjusted return
LnTVNatural log of the number of shares traded multiplied by the its price
MadjLnTVNatural log of trading volume minus the natural log of average trading volume of all stocks in which the stock is listed
AbnLnTVAbnormal trading volume: Natural log of trading volume minus the natural log of the average trading volume over trading days [−20, −1] for a given day
TONumber of shares traded divided by the number of shares outstanding for the stock
MadjTOTurnover minus average turnover of all stocks in the market in which the stock is listed
AbnTOAbnormal turnover: Turnover minus the average turnover over trading days [−20, −1] for a given day
PrcHLThe highest price minus the lowest price divided by the closing price on a given day
Variables related to investors’ trading activity
LnTVjNatural log of the sum of buying and selling volume by investor j divided by 2, where j is a retail (retail), institutional (insti), or foreign (forg) investor
AbnLnTVP,jAbnormal buying (P = Long) or selling (P = Short) volume of investor j. Natural log of buying (selling) volume by investor j, minus the natural log of the average buying (selling) volume by investor j over trading days [−20, −1] of the announcement
TOjAverage number of shares bought or sold by investor j divided by the number of shares outstanding for the stock
AbnTOP,jAbnormal buying or selling turnover of investor j. Buying (selling) turnover of investor j minus the average buying (selling) turnover of investor j over trading days [−20, −1] of the announcement
NetTOlDifference between the number of shares bought and sold by investor j divided by the number of shares outstanding for the stock
Other variables
LnSizeNatural log of market capitalization
BMBook-to-market ratio, where the value of common equity is from the latest available accounting statement and the market value of common equity is the price times outstanding on the day
Ret[t−5, t−1]The one-week (five trading days) return prior to the day
Ret[t − 20, t − 6]The stock return between one month and one week prior to the day
σ[t−5, t−1]The standard deviation of the return estimated from daily returns for one week prior to the day
Table 2. Descriptive statistics.
MeanSTDQ1MedianQ3
SV0.0800.3830.0110.0230.052
ASV0.4030.4590.1030.2960.590
MadjRet0.1044.611−0.5120.0240.618
MadjRet0.0493.779−1.750−0.1201.530
AbsMadjRet2.4562.8720.7101.6503.210
MadjLnTV−1.2761.904−2.557−1.3120.006
MadjTO0.0030.067−0.015−0.0070.000
PrcHL5.0076.2172.5033.7865.707
LnSize12.0741.36311.13111.78012.669
BM1.0400.8020.4830.8541.377
LnTVretail11.3471.80010.12411.29412.552
LnTVinsti8.0443.7745.6548.56710.717
LnTVforg9.0362.2757.6018.90210.321
TOretail3.69413.2540.3560.9902.658
TOinsti0.1730.3620.0050.0530.196
TOforg0.2200.3490.0420.1110.261
RetM0.0300.852−0.3900.1000.545
This table reports the descriptive statistics on the main variables. The variables are defined in Table 1. TOj is rescaled by multiplying by 100. RetM is the daily market return. The sample period is from January 2016 to July 2019.
Table 3. Averages of the main variables in five search volume portfolios.
Panel A: Whole Sample Period
ALL STOCKSKOSPI StocksKOSDAQ Stocks
SV1SV2SV3SV4SV5SV5−SV1SV1SV5SV5−SV1SV1SV5SV5−SV1
SV0.0040.0110.0200.0400.2720.268 ***0.0040.3210.317 ***0.0040.2160.212 ***
(127.59) (81.18) (108.85)
MadjRet−0.112−0.147−0.1100.0260.3910.503 ***−0.1010.1870.288 ***−0.1200.6260.746 ***
(45.75) (21.57) (43.19)
AbsMadjRet1.2061.3711.6092.0122.6321.426 ***1.0452.0671.022 ***1.3183.2811.963 ***
(160.04) (95.02) (142.34)
MadjLnTV−5.901−3.700−2.647−1.709−0.5255.376 ***−5.036−0.6504.386 ***−6.508−0.3826.127 ***
(115.95) (78.75) (83.76)
MadjTO−0.014−0.014−0.011−0.0030.0230.037 ***−0.0070.0100.017 ***−0.0190.0380.057 ***
(138.79) (67.86) (125.17)
PrcHL2.8103.2893.7224.3955.0952.285 ***2.4803.9731.493 ***3.0426.3853.343 ***
(204.11) (111.92) (197.38)
LnSize11.25111.55211.89112.36013.4752.224 ***11.77614.3372.561 ***10.88212.4831.601 ***
(522.29) (408.59) (410.04)
BM1.3421.0160.8500.6880.672−0.670 ***1.5580.885−0.673 ***1.1820.427−0.756 ***
(−310.20) (−200.61) (−303.23)
LnTVretail18.79119.50620.04420.68221.7222.931 ***18.32221.9513.629 ***19.13221.4512.320 ***
(502.96) (496.68) (263.14)
LnTVinsti15.92116.38316.72417.42919.1483.228 ***15.50520.1194.613 ***16.35817.6071.249 ***
(260.33) (294.85) (67.84)
LnTVforg16.52617.28117.89118.63020.0393.513 ***16.16620.7894.622 ***16.77619.1382.362 ***
(474.93) (436.34) (243.36)
TOretail1.8281.8901.6081.9123.0741.246 ***0.6861.5860.901 ***2.6304.7832.153 ***
(22.06) (27.42) (20.78)
TOinsti0.0600.0670.0550.0570.0760.016 ***0.0190.0820.063 ***0.0890.069−0.020 ***
(13.63) (93.61) (−9.58)
TOforg0.1190.1450.1240.1490.1870.068 ***0.0520.1470.096 ***0.1670.2320.065 ***
(34.46) (36.96) (22.36)
This table reports the averages of the main variables for the five portfolios based on search frequency. In Panel A, the SV1 comprises stocks with the lowest search frequency, and the SV5 comprises stocks with the highest search frequency for all search data for the sample period. In Panel B, the ASV1 comprises stocks with the lowest abnormal search frequency, and the ASV5 comprises stocks with the highest abnormal search frequency for all data on the earnings announcement date. The variables are defined in Table 1. TOj is rescaled by multiplying by 100. The t-statistics are reported in parentheses. *, **, and *** indicate significance at the 10%, 5%, and 1% levels, respectively. The sample period is from January 2016 to July 2019.
Table 4. Averages of the variables in five earnings surprise portfolios.
All StocksKOSPI StocksKOSDAQ Stocks
SUE1SUE2SUE3SUE4SUE5SUE5−SUE1SUE 1SUE5SUE5−SUE1SUE1SUE5SUE5−SUE1
SUE−2.190−0.453−0.0110.4382.5704.760 ***−2.0252.9474.972 ***−2.3152.2774.592 ***
(12.23) (5.95) (18.69)
SV0.0970.0850.0880.0960.1450.048 *0.1670.2480.0800.0530.0710.018 *
(1.89) (1.40) (1.72)
ASV0.1390.1660.1420.2180.2120.0730.1900.2730.083 ***0.1800.170−0.010
(0.65) (4.34) (−0.05)
MadjRet−0.743−0.504−0.0980.3520.7451.488 ***−0.6530.8291.482 ***−0.7910.7491.539 ***
(13.71) (9.62) (10.24)
AbsMadjRet2.6482.4452.4362.4432.7090.0612.4612.5770.1162.7402.8110.072
(0.73) (0.97) (0.62)
MadjLnTV−2.356−2.147−2.562−2.460−2.646−0.290−2.666−2.5440.122−2.235−2.636−0.401
(−0.79) (0.22) (−0.82)
MadjTO0.0030.0010.0010.0020.003−0.000010.0060.006−0.00010.0020.002−0.0005
(−0.01) (−0.05) (−0.16)
PrcHL4.9074.5974.7334.7715.2830.376 ***4.3694.6870.318 **5.2345.7620.528 ***
(3.58) (2.19) (3.60)
lnSize12.14912.13212.22712.15112.2000.05112.84012.9540.114*11.67611.670−0.006
(1.36) (1.76) (−0.18)
BM0.9290.9520.9500.9400.921−0.0081.1591.123−0.0360.7800.775−0.005
(−0.47) (−1.18) (−0.26)
This table reports the averages of the variables for five earnings surprise quintiles. SUE1 comprises stocks with the smallest standardized unexpected earnings, and the SUE5 comprises stocks with the biggest standardized unexpected earnings. The variables are defined in Table 1. The t-statistics are reported in parentheses. *, **, and *** indicate significance at the 10%, 5%, and 1% levels, respectively. The sample period is from January 2016 to July 2019.
Table 5. Cumulative abnormal returns for extreme SUE deciles.
All StocksKOSPI StocksKOSDAQ Stocks
SUE1SUE10SUE10−SUE1SUE1SUE10SUE10−SUE1SUE1SUE10SUE10−SUE1
CAR[0, 0]−0.900 ***0.856 ***1.756 ***−0.776 ***0.876 ***1.653 ***−0.989 ***0.842 ***1.831 ***
(−8.84)(7.70)(11.65)(−5.15)(5.74)(7.71)(−7.19)(5.40)(8.79)
CAR[0, 1]−1.094 ***0.887 ***1.980 ***−1.008 ***0.907 ***1.915 ***−1.156 ***0.873 ***2.028 ***
(−8.40)(6.15)(10.19)(−5.67)(4.97)(7.51)(−6.28)(4.17)(7.27)
CAR[2, 61]−2.799 ***2.256 ***5.055 ***−1.761 **2.312 ***4.073 ***−3.541 ***2.217 ***5.758 ***
(−5.23)(4.00)(6.50)(−2.56)(2.99)(3.94)(−4.58)(2.80)(5.20)
CAR[0, 61]−3.903 ***3.121 ***7.024 ***−2.788 ***3.185 ***5.973 ***−4.701 ***3.076 ***7.777 ***
(−6.97)(5.34)(8.68)(−3.86)(3.95)(5.53)(−5.81)(3.76)(6.76)
This table presents the cumulative abnormal returns (CARs) of two extreme earnings surprise deciles. SUE10 includes firms with the highest standardized unexpected earnings. CAR[0, 0] is the announcement date abnormal return and CAR[t, T] is the cumulative abnormal return over the window [t, T] in trading days relative to the announcement date. Panel A shows the CARs of all stocks in the sample, and Panels B and C contain only the KOSPI and KOSDAQ stocks, respectively. The t-statistics are reported in parentheses. *, **, and *** indicate significance at the 10%, 5%, and 1% levels, respectively. The sample period is from January 2016 to July 2019.
Table 6. Cumulative abnormal returns of extreme SUEs by abnormal search volume tertile.
CAR[0, 1]CAR[2, 61]
SUE1SUE10SUE10−SUE1SUE1SUE10SUE10−SUE1
Panel A: All stocks
ASV1−0.679 ***−0.413 **0.266−2.424 **4.079 ***6.503 ***
(−4.14)(−2.28)(1.09)(−2.42)(3.42)(4.21)
ASV2−1.057 ***0.0021.059 ***−3.393 ***1.3004.693 ***
(−6.76)(0.01)(4.05)(−3.96)(1.45)(3.78)
ASV3−1.558 ***2.377 ***3.935 ***−2.516 ***1.808 **4.324 ***
(−4.75)(8.81)(9.34)(−2.71)(2.05)(3.33)
ASV3−ASV1−0.879 **2.790 ***3.668 ***−0.092−2.270 **−2.178 *
(−2.41)(7.60)(7.49)(0.07)(−2.55)(−1.70)
Panel B: KOSPI stocks
ASV1−0.545 **−0.3260.219−1.6723.828 **5.500 ***
(−2.12)(−1.49)(0.64)(−1.38)(2.36)(2.75)
ASV2−0.737 ***0.2941.031 ***−2.717 **2.193 **4.910 ***
(−3.37)(1.10)(3.02)(−2.51)(2.05)(3.18)
ASV3−1.793 ***2.162 ***3.955 ***−0.5871.4532.040
(−4.12)(6.23)(7.19)(−0.45)(1.11)(1.08)
ASV3−ASV1−1.248 **2.488 ***3.736 ***1.085−2.375 *−3.460 **
(−2.43)(5.29)(5.74)(0.61)(−1.93)(−2.00)
Panel C: KOSDAQ stocks
ASV1−0.758 ***−0.471 *0.288−2.867 **4.246 **7.113 ***
(−3.57)(−1.78)(0.86)(−2.02)(2.54)(3.26)
ASV2−1.347 ***−0.2161.132 ***−4.002 ***0.6334.635 **
(−6.09)(−0.68)(2.94)(−3.07)(0.47)(2.47)
ASV3−1.397 ***2.526 ***3.922 ***−3.812 ***2.053 *5.865 ***
(−3.00)(6.51)(6.51)(−2.98)(1.73)(3.33)
ASV3−ASV1−0.6382.996***3.635 ***−0.945−2.193 *−1.249
(−1.28)(5.68)(5.23)(−0.49)(−1.91)(−1.61)
This table presents the cumulative abnormal returns of two extreme earnings surprise deciles by abnormal search volume (ASV) tertiles. ASV tertiles are formed within SUE deciles based on quarterly sorts of abnormal search volumes. SUE10 includes firms with the highest standardized unexpected earnings. Firms in ASV3 have the highest abnormal search frequency. CAR[0, 1] is the two-day announcement cumulative abnormal return and CAR[2, 61] is the 60-day post-announcement cumulative abnormal returns. Panel A shows the CARs of all stocks in the sample, and Panels B and C contain only the KOSPI and KOSDAQ stocks, respectively. The t-statistics are reported in parentheses. *, **, and *** indicate significance at the 10%, 5%, and 1% levels, respectively. The sample period is from January 2016 to July 2019.
Table 7. CARs by earnings news and abnormal search volume: regression analysis.
CAR[0, 1],CAR[2, 61],
(1)(2)Positive SUE
(3)
Negative SUE
(4)
ASV0.208 ***−0.0961.048−0.021
(10.55)(−0.76)(1.07)(−0.02)
SUE0.198 ***−0.0511.452 ***0.482
(12.36)(−1.57)(3.87)(1.47)
SUE × ASV 0.029 ***−0.144 **0.005
(6.10)(−2.23)(0.09)
MadjRet 0.353 ***0.207 **
(3.68)(2.30)
AbsMadjRet 0.745 **0.480
(2.13)(1.58)
AbsMadjRet×ASV −0.110 **−0.081 **
(−2.36)(−2.10)
Madjto 1.636−73.750 **−40.532
(0.38)(−2.31)(−1.23)
Madjto × ASV −0.1806.791 *3.413
(−0.35)(1.88)(0.95)
PrcHL 0.124 ***0.210 *0.102
(5.43)(1.84)(0.77)
LnSize −0.903 ***−25.108 ***−25.936 ***
(−4.49)(−8.81)(−7.83)
LnSize × ASV −0.0090.0210.029
(−0.91)(0.28)(0.41)
BM 0.235 *5.505 **−0.088
(1.85)(2.46)(−0.04)
Ret[t−5, t−1] 0.472 ***0.020-0.015
(40.16)(0.32)(−0.26)
Ret[t−20, t−6] 0.00040.100 ***0.041
(0.08)(3.05)(1.32)
σ[t−5, t−1] −24.669 ***12.898−8.447
(−4.66)(0.56)(−0.37)
Constant−1.788 ***11.260 ***287.607 ***310.770 ***
(−16.58)(4.53)(8.05)(7.42)
Observations13,91113,90068096968
Day fixed effectsyesyesyesyes
Clusters (firms)1450145014501450
R20.0290.4580.1280.115
The table reports the results of panel regressions of earnings announcement and post-announcement cumulative abnormal returns on abnormal search volume, earnings surprise, and other control variables. The dependent variables are CAR[0, 1], the two-day announcement cumulative abnormal return, and CAR[2, 61], the 60-day post-announcement cumulative abnormal returns. SUE is the earnings surprise decile rank and ASV is the abnormal search volume decile rank. Other independent variables are defined in Table 1. Each model includes both firm- and day-fixed effects. Regressions (3) and (4) only use firms with positive and negative earnings surprises (SUE). The t-statistics adjusted for both heteroskedasticity and within correlation clustered by firm are reported in parentheses. *, **, and *** indicate significance at the 10%, 5%, and 1% levels, respectively. The sample period is from January 2016 to July 2019.
Table 8. Variation in abnormal search volume effect on earnings surprise by firm size.
SUE1SUE10SUE10−SUE1
CAR[0, 61]CAR[0, 1]CAR[2, 61]CAR[0, 61]CAR[0, 1]CAR[2, 61]CAR[0, 1]CAR[2, 61]
SmallASV13.625 *−0.4334.058 **7.383 ***−0.788 **8.172 ***−0.3554.113 *
(1.80)(−1.49)(2.05)(3.18)(−2.56)(3.51)(−0.83)(1.73)
ASV32.853−1.281 *4.135 **9.661 ***2.895 ***6.765 ***4.176 ***2.631
(1.44)(−1.88)(2.22)(4.50)(5.96)(3.24)(5.12)(1.09)
ASV3−ASV1−0.771−0.8480.0772.2773.683 ***−1.4064.531 ***−1.483
(−0.27)(−1.23)(0.03)(0.73)(6.02)(−1.50)(5.14)(−1.61)
MediumASV1−6.427 ***−0.533 ***−5.894 ***3.510 *−0.0383.548 *0.495 **9.442 ***
(−4.56)(−3.66)(−3.96)(1.71)(−0.14)(1.77)(2.49)(3.84)
ASV3−5.343 ***−1.622 ***−3.721 **3.058 **2.040 ***1.0183.6624.739 **
(−3.15)(−3.38)(−2.41)(2.11)(4.36)(0.77)(0.62)(2.34)
ASV3−ASV11.084−1.089 *2.173 *−0.4522.079 ***−2.531 *3.168 ***−4.704 **
(0.72)(−1.71)(1.69)(−0.16)(3.24)(−1.73)(6.08)(−2.15)
LargeASV1−7.344 ***−0.623 **−6.721 ***−0.791−0.354−0.4370.2696.285 ***
(−5.05)(−2.30)(−4.92)(−0.52)(−1.01)(−0.29)(0.62)(3.06)
ASV3−9.160 ***−1.854 ***−7.306 ***0.6112.264 ***−1.6534.118 ***5.653 ***
(−6.60)(−3.11)(−5.79)(1.47)(5.03)(−1.47)(5.62)(3.30)
ASV3−ASV1−1.816−1.231 *−0.5851.4022.618 ***−1.2173.850 ***−0.632
(−0.90)(−1.88)(−0.31)(0.70)(3.97)(−0.64)(4.22)(−0.29)
This table presents the cumulative abnormal returns of two extreme earnings surprise deciles by abnormal search volume (ASV) and firm size. The ASV tertiles are formed within SUE deciles based on quarterly sorts of abnormal search volumes, and firms are independently sorted into three groups based on market-cap. SUE10 includes firms with the highest standardized unexpected earnings. Firms in ASV3 have the highest abnormal search frequency. CAR[0, 1] is the two-day announcement cumulative abnormal return and CAR[2, 61] is the 60-day post-announcement cumulative abnormal returns. The t-statistics are reported in parentheses. *, **, and *** indicate significance at the 10%, 5%, and 1% levels, respectively. The sample period is from January 2016 to July 2019.
Table 9. Trading activity of extreme SUE deciles by abnormal search volume tertiles.
AbnLnTV[0, 1]AbnTO[0, 1]
SUE1SUE10SUE10−SUE1SUE1SUE10SUE10−SUE1
Panel A: All stocks
ASV1−0.917 ***−1.037 ***−0.120−0.018 ***−0.014 ***0.004
(−8.21)(−6.36)(−0.63)(−4.85)(−5.78)(0.93)
ASV2−0.292 *−0.0650.2270.0000.0020.002
(−1.67)(−0.63)(1.08)(0.09)(1.54)(1.12)
ASV30.811 ***1.124 ***0.3140.031 ***0.033 ***0.003
(5.43)(9.26)(1.64)(5.71)(7.61)(0.37)
ASV3−ASV11.728 ***2.162 ***0.4340.049 ***0.047 ***−0.001
(9.29)(10.80)(1.57)(7.47)(8.11)(−0.18)
Panel B: KOSPI stocks
ASV1−0.674 **−0.901 ***−0.226−0.001−0.006 ***−0.005
(−2.51)(−3.15)(0.58)(−0.19)(−3.18)(−0.86)
ASV30.972 ***1.290 ***0.318 *0.022 ***0.025 ***0.002
(6.38)(12.48)(1.79)(2.64)(4.16)(0.24)
ASV3−ASV11.646 ***2.190 ***0.5440.023 **0.031 ***0.007
(5.43)(8.38)(1.26)(2.31)(4.02)(0.63)
Panel C: KOSDAQ stocks
ASV1−1.060 ***−1.129 ***−0.069−0.028 ***−0.019 ***0.009
(−13.32)(−5.83)(−0.35)(−5.66)(−5.08)(1.40)
ASV30.701 ***1.011 ***0.3100.036 ***0.039 ***0.003
(3.06)(5.26)(1.04)(5.23)(6.38)(0.28)
ASV3−ASV11.761 ***2.140 ***0.3790.064 ***0.058 ***−0.006
(7.49)(7.49)(1.04)(7.63)(7.08)(−0.58)
This table presents the abnormal trading volume and abnormal turnover of two extreme earnings surprise deciles by abnormal search volume (ASV) tertiles. SUE10 includes firms with the highest standardized unexpected earnings. Firms in ASV3 have the highest abnormal search volume. AbnLnTV[0, 1] is the cumulative abnormal trading volume over days [0, 1] of the announcement. AbnTO[0, 1] is the two-day announcement cumulative abnormal turnover. Panel A includes the results from all stocks in the sample, and Panels B and C contain results for only the KOSPI and KOSDAQ stocks, respectively. The t-statistics are reported in parentheses. *, **, and *** indicate significance at the 10%, 5%, and 1% levels, respectively. The sample period is from January 2016 to July 2019.
Table 10. Trading activity response to abnormal search volume and earnings news: regression analysis.
Panel A: Panel RegressionsPanel B: Fama–MacBeth (1973) Regression
AbnLnTV[0, 1]AbnTO[0, 1]AbnLnTV[0, 1]AbnTO[0, 1]
ASV0.165 ***0.271 **0.003 ***0.028 ***0.177 ***0.313 ***0.002 ***0.021 ***
(12.68)(2.61)(6.50)(10.02)(11.74)(3.50)(4.11)(9.12)
SUE−0.008−0.032 *−0.001 ***0.001−0.012 **−0.042 ***−0.001 ***0.0001
(−0.91)(−1.84)(−4.52)(1.06)(−2.30)(−3.14)(−4.27)(0.26)
SUE × ASV 0.005 −0.0003 *** 0.006 ** −0.0002 *
(1.61) (−2.63) (2.63) (−1.70)
AbsSUE−0.014−0.002−0.0003−0.0003−0.006−0.005−0.0003−0.0002
(−1.17)(−0.11)(−1.00)(−0.62)(−0.98)(−0.28)(−1.45)(−0.65)
AbsSUE × ASV −0.003 0.00002 −0.001 0.00001
(−0.89) (0.17) (−0.23) (0.21)
MadjRet0.003−0.0050.002 ***−0.005 ***0.0090.0040.002 ***−0.004 ***
(0.25)(−0.39)(3.00)(−5.30)(1.39)(0.37)(4.23)(−7.52)
Madjret×ASV 0.0003 0.001*** 0.001 0.001***
(0.19) (5.79) (0.29) (6.89)
AbsMadjRet0.069 ***0.0340.003 ***−0.013 ***0.077 ***0.080 ***0.003 **−0.012 ***
(5.42)(1.53)(2.84)(−9.42)(5.36)(2.91)(2.30)(−6.39)
AbsMadjRet×ASV 0.005 0.002 0.0001 0.002***
(1.64) (1.35) (0.02) (6.51)
PrcHL0.149 ***0.169 ***0.004 ***0.004 ***0.150 ***0.146 ***0.004 ***0.004 ***
(9.99)(10.71)(6.21)(6.72)(10.10)(8.74)(5.98)(5.30)
LnSize−0.531−0.472 *−0.015 ***−0.00020.191 ***0.254 ***0.00010.009 ***
(−2.10)(−1.73)(−3.54)(−0.06)(6.30)(5.41)(0.19)(9.44)
LnSize×ASV −0.011 −0.002 *** −0.013 * −0.002 ***
(−1.31) (−10.31) (−1.92) (−10.18)
BM0.411 **0.416 **0.0010.0020.362 ***0.366 ***0.006 ***0.005 ***
(2.35)(2.38)(0.24)(0.51)(6.19)(6.17)(4.27)(3.81)
Ret[t-5, t-1]0.038 ***0.038 ***0.003 ***0.003 ***0.033 ***0.032 ***0.003 ***0.003 ***
(6.27)(11.71)(7.58)(6.83)(7.34)(6.90)(6.38)(5.72)
Ret[t-20, t-6]0.003−3.275−0.0003 **0.645 ***−0.001−0.001−0.0002−0.0001
(1.42)(−1.51)(−2.28)(4.91)(−0.39)(−0.40)(−0.88)(−0.51)
σ[t-5, t-1]−3.2400.0030.644 ***−0.0002−2.251−2.2160.747 ***0.723 ***
(−1.52)(1.62)(3.64)(−1.34)(−1.23)(−1.15)(3.64)(3.56)
Constant4.4623.8810.141 ***−0.021−4.241 ***−4.884 ***−0.045 ***−0.134 ***
(1.41)(1.15)(2.60)(−0.41)(−9.11)(−7.90)(−5.01)(−9.59)
Observations13,90013,90013,90013,90013,90013,90013,90013,900
Week fixed effectsyesyesyesyes
Clusters (firms)1450145014501450
R20.1650.1660.2840.3240.2460.2490.3240.364
This table presents the multivariate regression analysis of the effect of abnormal search volume on trading activity response to earnings news. The dependent variables are AbnLnTV[0, 1], which is the cumulative abnormal trading volume over days [0, 1] of the announcement, and AbnTO[0, 1], which is the two-day announcement cumulative turnover. The independent variables are defined in Table 1. Panel A reports the results of the panel regressions using the earnings surprise decile rank and the abnormal search volume decile rank. Each model includes both firm- and day-fixed effects. The t-statistics adjusted for both heteroskedasticity and within correlation clustered by firm are reported in parentheses. Panel B reports the results of the Fama–MacBeth (1973) cross-sectional regression, and the t-statistics are reported in parentheses. *, **, and *** indicate significance at the 10%, 5%, and 1% levels, respectively. The sample period is from January 2016 to July 2019.
Table 11. Investor trading response to abnormal search volume and earnings news.
j =RetailInstitutionForeigner
p =LongLongShortShortLongLongShortShortLongLongShortShort
(1)(2)(3)(4)(5)(6)(7)(8)(9)(10)(11)(12)
ASV0.358 ***2.802 ***0.352 ***2.781 ***0.008 ***−0.055 **0.015 *0.0160.018 ***0.0500.018 ***0.004
(5.11)(7.69)(5.07)(7.69)(3.37)(−2.41)(1.88)(0.18)(2.90)(0.72)(7.67)(0.23)
SUE−0.0690.040−0.0720.0340.002−0.004 *0.0100.00010.0060.0010.0030.005
(−1.41)(0.63)(−1.50)(0.54)(0.39)(−1.65)(1.00)(0.03)(0.75)(0.40)(0.90)(1.48)
SUE × ASV −0.021 −0.020 0.001 0.002 0.001 −0.0002
(−1.23) (−1.20) (1.51) (1.24) (0.75) (−0.28)
AbsSUE−0.031−0.004−0.029−0.0010.0010.0010.0090.0070.0070.0080.001−0.001
(−0.60)(−0.07)(−0.58)(−0.01)(0.50)(0.53)(0.94)(0.97)(0.90)(1.44)(0.18)(−0.19)
AbsSUE × ASV −0.005 −0.005 0.0001 0.001 −0.0002 0.0003
(−0.35) (−0.38) (0.14) (0.64) (−0.25) (0.34)
MadjRet0.138 **−0.410 ***0.142 **−0.409 ***0.001−0.001−0.003−0.010−0.0001−0.020 **−0.001−0.010 *
(2.28)(−3.49)(2.41)(−3.57)(1.11)(−0.18)(−1.26)(−1.05)(−0.07)(−2.36)(−0.30)(−1.76)
Madjret × ASV 0.069 *** 0.070 *** 0.0004 0.001 0.003 ** 0.001
(3.87) (4.02) (0.42) (0.55) (2.12) (1.51)
AbsMadjRet0.081−0.970 ***0.078−0.944 ***0.0050.008 *0.002−0.005−0.003−0.0060.002−0.011 *
(0.71)(−4.37)(0.69)(−4.40)(1.29)(1.73)(0.18)(−0.60)(−0.31)(−0.95)(0.56)(−1.66)
AbsMadjRet
× ASV
0.141 *** 0.028 −0.001 0.001 0.000 0.002
(4.87) (0.00) (−0.53) (0.50) (−0.02) (1.59)
PrcHL0.332 ***0.301 ***0.321 ***0.291 ***0.00030.0010.0040.0030.007 ***0.006 **0.010 ***0.010 ***
(4.67)(4.27)(4.65)(4.24)(0.26)(0.56)(0.80)(0.62)(2.88)(2.21)(3.73)(3.69)
LnSize−2.123 ***−0.828−2.141 ***−0.861−0.023−0.047 ***−0.053 *−0.045 *−0.090 ***−0.074 ***−0.044−0.045 *
(−3.27)(−1.28)(−3.36)(−1.36)(−1.40)(−3.64)(−1.71)(−1.84)(−2.85)(−3.18)(−1.57)(−1.70)
LnSize × ASV −0.214 *** −0.212 *** 0.005 ** −0.001 −0.003 0.001
(−7.82) (−7.82) (2.49) (−0.15) (−0.49) (0.58)
BM0.2090.2850.1990.274−0.015−0.015−0.037−0.0360.0080.0090.0190.020
(0.38)(0.55)(0.38)(0.55)(−1.18)(−1.15)(−1.07)(−1.04)(0.27)(0.32)(0.88)(0.92)
Ret[t−5, t−1]0.269 ***0.254 ***0.279 ***0.264 ***0.005 ***0.005 ***−0.001−0.0020.006 ***0.006 ***0.003 *0.003 *
(5.41)(5.16)(5.71)(5.46)(3.89)(4.22)(-0.57)(-0.72)(3.05)(3.03)(1.95)(1.80)
Ret[t−20, t−6]27.557 *27.121 *26.389 *26.108*−0.573 ***−0.504 ***0.2680.3220.0290.1860.4880.521
(1.78)(1.77)(1.74)(1.74)(−3.35)(−3.19)(0.50)(0.56)(0.07)(0.44)(0.99)(1.10)
σ[t−5, t−1]−0.050 ***−0.041 ***−0.049 ***−0.041 ***−0.001 **−0.001 *−0.0004−0.00040.0010.0004−0.0003−0.0002
(−3.68)(−2.90)(−3.67)(−2.91)(−2.04)(−1.84)(−0.77)(−0.55)(0.81)(0.52)(−0.61)(−0.45)
Constant23.169 ***8.69323.500 ***9.1560.3120.614 ***0.579 *0.544 *1.042 ***0.864 ***0.4990.520
(2.87)(1.09)(2.97)(1.17)(1.61)(3.82)(1.70)(1.66)(2.95)(2.89)(1.44)(1.58)
Observations13,88413,88413,88413,88413,88413,88413,88413,88413,88413,88413,88413,884
Week fixed
effects
yesyesyesyesyesyesyesyesyesyesyesyes
Clusters (firms)145014501450145014501450145014501450145014501450
R20.0550.0630.0560.0630.0040.0040.0010.0010.0030.0030.0090.009
This table presents the panel regression analysis of the effect of abnormal search volume on investors’ trading response to earnings news. AbnTOLong,j[0, 1] is the dependent variable in regressions (1), (2), (5), (6), (9), and (10); and AbnTOShort,j[0, 1] is the dependent variable in regressions (3), (4), (7), (8), (11), and (12), where j is a retail, institutional, or foreign investor. Coefficients are rescaled by multiplying 100. The independent variables are defined in Table 1. Each model includes both firm- and day-fixed effects. The t-statistics adjusted for both heteroskedasticity and within correlation clustered by firm are reported in parentheses. *, **, and *** indicate significance at the 10%, 5%, and 1% levels, respectively. The sample period is from January 2016 to July 2019.
Table 12. Abnormal search volume and earnings news portfolio returns.
Earnings Surprise Quintile
SUE1SUE2SUE3SUE4SUE5SUE5−SUE1
Panel A: All stocks
All0.7361.2520.9511.213 *1.378 *0.642 **
(0.99)(1.51)(1.30)(1.67)(1.91)(2.49)
ASV10.5920.7031.0320.5761.539 *0.947 *
(0.64)(1.30)(1.17)(0.65)(1.90)(1.81)
ASV21.0521.0790.5100.9371.0600.008
(1.38)(1.38)(0.67)(1.08)(1.20)(0.92)
ASV30.4041.6630.9701.207 *1.436 *1.032 **
(0.51)(1.53)(1.30)(1.82)(1.85)(2.04)
ASV40.7371.563 *0.7501.232 *1.643 **0.906
(0.97)(1.75)(0.98)(1.78)(2.16)(1.35)
ASV51.0380.7601.470 *0.832 **1.1310.093
(1.26)(0.95)(1.86)(2.41)(1.59)(0.79)
ASV1−ASV5−0.446 *−0.057−0.438 *−0.255 **0.408 *0.854 **
(−1.75)(−0.15)(−1.72)(−2.06)(1.78)(2.08)
Panel B: KOSPI stocks
ASV10.2840.5550.5371.0990.9620.678 *
(0.35)(1.14)(0.68)(1.03)(1.15)(1.70)
ASV50.4640.5021.1000.707 **0.6080.144
(0.64)(0.69)(1.28)(2.05)(1.20)(0.98)
ASV1−ASV5−0.1800.054−0.5630.3920.354 *0.534
(−1.01)(1.06)(0.66)(1.41)(1.66)(1.61)
Panel C: KOSDAQ stocks
ASV10.6030.8801.2260.4271.561 *0.958 *
(0.56)(1.29)(1.28)(0.43)(1.67)(1.79)
ASV51.3020.7541.370 *0.971 **1.081−0.221
(1.33)(0.68)(1.83)(2.23)(1.56)(−0.35)
ASV1−ASV5−0.6980.126−0.144−0.545 ***0.481 **1.179 **
(−1.57)(0.83)(−0.24)(−2.71)(1.98)(2.03)
At the end of each month from January 2016 to July 2019, we independently sort stocks into 5 × 5 groups based on their most recent quarterly earnings surprises within the last three months (SUE1–SUE5) and abnormal search frequency on the earnings announcement date (ASV1–ASV5). We calculate equally weighted returns of the resulting 5 × 5 portfolios during the following month. Within the abnormal search frequency rank (ASV), we form a hedge portfolio that is long on the good news portfolio (SUE5) and short on the bad news portfolio (SUE1) to exploit post-earnings-announcement drift. This table shows the monthly market-adjusted returns of each portfolio. The first row reports the market-adjusted returns of the portfolios based only on earnings news by equally weighting firms in each earnings surprise quintile. The last row reports the market-adjusted returns of the hedge portfolios long on the high-abnormal-search-frequency portfolio (ASV5) and short on the low-abnormal-search-frequency portfolio (ASV1) within each earnings surprise quintile. The t-statistics are reported in parentheses. *, **, and *** indicate significance at the 10%, 5%, and 1% levels, respectively.
Table 13. Robustness: CARs of extreme SUEs by market-adjusted turnover tertiles.
CAR[0, 1]CAR[2, 61]
SUE1SUE10SUE10−SUE1SUE1SUE10SUE10−SUE1
MadjTO1−0.724 ***0.2650.988 ***−2.146 **2.372 **4.517 ***
(−4.32)(1.26)(3.68)(−2.16)(2.34)(3.19)
MadjTO2−0.882 ***0.623 ***1.506 ***−3.075 ***2.954 ***6.029 ***
(−5.43)(3.30)(6.04)(−4.11)(3.38)(5.25)
MadjTO3−1.675 ***1.772 ***3.447 ***−3.170 ***1.4394.609 ***
(−5.36)(5.46)(7.65)(−3.11)(1.38)(3.16)
MadjTO3−MadjTO1−0.951 ***1.507 ***2.458 ***−1.024−0.9330.092
(−2.68)(3.90)(4.91)(−0.72)(−0.64)(0.06)
This table presents the cumulative abnormal returns of two extreme earnings surprise deciles by market-adjusted turnover (MadjTO) tertiles. MadjTO tertiles are formed within SUE deciles based on quarterly sorts of market-adjusted turnover. SUE10 includes firms with the highest standardized unexpected earnings. Firms in MadjTO3 have the highest market-adjusted turnover. CAR[0, 1] is the two-day announcement cumulative abnormal return and CAR[2, 61] is the 60-day post-announcement cumulative abnormal returns. The t-statistics are reported in parentheses. *, **, and *** indicate significance at the 10%, 5%, and 1% levels, respectively. The sample period is from January 2016 to July 2019.
Publisher’s Note: MDPI stays neutral with regard to jurisdictional claims in published maps and institutional affiliations.

