Article

Prediction of Cost Overrun Risk in Construction Projects

by
Edyta Plebankiewicz
* and
Damian Wieczorek
Division of Management in Civil Engineering, Faculty of Civil Engineering, Cracow University of Technology, 31-155 Kraków, Poland
*
Author to whom correspondence should be addressed.
Sustainability 2020, 12(22), 9341; https://doi.org/10.3390/su12229341
Submission received: 6 September 2020 / Revised: 3 November 2020 / Accepted: 9 November 2020 / Published: 10 November 2020

Abstract

:
The paper proposes a cost overrun risks prediction model, the structure of which is based on the fuzzy inference model of Mamdani. The model consists of numerous inputs and one output (MISO, multi-input-single-output), based on processes running consecutively in three blocks (the fuzzy block, the interference block, and the block of sharpening the representative output value). The input variables of the model include the share of element costs in the building costs (SE), predicted changes in the number of works (WC), and expected changes in the unit price (PC). The developed rule base makes it possible to determine the risk of cost overruns in the following categories: “very low”, “quite low”, “average”, “quite high”, and “very high”. Twenty-seven rules were assumed in the interference block. The operation of the model was illustrated by the example of selected elements of a road object and was validated by checking the correctness of the assumptions made at the design stage of the inference block rule base. It has been proven that with the increase of the share of element costs in the building costs (SE), predicted changes in the number of works (WC), and expected changes in the unit price (PC), the value of the risk exceeding the costs of a given element of the construction project (R) increases naturally and smoothly. It was emphasized in the conclusions that the cost overrun risks prediction model is intended for general contractors who subcontract many stages of works to their subcontractors in accordance with the agreed division into work elements.

1. Introduction

Cost overrun in construction projects are common, occurring under various market and legal conditions, unfortunately, often negatively influencing the achievement of project goals. Numerous research results indicate the scale of this problem. It is possible to define different types of construction investments that can be specified in various stages of its implementation. These investments are characterized by different technological, organizational, and economic specificity. On the other hand, in order to determine the risk of cost overruns of a given element of a facility, one should consider, for instance, the share of a given element in the total cost of the facility, the risk of changes in the number of works, as well as exposure of a given type of works to changes in the unit price, including the price of construction materials.
Three basic elements determine whether the implementation of a construction project is successful, namely obtaining the assumed quality parameters, maintaining the completion deadline, and keeping the assumed budget. The complex conditions related to the implementation of construction investments cause, in many cases, the assumed costs to be lower than those that must be incurred in reality. In such a case, one should aim at the smallest possible cost overrun. Knowing the conditions of the undertaking, one can also predict to some extent how high the risk is that the costs will be exceeded.
The aim of the paper is to present a model allowing to assess the risk of exceeding the costs of individual stages of a construction project, primarily on the basis of technological and economic conditions.
This paper is organized as follows. Section 2 contains literature review. Section 3 introduces the concept of cost overrun risks prediction model. Section 4 presents calculation example. Finally, Section 5 presents conclusions.

2. Literature Review

2.1. Definition of Cost Overrun

The notion of “cost overruns” is defined in a variety of ways in literature. For example, Hinze et al. [1] suggested that cost overrun is the difference between the original contract value and cost at practical completion. Derakhshanalavijeh [2] described project cost overrun as the positive difference between the actual cost upon project completion and the agreed estimation of the project budget. Harisaweni Flyvbjerg et al. [3] and Odeck [4] interpreted cost overrun as the difference between forecasted and actual construction costs. In this instance, the budget at the decision to build is used as the reference for determining the overrun that may be incurred and actual construction costs are defined as accounted construction costs at the time of project completion. This definition is applied in the present paper.

2.2. Scale Cost Overrun in Costruction

In many countries, attempts have been made to assess the scale of cost overruns in construction projects. Odeck [4] analyzed 420 road construction projects and found a mean cost overrun of 7.9% and a range of 59 to 183%. Using the contract award as the reference point, Love et al. [5] analyzed cost overruns from 276 construction and engineering projects. The research revealed a mean cost overrun of 12.22%. Andrić et al. [6] investigated the cost overruns in infrastructure projects in Asia. According their research, cost overruns are as common as cost underruns and the mean value of cost overrun (26.24%) is higher than cost underrun (−12.24%). Approximately, cost overruns in infrastructure projects in Asia decrease by 1% every year. Railway projects are more prone to cost overruns compared to roads and energy sector projects. Senouci et al. [7] in their study on the increase of term and cost in 122 construction contracts in Qatari showed that 54% had their costs increased and 72% their deadlines increased. Larsen et al. [8] established that more than half of Malaysian construction projects (55%) experienced cost overruns and that public sector projects performed better than private sector projects.
Studies presented in various articles indicate that the problem of cost increase is common to several countries and that the causes are recurrent.

2.3. Factors Influencing Cost Overrun

However, given the different market conditions, the weight of the factors influencing cost overruns may vary slightly between countries. Relevant studies have been carried out on this subject in many countries. Cantarelli et al. [9] investigated the causes of cost overruns in construction projects and categorized them into four main explanations for cost overruns: Technical, economic, psychological, and political. Specific examples of factors were identified for each of these categories. This division can be considered universal. In this context, the research proposed by Sdino et al. [10] presented an ecosystem perspective to estimate reclamation costs. The aim of the paper was to understand how to evaluate the compensation given by the provision of Ecosystem Services (ESs) in urban regeneration context when reclamation costs are necessary.
Flyvbjerg et al. [11], as a result of their research, concluded that cost escalation is influenced by the length of implementation period; in the case of bridges and tunnels, larger projects resulted in a higher percentage of cost overruns; and there was no significant impact between the type of ownership and cost performance of projects. Recently, Huo et al. [12] conducted research on the cost performance of mega transport projects in Hong Kong. One of the important conclusions of their research was that there was no significant statistical relation between project size and year of decision to build on cost overruns. According to [6], the key causes of cost overruns were the increasing cost of resources (construction materials, equipment, and labor), construction works, changes in design specifications, land acquisition and resettlement, and changes in currency exchange. Chen and Hu [13] identified the following main reasons of cost overruns: Delay in construction period, engineering quantity increase, and lack of technical skill and experience. Controlling them can effectively prevent risk propagation to avoid the cost overrun.
Niazi and Painting [14] presented corruption, late payment by the client, and financial difficulties on the part of the construction companies as the three main causes of the increase in construction costs in Afghanistan. Aziz et al. [15] in their study in works in Malaysia, found, in turn, that the main reasons for cost overruns were the variation of materials prices, cash flow, and financial difficulties on the part of the constructors. In [16], the authors concluded that the most significant cost overrun factor is schedule delay (47%). The second most significant factor was the improper planning and scheduling (47%). Frequent design changes (45%) and frequent changes to the scope of work (43%) were observed as the third and fourth most significant factors. Inaccurate time and cost estimates of project (42%) was the fifth significant factor.
In [17], the authors identified and analyzed 44 factors affecting cost overrun, 11 of which have a decisive influence. These include: Financial condition of the owner, cash flow of contractor, method of procurement (open tender or selective tender), material cost increase due to inflation, competition at tender stage (aggressive or not), fluctuations in the currency that the payment will be made in, project size (small or large), delay in design and approval, risk retained by client for quantity variations, drawings (detailed or not), and inaccurate material estimating.
Numerous authors also analyzed cost overrun factors from the point of view of various participants of the investment process. The study of [18] showed the point of view of 47 professionals in the construction area, with many years of experience and experience in works of various sizes throughout 16 states of Brazil. The result of project managers group shows that customer is the major causer in cost overrun of the work and secondly the production department. On the other hand, the group of area managers understands that the production department are the main responsibility for the increase of costs and secondly the client. The result of the directors is more related to internal factors of planning, control, and monitoring, and therefore they understand that the department of planning and cost control is the main cause of the cost overrun in the works and secondly the department of budget, with the client in fifth place.
The study of Larsen et al. [19] evaluated the effect of 26 factors on the time, cost, and quality of public construction projects, seen from the publicly employed project manager’s perspective. The factors with the greatest effect on budget were identified as errors or omissions in the consultant material, errors or inconsistencies in project documents, late user changes affecting the project or function, lack of preliminary examination before design or tendering, and inexperienced or newly qualified consultants. The research by Shehu et al. [8] explored the construction cost performance of projects in terms of public and private sectors, new build vis-a-vis refurbishment, based on procurement methods, tendering methods, nature of project and project size. Analysis based on procurement and tendering methods suggests that design and build was associated with reduced cost overrun, followed by traditional then project management; whereas, selective tendering experienced 48% cost overrun above 0%, followed by negotiated method (52%) then open method (60%). Health projects and commercial projects performed best in terms of being completed to contract sum, while educational projects were worst in this respect (2%).
Many studies revealed that most cost overruns occur in the planning stages up to the final design [2,20]. They are related to design changes and tend to increase in the amount of inputs needed because of technical and administrative problems [21].

2.4. Cost Overrun Models in Construction

Another extremely important issue raised in the literature is the possibility of predicting the risk of cost overruns and the amount of such overruns. To solve this problem, researchers used, among other means, statistical methods, such as multiple regression analysis (MRA) [22,23]; a regression and ANN models [24,25]; case-based reasoning (CBR) [26,27,28]; and fuzzy sets [29,30,31].
Fidan et al. [32] demonstrated a formal ontology for relating risk and vulnerability to cost overrun. Validation tests provide evidence that although the level of vulnerability may be different among contractors from different parts of the world and magnitude of risk may differ from project to project, the components and attributes of risk and vulnerability are believed to be generic enough to make the ontology applicable for all contractors, regardless of the country of origin. The scope of the ontology is limited to cost overrun estimation. The outcome of the prediction model will be the basic input of a multiagent system that will be used to decide on sharing of risks by referring to sources of risk, contract clauses, and the short-and long-term objectives of parties in a given project. Validation tests also provide evidence that the ontology successfully relates risk and vulnerability with cost overrun.
In the research [33], a methodology for risk rating of international construction projects was proposed. In the proposed methodology, a fuzzy risk rating approach is utilized together with influence diagramming method for risk identification. Influencing factors and interactions between these factors can easily be modelled by influence diagrams. The fuzzy risk rating process is computerized and risk knowledge gathered from the experts is used as an input to the decision support tool. If the tool is used for many projects, a relation between the risk rating calculated at the start of the project and the actual cost overrun value may be found.

3. Cost Overrun Risks Prediction Model Proposal

3.1. Main Assumptions of the Model and Reasons for Choosing the Theory of Possibilities for Its Construction

The literature considers factors influencing the cost overrun of the entire construction investment, described in Section 2.3 of the paper. The idea of the proposed model assumes, in turn, the analysis of individual works included in the investment. The authors’ practice and experience show that the factors selected for the analysis have the greatest direct impact on the cost change of individual investment elements. At the same time, they take into account a number of factors that, according to the literature, affect the cost overrun of the entire investment.
The numerous scientific and research works presented so far focus mainly on factors influencing cost overruns and predicting such overruns, taking into account the conditions of the whole particular investment. The results obtained here are usually rather approximate. More accurate data can be obtained by analyzing individual stages (elements) of the investment. Each of them has its technological, organizational, and economic specificity. Therefore, considering them independently may facilitate the analysis of factors influencing the incurred costs and allow for greater precision in determining the risk of cost overruns.
One of the factors influencing the increase of planned costs, when considering individual elements, is the share of a given element in the total cost of a facility. The higher the share, the potential changes in costs, even to a small extent, may significantly affect the overrun cost of a facility. Another factor taken into account is the risk of changes in the number of works. It is a factor that involves both the stage of investment preparation, including the manner and quality of the prepared design documentation, but also the specificity of a given type of works. For example, earthworks, even with properly prepared design documentation, are characterized by a higher risk of changing the scope and quantity of works than, for instance, construction works. The last factor mainly takes into account market conditions, namely the exposure of a given type of works to changes in the unit price, including, for example, the price of construction materials. Thus, the main factors influencing the level of risk of exceeding the costs of a given stage (element of works) are as follows: Share of element costs in the building costs (SE), predicted changes in the number of works (WC), and expected changes in the unit price (PC).
It should be emphasized here that while share of element costs in the building costs (SE) is a measurable factor, predicted changes in the number of works (WC) and expected changes in the unit price (PC) are associated with a high degree of subjectivity. Therefore, the authors point out that when assessing these factors, the decision maker should take into account in case of:
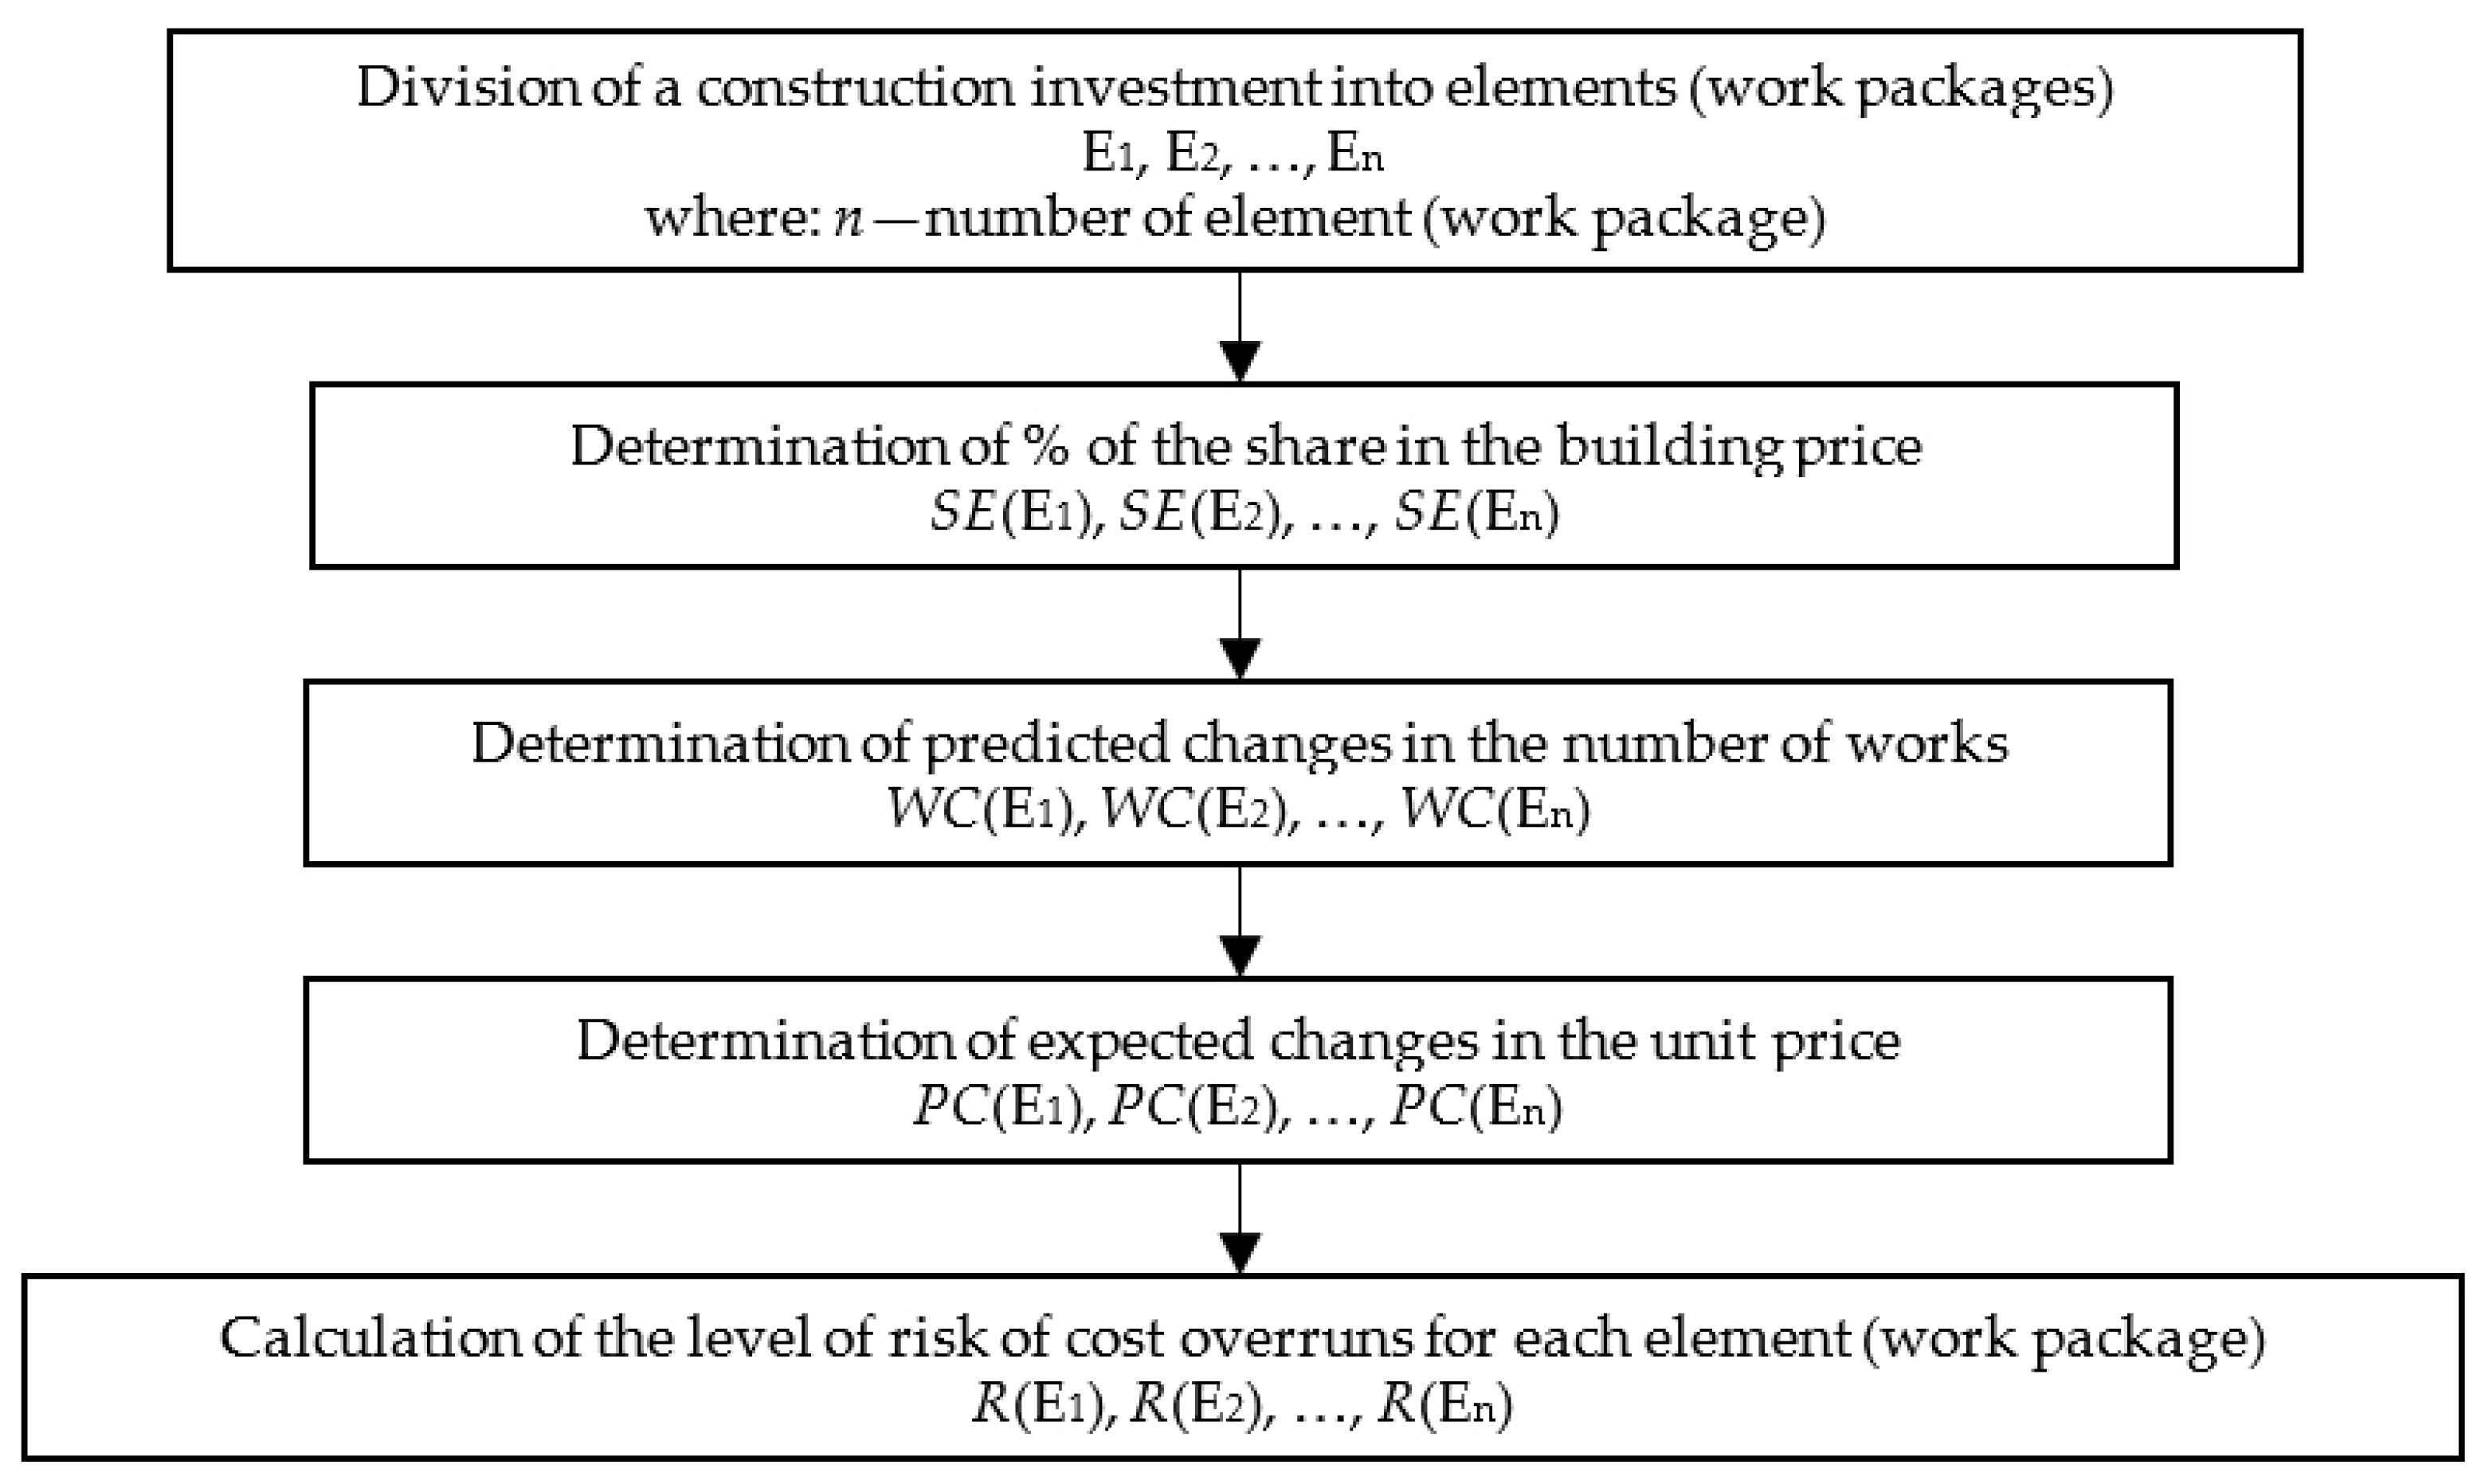
  • Predicted changes in the number of works (WC)—type of works; quality of design documentation for the works under consideration and experience of the contractor (subcontractor) in the implementation of works because experience has shown that e.g., earthworks are highly exposed to a change in their quantity,
  • Expected changes in the unit price (PC)—market situation; data from the information guides indicating trends in changes in unit prices of works; data from the brochures indicating trends in changes in the prices of materials necessary for the completion of a given type of work.
For the construction of the model, the theory of possibilities was chosen, because, as Knight [34] notes, risk is associated with the so-called measurable uncertainty. The measurable nature of uncertainty results from the fact that risk is quantifiable and can be directly translated into the parameters necessary, for example, to determine the risk of cost overruns.
Two ways of describing measurable uncertainty are commonly used. These are the theory of probability (probability distributions) and the fuzzy sets theory (the so-called possibility distributions). According to [33,35,36,37]:
  • The developed concepts of risk quantification, which concern (in general) investment projects, assume a probabilistic description of the uncertainty of the parameters necessary to carry out a risk assessment, but this assumption is not correct in all cases,
  • In practice, it is often the case that an expert assessing a risk does not have a sufficient amount of data to perform statistical studies that would result in a probability distribution, and therefore determines subjectively the value of the parameters needed to assess the risk,
  • There are a number of cases where the nature of the uncertainty of the parameters necessary to assess the risk cannot be linked to a probability account because they are linked to a unique, often one-off event,
  • The most natural description is the one describing the uncertainties of the parameters necessary for risk assessment by means of linguistic variables (phenomena described verbally), which may correspond to expert estimates categorized as the most favorable, average, and the worst variants of a given parameter.
Taking into account the above arguments, it was assumed that the structure of the cost overrun risks prediction model will be based on the theory of possibility and thus on the logical process of fuzzy inference.
The model was developed with the use of fuzzy inference model of Mamdani. This model was used to build models of fuzzy inference about the risk in terms of assessing the impact of many, simultaneously influencing risk factors, such as ones having an impact solely on the cost of construction investments [33], as well as in the context of the time and cost overrun of their implementation [38], as well as time, cost, and impact on the quality and other technical considerations of construction projects [39,40]. Fuzzy inference model of Mamdani was also used to assess technological, financial, political, environmental, and legal risk factors in the life cycle of construction works [41].
Cost overrun risks prediction model is a model with multiple inputs and one output (MISO, multi-input-single-output). Share of element costs in the building costs (SE), predicted changes in the number of works (WC), and expected changes in the unit price (PC) are the input variables of the model (variables x1, x2, and x3, respectively). The level of risk of exceeding the costs of a given element of the construction project (R) is an output variable (y). The operation of the model is based on processes that run sequentially in three blocks, that is in the fuzzyfication, inference, and defuzzyfication block.

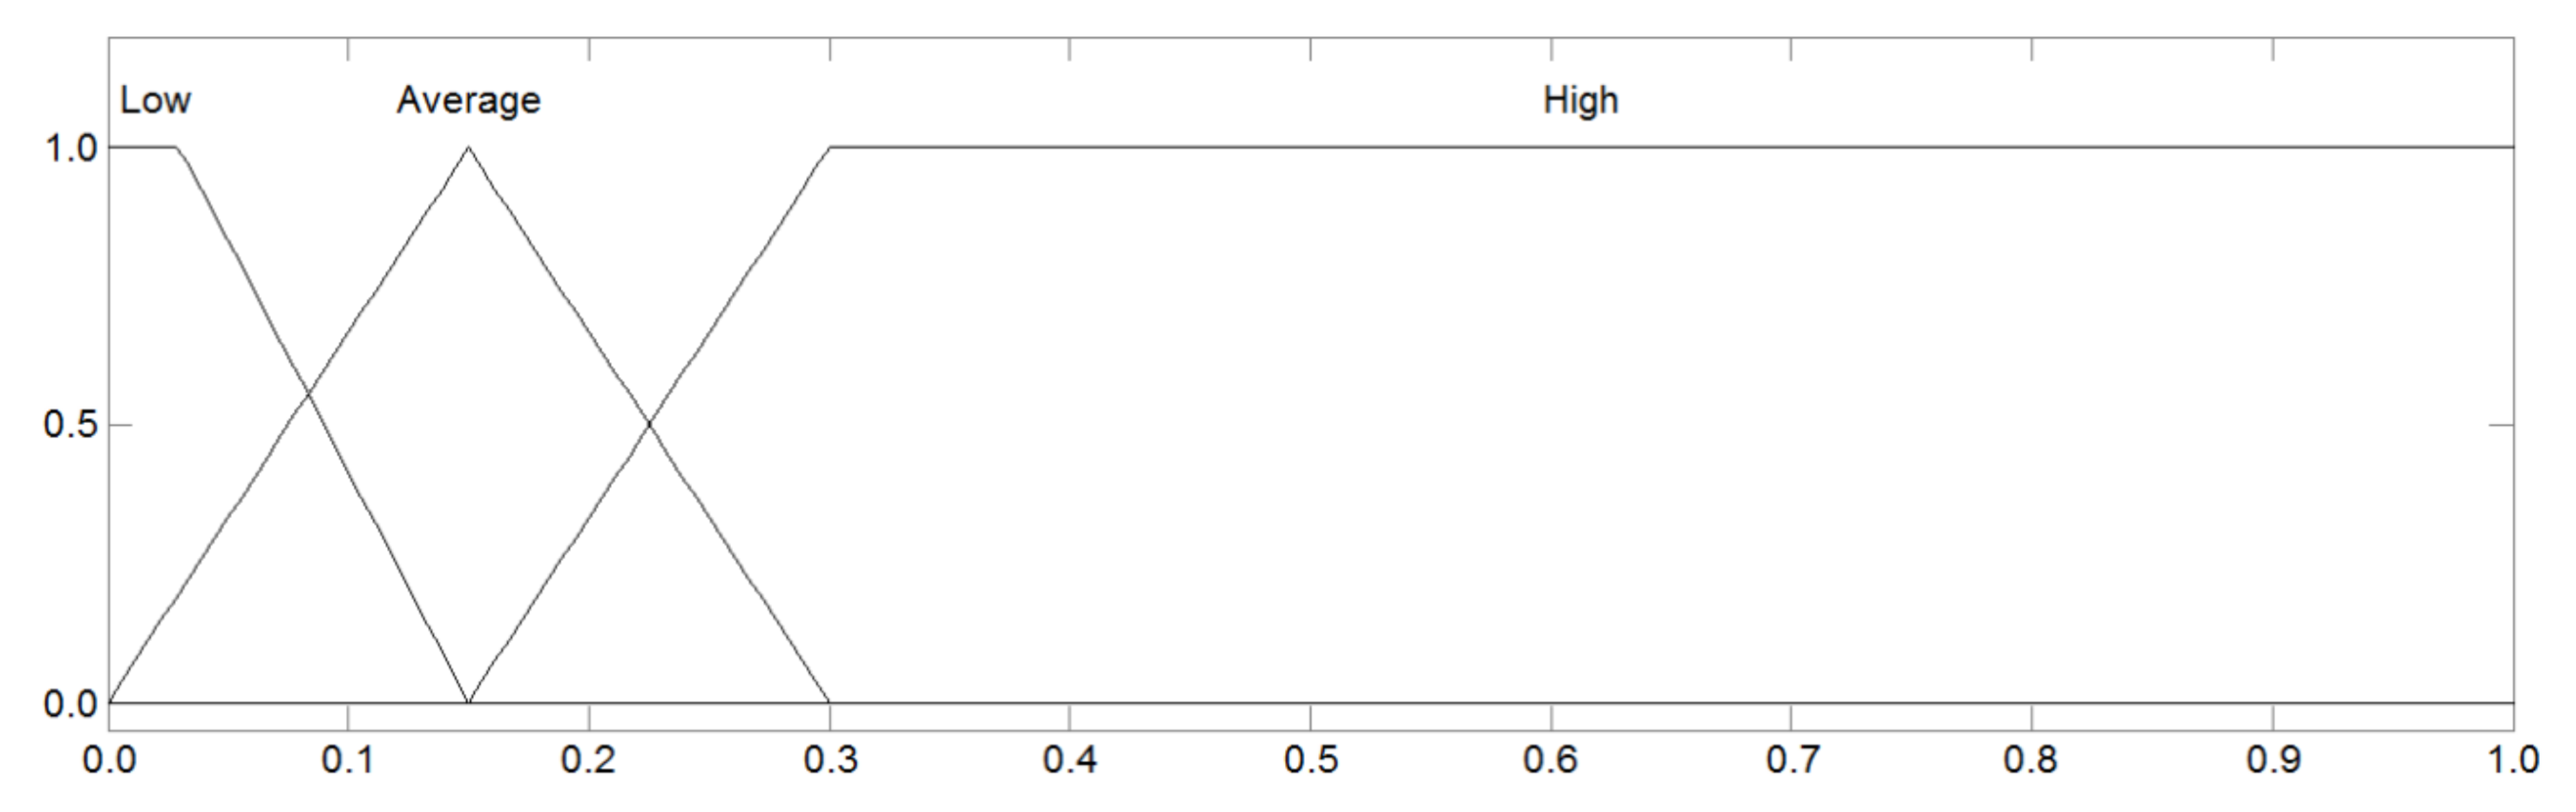
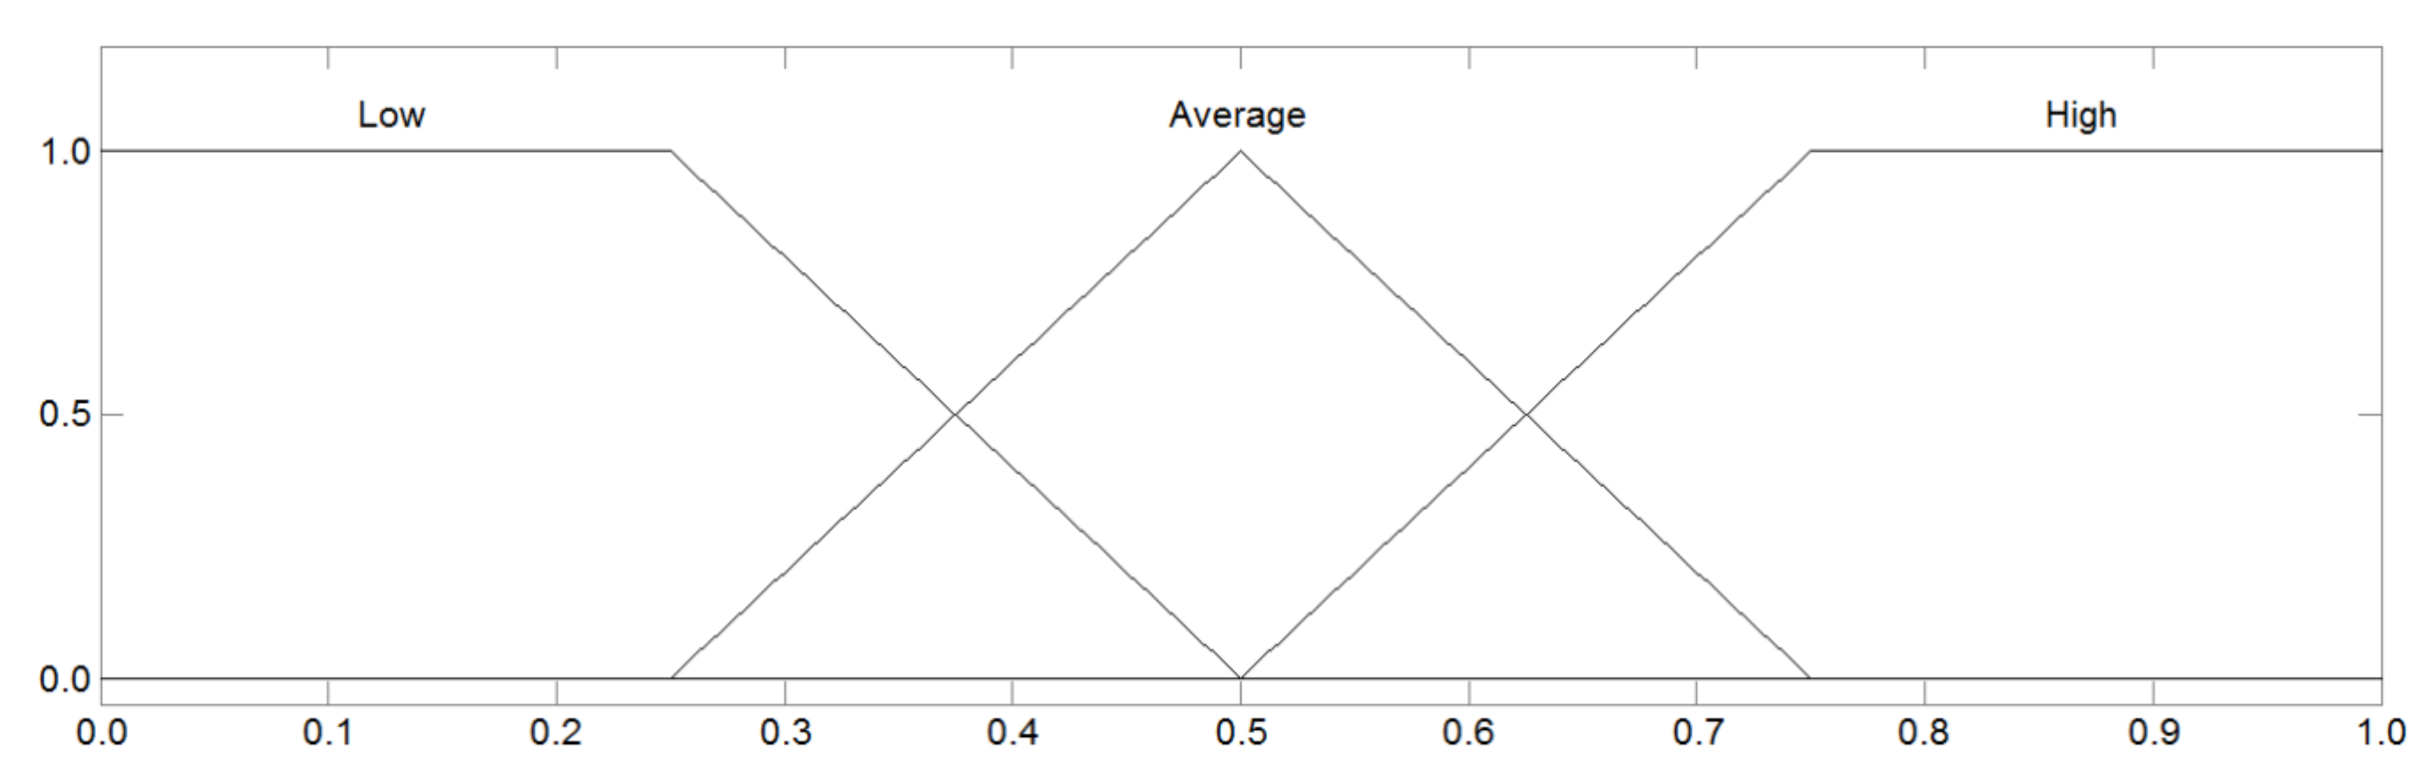
3.2. Block of Fuzzyfication

Input variables (SE, WC and PC) were described with the appropriate linguistic terms in the spaces of reflection X1, X2 and X3, and the range of these spaces was set as a percentage [0; 100%] but in the decimal notation [0.0; 1.0]. When defining spaces of reflection X, for all variables described by linguistic terms, it was assumed that the adjacent fuzzy sets (representing consecutive linguistic terms) would overlap. This assumption is taken after Hovde and Moser [42], who noticed (and supported their observations with numerous computational examples) that only in such a case a favorable conclusion effect is obtained.
Table 1 and Table 2 present sets of linguistic terms L(X1), L(X2), and L(X3) for input variables (SE, WC, and PC). The descriptions of the linguistic terms include a set of membership functions created by functions with segmental line diagrams, that is triangular functions and classes Γ and L. Qualitative definition (selection membership function types), as well as quantitative definition (selection of parameter values characterizing the function curves), made it possible to precisely determine the degrees of membership of individual fuzzy sets, which are described in the tables using four numbers {α1, α2, α3, α4}. These parameters represent, respectively, the ranges for achieving membership values 1.0 {α2, α3} and the left or right widths of the distribution of membership functions to value 0.0 {α1, α4}.
Figure 1 and Figure 2 present graphical interpretations of the spaces of reflection of input variables. These interpretations accurately reproduce the fuzzy sets described in Table 1 and Table 2 for all three fuzzy sets of linguistic values (high, average, and low).

3.3. Block of Inference

The main task of the inference block in the Mamdani fuzzy inference model of the MISO type is to use the degree of membership to calculate the values of the sharp input variables μ(x1), μ(x2), and μ(x3) for each fuzzy sets of linguistic values, the resulting membership function for output variable μ(y). This function often has a complex shape, and its calculation is performed by means of the so-called inference. The inference block is made up of two basic elements, namely the rule base and the interference mechanism whose operation is based on three consecutive mathematical operations: Aggregation of simple premises, the implications of fuzzy inference rules, and aggregation of the conclusions of all rules.
The developed base of rules in the cost overrun risks prediction model is of a conjunctive nature due to the “and” operator used in the conditional sentences, which combines all three simple premises. Five resultant conclusions have been proposed, which inform about the calculated risk of cost overruns: “very low”, “quite low”, “average”, “quite high”, and “very high”. An example of a fuzzy relationship (FR) in cost overrun risks prediction model (the MISO model) is as follows:
F R 3 :           I f   S E   i s   low   A n d   W C   i s   low   A n d   P C   i s   high   T h e n   R   i s   Quite   low
While designing the rule base, the authors assumed that with the increase in the share of element costs in the building costs (SE), predicted changes in the number of works (WC), and expected changes in the unit price (PC), there would be a natural and smooth increase in the risk of exceeding the costs of a given construction project element (R). To do so, it was decided to examine the quantities of the products of all combinations of input variables in a set of all 27 possible rules, and then to assign the results obtained to 5 possible result conclusions on the assumption that the minimum quantities would correspond to the “very low” conclusion, the maximum ones to the “very high” conclusion, while intermediate ones to are proportionately and adequately covered by conclusions “quite low”, “average”, and “quite high”. The following weights were assumed for the linguistic terms of the input variables SE, WC, and PC: 1 for “low”, 2 for “average”, and 3 for “high”.
Table 3 shows the rule base of the inference block. It consists of 27 rules for which equal degrees of fuzzy relationship validity (FR) of 1.0 were adopted.
In the inference block, deriving from the rule base, the processes of aggregation of premises and aggregation of rule conclusions are performed.
Aggregation of simple premises consists in calculating the degree of membership (truthfulness) of the fuzzy rule created by these premises. The degree of truthfulness is understood here as the degree of membership to a given relationship (FR) of the fuzzyfied sharp values of input variables (x1, x2 and x3). Due to the fact that in the conditional sentences the logical conjunction “and” was used, which in fuzzy logic is represented by the concept of intersection (product) of the fuzzy sets, the operation of premise aggregation was reduced to searching for the value of the degree of membership to the fuzzy relationship (FR). This value was determined by applying the selected fuzzy implication rule (the so-called T-norm formula). In the cost overrun risks prediction model, the basic T-norm of Mamdani was proposed, the calculation formula of which is as follows:
T M = m i n μ x 1 , μ x 2 , μ x 3
where the degree of affiliation (FR) is 0, the rule is not triggered, and is not involved in the interference process.
The final stage of the inference block is the aggregation of the conclusions of all the running fuzzy rules (the so-called output aggregation). This action consists of summing up the conclusions of activated rules, which are responsible for the shape of the resulting membership function μ(y). The algorithm for proceeding at this stage is such that, in the first step, the modified membership functions of the fuzzy sets of the output variable for the rules involved in the inference are determined separately, and then these fuzzy sets are summed up based on one of the formulae on S-norm. In the cost overrun risks prediction model, a basic S-norm of Mamdani was proposed, the calculation formula of which is as follows:
S M = m a x μ x 1 , μ x 2 , μ x 3
The output variable (y) was described in space Y. The range of Y spaces was set in percentage [0; 100%] but in decimal notation [0.0; 1.0], namely in the same was as for all X spaces of input variables. The set of linguistic terms in space Y includes five fuzzy sets corresponding to the resulting conclusions in the rule base: “very low”, “quite low”, “average”, “quite high”, and “very high”.
The fuzzy sets for extreme, firm (“very low” and “very high”) and internal, intermediate (“average”) conclusions were attempted to be parameterized in such a way that the charts of the membership functions did not permeate each other, but were continuous over the full range of space Y. For internal, relative (“quite low” and “quite high”) conclusions, the same was done, but the fuzzy sets were written between extreme (firm) and internal (intermediate) conclusions, respectively (and symmetrically). The parameterization was performed in such a way that adjacent fuzzy sets overlapped with a degree of membership for intermediate elements of μ(0.2) = μ(0.4) = μ(0.6) = μ(0.8) = 0.5.
Table 4 illustrates the set of linguistic terms L(Y) for the output variable (y). The membership of all the fuzzy sets is determined in the same way as for the input variables, that is by means of four numbers (parameters α).
Figure 3 presents a graphical interpretation of the space of reflection of the output variable (y), which accurately reproduces the sets of fuzzy output conclusions described in Table 4.
Figure 4 shows charts of the relationship between the input variables (SE—left and PC—right) and the output variable (R) for the cross-section in which the other input variables are 0.5. The charts confirm that the principle adopted for the purpose of building the base of rules, that with the increase of the share of element costs in the building costs (SE), predicted changes in the number of works (WC), and expected changes in the unit price (PC), the value of the risk level of exceeding the costs of a given element of the construction project (R) will naturally and smoothly increase, which was correctly realized in the cost overrun risks prediction model.

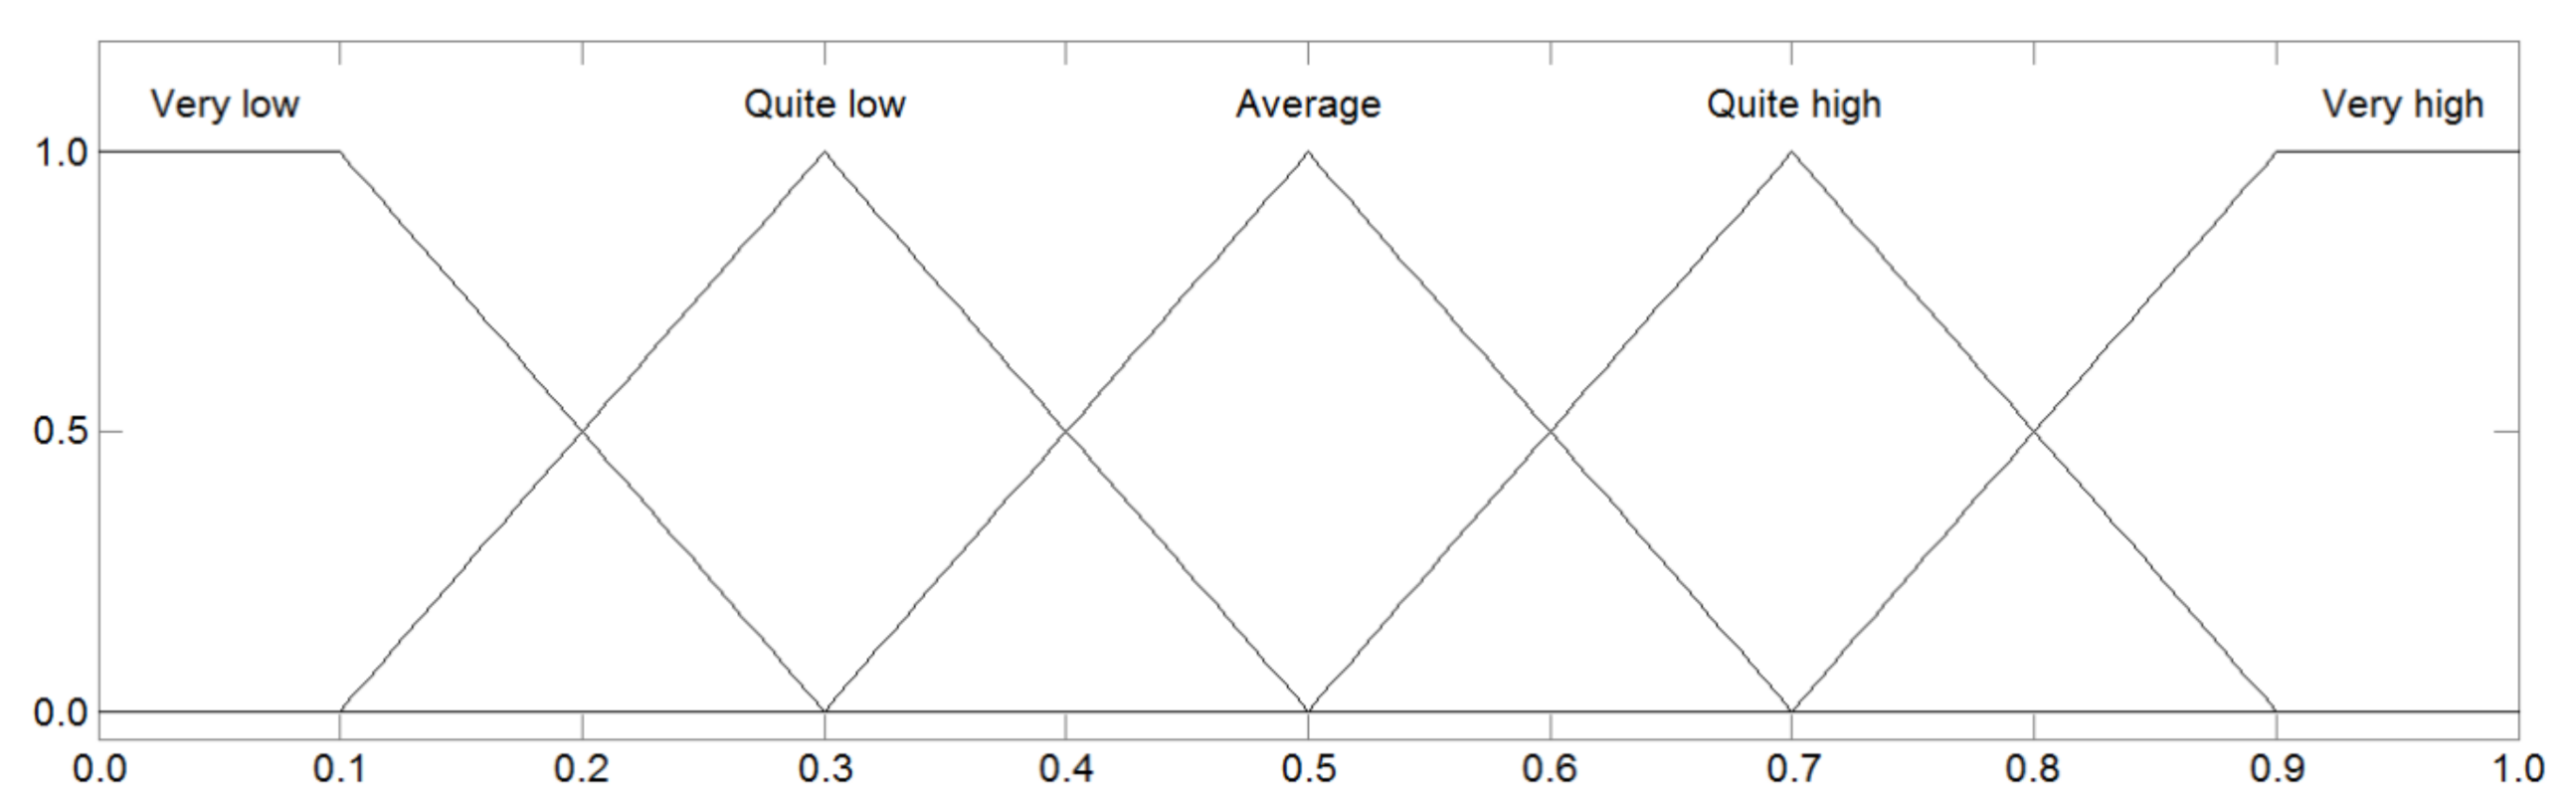
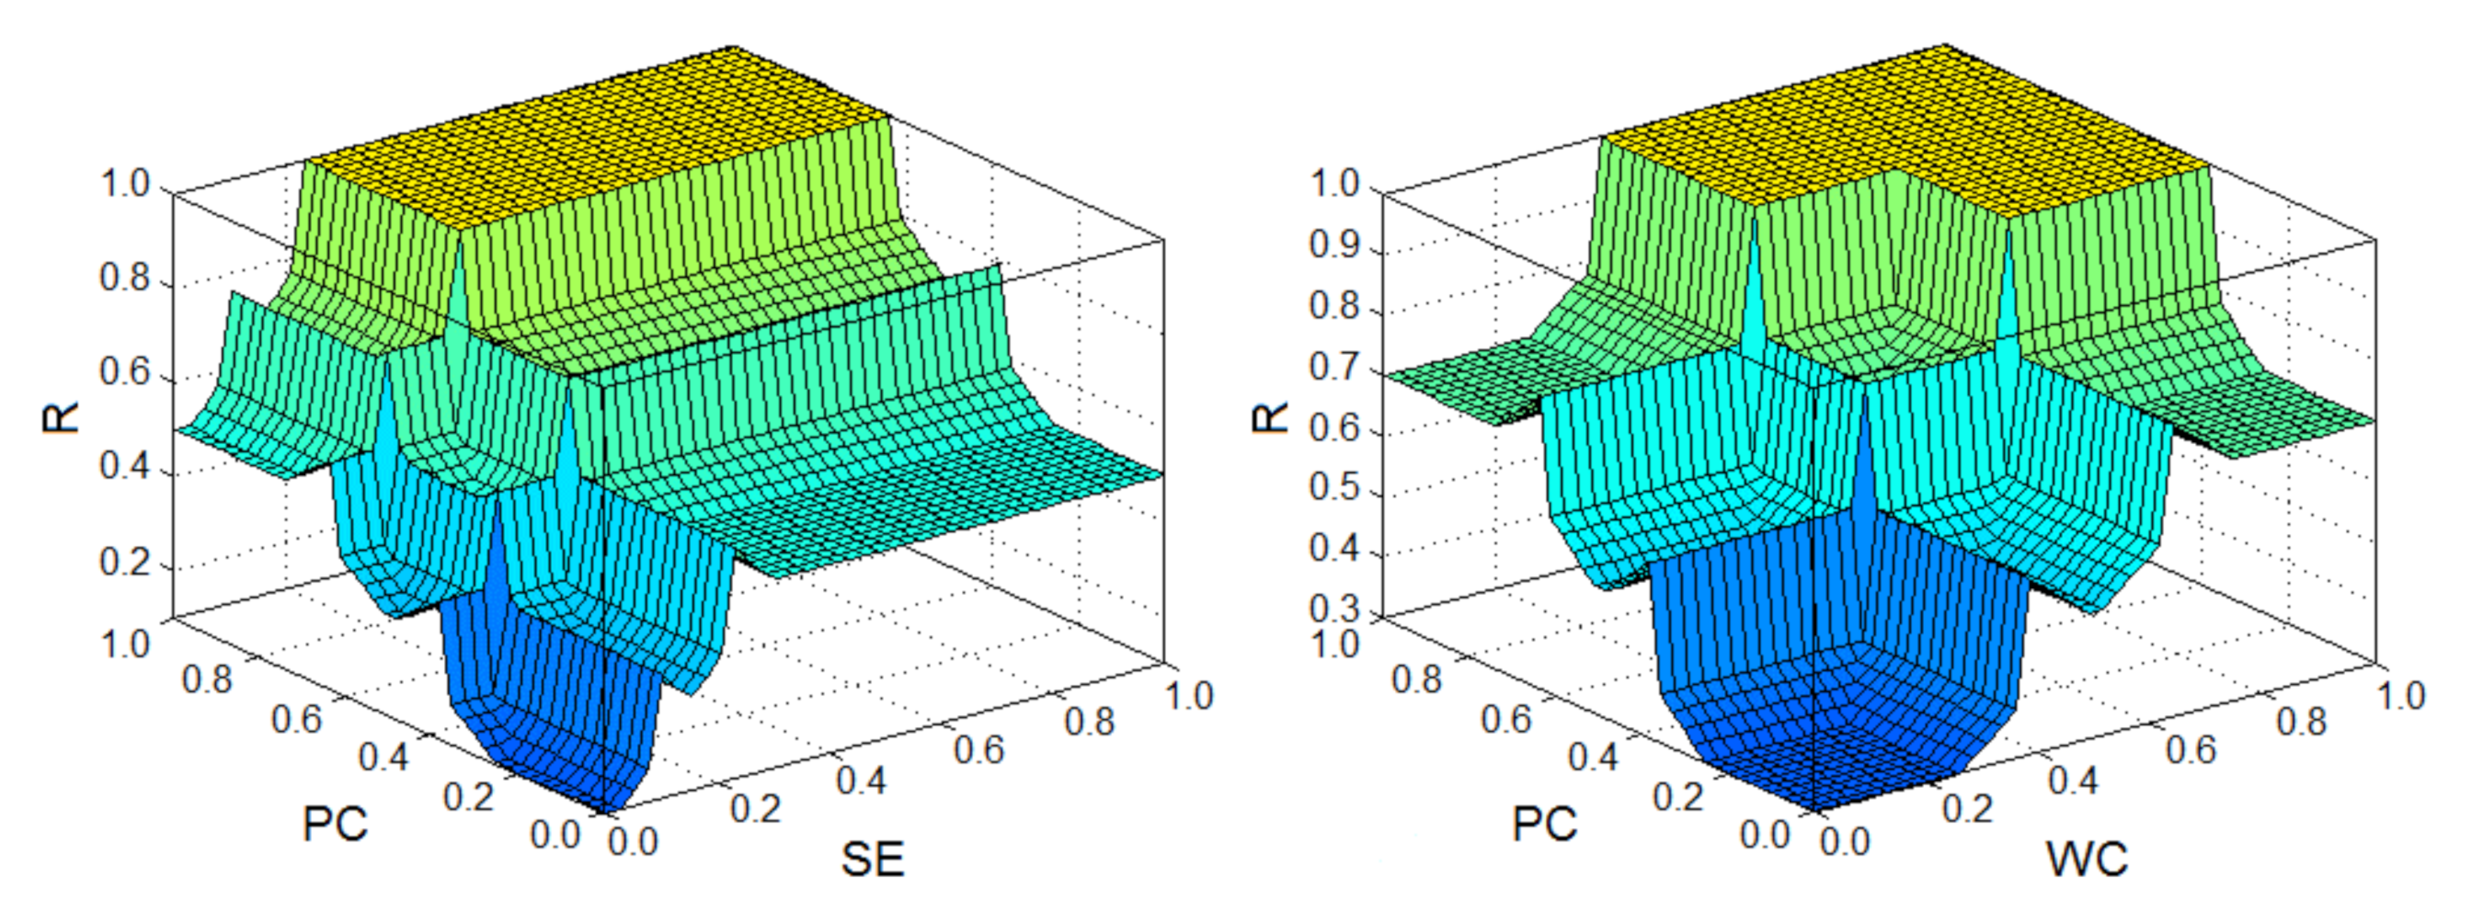
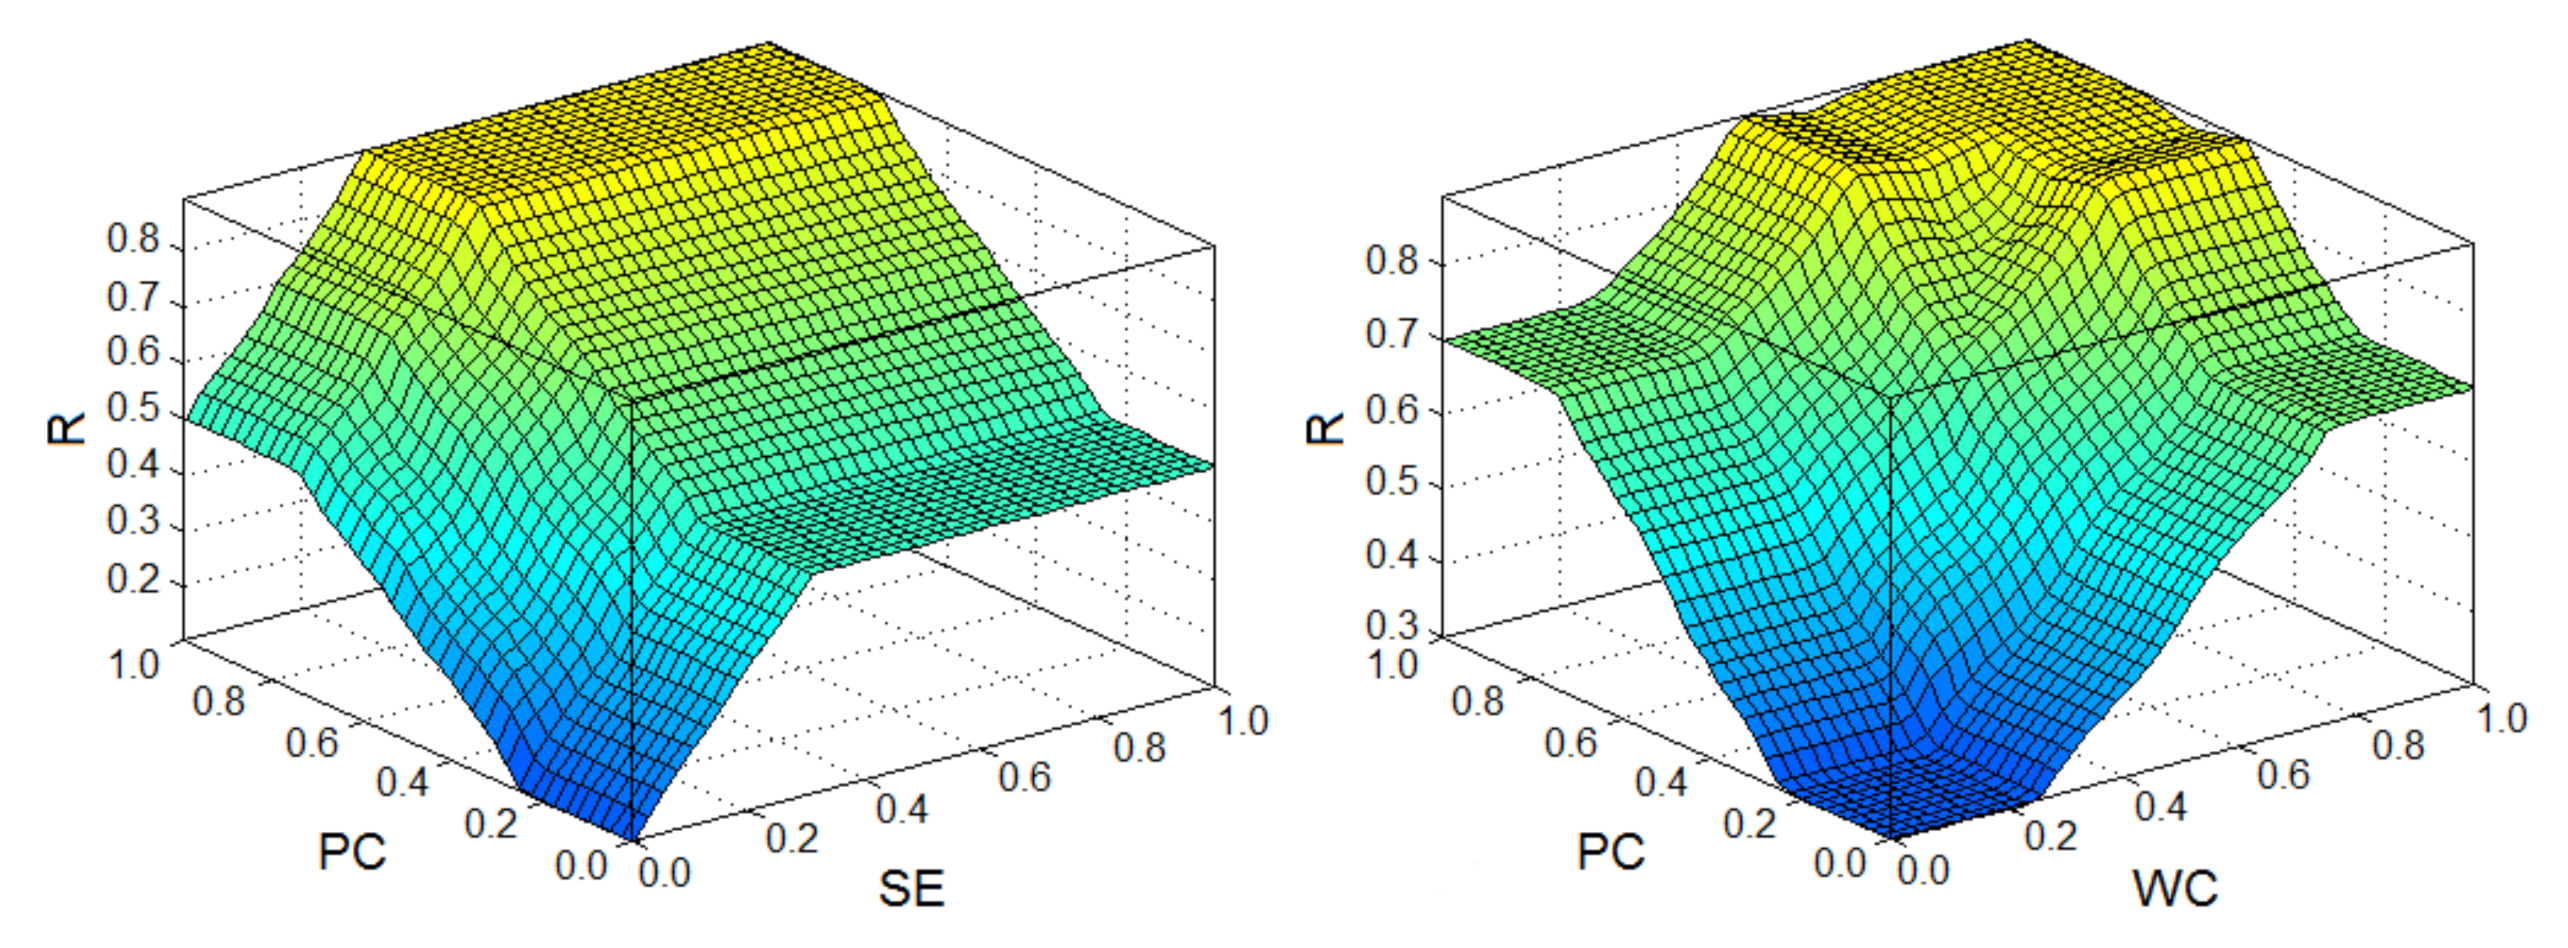
3.4. Block of Defuzzyfication

The defuzzyfication process is a mathematical operation performed on the resultant shape of the membership function (the resultant fuzzy set) obtained after aggregating the conclusions of all the inferring rules. This operation aims to determine a single, sharp value for the variable (y) that will adequately represent the output fuzzy set and clearly indicate the resultant conclusion.
Considering the possibility of applying defuzzyfication methods in cost overrun risks prediction model, a number of defuzzyfication methods were tested: The first of maxima, middle of maxima, and last of maxima method, center of gravity method, and bisector area method. The advantages and disadvantages, as well as the conditions of the application of the individual methods, were considered. Particular attention was paid to the suggestions and observations contained in [43], according to which the methods of maximum:
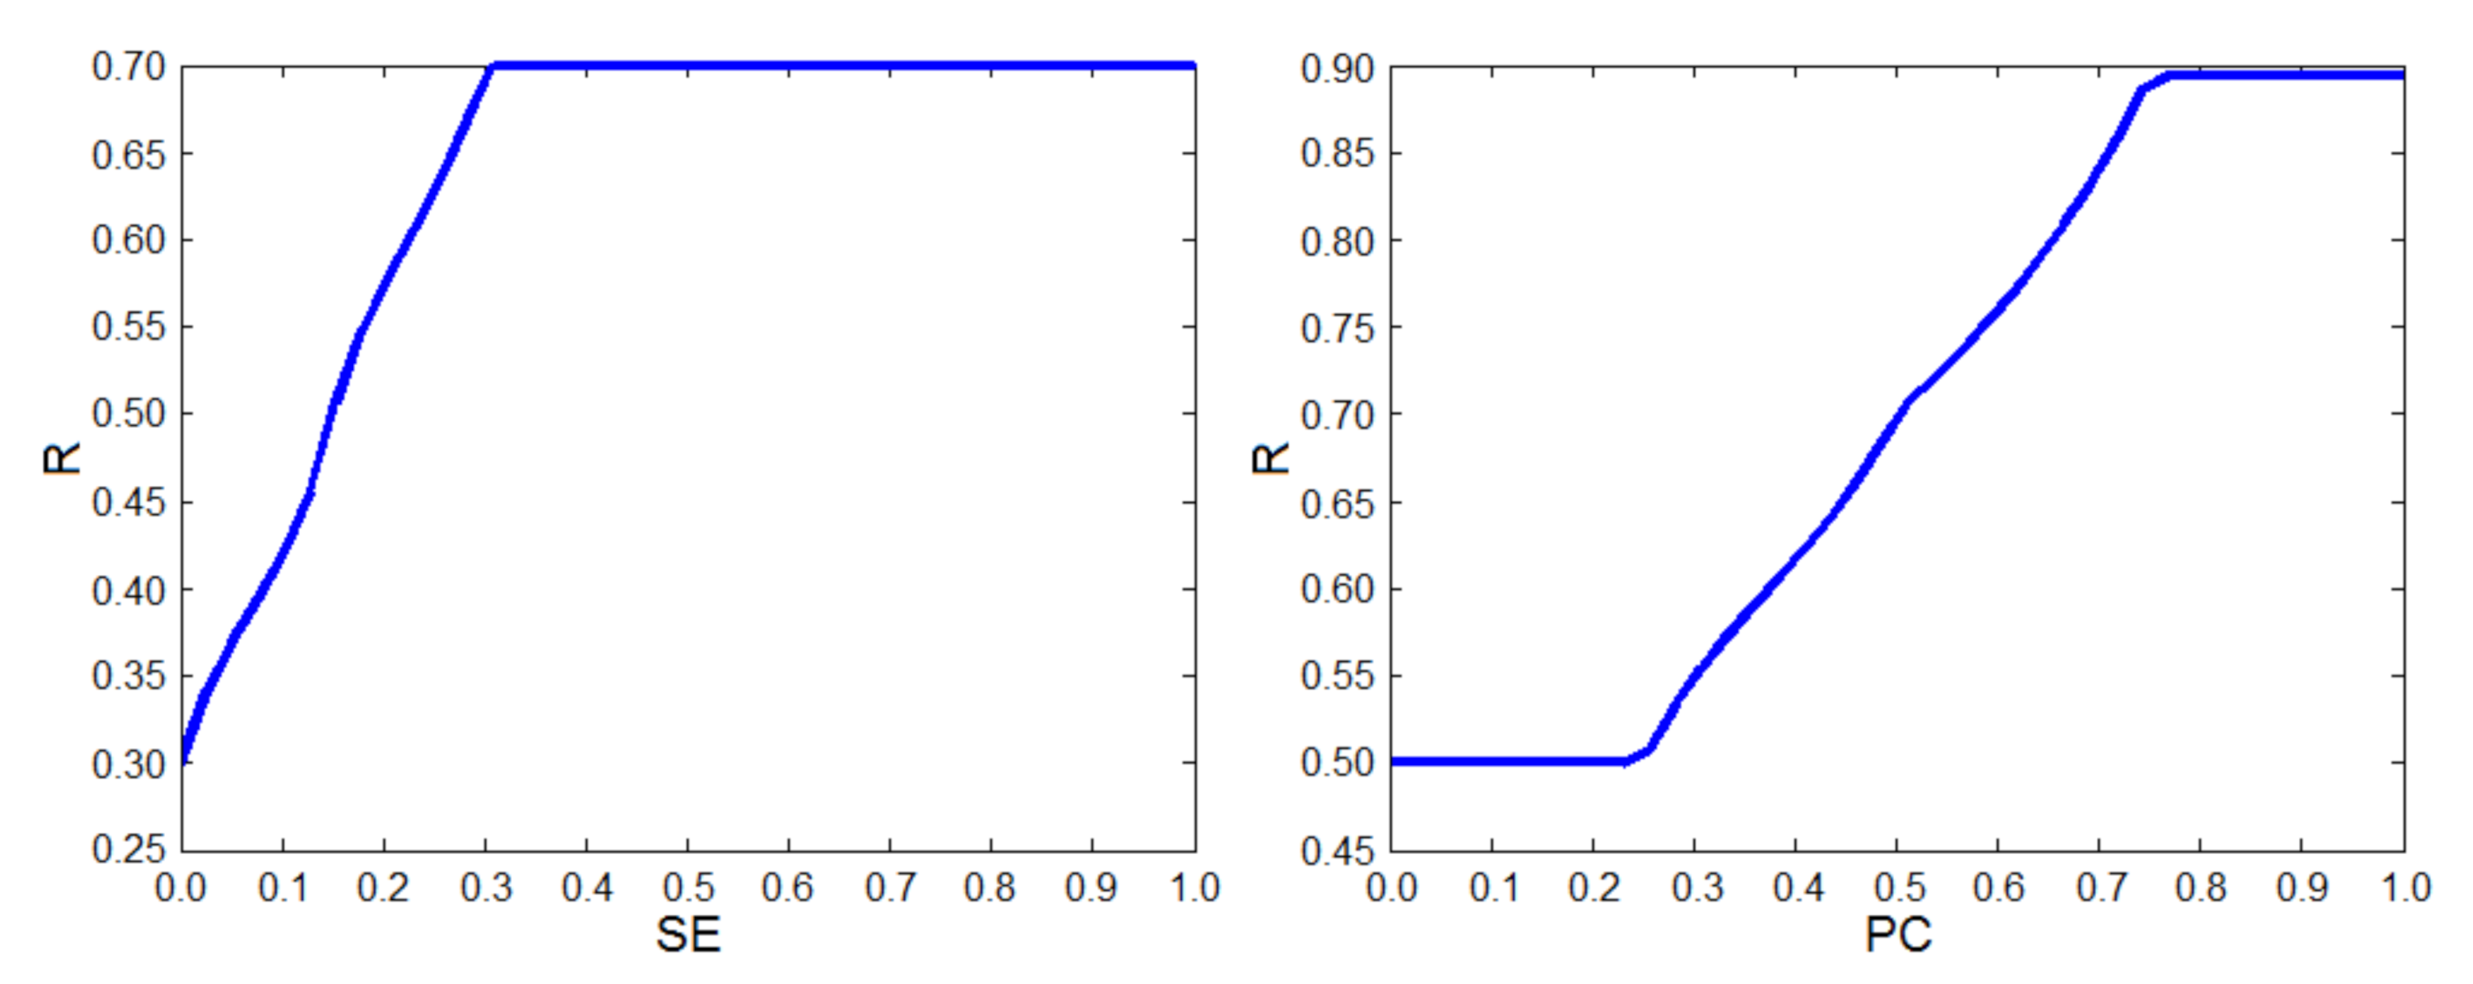
  • Are unable to meet the assumption made for the purpose of building the rule base that, with the increase of the share of element costs in the building costs (SE), the predicted changes in the number of works (WC), and expected changes in the unit price (PC), the value of the risk of exceeding the costs of a given element of the construction project (R) will naturally and smoothly increase,
  • Result in sharp values, which will not in every case adequately represent the output fuzzy set, the reason being that only the most activated set of the output fuzzy variable affects the sharp result.
Figure 5 confirms the observations described above with regard to the application of the last of maxima defuzzyfication method. On the left, the resultant plane for the output variable (R) is shown due to the influence of PC and SE input variables for the cross-section in which WC input variable is 0.5. The resultant plane is analogous to the set of input variables WC and SE, but PC is 0.5. The same plane is shown on the right but taking into account the set of PC and WC input variables for the cross-section in which SE input variable is 0.5.
Figure 6 presents charts of the resultant planes for the assumed center of gravity defuzzyfication method assumed in the cost overrun risks prediction model. The left side shows the resultant plane for the output variable (R) due to the influence of PC and SE input variables for the cross-section in which WC input variable is 0.5. The resultant plane is analogous for the set of input variables WC and SE, but PC is 0.5. The same plane is shown on the right but taking into account the set of PC and WC input variables for the cross-section in which SE input variable is 0.5. The graphs of the planes confirm that with the increase of the share of element costs in the building costs (SE), predicted changes in the number of works (WC), and expected changes in the unit price (PC), the value of the risk exceeding the costs of a given element of the construction project (R) increases naturally and smoothly.
Figure 5 and Figure 6 were prepared using the “Fuzzy Logic Designer” add-on of Mathworks Matlab R2011a software.

4. Calculation Example

4.1. Description of Construction Project

As an example, illustrating the operation of the model, a construction project consisting of the reconstruction of a road was chosen. It is a dual carriageway express road of class “S” (II), 17 km long. The total width of the road crown is 26.50 m, including two roadways each 3.5 m wide and an emergency lane 2.5 m wide. The cost of road works includes:
  • Expansion and modernization of the existing road as one roadway and its adaptation to the expressway parameters,
  • Construction of a second road,
  • Construction of three road junctions,
  • Execution of drainage elements,
  • Making safety and traffic organization elements and noise barriers,
  • Construction of access roads to arable fields and orchards in the road lane.

4.2. Discussion of Results

The calculations were made in accordance with the diagram shown in Figure 7. First, the division of a construction investment into elements (works packages) was made. Then, values were adopted for all input variables of the model: Share of element costs in the building costs (SE), predicted changes in the number of works (WC), and expected changes in the unit price (PC). In the last step, the risk of cost overruns was calculated.
The % share of costs of individual elements in the price of the entire investment is presented in Table 5.
The following elements will be analyzed: Road body and road screens.
Road body:
The road body will be elevated above ground from 0.8 to 1.5 m. The ground underneath the embankment in sections with non-bearing soil will be reinforced by soil exchange, geosets, and gravel columns. The slopes will be strengthened by topsoiling and sowing with a mixture of grasses and turfing, covered with cobblestones and openwork plates (by buildings) and biofibers. Drainage of the body will be performed by a surface system of roadside trenches, retention, and evaporation tanks, as well as curb and slope sewage made of concrete elements.
The following assumptions were made for the calculations:
  • SE = 34.5%; high (on the basis of Table 1),
  • WC = 75.0%; high (analysis of the quality of the design documentation as well as the specificity of the works indicates a high probability of changing the quantity),
  • PC = 50.0%; average (the dynamics of changes in the prices of works and building materials necessary for the execution of works does not show high changes over the last quarters).
The application of the model resulted in R = 0.894. The result of the calculation indicates a very high risk of cost overruns.
Road screens:
In areas of development where traffic noise exceeds day or night standards, it is planned to provide protection with road noise barriers.
The following assumptions were made for the calculations:
  • SE = 9.9%; low (on the basis of Table 1),
  • WC = 25.0%; low (taking into account, for example, the stage of investment preparation, where noise related research was conducted, and the quality of project documentation, it can be concluded that there will be no changes in the location and number of screens needed),
  • PC = 75.0%; high (the subcontractor of these works has not yet been selected and the execution documentation in this respect has not been prepared; this means that the unit price may change significantly depending on the choice of the solution used).
The application of the model resulted in R = 0.416. The result of the calculation indicates an average risk of cost overruns.

5. Conclusions

The paper proposes a model allowing for the prediction of the risk of exceeding the cost of construction of a building. The following main factors influencing the risk of cost overruns of particular object elements were assumed: The share of element costs in the building costs (SE), predicted changes in the number of works (WC), and expected changes in the unit price (PC). To construct a model, the fuzzy inference model of Mamdani was applied. A set of 27 rules was proposed, and the results were then ranked into five possible outcomes on the assumption that the minimum values would correspond to a “very low” conclusion, the maximum to a “very high” one, and the intermediate to “quite low”, “average”, and “quite high” conclusions, respectively and proportionately.
The cost overrun risks prediction model is intended for general contractors who subcontract many stages of works to their subcontractors in accordance with the agreed division into work elements. The division of construction investments into individual elements (stages of works) constitutes the originality of the cost overrun risks prediction model in relation to the models described in Section 2. The authors decided to adopt such assumptions that are adjusted to the Polish implementation conditions, which are based on a special control of those cost elements whose share in the building costs (SE) is higher or predicted changes in the number of works (WC) are higher or expected changes in the unit price (PC) are higher. This allows for greater precision in determining the risk of cost overruns.
The proposed model requires further research. The authors plan to develop risk response strategies for different construction projects such as housing (including: Single-and multi-family buildings), office buildings, roads (including: Highways and express roads of class “S”), rail roads, or sports fields and to test their suitability for actual implementations. For example, in the case of housing investments, the highest share of cost elements (SE) may be significantly smaller than the proposed 30% for roads. The basic problem is then to adjust the shape of the fuzzy sets for a given input SE to the type of building object. Therefore, the authors allow possibility of controlling the linguistic terms for input variable SE (share of element costs in the building cost) to better fit the model to different construction projects. It is also planned to perform analyses of the sensitivity of the model to input data.

Author Contributions

The individual contribution and responsibilities of the authors were as follows: E.P. made a review of the literature concerning introduction part. E.P. and D.W. described all assumptions of the cost overrun risks prediction model. D.W. prepared all figures and calculation examples. E.P. and D.W. drew conclusions and read and approved the final manuscript. All authors have read and agreed to the published version of the manuscript.

Funding

This research received no external funding.

Conflicts of Interest

The author declares no conflict of interest.

References

  1. Hinze, J.; Selstead, G.; Mahoney, J.P. Cost overruns on State of Washington construction contracts. Transp. Res. Rec. 1992, 1351, 87–93. [Google Scholar]
  2. Derakhshanalavijeh, R.; Teixeira, J.M.C. Cost overrun in construction projects in developing countries, Gas-Oil industry of Iran as a case study. J. Civil Eng. Manag. 2017, 23, 125–136. [Google Scholar]
  3. Flyvbjerg, B.; Holm, M.S.; Buhl, S. Underestimating Costs in Public Works Projects: Error or Lie? J. Am. Plan. Assoc. 2002, 68, 279–295. [Google Scholar]
  4. Odeck, J. Cost overruns in road construction: What are their sizes and determinants? Transp. Policy 2004, 11, 43–53. [Google Scholar]
  5. Love, P.E.D.; Wang, X.; Sing, C.; Tiong, R.L.K. Determining the Probability of Cost Overruns. J. Construct. Eng. Manag. 2013, 139, 321–330. [Google Scholar]
  6. Andrić, J.M.; Mahamadu, A.; Wang, J.; Zou, P.X.W.; Zhong, R. The cost performance and causes of overruns in infrastructure development projects in Asia. J. Civil Eng. Manag. 2019, 25, 203–214. [Google Scholar]
  7. Senouci, A.; Ismail, A.; Eldin, N. Time Delay and Cost Overrun in Qatari Public Construction Projects. Proc. Eng. 2016, 164, 368–375. [Google Scholar]
  8. Shehu, Z.; Rohani, I.; Akintoye, A.; Holt, G.D. Cost overrun in the Malaysian construction industry projects: A deeper insight. Int. J. Proj. Manag. 2014, 32, 1471–1480. [Google Scholar]
  9. Flyvbjerg, B.; Skamris-Holm, M.K.; Buhl, S.L. What causes cost overrun in transport infrastructure projects? Transp. Rev. 2004, 24, 3–18. [Google Scholar]
  10. Sdino, L.; Rosasco, P.; Dell’Ovo, M. Reclamation Cost: An Ecosystem Perspective. In International Symposium: New Metropolitan Perspectives; Springer: Cham, Switzerland, 2020; pp. 1352–1358. [Google Scholar]
  11. Cantarelli, C.C.; Flyvbjerg, B.; Molin, J.E.E.; van Wee, B. Cost Overruns in Large-Scale Transportation Infrastructure Projects: Explanations and their Theoretical Embeddedness. Eur. J. Transp. Infrastruct. Res. 2010, 10, 21. [Google Scholar]
  12. Huo, T.; Ren, H.; Cai, W.; Shen, G.Q.; Liu, B.; Zhu, M.; Wu, H. Measurement and dependence analysis of cost overruns in megatransport infrastructure projects: Case study in Hong Kong. J. Construct. Eng. Manag. 2018, 144, 05018001. [Google Scholar] [CrossRef]
  13. Chen, Y.; Hu, Z. Exploring the properties of cost overrun risk propagation network (CORPN) for promoting cost management. J. Civil Eng. Manag. 2019, 25, 1–18. [Google Scholar] [CrossRef]
  14. Niazi, G.A.; Painting, N. Significant factors causing cost overruns in the construction industry in Afghanistan. Proc. Eng. 2016, 182, 510–517. [Google Scholar] [CrossRef]
  15. Azis, A.A.A.; Memon, A.H.; Rahman, I.A.; Karim, A.T.A. Controlling cost overrun factors in construction projects in Malaysia. Res. J. Appl. Sci. Eng. Technol. 2013, 5, 2621–2629. [Google Scholar] [CrossRef]
  16. Gunduz, M.; Maki, O.L. Assessing the risk perception of cost overrun through importance rating. Technol. Econ. Dev. Econ. 2018, 24, 1829–1844. [Google Scholar] [CrossRef]
  17. El-Kholy, A.M. Predicting Cost Overrun in Construction Projects. Int. J. Construct. Eng. Manag. 2015, 4, 95–105. [Google Scholar]
  18. França, A.; Haddad, A. Causes of Construction Projects Cost Overrun in Brazil. Int. J. Sustain. Construct. Eng. Technol. 2018, 9, 69–83. [Google Scholar] [CrossRef]
  19. Larsen, J.K.; Shen, G.Q.; Lindhard, S.M.; Ditlev, T. Factors Affecting Schedule Delay, Cost Overrun, and Quality Level in Public Construction Projects. J. Manag. Eng. 2016, 32, 1–29. [Google Scholar] [CrossRef] [Green Version]
  20. Cantarelli, C.C.; Molin, E.J.E.; van Wee, B.; Flyvbjerg, B. Characteristics of cost overruns for Dutch transport infrastructure projects and the importance of the decision to build and project phases. Transp. Policy 2012, 22, 49–56. [Google Scholar] [CrossRef] [Green Version]
  21. Lind, H.; Brunes, F.; Lind, H.; Brunes, F. Explaining cost overruns in infrastructure projects: A new framework with applications to Sweden. Construct. Manag. Econ. 2015, 33, 554–568. [Google Scholar] [CrossRef]
  22. Lowe, D.J.; Emsley, M.W.; Harding, A. Predicting construction cost using multiple regression techniques. J. Construct. Eng. Manag. 2006, 132, 750–758. [Google Scholar] [CrossRef] [Green Version]
  23. Abu Hammad, A.A.; Ali, S.M.A.; Sweis, G.J.; Basher, A. Prediction Model for Construction Cost and Duration in Jordan. Jordan J. Civil Eng. 2008, 2, 250–266. [Google Scholar]
  24. Attala, M.; Hegazy, T. Predicting Cost Deviation in Reconstruction Projects: Artificial Neural Networks Versus Regression. J. Construct. Eng. Manag. 2003, 129, 405–411. [Google Scholar] [CrossRef]
  25. Juszczyk, M.; Leśniak, A.; Zima, K. ANN based approach for estimation of construction costs of sports fields. Complexity 2018, 28, 1–11. [Google Scholar] [CrossRef]
  26. Kim, K.J.; Kim, K. Preliminary Cost Estimation Model Using Case-Based Reasoning and Genetic Algorithms. J. Comput. Civil Eng. 2010, 24, 499–505. [Google Scholar] [CrossRef]
  27. Ji, S.H.; Park, M.; Lee, H.S. Cost Estimation Model for Building Projects Using Case-Based Reasoning. Can. J. Civil Eng. 2011, 38, 570–581. [Google Scholar] [CrossRef]
  28. Leśniak, A.; Zima, K. Cost Calculation of Construction Projects Including Sustainability Factors Using the Case Based Reasoning (CBR) Method. Sustainability 2018, 10, 1608. [Google Scholar] [CrossRef] [Green Version]
  29. Plebankiewicz, E. Model of predicting cost overrun in construction projects. Sustainability 2018, 10, 4387. [Google Scholar] [CrossRef] [Green Version]
  30. Marzouk, M.; Amin, A. Predicting Construction materials prices using fuzzy logic and neural networks. J. Construct. Eng. Manag. 2013, 139, 1190–1198. [Google Scholar] [CrossRef]
  31. Knight, K.; Robinson-Fayek, A. Use of fuzzy logic of predicting design cost overruns on building projects. J. Construct. Eng. Manag. 2002, 128, 503–512. [Google Scholar] [CrossRef]
  32. Fidan, G.; Dikmen, I.; Tanyer, A.M.; Birgonul, M.T. Ontology for Relating Risk and Vulnerability to Cost Overrun in International Projects. J. Comput. Civil Eng. 2011, 25, 302–315. [Google Scholar] [CrossRef]
  33. Dikmen, I.; Birgonul, M.T.; Han, S. Using fuzzy risk assessment to rate cost overrun risk in international construction projects. Int. J. Proj. Manag. 2007, 25, 494–505. [Google Scholar] [CrossRef]
  34. Knight, F.H. Risk, uncertainty and profit. In Courier Corporation; Dover Publications, Inc.: Mineola, NY, USA, 2012. [Google Scholar]
  35. Kishk, M.; Al-Hajj, A. A fuzzy model and algorithm to handle subjectivity in life cycle costing based decision-making. J. Financ. Manag. Prop. Construct. 2000, 5, 93–104. [Google Scholar]
  36. Mohamed, S.; McCowan, A.K. Modelling project investment decisions under uncertainty using possibility theory. Int. J. Proj. Manag. 2001, 19, 231–241. [Google Scholar] [CrossRef]
  37. Przybycin, Z. Zarządzanie ryzykiem projektów inwestycyjnych. In Zeszyty Naukowe Wyższej Szkoły Bankowej We Wrocławiu; Wyższa Szkoła Bankowa we Wrocławiu: Wrocław, Poland, 2011; Volume 20, pp. 351–361. [Google Scholar]
  38. Ibadov, N.; Kulejewski, J. The assessment of construction project risks with the use of fuzzy sets theory. Tech. Trans. 2014, 1-B, 175–182. [Google Scholar]
  39. Nieto-Morote, A.; Ruz-Vila, F. A fuzzy approach to construction project risk assessment. Int. J. Proj. Manag. 2011, 29, 220–231. [Google Scholar] [CrossRef] [Green Version]
  40. Tavakolan, M.; Mohammadi, A. Construction risk management framework using fuzzy sets and failure mode and effect analysis. In Proceedings of the 51st ASC Annual International Conference Proceedings, The Associated Schools of Construction, College Station, TX, USA, 22–25 April 2015. [Google Scholar]
  41. Plebankiewicz, E.; Wieczorek, D. Rozmyta ocena ryzyka w cyklu życia obiektów budowlanych. Materiały Budowlane 2016, 6, 59–61. [Google Scholar] [CrossRef]
  42. Hovde, P.J.; Moser, K. Performance based methods for service life prediction. In State of the Art Reports, CIB Report; Trondheim Publication: Trondheim, Norway, 2004; p. 294. [Google Scholar]
  43. Wieczorek, D. Fuzzy risk assessment in the life cycle of building object—Selection of the right defuzzification method. In AIP Conference Proceedings, Proceedings of International Conference of Numerical Analysis and Applied Mathematics (ICNAAM), Thessaloniki, Greece, 25–30 September 2017; Simos, T., Tsitouras, C., Eds.; AIP Publishing: Melville, NY, USA, 2018; Volume 1, p. 240005. [Google Scholar]
Figure 1. Linguistic terms of the input variable share of element costs in the building costs—SE (own study).
Sustainability 12 09341 g001
Figure 2. Linguistic terms of the input variable predicted changes in the number of works—WC and expected changes in the unit price—PC (own study).
Sustainability 12 09341 g002
Figure 3. Linguistic terms of the output variable R (own study).
Sustainability 12 09341 g003
Figure 4. Charts of the relationship between the input variables (SEleft and PCright) of the output variable R (own study).
Sustainability 12 09341 g004
Figure 5. The resulting plane in terms of input variables PC and SE (left) and PC and WC (right)—last of maxima defuzzyfication method (own study).
Sustainability 12 09341 g005
Figure 6. The resulting plane in terms of input variables PC and SE (left) and PC and WC (right)—center of gravity defuzzyfication method (own study).
Sustainability 12 09341 g006
Figure 7. Block diagram for a calculation example (own study).
Sustainability 12 09341 g007
Table 1. Fuzzy interpretation of the linguistic input variable share of element costs in the building costs—SE (own study).
Fuzzy Set of Linguistic Values for SEDescription of the Variable x1Fuzzy Evaluation of Membership μ(x1)
HighAbout or above 30.0%(0.15; 0.3; 1.0; 1.0)
AverageAbout 15.0%(0.0; 0.15; 0.15; 0.3)
LowAbout or below 3.0%(0.0; 0.0; 0.03; 0.15)
Table 2. Fuzzy interpretations of the linguistic input variables predicted changes in the number of works—WC or expected changes in the unit price—PC (own study).
Fuzzy Set of Linguistic Values for WC or PCDescription of the Variables x2 or x3Fuzzy Evaluation of Membership μ(x2) or μ(x3)
HighAbout or above 75.0%(0.5; 0.75; 1.0; 1.0)
AverageAbout 50.0%(0.25; 0.5; 0.5; 075)
LowAbout or below 25.0%(0.0; 0.0; 0.25; 0.5)
Table 3. The rule base of the inference block (own study).
Rule No.If (SE)And (WC)And (PC)Then (R)
LVWeightLVWeightLVWeightProductConcl.
1Lo1Lo1Lo11Vl
2Lo1Lo1Av22Vl
3Lo1Lo1Hi33Ql
4Lo1Av2Lo12Vl
5Lo1Av2Av24Ql
6Lo1Av2Hi36Av
7Lo1Hi3Lo13Ql
8Lo1Hi3Av26Av
9Lo1Hi3Hi39Qh
10Av2Lo1Lo12Vl
11Av2Lo1Av24Ql
12Av2Lo1Hi36Av
13Av2Av2Lo14Ql
14Av2Av2Av28Av
15Av2Av2Hi312Qh
16Av2Hi3Lo16Av
17Av2Hi3Av212Qh
18Av2Hi3Hi318Vh
19Hi3Lo1Lo13Ql
20Hi3Lo1Av26Av
21Hi3Lo1Hi39Qh
22Hi3Av2Lo16Av
23Hi3Av2Av212Qh
24Hi3Av2Hi318Vh
25Hi3Hi3Lo19Qh
26Hi3Hi3Av218Vh
27Hi3Hi3Hi327Vh
where: LV—fuzzy set of linguistic values (fuzzy sets in accordance with Table 1 and Table 2), Concl.—resulting conclusion for the output variable R.
Table 4. Fuzzy interpretation of the linguistic output variable R (own study).
Fuzzy Set of Linguistic Values for RDescription of the Variable yFuzzy Evaluation of Membership μ(y)
Very highVhAbout or above 0.9(0.7; 0.9; 1.0; 1.0)
Quite highQhAbout 0.7(0.5; 0.7; 0.7; 0.9)
AverageAvAbout 0.5(0.3; 0.5; 0.5; 0.7)
Quite lowQlAbout 0.3(0.1; 0.3; 0.3; 0.5)
Very lowVlAbout or below 0.1(0.0; 0.0; 0.1; 0.3)
Table 5. The share of costs of individual elements in the price of the entire investment (own study).
Cost Element (CE)% Share in the Price
Road body34.5
Foundation30.3
Road surfaces18.3
Traffic safety devices6.7
Road screens9.9
Miscellaneous works0.3
Total100.0
Publisher’s Note: MDPI stays neutral with regard to jurisdictional claims in published maps and institutional affiliations.

