Efficient Gear Ratio Selection of a Single-Speed Drivetrain for Improved Electric Vehicle Energy Consumption

 ,
,  , ,
, ,  and
and
Abstract
1. Introduction
2. Materials and Methods
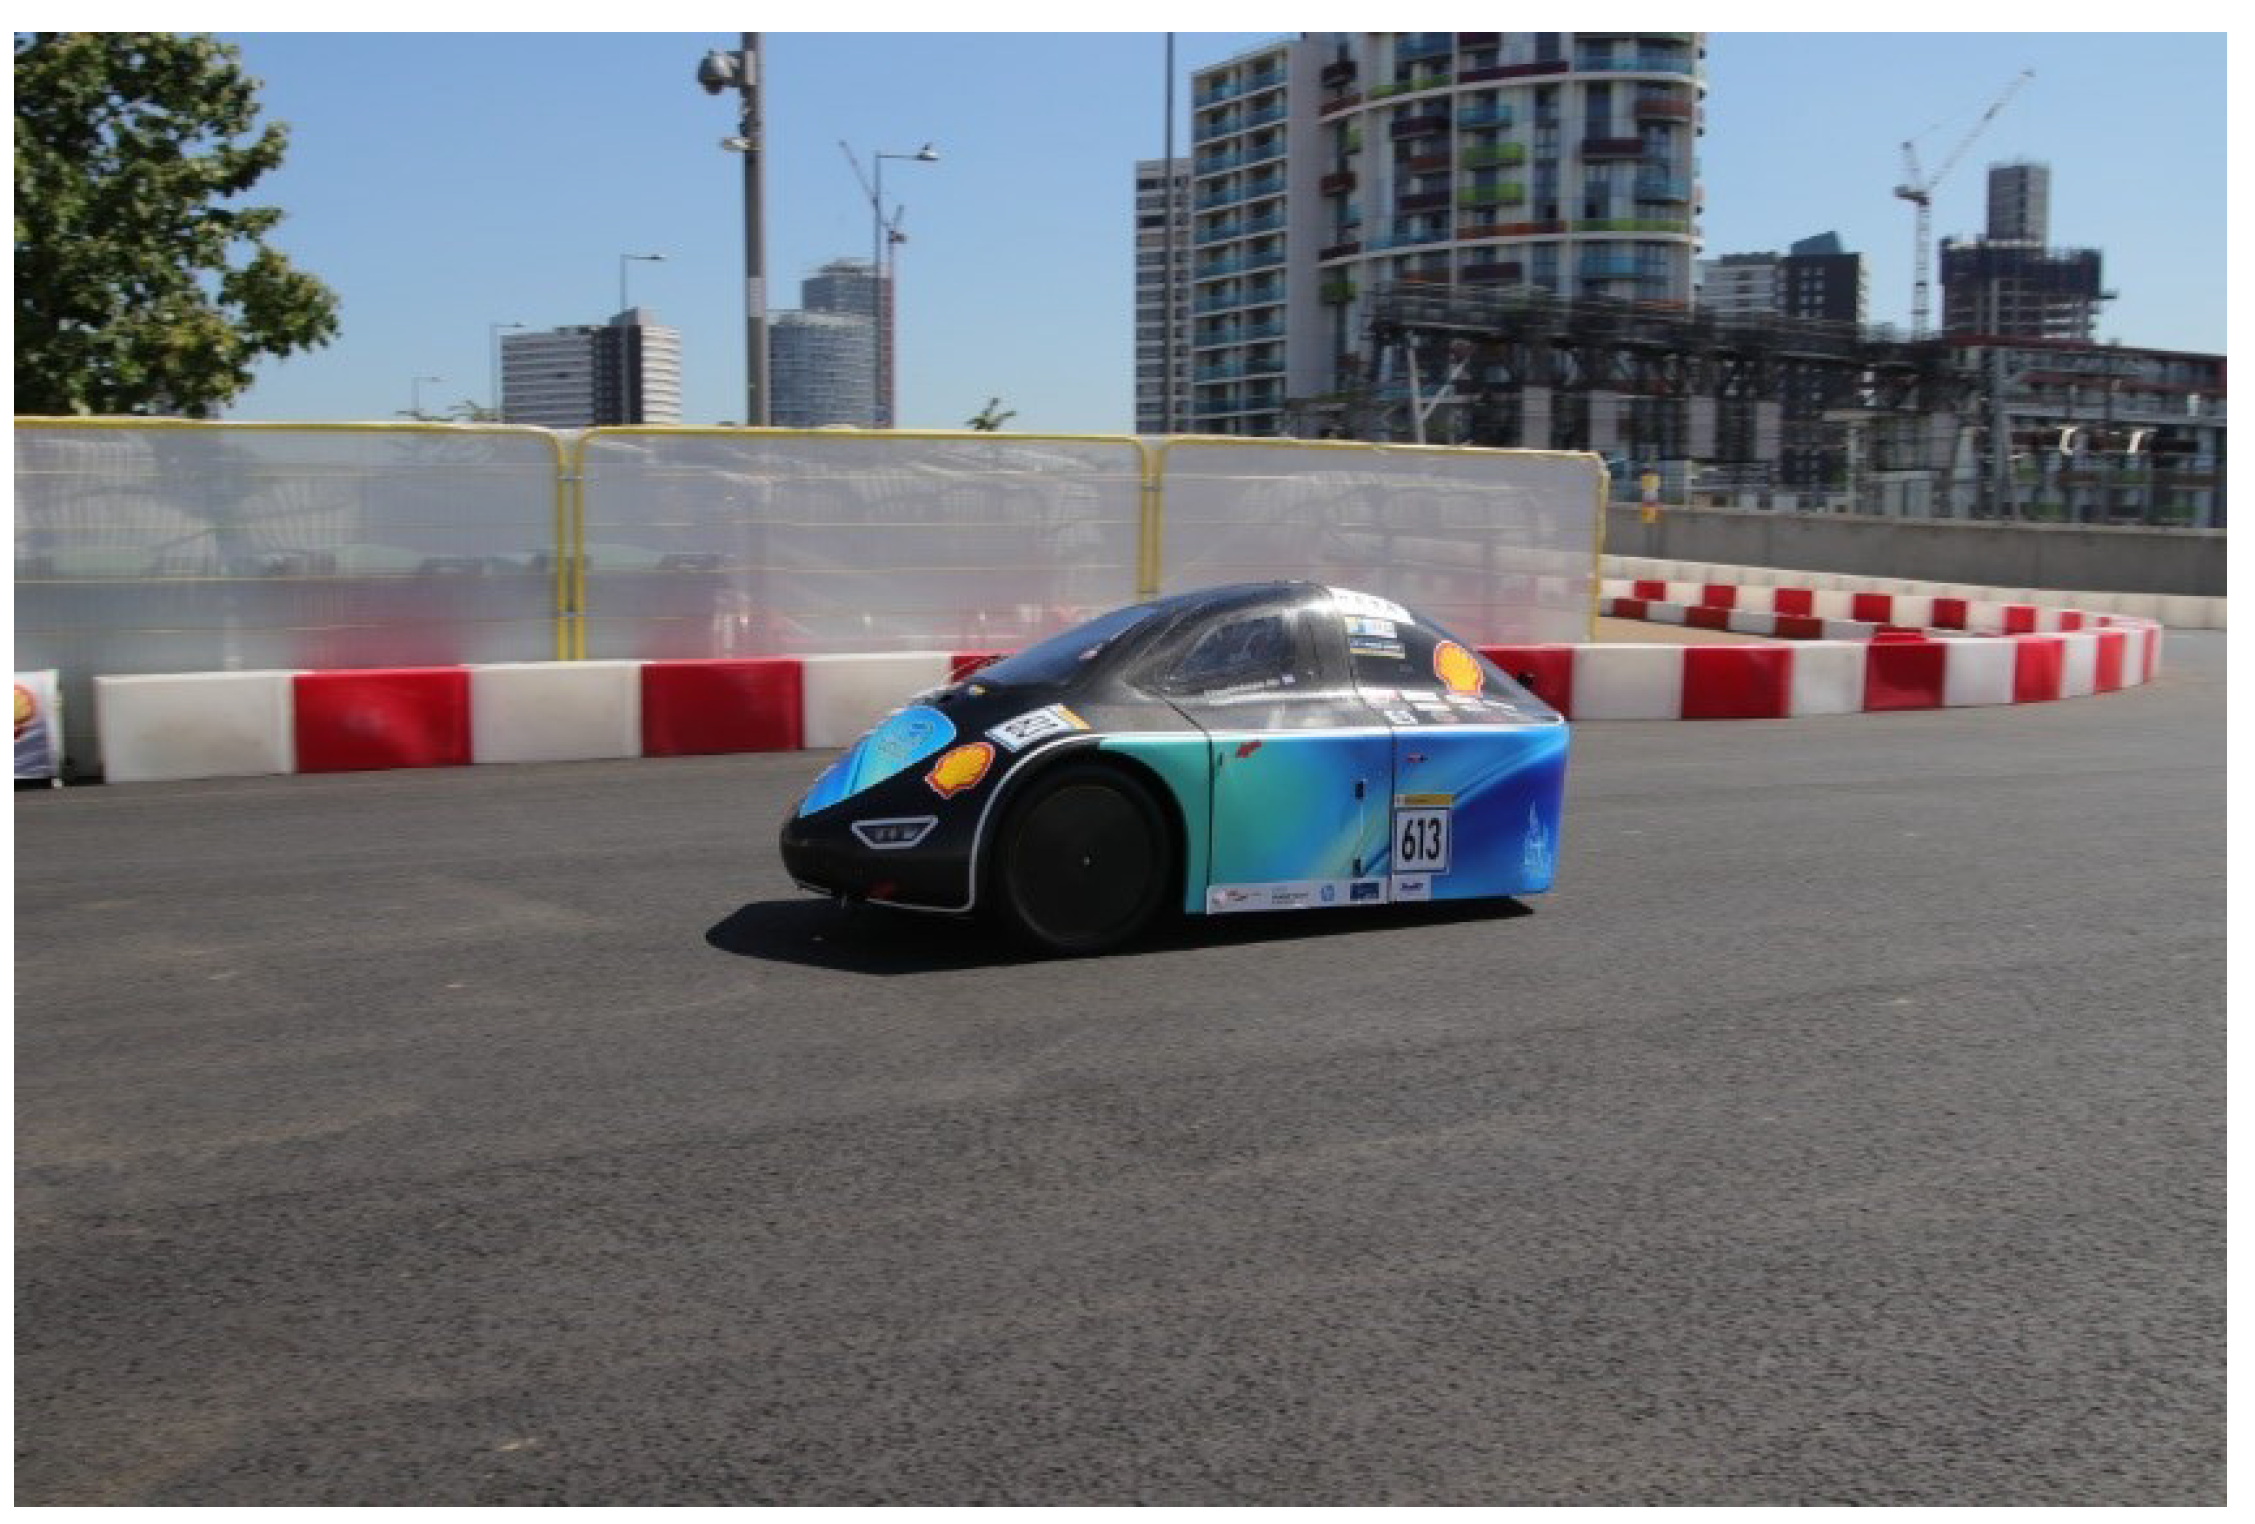
2.1. Testbed Vehicle
2.1.1. Vehicle Specifications
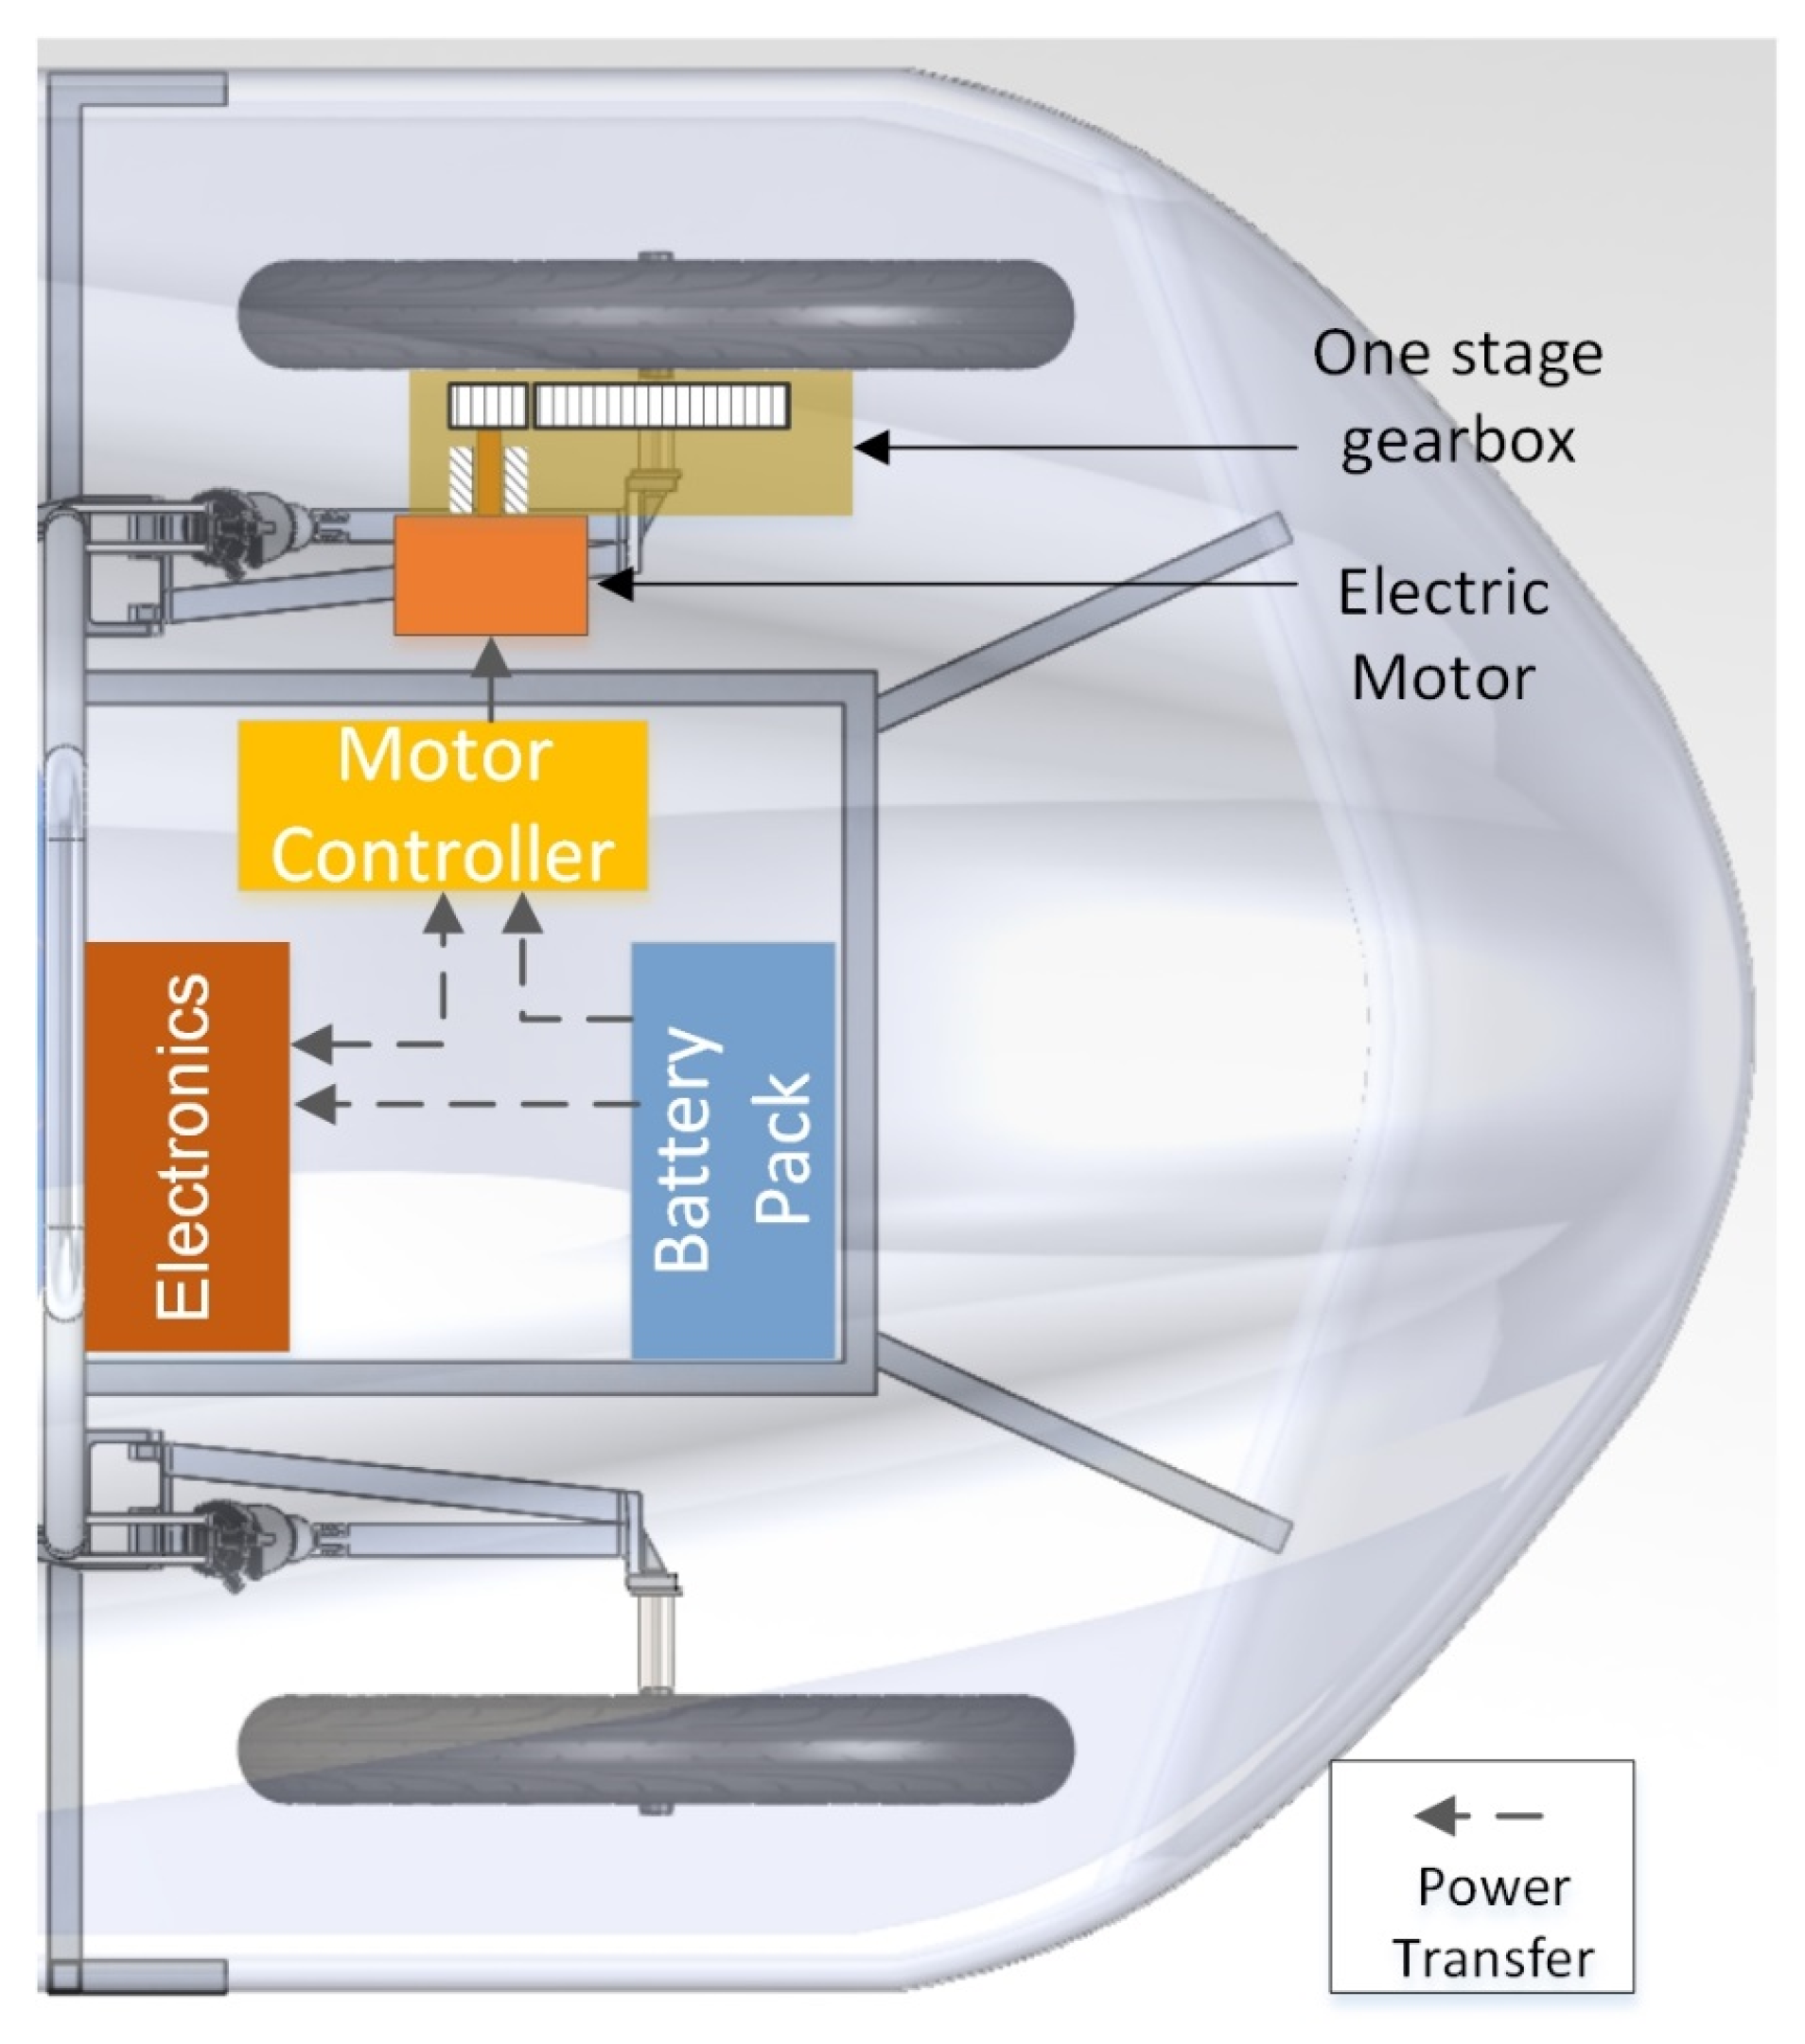
2.1.2. Powertrain Specifications
2.1.3. Data Recording Setup
- a
- The custom data logger device (TUCer logger) records data of power supply voltage, power supply current, and vehicle’s speed, with frequency of a sample set every 0.5 s (2 Hz). The core of the logger is the popular Arduino Uno microcontroller. Voltage measurement is accomplished by a voltage divider while current measurement by a shunt resistor and an AD623 instrumentation amplifier. Speed measurement is done by a magnetic reed switch. All inputs are send as input to the Arduino for processing and evaluation. To overcome the Arduino’s lack of internal memory (for data logging), a connection to a Raspberry Pi is established, which receives the data from the Arduino and logs a file for retrieval after the race.
- b
- The racetrack data logger device provided by the competition organizers, is a commercial product with enhanced capabilities used throughout testing as backup and correction data provider. It provides data sets every 0.1 s (10 Hz frequency) regarding numerous aspects of the vehicle, such as position (GPS Tracking), energy consumption (V,A), and temperature (C).
2.2. Experimental Testing
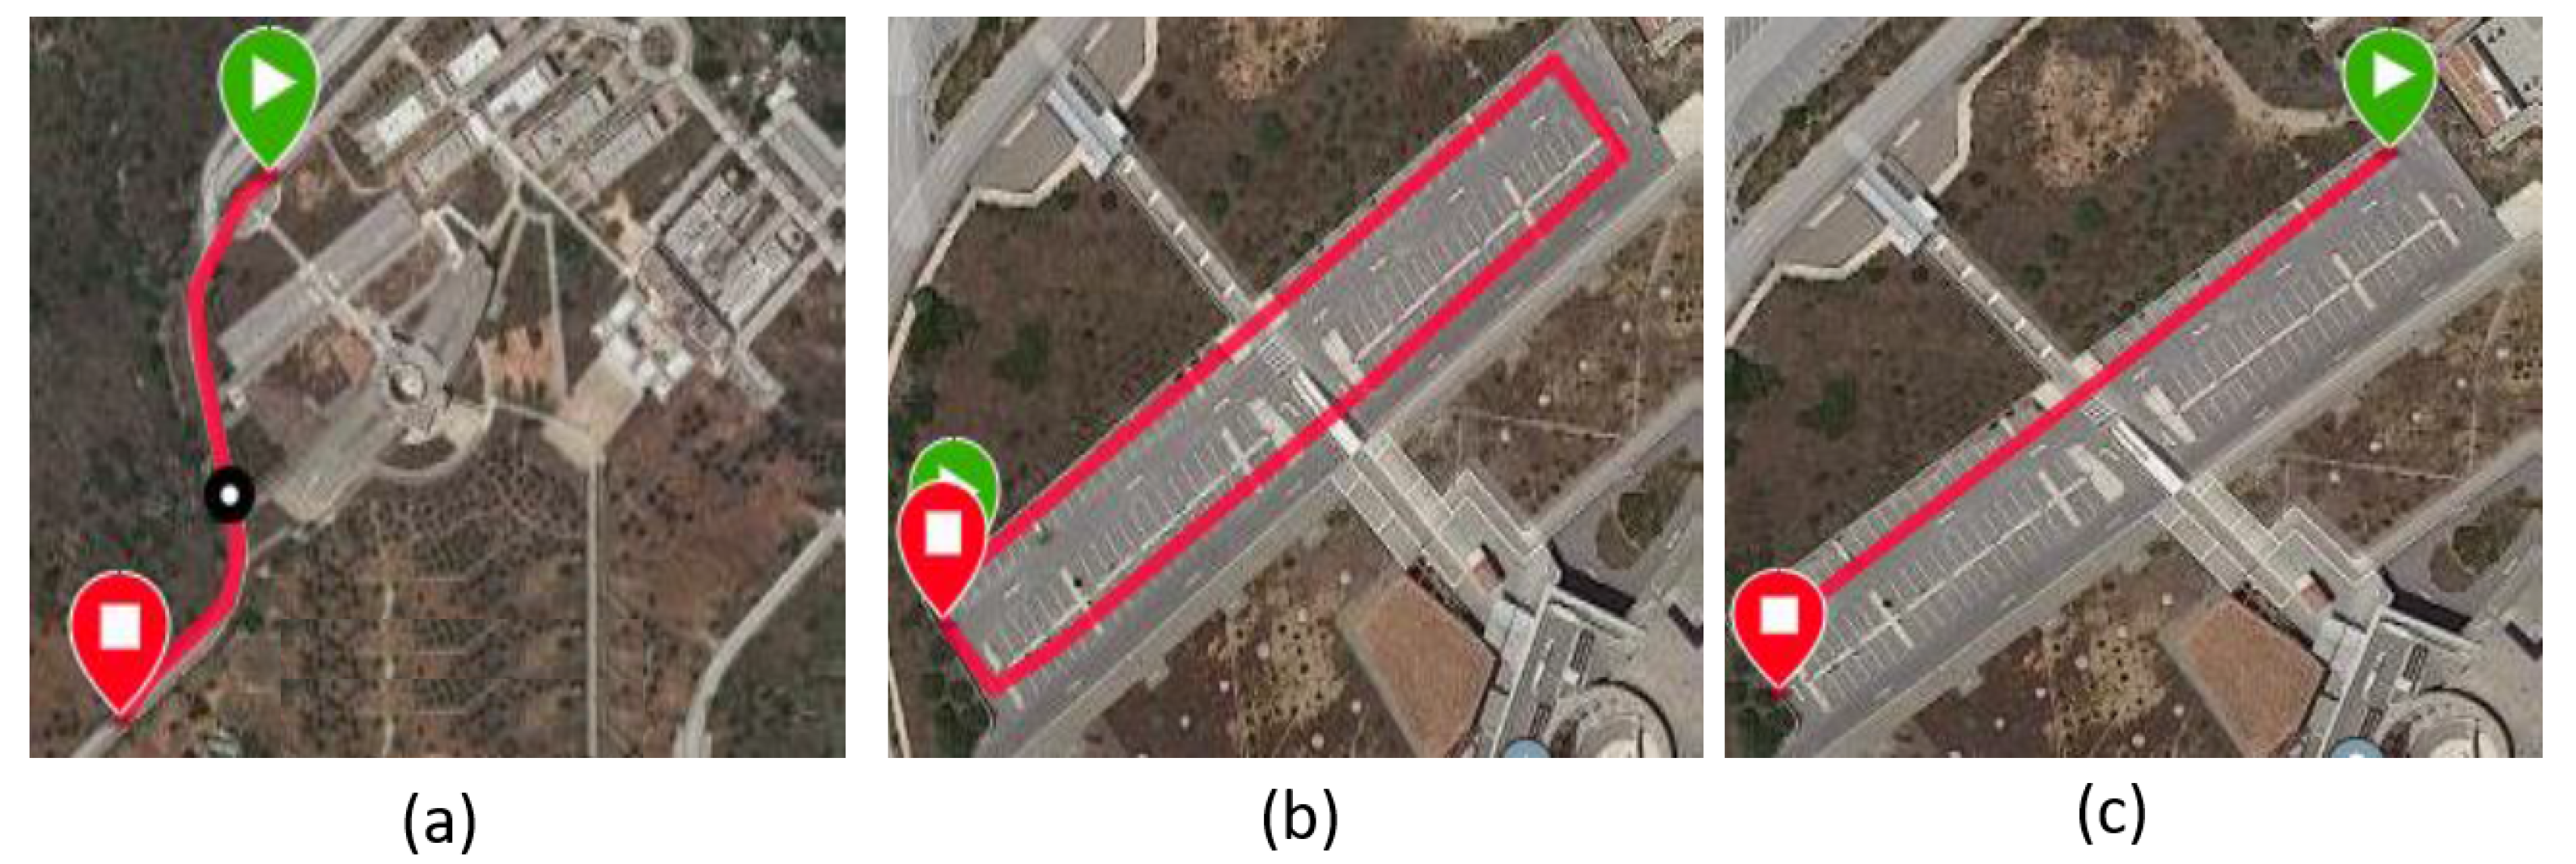
2.2.1. Preliminary Experimental Testing
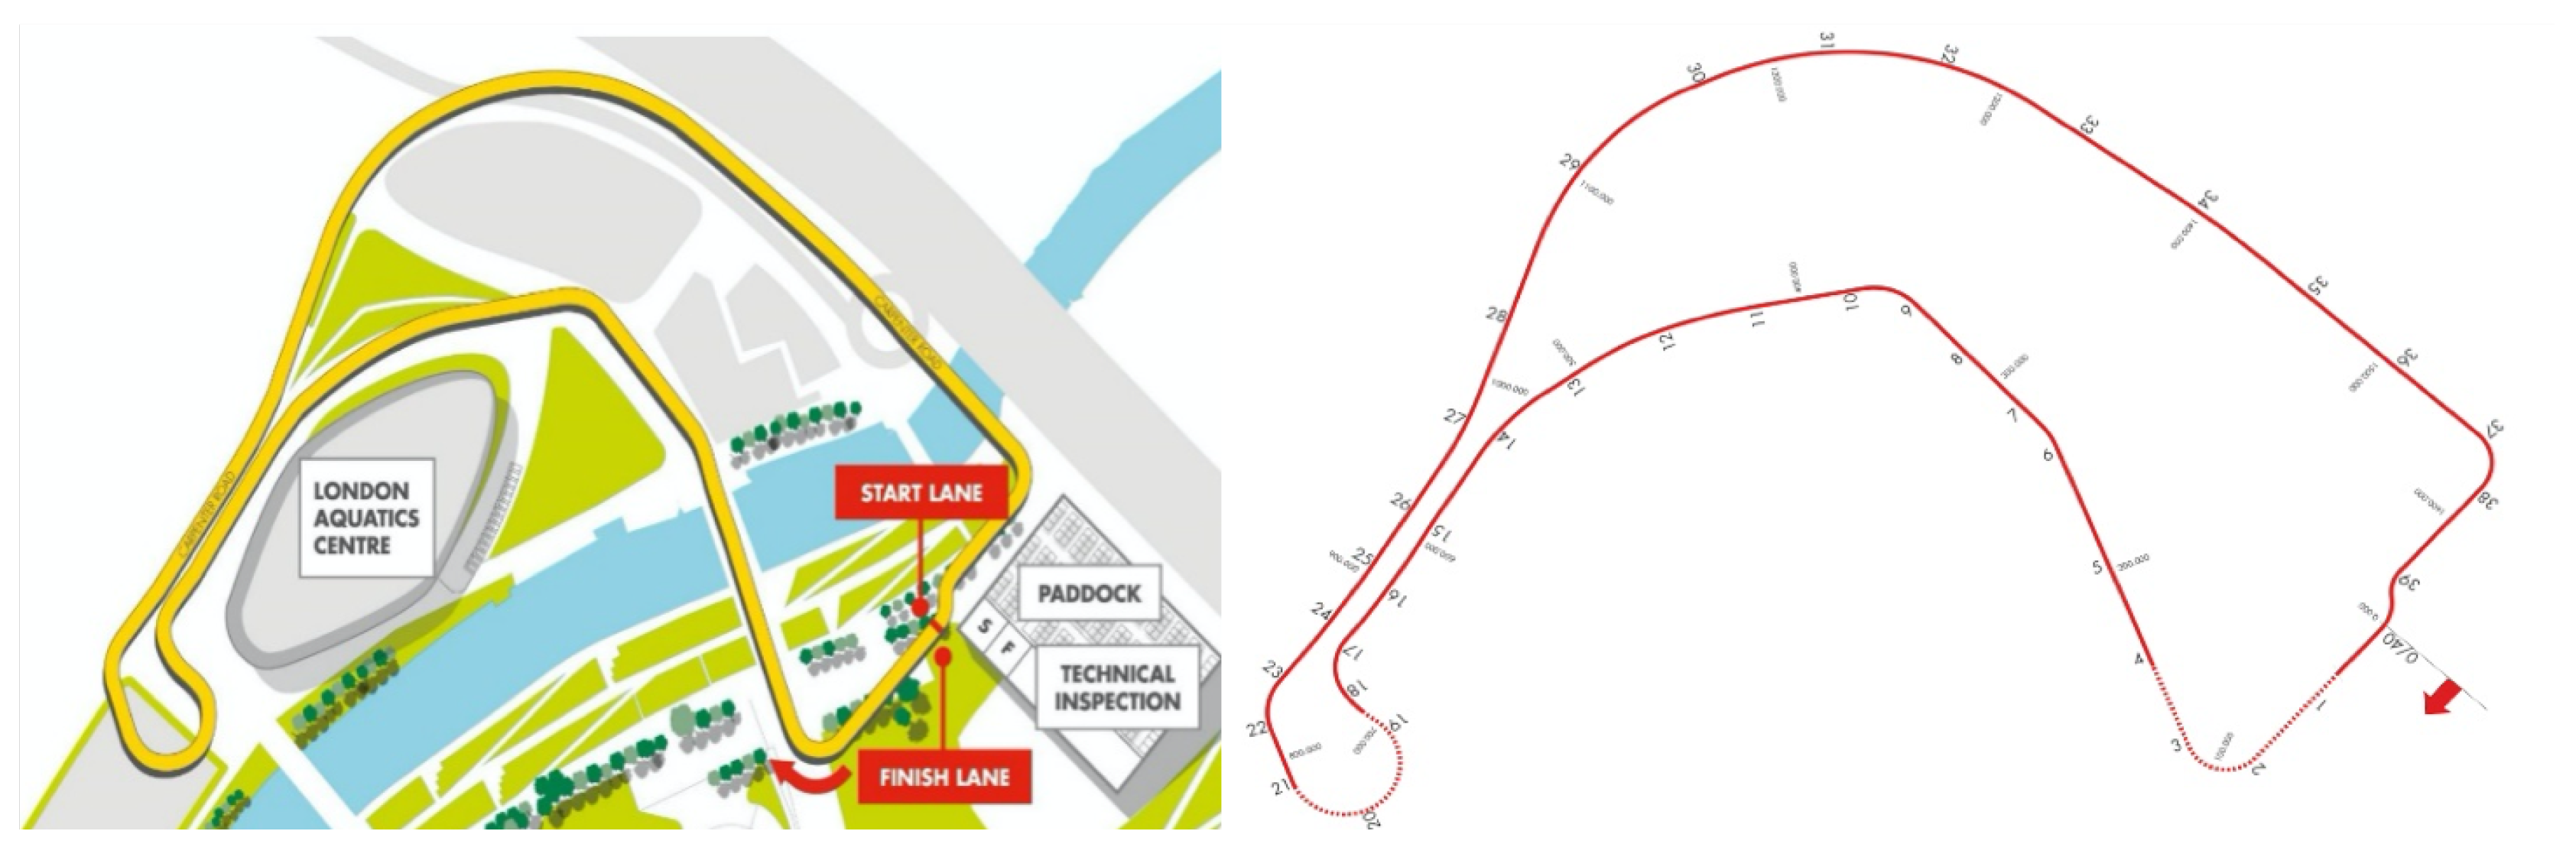
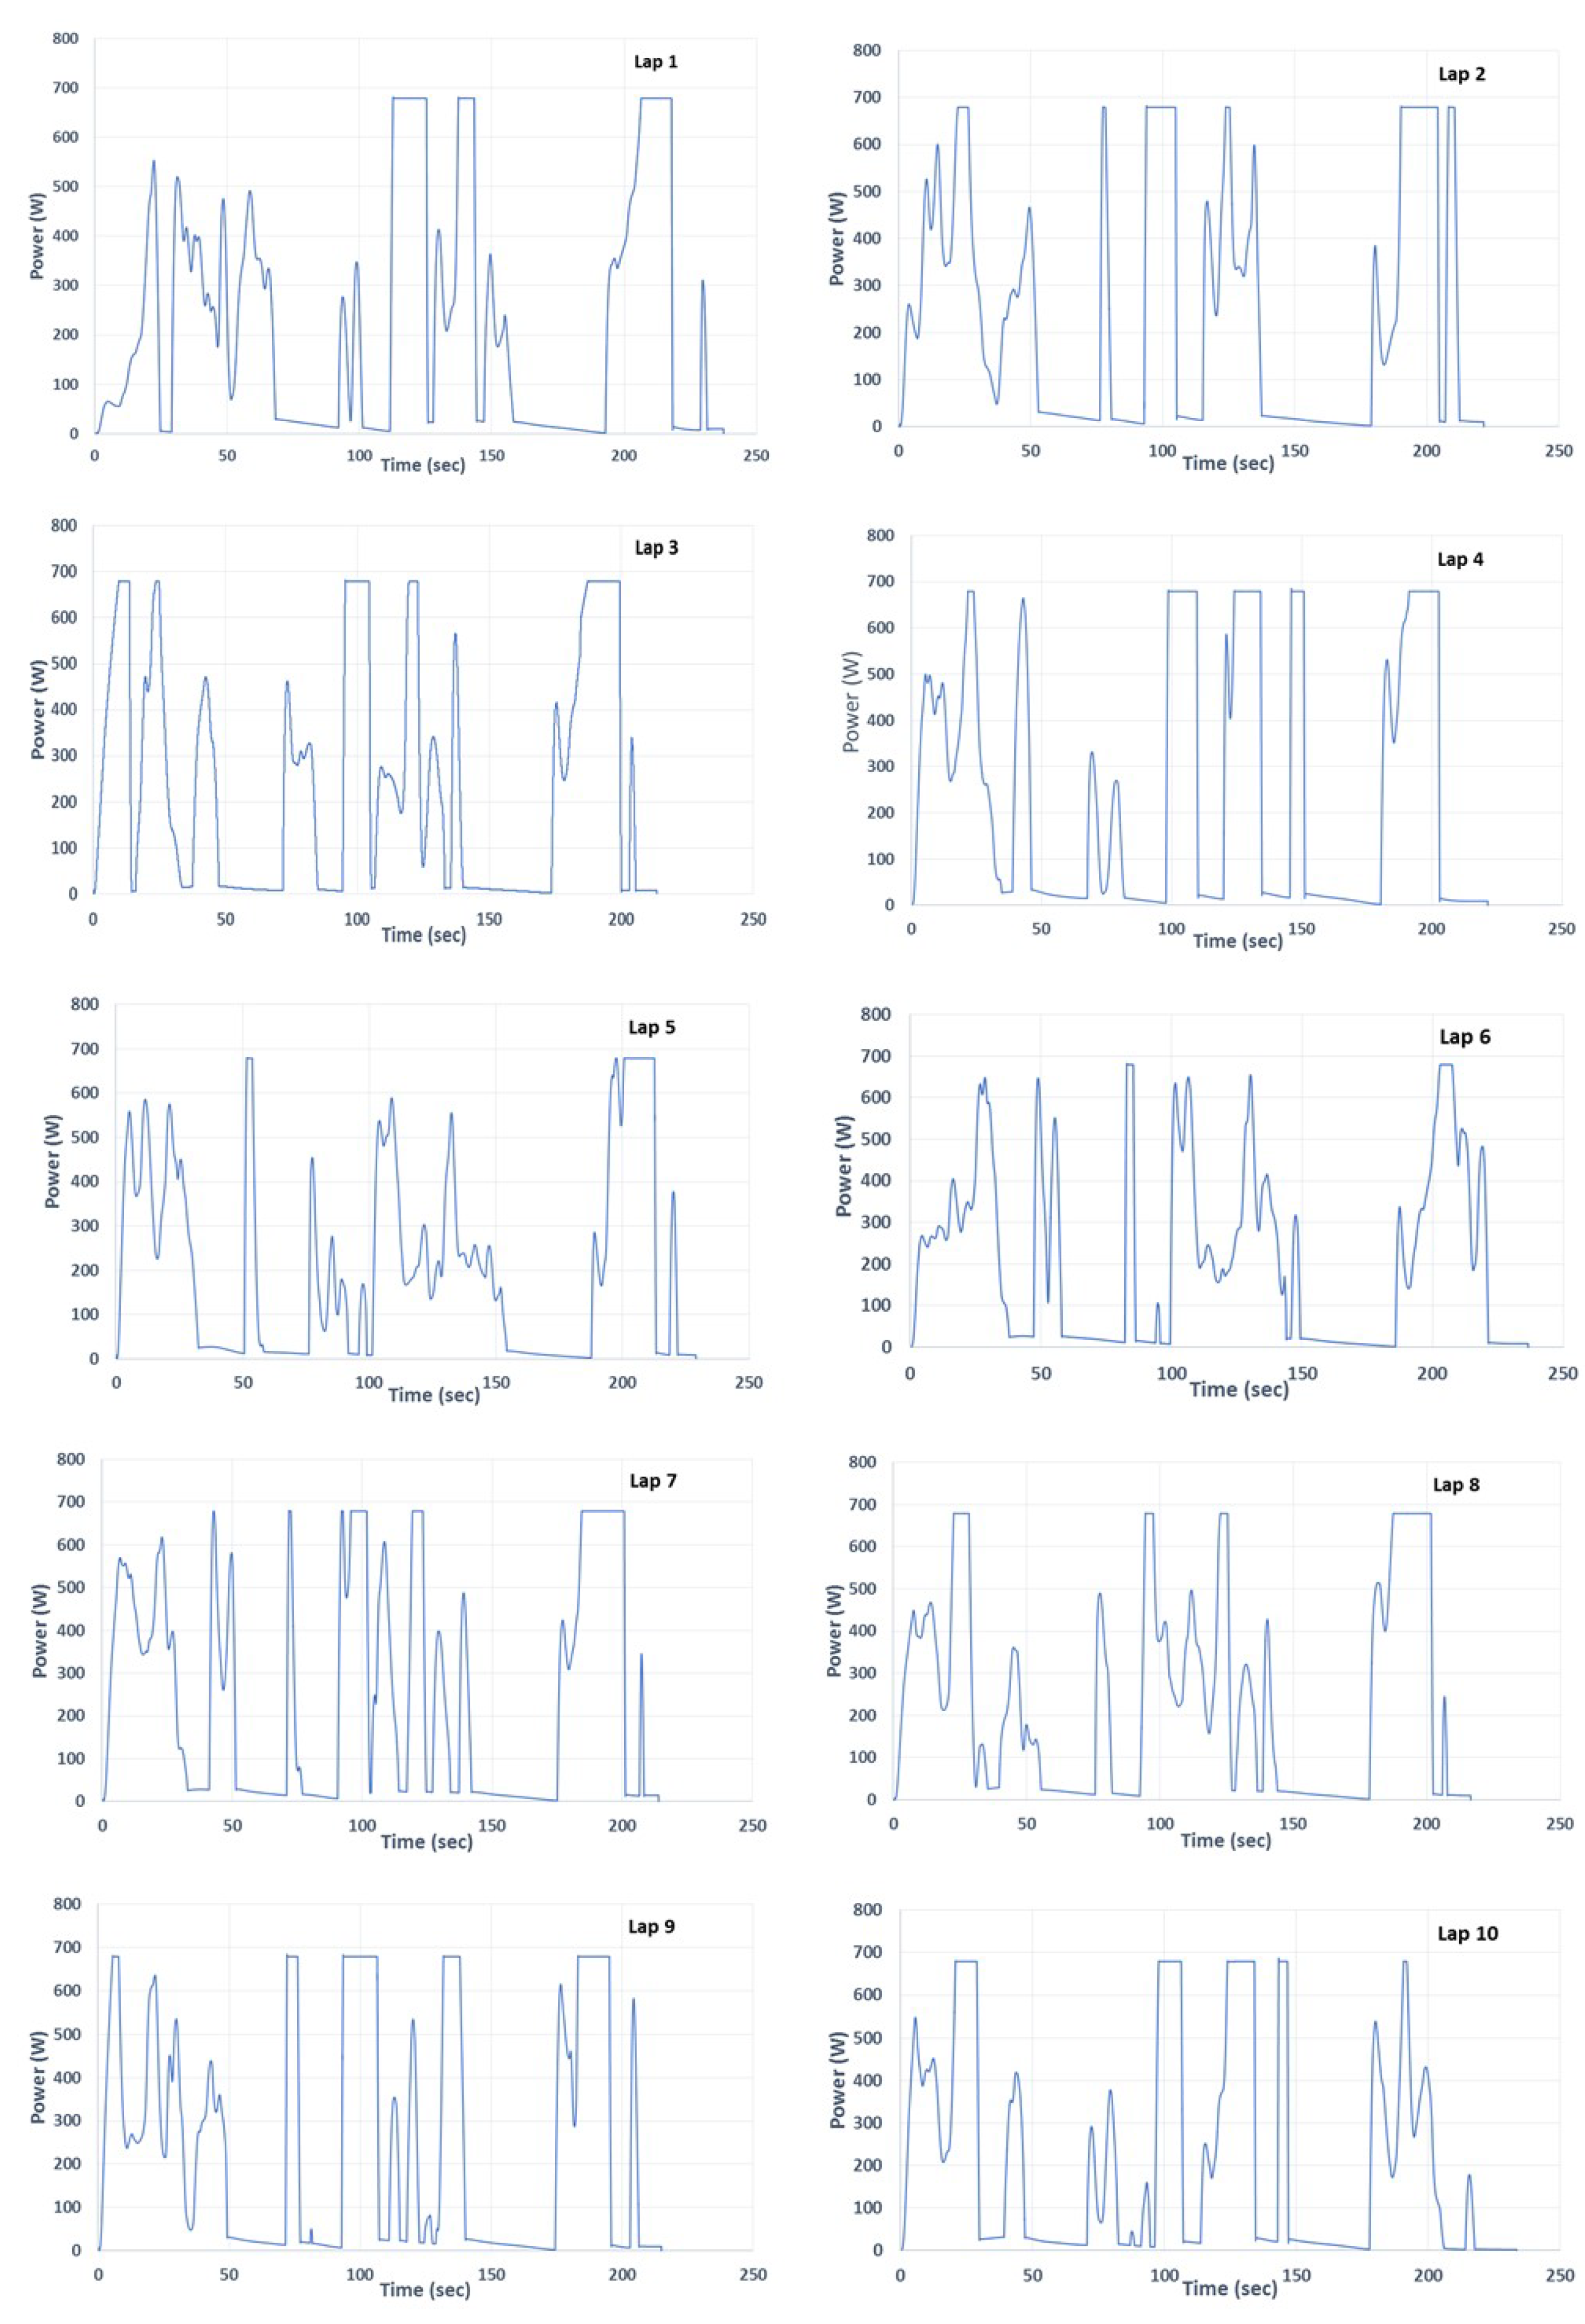
2.2.2. Racetrack Experimental Testing
3. Vehicle Modeling and Simulation
3.1. Theoretical Modelling
3.2. Race Track Modelling
3.3. Vehicle Components Modeling
3.3.1. Chassis Modeling
3.3.2. Tire Modeling
3.3.3. Powertrain
3.3.4. Other Vehicle Components
3.4. Driving Model
4. Results
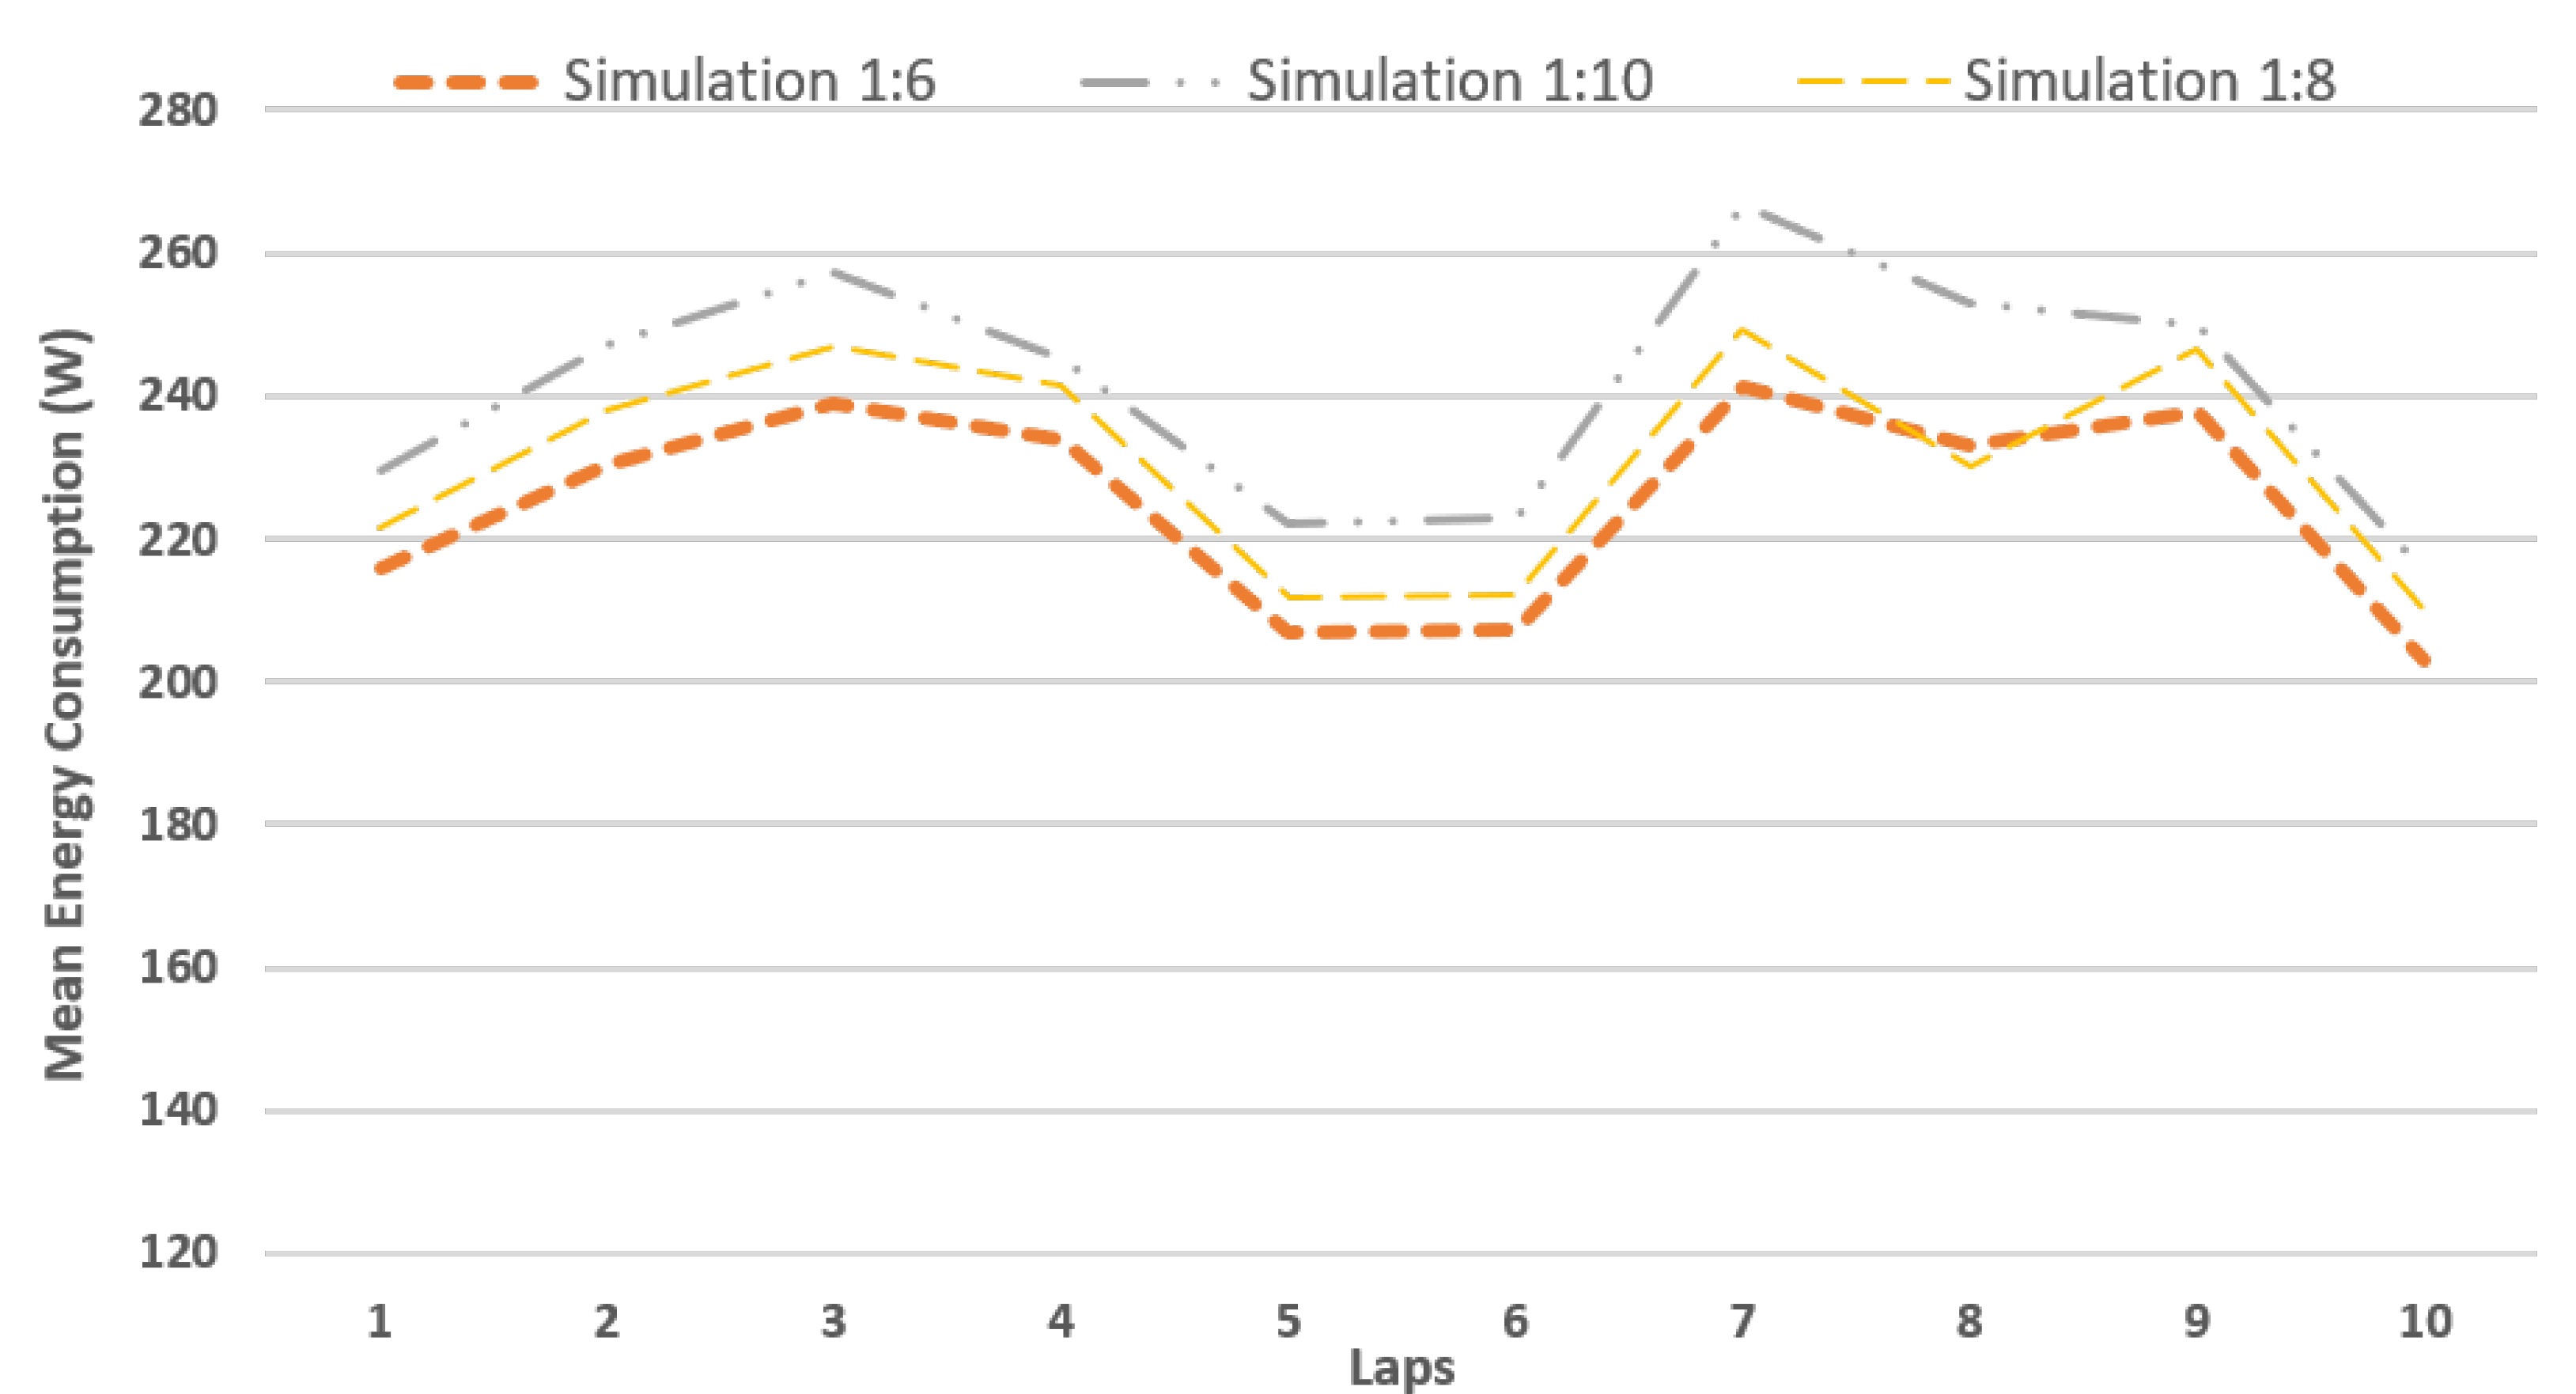
4.1. Racetrack Comparative Simulation
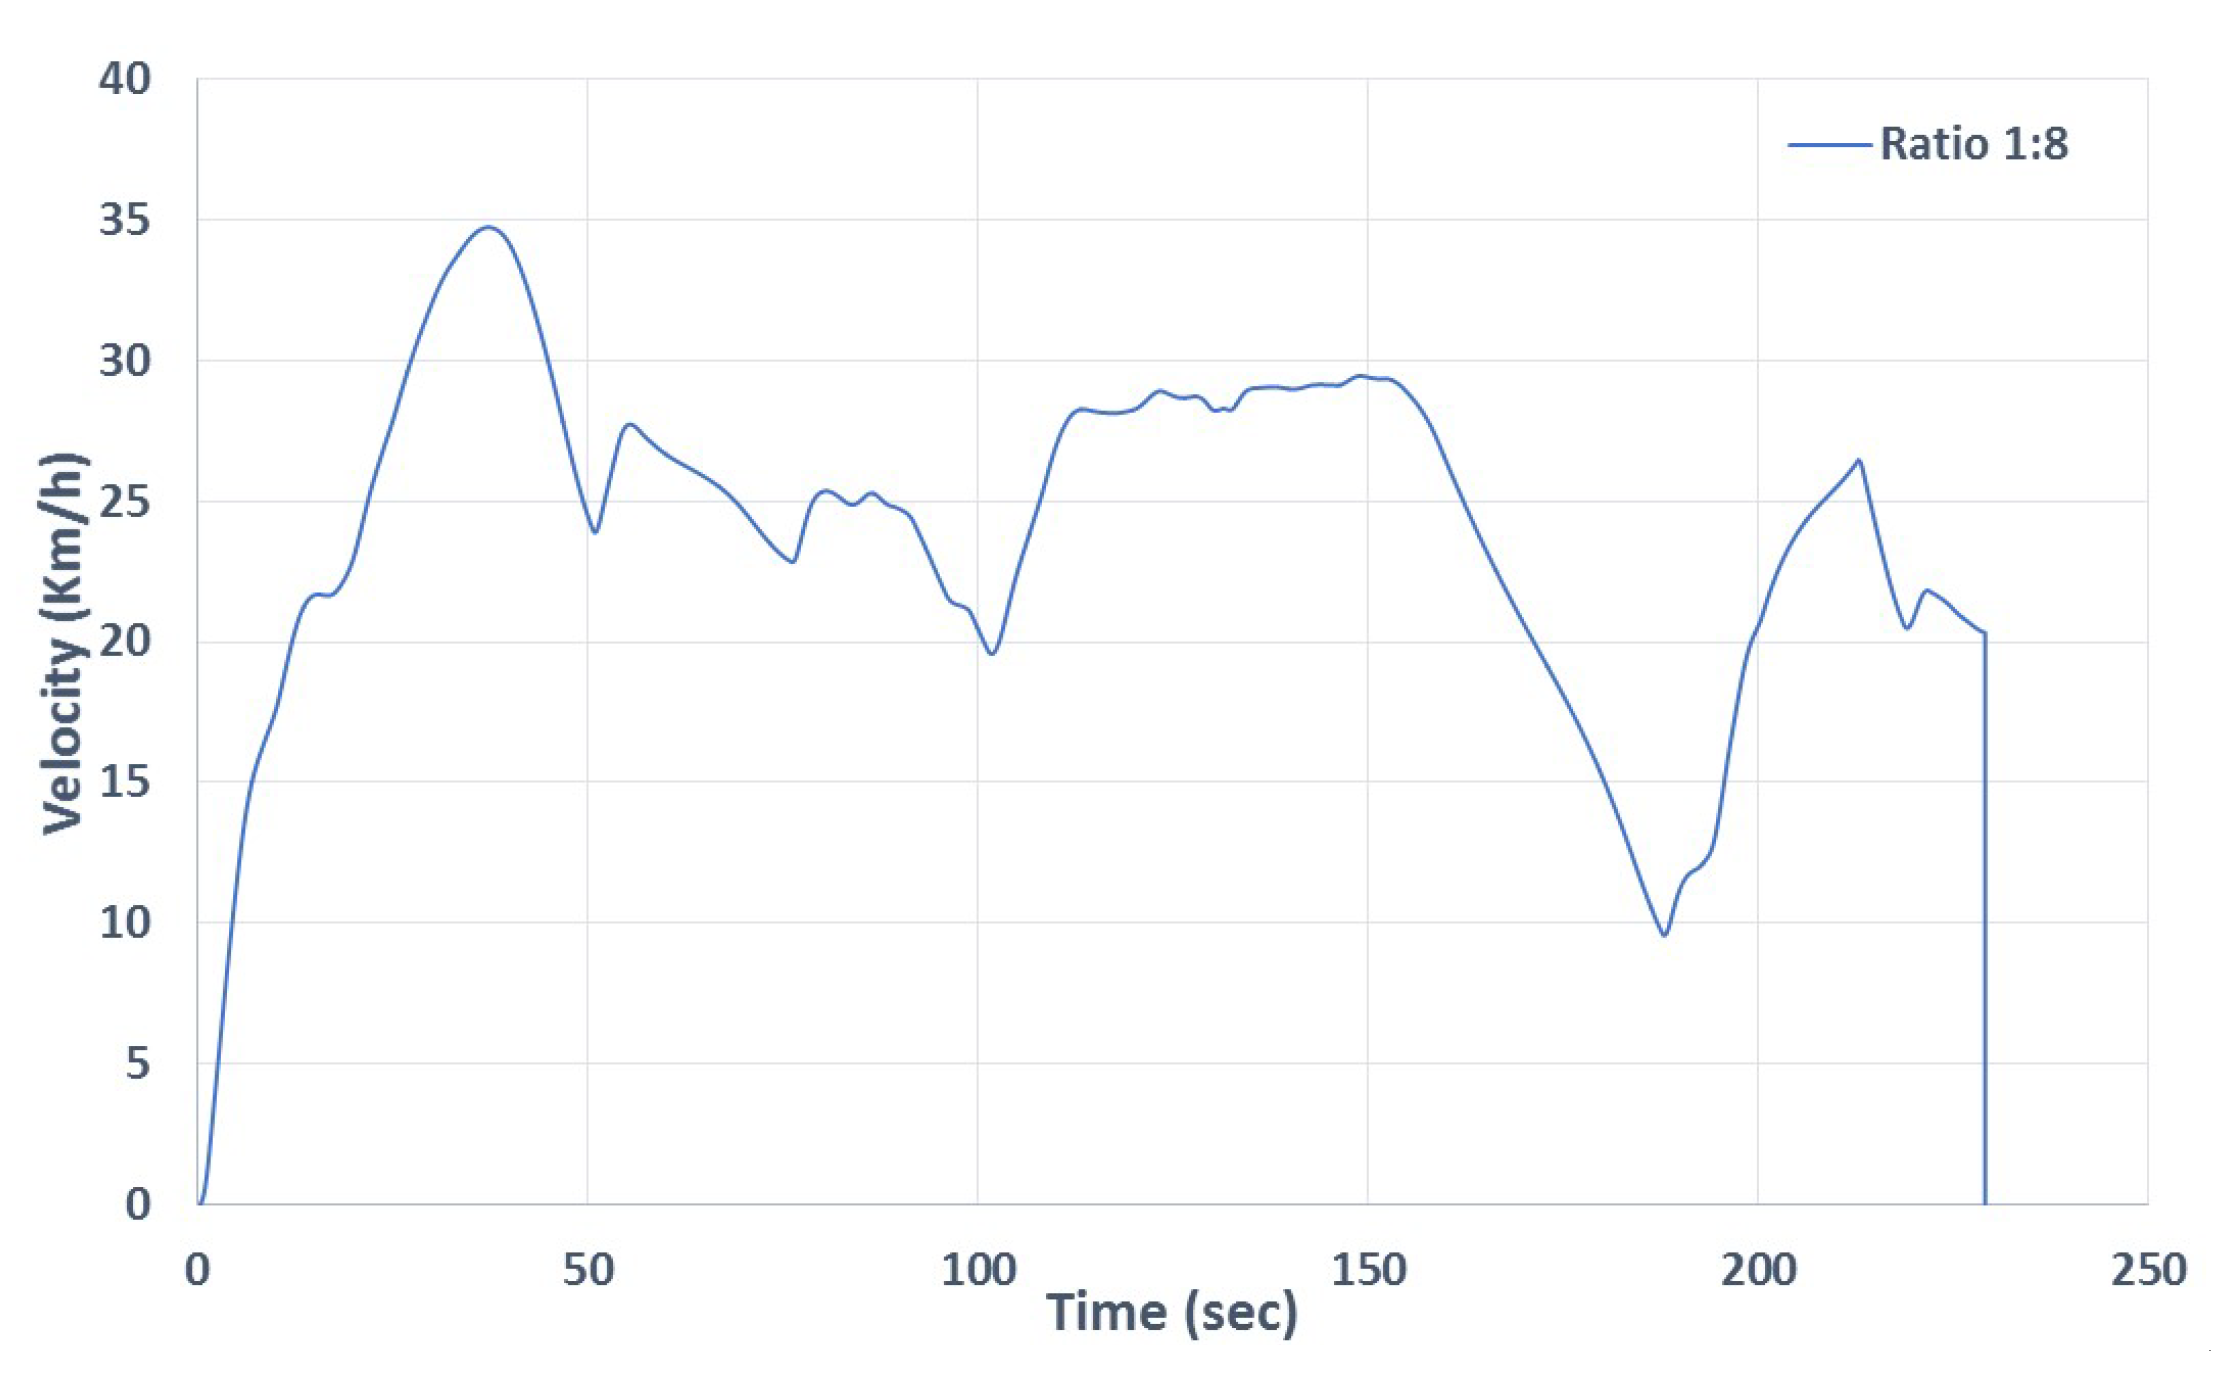
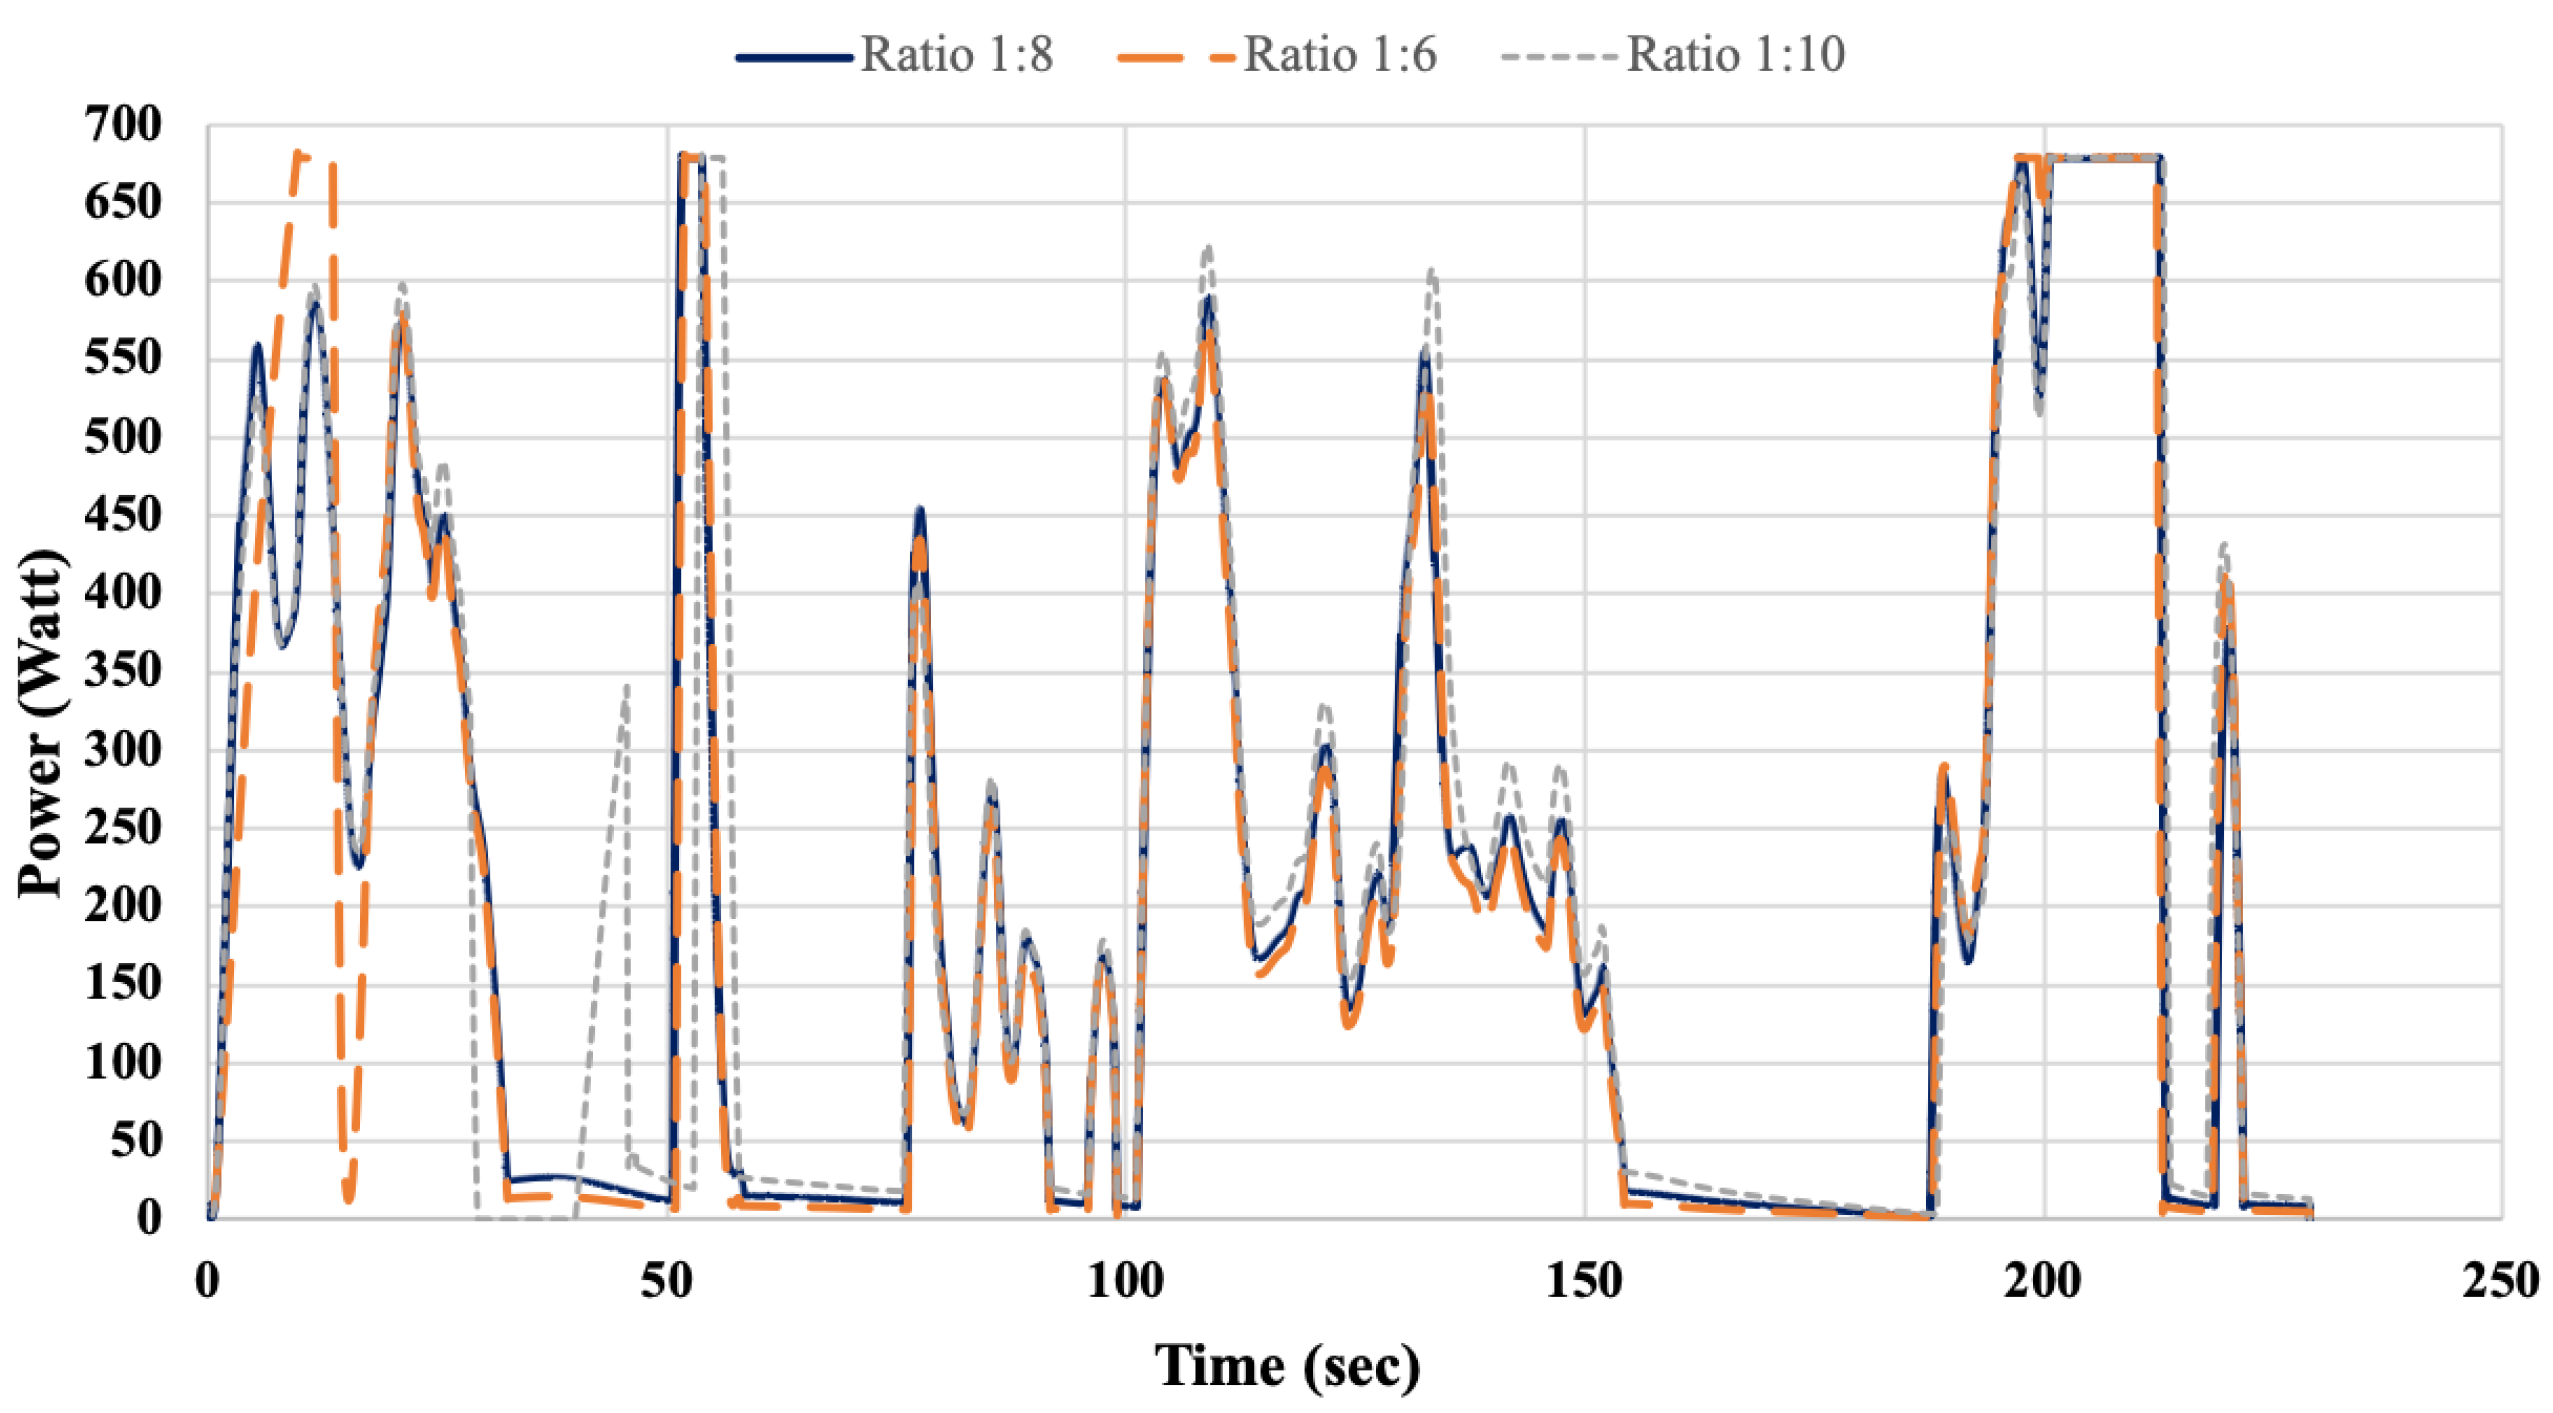
4.2. Best Lap Simulation
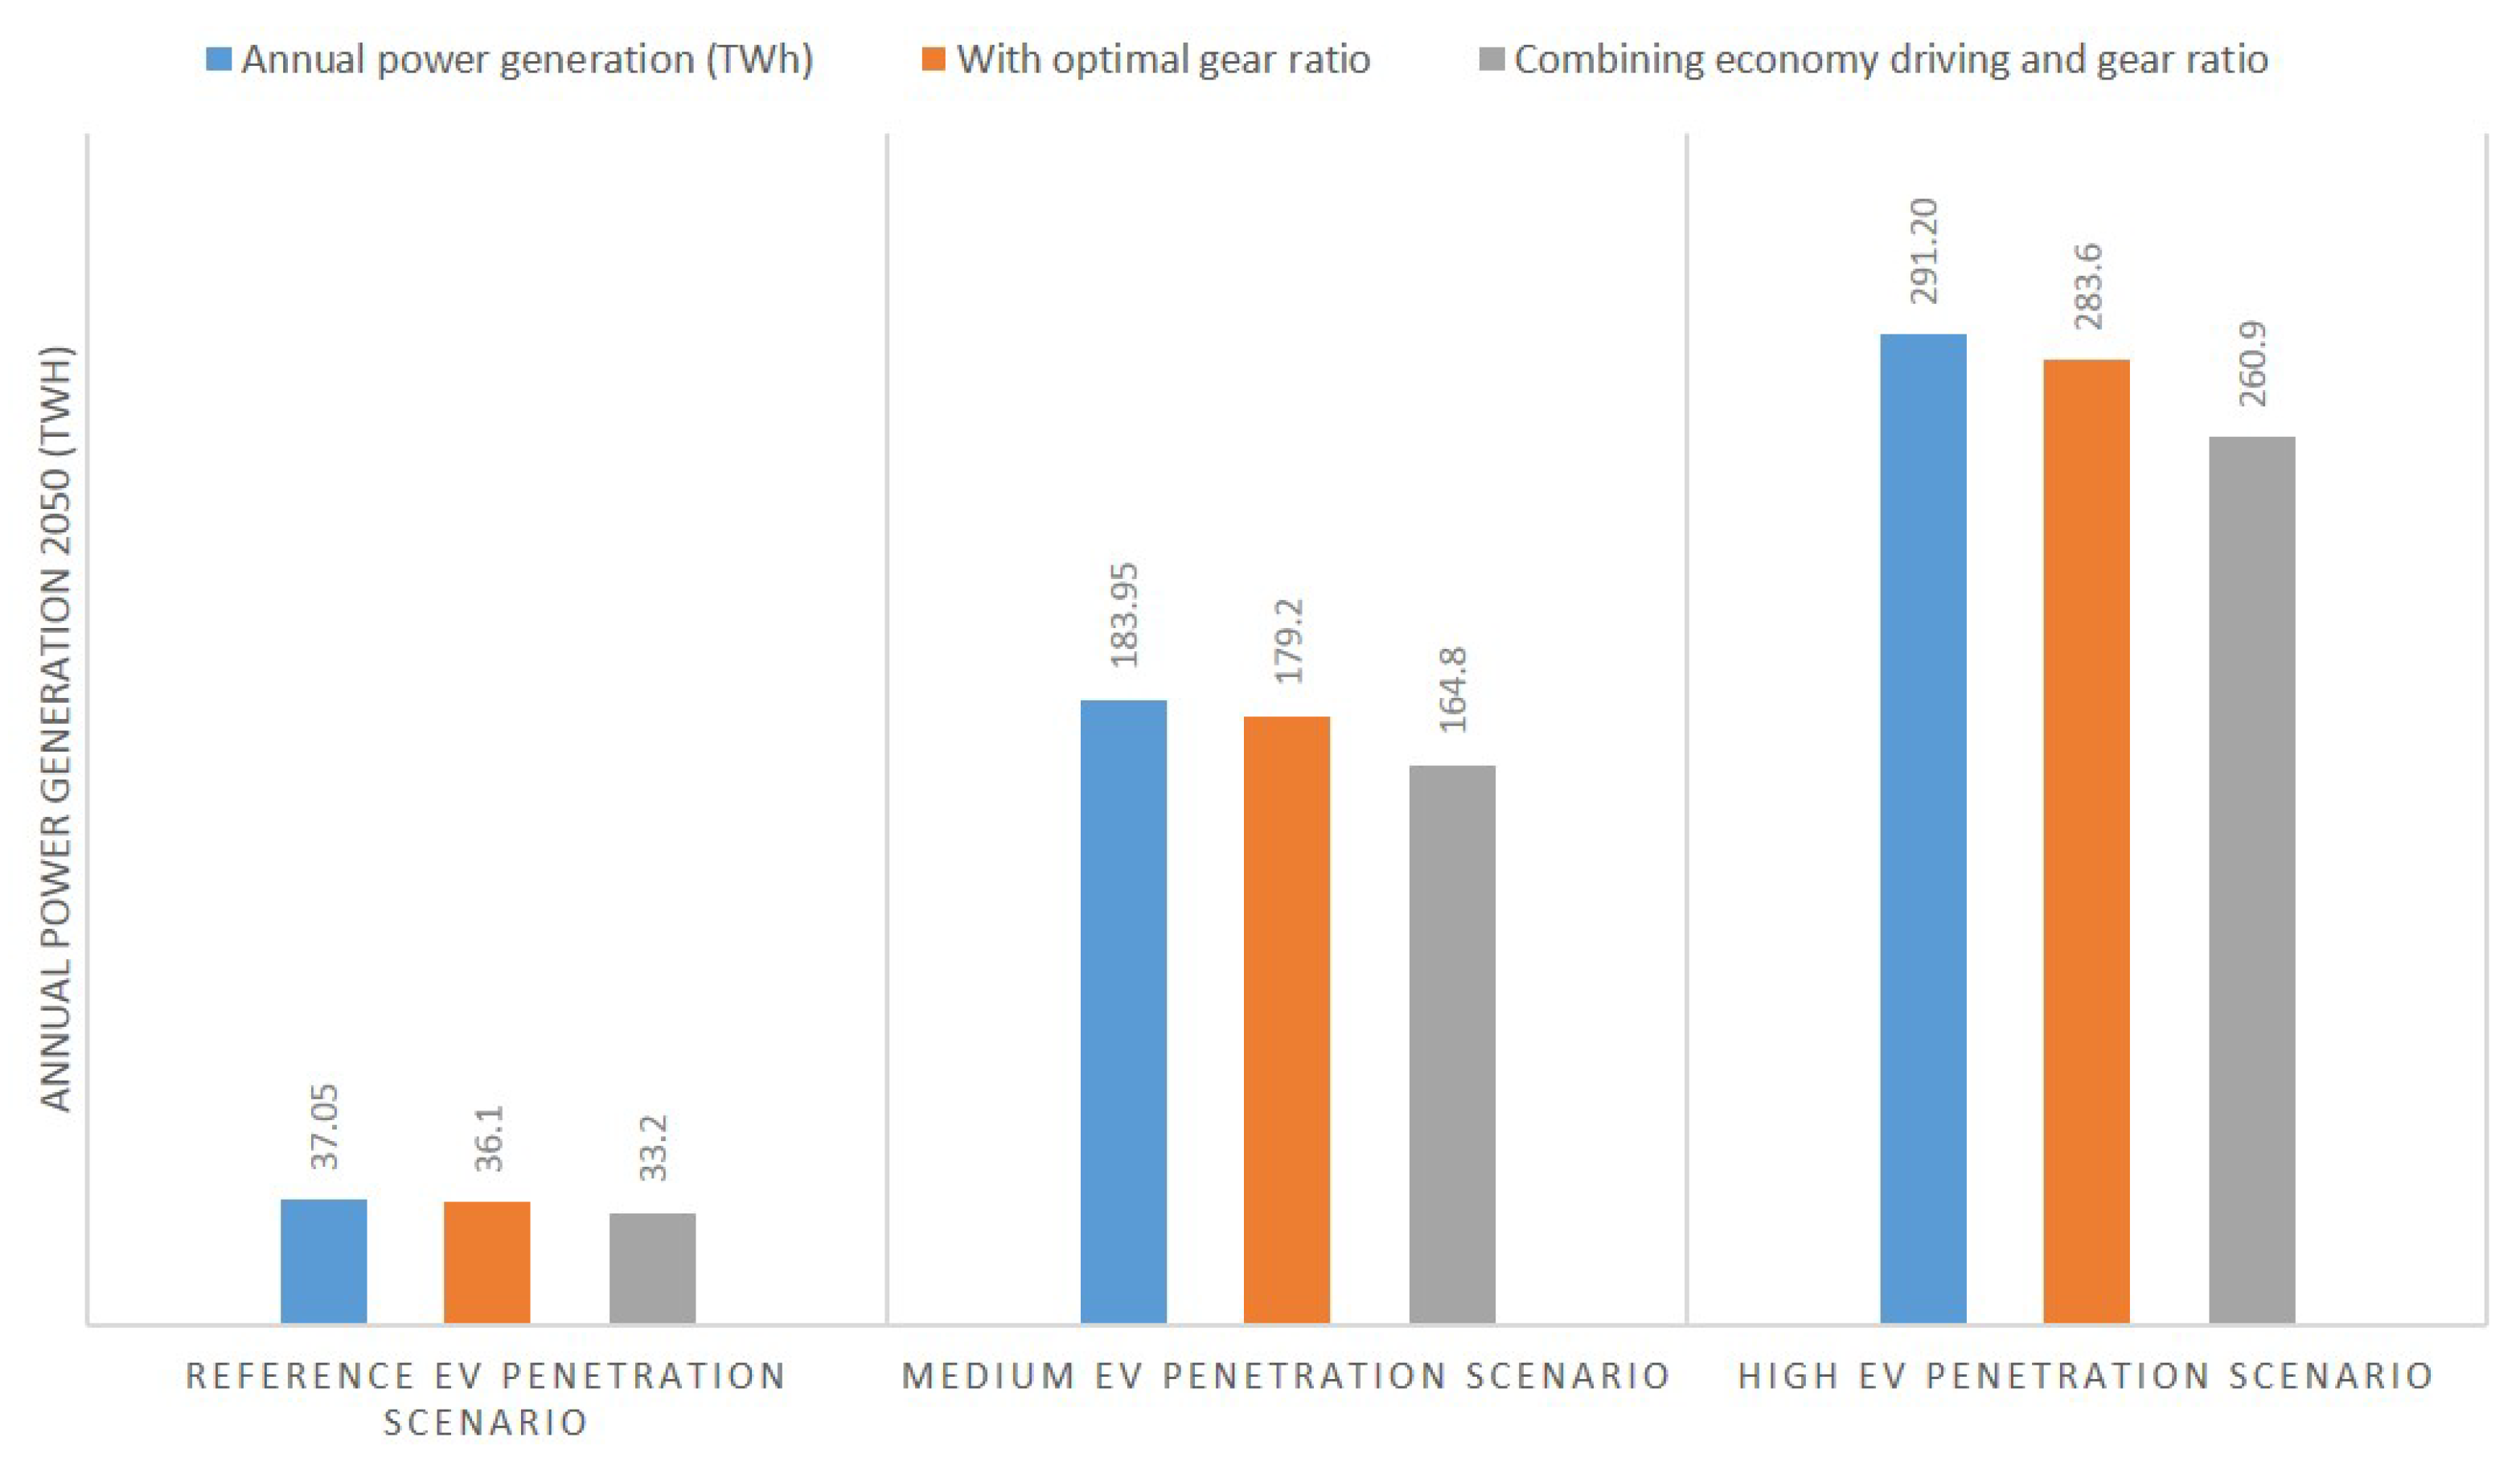
4.3. Sustainability Issues
5. Discussion
Author Contributions
Funding
Acknowledgments
Conflicts of Interest
References
- Yuksel, T.; Michalek, J.J. Effects of Regional Temperature on Electric Vehicle Efficiency, Range, and Emissions in the United States. Environ. Sci. Technol. 2015, 49, 3974–3980. [Google Scholar] [CrossRef] [PubMed]
- Luin, B.; Petelin, S.; Al-Mansour, F. Microsimulation of electric vehicle energy consumption. Energy 2019, 174, 24–32. [Google Scholar] [CrossRef]
- Xie, Y.; Li, Y.; Zhao, Z.; Dong, H.; Wang, S.; Liu, J.; Guan, J.; Duan, X. Microsimulation of electric vehicle energy consumption and driving range. Appl. Energy 2020, 267, 115081. [Google Scholar] [CrossRef]
- Yao, E.; Yang, Z.; Song, Y.; Zuo, T. Comparison of Electric Vehicle’s Energy Consumption Factors for Different Road Types. Discret. Dyn. Nat. Soc. 2013, 13. [Google Scholar] [CrossRef]
- Croce, A.I.; Musolino, G.; Rindone, C.; Vitetta, A. Energy consumption of electric vehicles: Models’ estimation using big data (FCD). Transp. Res. Procedia 2020, 47, 211–218. [Google Scholar] [CrossRef]
- Younes, Z.; Boudet, L.; Suard, F.; Gérard, M.; Rioux, R. Analysis of the main factors influencing the energy consumption of electric vehicles. In Proceedings of the 2013 International Electric Machines Drives Conference, Chicago, IL, USA, 12–15 May 2013; pp. 247–253. [Google Scholar]
- Carlson, R.; Shirk, M.G.; Geller, B.M. Factors Affecting the Fuel Consumption of Plug-In Hybrid Electric Vehicles. In Proceedings of the 25th World Battery, Hybrid and Fuel Cell Electric Vehicle Symposium & Exhibition, Shenzhen, China, 5–9 November 2010. [Google Scholar]
- Global Lightweight Car Market (2019–2024); Technical Report; Mordor Intelligence: Telangana, India, 2019.
- Reiland, J.; Bax, L.; Ierides, M.; Hielscher, C.; Toelle, J.; Bohner, F.; Lopez, I.; Pipino, A.; Daniele Bassan, D.P.; Storer, D.; et al. A Vision on the Future of Automotive Ligwthweighting: Accelerating the Decarbonisation of Automotive Mobility by Means of Lightweighting. Technical Report; H2020 Alliance Project. 2020. Available online: http://lightweight-alliance.eu/wp-content/uploads/2019/11/alliance_vision-document.pdf (accessed on 29 October 2020).
- Goede, M.; Stehlin, M.; Rafflenbeul, L.; Kopp, G.; Beeh, E. Super Light Car—Lightweight construction thanks to a multi-material design and function integration. Eur. Transp. Res. Rev. 2009, 1, 5–10. [Google Scholar] [CrossRef]
- Huluka, A.W.; Kim, C.H. Numerical study on aerodynamic drag reduction and energy harvest forelectric vehicle: A concept to extend driving range. In Proceedings of the 2nd Conference of Computational Methods in Offshore Technology and First Conference of Oil and Gas Technology (COTech & OGTech 2019), Stavanger, Norway, 27–29 November 2019. [Google Scholar]
- Yang, Z.F.; Li, S.H.; Liu, A.M.; Yu, Z.; Zeng, H.J.; Li, S.W. Simulation study on energy saving of passenger car platoons based on DrivAer model. Energy Sources Part A 2019, 41, 3076–3084. [Google Scholar] [CrossRef]
- Tzortzis, G.; Amargianos, A.; Piperidis, S.; Koutroulis, E.; Tsourveloudis, N.C. Development of a compact regenerative braking system for electric vehicles. In Proceedings of the 2015 23rd Mediterranean Conference on Control and Automation (MED), Torremolinos, Spain, 16–19 June 2015; pp. 102–108. [Google Scholar]
- Petrou, A.K.; Efstathiou, D.S.; Tsourveloudis, N.C. Modeling and control of the energy consumption of a prototype urban vehicle. In Proceedings of the 2011 19th Mediterranean Conference on Control Automation (MED), Corfu, Greece, 20–23 June 2011; pp. 44–48. [Google Scholar]
- Hofman, T.; Dai, C.H. Energy efficiency analysis and comparison of transmission technologies for an electric vehicle. In Proceedings of the 2010 IEEE Vehicle Power and Propulsion Conference, Lille, France, 1–3 September 2010; pp. 1–6. [Google Scholar]
- Spanoudakis, P.; Tsourveloudis, N.C.; Koumartzakis, G.; Krahtoudis, A.; Karpouzis, T.; Tsinaris, I. Evaluation of a 2-speed transmission on electric vehicle’s energy consumption. In Proceedings of the 2014 IEEE International Electric Vehicle Conference (IEVC), Florence, Italy, 17–19 December 2014; pp. 1–6. [Google Scholar]
- Xi, J.-q.; Xiong, G.-m.; Zhang, Y. Application of automatic manual transmission technology in pure electric bus. In Proceedings of the 2008 IEEE Vehicle Power and Propulsion Conference, Harbin, China, 3–5 September 2008; pp. 1–4. [Google Scholar]
- Spanoudakis, P.; Tsourveloudis, N.C. On the efficiency of a prototype continuous variable transmission system. In Proceedings of the 21st Mediterranean Conference on Control and Automation, Chania, Greece, 25–28 June 2013; pp. 290–295. [Google Scholar]
- Spanoudakis, P.; Tsourveloudis, N.C. A Prototype Variable Transmission System for Electric Vehicles: Energy Consumption Issues. Int. J. Automot. Technol. 2015, 16, 525–537. [Google Scholar] [CrossRef]
- Ehsani, M.; Gao, Y.; Emadi, A. Modern Electric, Hybrid Electric and Fuel Cell Vehicles: Fundamentals, Theory, and Design; CRC Press LLC: Boca Raton, FL, USA, 2010. [Google Scholar]
- Kluger, M.A.; Long, D.M. An Overview of Current Automatic, Manual and Continuously Variable Transmission Efficiencies and Their Projected Future Improvements; SAE Technical Paper Series; SAE International: Warrendale, PA, USA, 1999. [Google Scholar]
- Spanoudakis, P. Design and Tuning of Operational Parameters for a Prototype Transmission System. Ph.D. Thesis, Technical University of Crete, Chania, Greece, 2013. [Google Scholar]
- Holdstock, T. Investigation into Multiple-Speed Transmissions for Electric Vehicles. Ph.D. Thesis, University of Surrey, Guildford, UK, 2014. [Google Scholar]
- Mantriota, G. Fuel consumption of a vehicle with power split CVT system. Int. J. Veh. Des. 2005, 37, 327. [Google Scholar] [CrossRef]
- Zhang, Z.; Zuo, C.; Hao, W.; Zuo, Y.; Zhao, X.L.; Zhang, M. Three-speed transmission system for purely electric vehicles. Int. J. Automot. Technol. 2013, 14, 773–778. [Google Scholar] [CrossRef]
- Bottiglione, F.; Pinto, S.D.; Mantriota, G.; Sorniotti, A. Energy Consumption of a Battery Electric Vehicle with Infinitely Variable Transmission. Energies 2014, 7, 8317–8337. [Google Scholar] [CrossRef]
- Bingzhao, G.; Qiong, L.; Lulu, G.; Hong, C. Gear ratio optimization and shift control of 2-speed I-AMT in electric vehicle. J. Mech. Syst. Signal Process. 2015, 50, 615–631. [Google Scholar]
- Sorniotti, A.; Pilone, G.L.; Viotto, F.; Bertolotto, S.; Everitt, M.; Barnes, R.; Morrish, I. A Novel Seamless 2-Speed Transmission System for Electric Vehicles: Principles and Simulation Results. SAE Int. J. Engines 2011, 4, 2671–2685. [Google Scholar] [CrossRef]
- Elmarakbi, A.; Morris, A.; Ren, Q.; Elkady, M. Modelling and Analyzing Electric Vehicles with Geared Transmission Systems: Enhancement of Energy Consumption and Performance. Int. J. Eng. Res. Technol. 2013, 2, 1215–1254. [Google Scholar]
- Sorniotti, A.; Subramanyan, S.; Turner, A.; Cavallino, C.; Viotto, F.; Bertolotto, S. Selection of the Optimal Gearbox Layout for an Electric Vehicle. SAE Int. J. Engines 2011, 4, 1267–1280. [Google Scholar] [CrossRef]
- Rinderknecht, S. Electric power train configurations and their transmission systems. In Proceedings of the International Symposium on Power Electronics Electrical Drives Automation and Motion (SPEEDAM), Pisa, Italy, 14–16 June 2010; pp. 1564–1568. [Google Scholar]
- Knödel, U.; Stube, A.; Blessing, U.C.; Klosterman, S. Design and Implementation of requirement-driven electric drives. ATZ Worldw. 2010, 112, 56–60. [Google Scholar] [CrossRef]
- Ren, Q.; Crolla, D.; Morris, A. Effect of transmission design on Electric Vehicle (EV) performance. In Proceedings of the 2009 IEEE Vehicle Power and Propulsion Conference, Dearborn, MI, USA, 7–10 September 2009; pp. 1260–1265. [Google Scholar] [CrossRef]
- Spanoudakis, P.; Tsourveloudis, N.C.; Doitsidis, L.; Karapidakis, E.S. Experimental Research of Transmissions on Electric Vehicles’ Energy Consumption. Energies 2019, 12, 388. [Google Scholar] [CrossRef]
- Sarantinoudis, N.; Spanoudakis, P.; Doitsidis, L.; Stefanoulis, T.; Tsourveloudis, N. A study of electric vehicle prototype for shell eco-marathon. In Proceedings of the 10th Workshop on Planning, Perception and Navigation for intelligent Vehicles, 2018 IEEE/RSJ International conference on Intelligent Robots and Systems, Madrid, Spain, 1 October 2018. [Google Scholar]
- IPGDriver. User Manual, version 6.3; IPG Automotive GmbH: Karlsruhe, Germany, 2006. [Google Scholar]
- Liu, K.; Wanga, J.; Yamamoto, T.; Morikawa, T. Modelling the multilevel structure and mixed effects of the factors influencing the energy consumption of electric vehicles. Appl. Energy 2016, 183, 1351–1360. [Google Scholar] [CrossRef]
- Pacejka, H. Tire and Vehicle Dynamics, 3rd ed.; Elsevier Health Sciences: Amsterdam, The Netherlands, 2012. [Google Scholar]
- Spetler, F.; Blanco, O. Tametire 3.0; Technical Report; Michelin: Clermont-Ferrand, France, 2014. [Google Scholar]
- Sponziello, A.; Frendo, F.; Guiggiani, M. Stability analysis of a three-wheeled motorcycle. SAE Int. J. Eng. 2009, 1, 1396–1401. [Google Scholar] [CrossRef]
- Terada, K.; Sano, T.; Watanabe, K.; Kaieda, T.; Takano, K. Investigation of the behavior of three-wheel vehicles when they pass over a low road surface. In Proceedings of the Small Engine Technology Conference, Charleston, SC, USA, 15–17 November 2016. [Google Scholar]
- Lambourn, R.A. Comparison of Motorcycle and Car Tyre/Road Friction; Technical Report; TRL Limited: Crowthorne, UK, 2010. [Google Scholar]
- Limpert, R. Brake Design and Safety, Third Edition; SAE International: Warrendale, PA, USA, 2011. [Google Scholar]
- Kasten, P.; Bracker, J.; Haller, M.; Purwanto, J. Electric Mobility in Europe—Future Impact on the Emissions and the Energy Systems; Technical Report; Institute for Applied Ecology: Breisgau, Germany, 2016. [Google Scholar]
- Global Electric Vehicle Transmission Market 2019–2025; Technical Report; Mobility Foresights Automotive: Bengaluru, India, 2020.


| Body | Carbon fiber |
|---|---|
| Chassis | Aluminum—carbon fiber |
| Motor | Brushless electric motor |
| Max motor torque | 5 Nm |
| Max motor RPM | 5200 RPM |
| Power source | Battery pack 0.96 KWh |
| Dimensions | 2.5 × 1.25 × 1 m (L × W × H) |
| Max speed | 40 Km/h |
| Weight | 77 kg (excl. Driver) |
| Lap | Time (s) | Consumption Experimental (W) |
|---|---|---|
| 1 | 237.5 | 205.12 |
| 2 | 221.5 | 247.45 |
| 3 | 213.5 | 259.45 |
| 4 | 221.5 | 222.90 |
| 5 | 229 | 213.32 |
| 6 | 236.5 | 219.51 |
| 7 | 214 | 239.95 |
| 8 | 216.5 | 242.35 |
| 9 | 215 | 244.31 |
| 10 | 233.5 | 202.85 |
| Lap | Time (s) | Consumption Experimental (W) | Consumption Simulation (W) | Consumption Difference (%) | Motor Efficiency (%) |
|---|---|---|---|---|---|
| 1 | 237.5 | 205.12 | 221.60 | 7.44% | 86.86% |
| 2 | 221.5 | 247.45 | 238.01 | −3.96% | 87.75% |
| 3 | 213.5 | 259.45 | 246.94 | −5.06% | 87.82% |
| 4 | 221.5 | 222.90 | 241.49 | 7.70% | 88.35% |
| 5 | 229 | 213.32 | 211.84 | −0.70% | 89.07% |
| 6 | 236.5 | 219.51 | 212.35 | −3.37% | 88.10% |
| 7 | 214 | 239.95 | 249.45 | 3.81% | 88.09% |
| 8 | 216.5 | 242.35 | 230.30 | −5.23% | 88.14% |
| 9 | 215 | 244.31 | 246.72 | 0.98% | 88.26% |
| 10 | 233.5 | 202.85 | 209.89 | 3.35% | 87.28% |
| Lap | Time (s) | Mean Energy Consumption of Ratio 1:8 (W) | Mean Energy Consumption of Ratio 1:6 (W) | Consumption Difference (%) |
|---|---|---|---|---|
| 1 | 237.5 | 221.60 | 215.85 | −2.66% |
| 2 | 221.5 | 238.01 | 230.26 | −3.37% |
| 3 | 213.5 | 246.94 | 239.03 | −3.31% |
| 4 | 221.5 | 241.49 | 233.83 | −3.28% |
| 5 | 229 | 211.84 | 206.79 | −2.44% |
| 6 | 236.5 | 212.35 | 207.14 | −2.52% |
| 7 | 214 | 249.45 | 241.30 | −3.38% |
| 8 | 216.5 | 230.30 | 233.24 | 1.26% |
| 9 | 215 | 246.72 | 237.82 | −3.74% |
| 10 | 233.5 | 209.89 | 202.84 | −3.48% |
| Lap | Time (s) | Mean Energy Consumption of Ratio 1:8 (W) | Mean Energy Consumption of Ratio 1:10 (W) | Consumption Difference (%) |
|---|---|---|---|---|
| 1 | 237.5 | 221.60 | 229.43 | 3.41% |
| 2 | 221.5 | 238.01 | 247.22 | 3.73% |
| 3 | 213.5 | 246.94 | 257.39 | 4.06% |
| 4 | 221.5 | 241.49 | 245.27 | 1.54% |
| 5 | 229 | 211.84 | 222.12 | 4.63% |
| 6 | 236.5 | 212.35 | 222.96 | 4.76% |
| 7 | 214 | 249.45 | 266.71 | 6.47% |
| 8 | 216.5 | 230.30 | 252.95 | 8.95% |
| 9 | 215 | 246.72 | 249.88 | 1.26% |
| 10 | 233.5 | 209.89 | 215.41 | 2.56% |
| Gear Ratio | Simulation (W) | Consumption Difference (%) |
|---|---|---|
| 1:6 | 206.79 | −2.4% |
| 1:8 | 211.84 | 0% |
| 1:10 | 222.12 | 4.6% |
Publisher’s Note: MDPI stays neutral with regard to jurisdictional claims in published maps and institutional affiliations. |
© 2020 by the authors. Licensee MDPI, Basel, Switzerland. This article is an open access article distributed under the terms and conditions of the Creative Commons Attribution (CC BY) license (http://creativecommons.org/licenses/by/4.0/).
Share and Cite
Spanoudakis, P.; Moschopoulos, G.; Stefanoulis, T.; Sarantinoudis, N.; Papadokokolakis, E.; Ioannou, I.; Piperidis, S.; Doitsidis, L.; Tsourveloudis, N.C. Efficient Gear Ratio Selection of a Single-Speed Drivetrain for Improved Electric Vehicle Energy Consumption. Sustainability 2020, 12, 9254. https://doi.org/10.3390/su12219254
Spanoudakis P, Moschopoulos G, Stefanoulis T, Sarantinoudis N, Papadokokolakis E, Ioannou I, Piperidis S, Doitsidis L, Tsourveloudis NC. Efficient Gear Ratio Selection of a Single-Speed Drivetrain for Improved Electric Vehicle Energy Consumption. Sustainability. 2020; 12(21):9254. https://doi.org/10.3390/su12219254
Chicago/Turabian StyleSpanoudakis, Polychronis, Gerasimos Moschopoulos, Theodoros Stefanoulis, Nikolaos Sarantinoudis, Eftichios Papadokokolakis, Ioannis Ioannou, Savvas Piperidis, Lefteris Doitsidis, and Nikolaos C. Tsourveloudis. 2020. "Efficient Gear Ratio Selection of a Single-Speed Drivetrain for Improved Electric Vehicle Energy Consumption" Sustainability 12, no. 21: 9254. https://doi.org/10.3390/su12219254
APA StyleSpanoudakis, P., Moschopoulos, G., Stefanoulis, T., Sarantinoudis, N., Papadokokolakis, E., Ioannou, I., Piperidis, S., Doitsidis, L., & Tsourveloudis, N. C. (2020). Efficient Gear Ratio Selection of a Single-Speed Drivetrain for Improved Electric Vehicle Energy Consumption. Sustainability, 12(21), 9254. https://doi.org/10.3390/su12219254