Abstract
Measuring and monitoring tree diversity is a prerequisite for altering biodiversity loss and the sustainable management of forest ecosystems. High temporal satellite remote sensing, recording difference in species phenology, can facilitate the extraction of timely, standardized and reliable information on tree diversity, complementing or replacing traditional field measurements. In this study, we used multispectral and multi-seasonal remotely sensed data from the Sentinel-2 satellite sensor along with geodiversity data for estimating local tree diversity in a Mediterranean forest area. One hundred plots were selected for in situ inventory of tree species and measurement of tree diversity using the Simpson’s (D1) and Shannon (H′) diversity indices. Four Sentinel-2 scenes and geodiversity variables, including elevation, aspect, moisture, and basement rock type, were exploited through a random forest regression algorithm for predicting the two diversity indices. The multi-seasonal models presented the highest accuracy for both indices with an R2 up to 0.37. In regard to the single season, spectral-only models, mid-summer and mid-autumn model also demonstrated satisfactory accuracy (max R2 = 0.28). On the other hand, the accuracy of the spectral-only early-spring and early-autumn models was significant lower (max R2 = 0.16), although it was improved with the use of geodiversity information (max R2 = 0.25).
1. Introduction
Starting from the 1990s, there has been an international recognition and a sense of urgency for natural capital conservation and altering of the accelerating biodiversity loss observed during the past 50 years [1]. Multiple conservation actions have been designed and implemented from local to global scales during the last few decades, but the rate of biodiversity loss and degradation of ecosystems is not slowing [2,3]. The problems associated with biodiversity loss are pronounced in the fragile Mediterranean-type ecosystems.
The Mediterranean area has been characterized as a biodiversity hotspot [4] due to its high floristic richness and distinguished endemism; both attributes reveal the important biogeographical peculiarities existing in a relative limited areal extent [5,6]. The current levels of Mediterranean biodiversity are a result of the distinct natural (scarce water resources, temperature and precipitation seasonality, geology, topography) and cultural (human interaction/disturbances from human presence) characteristics of the Mediterranean region [7,8,9].
In particular, Mediterranean forests harbor most of the area’s terrestrial biodiversity, hosting over 25,000 species of vascular plants [10]. Tree species richness and diversity in these ecosystems, as well as a high degree of endemism, which is evidenced by the presence of 201 endemic taxa (species and subspecies) [7], play a crucial role in supporting forest biodiversity. Accordingly, it is an important factor for ecosystem functioning, productivity and provision of multiple ecosystem services [11,12]. Yet, tree species diversity in Mediterranean forests is threatened by the progress of various degradation factors including climate warming, drought intensification, deforestation, erosion and desertification as well as urban expansion, rural abandonment, and uncontrolled tourism development [13,14]. Effective conservation of tree diversity in the Mediterranean forests is therefore a critical priority, urging the need for the establishment of an effective, operational approach, capable of providing assessment of the baseline state of tree diversity as well as facilitating identification of early warning signs of diversity change at multiple spatial scales. This information is crucial for designing and introducing policies and management actions for halting tree diversity decline and creating more resilient forest areas [15].
Traditional field measurement is a key, accurate approach for collecting bio-geographical data, recording and analyzing the properties, processes, and functions of forest ecosystems [16,17]. However, in situ measurements alone cannot simply address the need of biodiversity or tree diversity monitoring [18,19]. Satellite remote sensing can be used together with traditional field surveys [17,20,21,22] in order to minimize deficiencies of the latter, related to budget, time, and personnel demands. This synergetic approach can provide reliable, updated and cost-efficient information on tree species diversity at multiple spatial and temporal scales, in heterogeneous, large or remote regions with reduced time and personnel costs [22,23].
The potential of earth observation (EO) as an effective tool for exploring and monitoring patterns of tree diversity had been largely ignored until the early 2000s, as previous studies have thoroughly reviewed [22,24,25]. Yet, at the early stages of EO application in diversity estimation, caveats similar to other domains were also identified. These constraints were related to availability and costs for imagery, costs of specialized EO software and hardware tools, computational power demands, technical expertise required to process EO data, analytical skills to convert EO data products into actual biodiversity-related knowledge, and last but not least, operational sensor characteristics [26].
With the advent and improvement of technical characteristics of earth observation sensors, considerable efforts have been expended, attempting to operationally employ EO for tree diversity estimation [27]. The early 2000s brought significant advances in the capabilities of the existing technology in terms of the spatial resolution of commercial satellites (IKONOS, Quickbird). Subsequently, this evolution has promoted the use of high-resolution commercial satellites for tree species diversity estimation [28,29]. The free and open Landsat policy by the United States Geological Survey (USGS) was another breakthrough that led to an increase in the research efforts relying on the use of Landsat data for tree diversity estimation [30], similar to other thematic domains [31]. The introduction of Sentinel-2 satellite to an operational phase from 2015 onwards once again transformed the potential of EO technology to contribute to spatially explicit tree diversity mapping and monitoring. Sentinel-2 provides multispectral information with a 5 day revisit cycle, along with a spatial resolution up to 10 m, offering the potential to incorporate temporal–seasonal information in the diversity modelling process [32].
In the past, rather few studies have examined the season-dependence of the relationship between spectral reflectance recorded by satellite sensors and tree diversity, and as such, the influence of phenology remains under-investigated [17,33]. While sensors with high temporal resolution were available, the coarse spatial resolution scales (hundreds of meters), provided very weak (if any) relationship with field-measured diversity [22]. On the contrary, temporal changes in spectral reflectance as recorded by medium to high spatial resolution sensors can be linked with phenology and physiology differences existing among species, and provide critical information for tree diversity mapping [34]. Moreover, the higher temporal resolution of Sentinel-2 images (compared to the near-two-week revisit time of Landsat images previously available) facilitates seasonal information extraction and minimizes cloud obstruction—a common constraint when it comes to multi-date image series over mountainous forest areas.
Further to the enhanced remotely sensed information provided by Sentinel-2 imagery, geodiversity related information can also be used to determine tree species diversity across space and scales. The term geodiversity is used to describe the different forms of variability observed in a set of Earth’s abiotic processes and features [35]. While there is a lack of consensus in regard to the exact elements and characteristics it encompasses according to its definition [36], geodiversity incorporates many of the environmental patterns and processes influencing tree diversity [37].
So far, many studies have focused explicitly on elements of topography, soil or hydrology as drivers and potential predictors of the variations in the spatial patterns of tree diversity [19,36,38,39,40]. Despite the direct and indirect effects of geodiversity in forest species distribution [36], very few studies have included geodiversity elements to improve the prediction of tree diversity, along with spectral or texture information extracted from EO data [41].
The main aim of this study is to explore the use of Sentinel-2 spectral data and geodiversity information for tree diversity estimation in a Mediterranean forest area through a random forest regression modelling procedure. This work is a follow-up of earlier research, evaluating the use of various non-parametric algorithms and imagery from sensors with different technical characteristics for increasing the accuracy of tree diversity estimation [42,43] in the area. Through these earlier research findings, we have proved that although Sentinel-2 data resulted to lower prediction accuracy compared to commercial very high-spatial resolution data, it is still a cost-efficient alternative for diversity modeling. We also identified that further research was deemed necessary to explore the potential to integrate temporal spectral information in the diversity modelling process.
The specific objectives of the study are: (i) to evaluate seasonal data from Sentinel-2 satellite imagery in estimating two tree diversity indices, (ii) to provide evidence regarding preferable season for estimation of α-diversity, and (iii) to examine the contribution of geodiversity variables to the accuracy of predictive models for α-diversity.
2. Materials and Methods
2.1. Study Area
The Northern Pindos National Park (NPNP) is located in the northern part of the Pindos mountain range, covers an area of approximately 2000 sq. km, and lies on the borders of the Regional Units of Ioannina and Grevena, in northwest Greece (Figure 1).
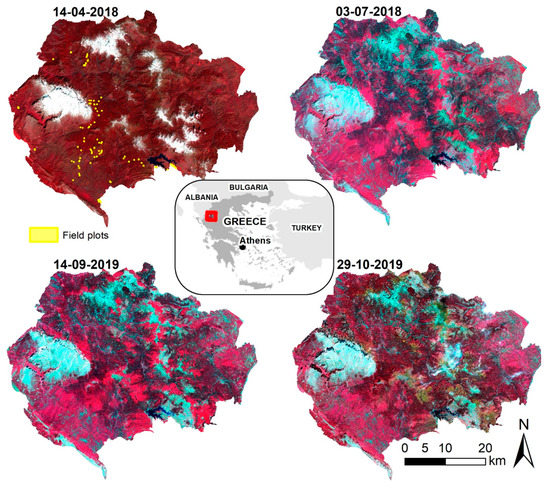
Figure 1.
Location of the study area, field plots and the four Sentinel-2 MSI satellite images used in the study (R: NIR, G: Red, B: Green).
The NPNP was established in 2005, with the purpose of conserving the high biodiversity which is found in this mountainous territory. It consists of several areas of great biological and geological value which are under special legislation status, such as the Vikos-Aoos and Pindos National Forests, one Biogenetic Reserve, eleven sites belonging to the European Network of Protected areas «NATURA 2000» and eleven wildlife refuges.
The diverse mountainous, with marked altitude variations terrain is dominated by several high peaks with altitudes well above 2000 m, including Smolikas, the second highest mountain in Greece, Tymfi, Vassilitsa, and Ligkos, and a significantly high number of steep mountain streams. The geological substrate of the NPNP is also diverse, including calcareous and siliceous rocks such as limestones, flysch, dolomites and granites. Ultramafic rocks also appear, although locally and to a lesser extent. The average monthly temperatures in the NPNP fluctuates between 0.9 and 21.4 °C, while the annual rainfall ranges from 880 to 1660 mm.
The great elevational range and substrate variation of the region is reflected in the diversity of the flora and plant communities. The forests in the NPNP are, in general, of natural origin and forest vegetation generally follows the typical altitudinal zonal pattern. In the lower altitudes of the montane zone (up to approximately 1000 m) forest communities of thermophilous deciduous species dominate the landscape. These include principally mixed stands of oaks, namely Quercus frainetto, Q. cerris, Q trojana, Q. petraea and Q. pubescens, or—in suitable habitats—a large variety of other deciduous tree species that may contain mainly Ostrya carpinifolia, Carpinus orientalis, C. betulus, Fraxinus ornus, Corylus avellana, Tilia tomentosa, T. platyphyllos and several Acer species. In the latter case, a mixture of deciduous oak species may participate to a lesser extent.
The forested middle to high elevations (of altitudes up to 1600 m) are covered by coniferous forests comprising of black pine (Pinus nigra) and fir (Abies borisii-regis) or closed deciduous stands of beech (Fagus sylvatica). Mixed communities of the above conifers and beech occasionally occur.
The higher montane zone, which extends above 1600 m, is covered by usually open or fragmented conifer stands consisting of Pinus leucodermis. These pine formations in the subalpine zone show a degraded stand structure; they are subjected to the common occurrence of avalanches and extend to the treeline in a patchy and shrubby form, often on stony or rocky soils [43].
2.2. Field Data
Reference data were collected during a field survey during summer 2018. As described in Mallinis et al. [43], a total of 100 plots (Figure 1), 20 × 20 m each, were selected using the gradsect method of survey [44]. Elevation, slope and aspect were used for identifying the strongest environmental gradients and establishing gradsects, where subsequently field plots were located randomly [43]. All forest tree species with a diameter at breast height above 8 cm were identified and measured. Subsequently, tree diversity within each plot was estimated using Shannon’s (H′) [45] and Simpson’s (D1) [46] diversity indices.
H′ highlights both species abundance and richness based on the proportion pi of each ith species found within a plot:
On the other hand, D1 emphasizes the evenness component [46].
2.3. Satellite Data Preprocessing
A multi-seasonal set of four Sentinel-2 images was selected based on expert knowledge regarding seasonal changes in vegetation within the NPNP as well as constraints related to the minimum cloud coverage (Figure 1).
The remote sensing dataset included images which, in accordance with the site’s altitude, correspond to mid-spring (12 April 2018), mid-summer (3 July 2018), mid-autumn (14 September 2019) and late autumn (29 October 2019). The specific periods were deliberately selected as representative phases of tree cambium annual activity in order to facilitate the quantification of phenological variations among the local different forest types.
All images were originally accessed from Copernicus Open Access Hub as orthoimage tiles processed at level L1C (i.e., top-of-atmosphere reflectance). The 8 tiles (2 for each date) were afterwards converted to surface reflectance using the Sen2Cor processor to perform atmospheric and terrain correction [47].
For the subsequent analysis, bands with 10 (i.e., blue: 490 nm, green: 560 nm, red: 665 nm, near-infared: 842 nm) and 20 m spatial resolution centered at 705 (band 5), 740 (band 6), 783 (band 7), 865 (band 8A), 1610 (band 11), and 2190 nm (band 12) were used. In the case of the 20 m bands, pixel values at each plot center were identified for the analysis. Finally, in the case of the 10 m bands images, the pixel’s reflectance falling within the plot boundary was used to assign a mean spectral value to each plot.
2.4. Geodiversity-Related Variables
Indicators of topography including elevation, slope, soil/substrate, topographic radiation aspect index (TRASP), and integrated moisture index (IMI) were extracted from a 5 m digital elevation model (DEM).
Soil parent material affects soil type to some extent (especially in newly developed soils) and is often crucial for the plant communities present. However, detailed information on the soils of the NPNP is not provided in the published literature until today. In order to use this apparent relation, data on basement rock type within the national park were extracted from 1:50,000 scale soil maps [48] and were included in the analysis process. TRASP results from a cosine transformation of area’s aspect to a continuous range (0 to 1), in order to address the circular nature circular resulting from degree measurement in the 0–360 range [49]. IMI is a DEM-based index [50] that has been developed for predicting forest productivity as a function of the source, flow accumulation and curvature of the landscape. The IMI and TRASP indices were calculated through the Geomorphometry and Gradient Metrics Toolbox [51].
2.5. Statistical Modelling
Relationships between the two tree diversity indices and the spectral/geodiversity variables were assessed through a random forest (RF) modelling procedure [52] using the randomForest [53] package. The popularity of RF lies in its simplicity and ability to provide accurate, robust results, even in the case of limited sample size and high-dimensional feature spaces [54]. RF as an ensemble method of machine learning, and is based on bootstrap aggregation (bagging) to construct many individual decision trees, using at each node the best among a subset of input variables [55]. The average of the predicted values from each tree in the ensemble is the final prediction of each RF model.
During the bagging process, a subset of the original data was selected with replacement and used for individual tree development. The remaining samples, representing the out-of-bag (OOB) sample, are employed for the validation of the model [56]. Aggregating the OOB predictions of each tree, we get the mean squared error of the model [57]. Previous studies have identified that RF does not require an independent dataset to assess model accuracy, since the internal accuracy measures provide robust, reliable results [58].
RF algorithm is easy to implement as only three parameters need to be specified by the user: tree number in the forest (ntree), the number of variables randomly sampled as candidates at each split (mtry), and the node size that specifies the minimum number of observations in a node. Accordingly, the ntree was optimized based on OOB estimated error, the optimal mtry was set to default values (p/3 where p is number of variables), and node size was also set to the default value of five [53].
Initially, we trained RF models based on spectral information for each image and for the complete multi-temporal dataset. Subsequently, four new single-date models for each date and one multi-seasonal model were developed considering spectral, topographic, soil, and moisture information as predictor variables.
2.6. Model Perfomance
The prediction error and the models’ performance were measured through the use of the OOB sample. The OOB sample was used for computing the R-square (R2), indicating the percentage of the variation measured in the dependent variable explained by the variation of the independent variables (Equation (1)), the root mean square error (RMSE) quantifying the average prediction error of the model (Equation (2)) and the mean absolute error (MAE), expressing the absolute difference between the actual and the predicted i-th values of the total (n) samples (Equation (3)):
where is the mean of the actual values.
3. Results
Based on spectral variables models, the results indicate that predictions of the examined tree diversity indices (H′ and D1) were more accurate using multi-seasonal (R2 = 0.31, RMSE = 0.33, MAE = 0.27 and R2 = 0.37, RMSE = 0.18, MAE = 0.15 for H′ and D1, respectively) imagery. The July model (R2 = 0.25, RMSE = 0.34, MAE = 0.28 and R2 = 0.28, RMSE = 0.19, MAE = 0.16 for H′ and D1, respectively) (Table 1) was the best performing single-date model. The April imagery generated the lowest accuracy (R2 = 0.04, RMSE = 0.39, MAE = 0.33 and R2 = 0.04, RMSE = 0.22, MAE = 0.19 for H′ and D1, respectively) (Table 1). The accuracy results attained from both single-date and multi-seasonal models suggest that models better explained the Simpson’s diversity (D1) than the Shannon Index (H′) models.

Table 1.
Accuracy assessment results for the tree diversity models based only on spectral information (white cells) and on spectral and geodiversity information (grey cells).
The validation results between the tree diversity indices (H′ and D1) based on full predictor variable dataset (Table 1) indicate that geodiversity variables produced a subtle improvement in the prediction of the two tree diversity indices for the best performing diversity models (Figure 2). In regard to the performance of the models considering both spectral and geodiversity variables, the July model attained the highest accuracy for predicting H′ (R2 = 0.26, RMSE = 0.34, MAE = 0.27) and D1 (R2 = 0.30, RMSE = 0.19, MAE = 0.15). Incorporation of the geodiversity variables along with multi-seasonal spectral information provided a marginal improvement in prediction accuracy for H′ (R2 = 0.31, RMSE = 0.33, MAE = 0.26) and D1 (R2 = 0.37, RMSE = 0.18, MAE = 0.14).
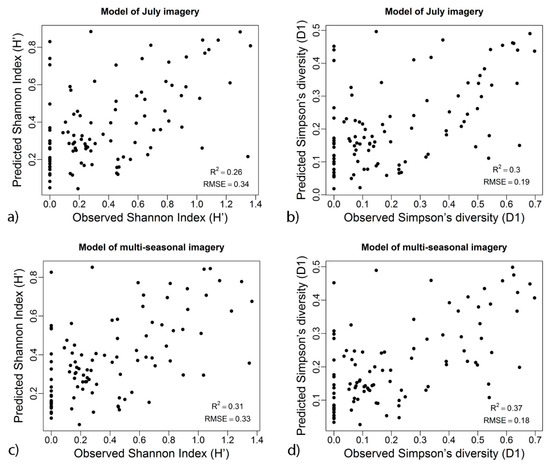
Figure 2.
Scatterplots of predicted versus observed tree diversity indices values, using the best performed model based on full datasets: (a) Shannon index of July imagery, (b) Simpson diversity for July imagery, (c) Shannon index of multi-seasonal imagery (d) Simpson diversity for multi-seasonal imagery.
In the case of the less satisfactory spectral model (i.e., April), the prediction accuracy increased by 7% and 9%, respectively, for Shannon’s and Simpson’s diversity indices. Likewise, a similar improvement was observed in the case of the September dataset presenting R2 = 0.20 for Shannon’s and R2 = 0.25 Simpson’s indices.
The resulting maps of tree diversity using the fused July spectral-geodiversity information for the Shannon and Simpson’s diversity indices are presented in Figure 3.
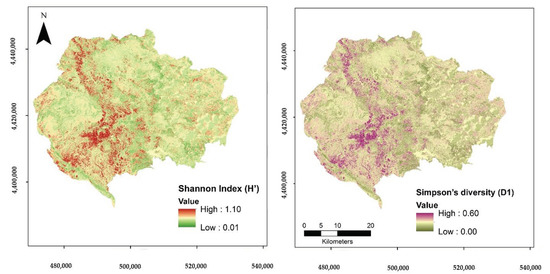
Figure 3.
Maps of predicted Shannon Index (H′) and Simpson’s diversity (D1) based on the July spectral and geodiversity variables model.
4. Discussion
Higher accuracy results both in the case of the single spectral reflectance and the combined reflectance-geodiversity models were identified for the prediction of Simpson’s diversity (D1) compared to Shannon index (H′). This is consistent with previous research findings in the area using a different set of images [43], as well as other recent studies on different ecosystem types [59]. This may be linked to the nature of Simpson’s diversity (D1), being a measure of relative concentration of dominance and sensitive to abundant species [60]. On the other hand, Shannon as index of equitability, is more sensitive to rare species [28], assuming that all species are randomly sampled and are represented in the sample [61]. Consequently, in our study area, D1 is more appropriate to model α-diversity since dominant species play an important role in NPNP.
In regard to the variations in the relationship between tree diversity spectral reflectance across different seasons, the results of the present study indicate a higher prediction accuracy when July and October imagery were employed, compared to the models based on scenes acquired in April and September. In general, reports from previous works provide models of lower accuracy during the transitional seasons (spring-autumn), whereas higher fidelity of spectral imaging is obtained during the peak of the growing season. In an alpine conifer forest, Torresani et al. [62] also observed that tree species diversity and variation in spectral reflectance presented stronger relationship in mid-June and early July. Arekhi et al. [63], who examined the relationship between tree diversity (Shannon’s index) and several Landsat TM spectral bands (original and synthetic) in a temperate forest in Turkey, identified that the image acquired in late June facilitated the development of the most accurate model. On the other hand, the lowest accuracy was observed when involving the October and November images. However, results from research conducted in forest formations belonging to distant biomes and subject to a different climatic regime may be quite contrasting. Mandosela et al. [64], using two Worldview images captured during peak productivity and senescence season in a South African savanna woodland, identified the latter as the most appropriate for tree diversity modeling purposes.
In our site, the vegetation optimum and the high photosynthetic activity observed at the end of June and in early July, enables the recording of subtle differences in the reflectance of the fully developed leaves of the various tree species within each plot [62]. The late-autumn image (October) successfully records the variation in canopy reflectance due to the variable onset of leaf senescence of individual deciduous species. The rather low accuracy of the September image might be related to the decreased photosynthetic activity of both deciduous and evergreen species and the stress observed due to water shortage in the preceding months [63]. Similarly, in April, the low accuracy might be related to the fact that emergence of leaves had not started yet for many of the deciduous species in the area. Beech, which is one of the earliest budding species, does not reach full foliage development before the end of April, whereas oak species may need a couple of weeks more. Because of this, the ability of the satellite sensors to discriminate individual species is critically limited in the specific period. Moreover, the multi-seasonal models appear to improve α-diversity estimation. This could be explained by the fact that multi-seasonal imagery records the full range of the phenological changes and leaf traits of different tree species, increasing the spectral separability amongst them [65,66].
The good performance of multi-seasonal models is in agreement with the results of previous studies. For instance, in Madonsela et al.’s [64] study conducted in southern African savannah, it was demonstrated that tree species discrimination was improved using multi-date data set of WorldView-2 imagery. In Kampouri et al.’s [67] study over a forest area in northern Greece, the synergy of two Sentinel-2 images captured in the summer and winter period, improved forest tree diversity accuracy estimation. In our study, the adopted gradsect method of field survey, allowed us to locate plots capturing the geomorphological range and substrate variation of the region that influence the tree diversity and the distribution of pure (deciduous or coniferous) and mixed stands found in the region. While this approach facilitated sampling the whole range of the forest vegetation types found within the Park, it limits the potential to study in detail the relevance of seasonal information for tree diversity mapping over individual forest types within the Park. Such an in-depth analysis would allow us not only to address the limitation related to the fact that D1 and H′ indices quantify one aspect of tree species diversity, but also to address temporal changes and variability in the spectral response of the same forest type due to structural diversity [68], or factors related to leaf age and drought stress [22]. Nevertheless, earlier studies have demonstrated that when factors such as species composition are accounted for in EO-based models of forest parameters, substantially more accurate prediction models can be attained [69].
While previous studies have identified that diversity of trees and other plants is influenced by various geodiversity factors [39,70], rather few have considered using spatially explicit information on geodiversity variables’ distribution such as topography and soil, alongside spectral information for improving tree diversity prediction. In our study, and in regard to the synergetic use of geodiversity and spectral variables, the prediction accuracy was notably improved in the case of the early autumn and early spring models, with spectral information alone providing low prediction accuracy. On the other hand, mid-summer, late-autumn and multi-seasonal models presented little, if any improvement in terms of prediction accuracy when using the geodiversity variables.
This is related to the level of importance of the input variables in each model, as each variable is not equally important in each model, yet not all the variables contribute to the final fitness. The reasoning is that even though the RF method is not parsimonious, it uses all variables available in the dataset to construct the response predictor and it ascertains which variables contribute to the prediction through the split rule optimization [71]. Consequently, we conclude that geodiversity variables were more important than spectral variables of the early autumn and early spring season model, and equal or less important than the spectral variables of the summer and autumn season model.
In our study, we did not assessed the importance of individual geodiversity variables for tree diversity prediction. Previous studies supports that the topographic metric of elevation was the most important for diversity estimation, contrary to slope and aspect [40]. Read et al. (2020) [36] also identified that tree diversity was positively related to topography across the United States. Moreover, there is some empirical evidence that not all the diversity indices are equally correlated to landscape parameters; for instance, simple indices such as species richness correlated better with landscape parameters than the Shannon index [60]. However, as earlier studies suggest, the power of geodiversity for the prediction of tree diversity (and biodiversity in general) is ecosystem- and scale-dependent, while different forms of geodiversity might be more relevant for the various dimensions of biodiversity as well [36]. Future research should address this research question. Additionally, in-depth analysis is needed for considering seasonal, spectral and spatial enhancements of the original bands, an approach that has been shown to provide increased modeling accuracy [72].
5. Conclusions
This study, as part of a wider research design for the assessment of tree diversity through remote sensing in the Northern Pindos National Park, focuses on exploring the effects of seasonal spectral information and geodiversity in the prediction of tree diversity patterns. The study builds upon previous research findings that indicate that information inherent in open access Sentinel-2 imagery can be used as a good compromise between modelling accuracy and cost-efficiency.
The results of the current study confirm our previous finding concerning the magnitude of the relationship between Sentinel-2 bands and field measured tree diversity. They also confirm that Sentinel’s 2 spectral reflectance can provide more accurate estimates of tree diversity measurements, expressed through Simpson’s D1 rather than Shannon’s H′ index.
This study also indicates that the relationship between real-world tree-diversity and spectral reflectance is season-dependent. Satellite image acquired at the peak of photosynthetic production and vegetation optimum (i.e., July) resulted in the development of a more accurate prediction model. On the other hand, imagery acquired in mid-spring, when leaf emergence is not completed for all deciduous species of the area, presents little, if any, relationship with tree diversity.
The inclusion of geodiversity information in the tree diversity estimation models along with the spectral one, resulted in a subtle improvement in model performance, when Sentinel-2 bands alone explained more than 20 percent of the tree diversity variance. On the contrary, when the spectral information was inadequate (i.e., before complete leaf onset), or in mid-autumn when the typical color palette of broadleaves is subject to change, geodiversity variables contributed significantly in the increase in the modelling accuracy.
Overall, our study was motivated by the limited number of previously published works, exploring the seasonal dependence of the spectral reflectance-tree diversity relationship, using fine spatial resolution satellite data [22]. In addition, few studies have evaluated the use of geodiversity elements for complementing spectral-related information in order to improve tree diversity modeling and prediction [41].
In regard to the findings of earlier studies on these fields, the following conclusions can be drawn:
- We identified that forest canopy phenology influences the relationship between spectral response and field measured tree diversity. We confirm the findings of studies conducted in similar biomes [63] that this relationship is season-dependent, and imagery acquired during the peak of the growing season should be preferably used for EO-based prediction of tree diversity. The availability of open access Sentinel-2 imagery with high temporal resolution facilitates acquisition of imagery with minimal atmospheric influences over the specific growing period—a challenging task in mountainous areas.
- While geodiversity has been demonstrated to present different levels of influence over plant species diversity [2,36,40,73], studies exploiting EO data to predict patterns of diversity rarely consider geodiversity variables alongside these data [36]. We can hypothesize that this might be related to the fact that the majority of these studies rely on the use of parametric modelling procedures that have specific requirements for the distribution and correlation of the data. We propose the use of a non-parametric modelling approach, namely random forest regression modelling, to circumvent such data assumptions and requirements.
- In our study, we identified that geodiversity can play an important role in alpha tree diversity modelling, especially when the vegetation phenology limits the information available in the spectral response recorded by satellite sensors. Due to the geographical variability in diversity patterns across heterogenous Mediterranean areas, the benefits of the coupling of remote-sensing with geodiversity models are likely to vary depending on the geographical location of the study and forest vegetation types [33]. Our study should motivate similar empirical studies across various geographical areas and ecosystems. Knowledge of the underlying mechanisms through which geodiversity affects biodiversity at multiple scales and biomes can increase efficiency in the incorporation of geodiversity variables along with EO data in the diversity modelling process [35]. Airborne [40] or satellite [35] imagery can be also used for extracting geodiversity variables at appropriate scales for modelling all three levels of tree diversity.
The syntheses of the results from such studies can provide more detailed insights into the actual shape and strength of this relationship, so that such an evidence-based approach can lead to more transferable, operational use of EO and geodiversity data for tree species diversity mapping across landscapes.
Author Contributions
Conceptualization, G.M.; methodology, G.M., I.C. and G.K.; investigation, G.M., I.C. and G.K., data analysis I.C. and G.M., writing—original draft preparation, G.M. and I.C.; review and editing, G.M., G.K., I.C. and A.P.K.; supervision, G.M. All authors have read and agreed to the published version of the manuscript.
Funding
This research was funded by the project “Conservation and sustainable capitalization of biodiversity in forested areas-BIOPROSPECT” (Reg. No: BMP1/2.1/2336/2017), implemented within the framework of INTERREG V-A COOPERATION PROGRAMME BALKAN MEDITERRANEAN 2014–2020 programme, co-funded by the European Union and national funds of the participating countries.
Acknowledgments
The Sentinel-2 MSI data were available from the European Space Agency at no-cost. The authors are grateful to Athanasios Stampoulidis and the staff of the Northern Pindos National Park Management Body for their help during field sampling activities.
Conflicts of Interest
The authors declare no conflict of interest.
References
- Bongaarts, J. IPBES Summary for Policymakers of the Global Assessment Report on Biodiversity and Ecosystem Services; IPBES: Bonn, Germany, 2019. [Google Scholar]
- Tukiainen, H.; Kiuttu, M.; Kalliola, R.; Alahuhta, J.; Hjort, J. Landforms contribute to plant biodiversity at alpha, beta and gamma levels. J. Biogeogr. 2019, 46, 1699–1710. [Google Scholar] [CrossRef]
- Johnson, C.N.; Balmford, A.; Brook, B.W.; Buettel, J.C.; Galetti, M.; Guangchun, L.; Wilmshurst, J.M. Biodiversity losses and conservation responses in the Anthropocene. Science 2017, 356, 270–275. [Google Scholar] [CrossRef] [PubMed]
- Myers, N.; Mittermeier, R.A.; Fonseca, G.A.B.; Fonseca, G.A.B.; Kent, J. Biodiversity hotspots for conservation priorities. Nature 2000, 403, 853–858. [Google Scholar] [CrossRef]
- Médail, F.; Quézel, P. Biodiversity Hotspots in the Mediterranean Basin: Setting Global Conservation Priorities. Conserv. Biol. 1999, 13, 1510–1513. [Google Scholar] [CrossRef]
- Médail, F.; Diadema, K. Glacial refugia influence plant diversity patterns in the Mediterranean Basin. J. Biogeogr. 2009, 36, 1333–1345. [Google Scholar] [CrossRef]
- Médail, F.; Monnet, A.-C.; Pavon, D.; Nikolic, T.; Dimopoulos, P.; Bacchetta, G.; Arroyo, J.; Barina, Z.; Albassatneh, M.C.; Domina, G.; et al. What is a tree in the Mediterranean Basin hotspot? A critical analysis. For. Ecosyst. 2019, 6, 17. [Google Scholar] [CrossRef]
- FAO. FAO and Plan Bleu State of Mediterranean Forests 2018; FAO: Rome, Italy, 2018; ISBN 978-92-5-131047-2. [Google Scholar]
- Gauquelin, T.; Michon, G.; Joffre, R.; Duponnois, R.; Génin, D.; Fady, B.; Bou Dagher-Kharrat, M.; Derridj, A.; Slimani, S.; Badri, W.; et al. Mediterranean forests, land use and climate change: A social-ecological perspective. Reg. Environ. Chang. 2018, 18, 623–636. [Google Scholar] [CrossRef]
- Aravanopoulos, F.A. Do Silviculture and Forest Management Affect the Genetic Diversity and Structure of Long-Impacted Forest Tree Populations? Forests 2018, 9, 355. [Google Scholar] [CrossRef]
- Brockerhoff, E.G.; Barbaro, L.; Castagneyrol, B.; Forrester, D.I.; Gardiner, B.; González-Olabarria, J.R.; Lyver, P.O.; Meurisse, N.; Oxbrough, A.; Taki, H.; et al. Forest biodiversity, ecosystem functioning and the provision of ecosystem services. Biodivers. Conserv. 2017, 26, 3005–3035. [Google Scholar] [CrossRef]
- Gamfeldt, L.; Snäll, T.; Bagchi, R.; Jonsson, M.; Gustafsson, L.; Kjellander, P.; Ruiz-Jaen, M.C.; Fröberg, M.; Stendahl, J.; Philipson, C.D.; et al. Higher levels of multiple ecosystem services are found in forests with more tree species. Nat. Commun. 2013, 4, 1340. [Google Scholar] [CrossRef] [PubMed]
- FAO. Food and Agriculture Organization State of Mediterranean Forests 2018; FAO: Rome, Italy, 2018; ISBN 978-92-5-131047-2. [Google Scholar]
- Mallinis, G.; Koutsias, N.; Arianoutsou, M. Monitoring land use/land cover transformations from 1945 to 2007 in two peri-urban mountainous areas of Athens metropolitan area, Greece. Sci. Total Environ. 2014, 490, 262–278. [Google Scholar] [CrossRef] [PubMed]
- Nagendra, H.; Lucas, R.; Honrado, J.P.; Jongman, R.H.G.; Tarantino, C.; Adamo, M.; Mairota, P. Remote sensing for conservation monitoring: Assessing protected areas, habitat extent, habitat condition, species diversity, and threats. Ecol. Indic. 2013, 33, 45–59. [Google Scholar] [CrossRef]
- Marvin, D.C.; Koh, L.P.; Lynam, A.J.; Wich, S.; Davies, A.B.; Krishnamurthy, R.; Stokes, E.; Starkey, R.; Asner, G.P. Integrating technologies for scalable ecology and conservation. Glob. Ecol. Conserv. 2016, 7, 262–275. [Google Scholar] [CrossRef]
- Gillespie, T.W.; Foody, G.M.; Rocchini, D.; Giorgi, A.P.; Saatchi, S. Measuring and modelling biodiversity from space. Prog. Phys. Geogr. 2008, 32, 203–221. [Google Scholar] [CrossRef]
- Gamon, J.A.; Wang, R.; Gholizadeh, H.; Zutta, B.; Townsend, P.A.; Cavender-Bares, J. Consideration of Scale in Remote Sensing of Biodiversity BT—Remote Sensing of Plant Biodiversity; Cavender-Bares, J., Gamon, J.A., Townsend, P.A., Eds.; Springer International Publishing: Cham, Switzerland, 2020; pp. 425–447. ISBN 978-3-030-33157-3. [Google Scholar]
- Rampheri, M.; Dube, T.; Dhau, I. Use of remotely sensed data to estimate tree species diversity as an indicator of biodiversity in Blouberg Nature Reserve, South Africa. Geocarto Int. 2020, 1–17. [Google Scholar] [CrossRef]
- Anderson, C.B. Biodiversity monitoring, earth observations and the ecology of scale. Ecol. Lett. 2018, 21, 1572–1585. [Google Scholar] [CrossRef]
- Rocchini, D.; Hernández-Stefanoni, J.L.; He, K.S. Advancing species diversity estimate by remotely sensed proxies: A conceptual review. Ecol. Inform. 2015, 25, 22–28. [Google Scholar] [CrossRef]
- Wang, R.; Gamon, J.A. Remote sensing of terrestrial plant biodiversity. Remote Sens. Environ. 2019, 231, 111218. [Google Scholar] [CrossRef]
- Nagendra, H. Using remote sensing to assess biodiversity. Int. J. Remote Sens. 2001, 22, 2377–2400. [Google Scholar] [CrossRef]
- Stoms, D.M.; Estes, J.E. A remote sensing research agenda for mapping and monitoring biodiversity. Int. J. Remote Sens. 1993, 14, 1839–1860. [Google Scholar] [CrossRef]
- Jakubauskas, M.E.; Price, K.P. Empirical relationships between structural and spectral factors of yellowstone lodgepole pine forests. Photogramm. Eng. Remote Sens. 1997, 63, 1375–1381. [Google Scholar]
- Turner, W.; Spector, S.; Gardiner, N.; Fladeland, M.; Sterling, E.; Steininger, M. Remote sensing for biodiversity science and conservation. Trends Ecol. Evol. 2003, 18, 306–314. [Google Scholar] [CrossRef]
- Warren, S.D.; Alt, M.; Olson, K.D.; Irl, S.D.H.; Steinbauer, M.J.; Jentsch, A. The relationship between the spectral diversity of satellite imagery, habitat heterogeneity, and plant species richness. Ecol. Inform. 2014, 24, 160–168. [Google Scholar] [CrossRef]
- Nagendra, H.; Rocchini, D.; Ghate, R.; Sharma, B.; Pareeth, S. Assessing plant diversity in a dry tropical forest: Comparing the utility of landsat and ikonos satellite images. Remote Sens. 2010, 2, 478–496. [Google Scholar] [CrossRef]
- Immitzer, M.; Atzberger, C.; Koukal, T. Tree species classification with Random forest using very high spatial resolution 8-band worldView-2 satellite data. Remote Sens. 2012, 4, 2661–2693. [Google Scholar] [CrossRef]
- Turner, W.; Rondinini, C.; Pettorelli, N.; Mora, B.; Leidner, A.K.; Szantoi, Z.; Buchanan, G.; Dech, S.; Dwyer, J.; Herold, M.; et al. Free and open-access satellite data are key to biodiversity conservation. Biol. Conserv. 2015, 182, 173–176. [Google Scholar] [CrossRef]
- Wulder, M.A.; Masek, J.G.; Cohen, W.B.; Loveland, T.R.; Woodcock, C.E. Opening the archive: How free data has enabled the science and monitoring promise of Landsat. Remote Sens. Environ. 2012, 122, 2–10. [Google Scholar] [CrossRef]
- Alleaume, S.; Dusseux, P.; Thierion, V.; Commagnac, L.; Laventure, S.; Lang, M.; Féret, J.-B.; Hubert-Moy, L.; Luque, S. A generic remote sensing approach to derive operational essential biodiversity variables (EBVs) for conservation planning. Methods Ecol. Evol. 2018, 9, 1822–1836. [Google Scholar] [CrossRef]
- Maeda, E.E.; Heiskanen, J.; Thijs, K.W.; Pellikka, P.K.E. Season-dependence of remote sensing indicators of tree species diversity. Remote Sens. Lett. 2014, 5, 404–412. [Google Scholar] [CrossRef]
- Rocchini, D.; Boyd, D.S.; Féret, J.-B.; Foody, G.M.; He, K.S.; Lausch, A.; Nagendra, H.; Wegmann, M.; Pettorelli, N. Satellite remote sensing to monitor species diversity: Potential and pitfalls. Remote Sens. Ecol. Conserv. 2016, 2, 25–36. [Google Scholar] [CrossRef]
- Zarnetske, P.L.; Read, Q.D.; Record, S.; Gaddis, K.D.; Pau, S.; Hobi, M.L.; Malone, S.L.; Costanza, J.M.; Dahlin, K.; Latimer, A.M.; et al. Towards connecting biodiversity and geodiversity across scales with satellite remote sensing. Glob. Ecol. Biogeogr. 2019, 28, 548–556. [Google Scholar] [CrossRef]
- Read, Q.D.; Zarnetske, P.L.; Record, S.; Dahlin, K.M.; Costanza, J.K.; Finley, A.O.; Gaddis, K.D.; Grady, J.M.; Hobi, M.L.; Latimer, A.M.; et al. Beyond counts and averages: Relating geodiversity to dimensions of biodiversity. Glob. Ecol. Biogeogr. 2020, 29, 696–710. [Google Scholar] [CrossRef]
- Parks, K.E.; Mulligan, M. On the relationship between a resource based measure of geodiversity and broad scale biodiversity patterns. Biodivers. Conserv. 2010, 19, 2751–2766. [Google Scholar] [CrossRef]
- Redowan, M. Spatial pattern of tree diversity and evenness across forest types in Majella National Park, Italy. For. Ecosyst. 2015, 2, 24. [Google Scholar] [CrossRef]
- Guadilla-Sáez, S.; Pardo-de-Santayana, M.; Reyes-García, V.; Svenning, J.-C. Biodiversity conservation effectiveness provided by a protection status in temperate forest commons of north Spain. For. Ecol. Manag. 2019, 433, 656–666. [Google Scholar] [CrossRef]
- Robinson, C.; Saatchi, S.; Clark, D.; Astaiza, J.H.; Hubel, A.F.; Gillespie, T.W. Topography and three-dimensional structure can estimate tree diversity along a tropical elevational gradient in Costa Rica. Remote Sens. 2018, 10, 629. [Google Scholar] [CrossRef]
- Wallis, C.I.B.; Brehm, G.; Donoso, D.A.; Fiedler, K.; Homeier, J.; Paulsch, D.; Süßenbach, D.; Tiede, Y.; Brandl, R.; Farwig, N.; et al. Remote sensing improves prediction of tropical montane species diversity but performance differs among taxa. Ecol. Indic. 2017, 83, 538–549. [Google Scholar] [CrossRef]
- Chrysafis, I.; Mallinis, G.; Korakis, G.; Dragozi, E. Forest diversity estimation using Sentinel-2 and RapidEye imagery: A case study of the Northern Pindos National Park. In Proceedings of the Seventh International Conference on Remote Sensing and Geoinformation of the Environment (RSCy2019), Paphos, Cyprus, 18–21 March 2019; Papadavid, G., Themistocleous, K., Michaelides, S., Ambrosia, V., Hadjimitsis, D.G., Eds.; SPIE: Bellingham, WA, USA, 2019; p. 50. [Google Scholar]
- Mallinis, G.; Chrysafis, I.; Korakis, G.; Pana, E.; Kyriazopoulos, A.P. A Random Forest Modelling Procedure for a Multi-Sensor Assessment of Tree Species Diversity. Remote Sens. 2020, 12, 1210. [Google Scholar] [CrossRef]
- Gillison, A.N.; Brewer, K.R.W. The use of gradient directed transects or gradsects in natural resource surveys. J. Environ. Manag. 1985, 20, 103–127. [Google Scholar]
- Shannon, C.E. A mathematical theory of communication. Bell Syst. Tech. J. 1948, 27, 379–423. [Google Scholar] [CrossRef]
- Simpson, E.H. Measurement of diversity. Nature 1949, 163, 688. [Google Scholar] [CrossRef]
- Main-Knorn, M.; Pflug, B.; Louis, J.; Debaecker, V.; Müller-Wilm, U.; Gascon, F. Sen2Cor for Sentinel-2. In Proceedings of the Image and Signal Processing for Remote Sensing XXIII, Warsaw, Poland, 11–13 September 2017; Volume 10427. [Google Scholar]
- Nakos, G. General Soil Map of Greece 1979; Forest Research of Institute: Athens, Greece, 1979. [Google Scholar]
- Roberts, D.W.; Cooper, S.V. Concepts and techniques of vegetation mapping. In Proceedings of the Land Classifications Based on Vegetation: Applications for Resource Management, Moscow, Russia, 17–19 November 1989; USDA Forest Service GTR INT-257: Ogden, UT, USA, 1989; pp. 90–96. [Google Scholar]
- Iverson, L.R.; Dale, M.E.; Scott, C.T.; Prasad, A. A Gis-derived integrated moisture index to predict forest composition and productivity of Ohio forests (U.S.A.). Landsc. Ecol. 1997, 12, 331–348. [Google Scholar] [CrossRef]
- Rigol-Sanchez, J.P.; Stuart, N.; Pulido-Bosch, A. ArcGeomorphometry: A toolbox for geomorphometric characterisation of DEMs in the ArcGIS environment. Comput. Geosci. 2015, 85, 155–163. [Google Scholar] [CrossRef]
- Breiman, L. Random forests. Mach. Learn. 2001, 45, 5–32. [Google Scholar] [CrossRef]
- Liaw, A.; Wiener, M. Breiman and Cutler’s Random Forests for Classification and Regression. Package Random For. 2015, 4, 6–10. [Google Scholar]
- Scornet, E.; Biau, G.; Vert, J.P. Consistency of random forests. Ann. Stat. 2015, 43, 1716–1741. [Google Scholar] [CrossRef]
- Genuer, R.; Poggi, J.; Tuleau-Malot, C. Variable selection using random forests. Pattern Recognit. Lett. 2010, 31, 2225–2236. [Google Scholar] [CrossRef]
- Trevor, H.; Tibshirani, R.; Friedman, J. The Elements of Statistical Learning Data Mining, Inference, and Prediction; Springer: Berlin/Heidelberg, Germany, 2009; Volume 2, ISBN 9780387848570. [Google Scholar]
- Friedman, J.H. Greedy function approximation: A gradient boosting machine. Ann. Stat. 2001, 29, 1189–1232. [Google Scholar] [CrossRef]
- Adelabu, S.; Mutanga, O.; Adam, E. Testing the reliability and stability of the internal accuracy assessment of random forest for classifying tree defoliation levels using different validation methods. Geocarto Int. 2015, 30, 810–821. [Google Scholar] [CrossRef]
- Wang, R.; Gamon, J.A.; Cavender-Bares, J.; Townsend, P.A.; Zygielbaum, A.I. The spatial sensitivity of the spectral diversity-biodiversity relationship: An experimental test in a prairie grassland. Ecol. Appl. 2018, 28, 541–556. [Google Scholar] [CrossRef]
- Morris, E.K.; Caruso, T.; Fischer, M.; Hancock, C.; Obermaier, E.; Prati, D.; Maier, T.S.; Meiners, T.; Caroline, M.; Wubet, T.; et al. Choosing and using diversity indices: Insights for ecological applications from the German Biodiversity Exploratories. Ecol. Evol. 2014, 4, 3514–3524. [Google Scholar] [CrossRef]
- Peet, R.K. The Measurement of Species Diversity. Annu. Rev. Ecol. Syst. 1974, 5, 285–307. [Google Scholar] [CrossRef]
- Torresani, M.; Rocchini, D.; Sonnenschein, R.; Zebisch, M.; Marcantonio, M.; Ricotta, C.; Tonon, G. Estimating tree species diversity from space in an alpine conifer forest: The Rao’s Q diversity index meets the spectral variation hypothesis. Ecol. Inform. 2019, 52, 26–34. [Google Scholar] [CrossRef]
- Arekhi, M.; Yılmaz, O.Y.; Yılmaz, H.; Akyüz, Y.F. Can tree species diversity be assessed with Landsat data in a temperate forest? Environ. Monit. Assess. 2017, 189, 586. [Google Scholar] [CrossRef] [PubMed]
- Madonsela, S.; Cho, M.A.; Mathieu, R.; Mutanga, O.; Ramoelo, A.; Kaszta, Ż.; Van De Kerchove, R.; Wolff, E. Multi-phenology WorldView-2 imagery improves remote sensing of savannah tree species. Int. J. Appl. Earth Obs. Geoinf. 2017, 58, 65–73. [Google Scholar] [CrossRef]
- Wolter, P.T.; Mladenoff, D.J.; Host, G.E.; Crow, T.R. Improved forest classification in the northern Lake States using multi-temporal landsat imagery. Photogramm. Eng. Remote Sens. 1995, 61, 1129–1143. [Google Scholar]
- Hill, R.A.; Wilson, A.K.; George, M.; Hinsley, S.A. Mapping tree species in temperate deciduous woodland using time-series multi-spectral data. Appl. Veg. Sci. 2010, 13, 86–99. [Google Scholar] [CrossRef]
- Kampouri, M.; Kolokoussis, P.; Argialas, D.; Karathanassi, V. Mapping of Forest Tree Distribution and Estimation of Forest Biodiversity using Sentinel-2 Imagery in the University Research Forest Taxiarchis in Chalkidiki, Greece. Geocarto Int. 2019, 34, 1273–1285. [Google Scholar] [CrossRef]
- Meng, J.; Li, S.; Wang, W.; Liu, Q.; Xie, S.; Ma, W. Estimation of forest structural diversity using the spectral and textural information derived from SPOT-5 satellite images. Remote Sens. 2016, 8, 125. [Google Scholar] [CrossRef]
- White, K.; Pontius, J.; Schaberg, P. Remote sensing of spring phenology in northeastern forests: A comparison of methods, field metrics and sources of uncertainty. Remote Sens. Environ. 2014, 148, 97–107. [Google Scholar] [CrossRef]
- Lausch, A.; Baade, J.; Bannehr, L.; Borg, E.; Bumberger, J.; Chabrilliat, S.; Dietrich, P.; Gerighausen, H.; Glässer, C.; Hacker, M.J.; et al. Linking Remote Sensing and Geodiversity and Their Traits Relevant to Biodiversity—Part I: Soil Characteristics. Remote Sens. 2019, 11, 2356. [Google Scholar] [CrossRef]
- Ehrlinger, J. ggRandomForests: Exploring random forest survival. arXiv 2016, arXiv:1612.08974. [Google Scholar]
- Madonsela, S.; Cho, M.A.; Ramoelo, A.; Mutanga, O. Remote sensing of species diversity using Landsat 8 spectral variables. ISPRS J. Photogramm. Remote Sens. 2017, 133, 116–127. [Google Scholar] [CrossRef]
- Bailey, J.J.; Boyd, D.S.; Field, R. Models of upland species’ distributions are improved by accounting for geodiversity. Landsc. Ecol. 2018, 33, 2071–2087. [Google Scholar] [CrossRef]


Publisher’s Note: MDPI stays neutral with regard to jurisdictional claims in published maps and institutional affiliations. |
© 2020 by the authors. Licensee MDPI, Basel, Switzerland. This article is an open access article distributed under the terms and conditions of the Creative Commons Attribution (CC BY) license (http://creativecommons.org/licenses/by/4.0/).