Abstract
Despite the growing attention on uncontrolled and unprofitable urban sprawling in many African countries, few pragmatic solutions have been raised or effectively implemented. While uncontrolled and unprofitable urban expansions happened primarily due to poor land use management and dysfunctional land market, the cost of land management enforcement and reform is high. This paper suggests that the recently re-emerging special economic zones (SEZs) in Africa could be a practical way of using government intervention to reduce uncontrolled urban expansion and optimize urban land use. By evaluating the spatial impacts of two SEZs on their host cities in Ethiopia and Zambia, this paper demonstrates that SEZs could notably change urban expansion in terms of its speed, direction, and spatial structure. By using SEZs as an experimental area for land policy reform, the government can also effectively unlock a profitable urban development model with the functional primary and secondary land market. However, the diverging results in Ethiopia and Zambia also show that the optimizing effect can be significant only when the government is participatory and can fulfil its public function, including delivering proper planning in advance, lunching land policy reform, and even executing compulsory land acquisition for public interests.
1. Introduction
By the end of 2018, there were over 400 million urban residents in Sub-Saharan Africa (SSA), which have been growing fast during the last three decades (the annual growth has been over 4 per cent, Appendix A) Accompanying the rapid population growth is a sharp increase in demand for urban land and construction. However, most African cities today are still suffering from ‘uncontrolled’ urban expansion, with spreading slums that lack any necessary facilities such as water or electricity (Appendix A). Worse still, a large amount of population growth will occur in uncontrolled urban slums [1]. A report by the UN-Habitat shows that most newly expanded residential areas during 1990–2014 in less developed countries (including most African countries) are ‘unplanned and disorderly’ [2]. As a result, newly developed areas in most African cities had produced few profits because there was no well-managed land market or fully-established regulation system that can reflect and protect the added value of the land during the urbanization process. Low incomes from uncontrolled and disorderly urban expansion contribute little to public revenue. Rapidly expanding African cities, with the governments possessing insufficient funding for infrastructure and urban renewal, are stuck in unplanned and unprofitable circumstances.
Scholars have estimated that by 2020, another two-thirds of African cities should be newly built to meet the demands of the urban population, which is expected to grow six times faster than in the past century [3]. If previous uncontrolled and unprofitable urban expansion in SSA cities has been worrisome, continuous sprawling urban slums will be disastrous for the rapidly urbanizing continent during the next few decades. Seeing population explosion and rapid urban expansion, Africa has recently been the frontier of urban studies and policy experiments. African governments have both taken advice from international institutions and consultants, and explored localized solutions to urban problems. However, neither international prescriptions nor indigenous solutions have fundamentally changed the ubiquitous unplanned and unprofitable status of SSA urban land use.
On the one hand, those comprehensive plans aiming to utterly eliminate all indecent urban compositions are often too complicated and too expensive to be implemented in SSA cities. Uncontrolled slums continued acting as the (only) affordable way of urban expansion. As Cain criticized, large-scale citywide projects in many African cities, ‘demonstrating some of the most progressive theories of the day in urban design’, often turned out to be ‘expensive mistakes’. They ‘create a debt burden and drain investment from more sustainable economic and social projects’ [4]. Most citywide master plans, though depicting a fascinating future for African cities, have provided a very long to-do list and are thus economically unrealistic. In addition, plans requiring a large amount of urban renewal and land requisition are often frustrated by traditional land ownership and illegal land occupation. African cities need to unlock a relatively low-cost and feasible development approach that can start a controlled and profitable urban expansion process.
Recently, the boom in the construction of special economic zones (SEZs) in African countries triggered by China-Africa cooperation has provided an excellent opportunity to explore a new urban development approach [5]. SEZs, according to Farole, are ‘demarcated geographic areas contained within a country’s national boundaries, where the rules of business are different from those that prevail in the national territory’ [6]. Although SEZs are usually launched to implement industrial policies [7,8,9] and are not primarily used as a spatial development strategy, the Chinese experience with SEZ development shows that SEZs are also crucial spatial strategies. SEZs—As new urban spaces—And their attributes as pilot areas for policy reform can help the government to optimize the urban spatial structure and to explore new land use and management approaches. In the meantime, realizing that urban expanding strategies must be optimized, but previous polished and sophisticated plans have been ‘too complicated and too costly to be deployed’ in developing countries, scholars have called for a simplified planning approach. The approach, instead of delivering everything, focuses on establishing a framework and securing public goods for undeveloped areas [10]. The kernel of the simplified approach is to apply the limited development resources available to the momentous and decisive issues that would fundamentally determine the quality of urban expansion, which is pragmatic and feasible for developing countries with minimal capacity and funds. From this perspective, SEZs, with their relatively concentrated spatial pattern and specialized functions, can be taken as a simplified planning and constructing approach.
The purpose of this study is to evaluate the extent to which SEZs as a simplified and focused planning and developing strategy can be used to avoid disorderly and unprofitable urban sprawl in African cities. The study attempts to explore the spatial policy attributes of SEZs in addition to promoting economic and industrial development. While most African countries are currently facing severe challenges in urban development, China-Africa cooperation drives the construction of SEZs. This study, based on the evaluation of the practical results of two of the earliest China-Africa cooperation SEZs built in Ethiopia and Zambia, will help governments to learn from China’s zone experience in multiple dimensions. In the meantime, by comparing the development effects of the two SEZs, the study identifies which government policies and actions can help SEZs to play an active role in optimizing the urban spatial structure and enhancing the management of land use.
2. Literature
SEZs can create new jobs, attract foreign investment, facilitate industrialization, help an economy to establish the necessary connection with the world economy, and act as the pilot areas for new policies [11,12,13]. The African Economic Outlook (2019) by the African Development Bank explicitly indicates that establishing SEZs can alleviate the restricts of doing business due to the lack of infrastructure and can help companies to join in and survive in the African market [14]. The success of an SEZ depends on both hardware and software, which should be provided by the government. Complete infrastructure, suitable location, competitive labor, and business-friendly policies that are particularly supportive of specific industries, are usually thought to be the essential elements for successful SEZs [15,16,17,18]. Studies on a few successful African SEZs (Appendix A) highlight the importance of a developmental state (or an active government) for the success of a SEZ [19,20]. The Chinese and Singaporean SEZ experiences have fully demonstrated the government’s key role in creating an innovation- and business-friendly environment, which enhances the positive effects of SEZ development [16,17,21]. A study on Russian industrial clusters also reveals that the government is crucial in establishing ‘an enabling business environment’ by ‘providing timely funding, building personal relationships among participants and potential investors, and providing political guarantees [22]. From the perspective of the definition of an SEZ, the concept of ‘speciality’ is fundamental to the very existence of an SEZ. Otherwise, an SEZ will be no different from common urban spaces. The government, which creates speciality, thus has always been key to the development and operation of a SEZ. SEZs are, therefore, typical government-led development projects. The government’s decision-making and related actions directly determine the development efficiency of the SEZ and its ultimate success or failure.
In addition to the widely studied economic impact, this study focuses in particular on the impact of SEZs on urban spatial expansion. Studies on the relationship between SEZs and urban spaces, especially countless studies on China’s SEZ experience, indicate that recent SEZs tend to spatially integrate with nearby cities instead of being an enclave that can be observed in most early SEZs [23,24,25]. Studies on recent African SEZs still concentrated primarily on their economic dimension. A few of these studies have involved spatial features, such as the internal spatial structure of SEZs [26,27] and the relationship between SEZs and regional spatial development [28]. Tang emphasizes the importance of the integration of zones and cities by presenting the development of the Egyptian Suez SEZ [29]. Pieces of evidence have shown that the government plays a crucial role in coordinating zones and cities because no other actors can have both authority and mobilization ability as the government has (albeit the government sometimes is also thought to be incapable in one way or another).
Generally, the government is indispensable in promoting the quality of urban expansion by constructing SEZs for three reasons. Firstly, urban planning and construction are public issues. The change in land use and resulting impacts on people’s lives during the process are usually companied by significant investments, as well as various conflicts. Governments are essential in ensuring high-quality urban development, as the market is not omnipotent. There are always public purposes that need public departments to serve. Even a long time ago, the very existence of a city depended on public departments to provide public goods, such as defense, roads, and a water supply system. In order to properly serve public purposes, governments need planning. The inter-dependence of different public actions, the indivisibility of certain events and their irreversible results, and imperfect information necessitate prudent planning to secure public interests [30]. However, the significance of the government not just matters in formulating planning, but also in fulfilling public responsibilities that otherwise cannot be accomplished by other actors.
The second reason is that most SEZs—as new urban spaces—are located at the peri-urban areas where urban and rural, state-owned, and customary/private land are often mixed. The conversion of land from rural to urban use, from customary/private to national, or just from one owner to another, which usually involves complex and diverse land tenure, redefines the people-land relationship and relations of production and is thus full of uncertainty and disputes [31,32]. The government thus has the responsibility enabled by the public authority to coordinate those potential contradictions.
Additionally, the establishment of an SEZ in a suitable position gives the market a signal of an emerging area. As Lefebvre indicates, technical progress enabled people to explore almost anywhere and therefore space scarcity only makes sense in limited places—Those constituent centers and the spaces around them [33]. The investment in infrastructure and growing economic activities create new centrality, which could contribute to the agglomeration of people and industries and further to increasing land value addition. However, the centrality needs to be shown and ensured by an authoritative spatial plan, since the uncertainty and conflicting land-use might severely devalue a piece of land in terms of both use and exchange. The government, therefore, should release an integrated spatial plan in advance, showing the designated land use and ensuring that the plan should not be changed or circumscribed without a convincing reason based on public interests.
The government, in this context, can be understood as an enterprise managing space. They ‘make profits by providing public goods’ [34], namely infrastructures and policies in SEZ cases. SEZs (even the private ones as long as they enjoy government policies) are public goods provided by the government in a market economy to make profits and promote the quality of urban development. The products—SEZs—can be ‘produced and consumed’ in two ways: (1) the government directly constructs an SEZ by adding infrastructure and other facilities to a piece of land, and sells/rents the space to investors, or (2) the government sells a piece of land to a developer (usually at a low price) and urges the developer to deliver all the necessary facilities. For both options, the goal of the government is to maximize the (public) profit of SEZs. To achieve controlled and profitable urban expansion, the government thus needs a feasible ‘business model’ that enables the smooth ‘production and consumption’ of SEZs so that the land can be used in the designated way. The whole process calls for suitable and integrative spatial plans in advance and government capacity to execute relevant plans, laws and policies.
3. Materials and Methods
In 2006, the Chinese government announced at the 3rd Forum on China-Africa Cooperation (FOCAC) to cooperate with African countries to build 3–5 SEZs. Since then, a large number of Chinese companies have invested in Africa or have participated in the construction of SEZs in Africa. China’s support for the cooperative zones and growing investment in Africa’s manufacturing have launched a new wave of SEZ development in Africa. By 2018, at least 32 African countries have established about 237 new SEZs (most of them were established after 2015) [35]. The two cases in this study—The Eastern Industry Zone (EIZ) in Ethiopia and Chambishi Multi-Facility Economic Zone (MFEZ) in Zambia, established in late 2006, are the two earliest zones of this new wave and are more comparable among the six earliest cooperation zones established in 2006 (Appendix A). The Eastern Industry Zone is located between the small town of Dukem and the relatively big town of Bishoftu ). According to the Ethiopian census, the two towns had about 100,000 residents in total in 2007. The Chambishi MFEZ is adjacent to the small mining town Chambishi, which had a population of less than 50,000 in 2010 according to the Zambian central statistics office. Around the MFEZ and Chambishi town, there are several populated towns and cities in the Copperbelt region (Figure 1a,b and Figure 2a,b).
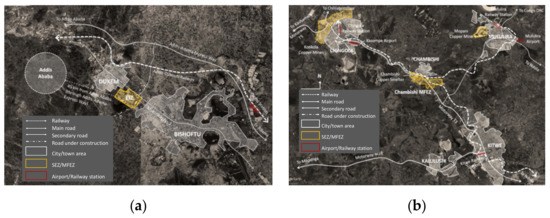
Figure 1.
Location of the two Special Economic Zones. (a) Eastern Industry Zone (EIZ); (b) Chambishi Multi-Facility Economic Zone (MFEZ).
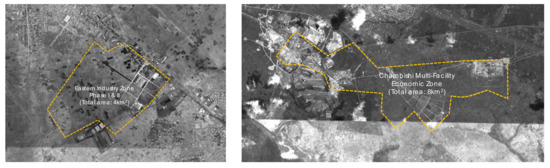
Figure 2.
Construction in the two SEZs. (a) EIZ; (b) Chambishi MFEZ.
Land use information such as appearances, night lights, and spectral features, has been widely used in previous research to reflect the characteristics of urban expansion visually [36,37,38]. In order to evaluate the extent to which SEZs can change the current uncontrolled and unprofitable urban expansion in the cities where they locate, this study also uses several land-use indicators to depict this impact. The evaluation has been launched based on the land use data collected through field surveys in 2016 and 2018, and the historical images from Google Earth (Appendix A) since 2000. While the construction speed of different projects using various technologies varies a lot in different countries (Appendix A), the division of monitoring period can be tricky. The period should be both short enough to present the structural change of space by stages and long enough to cover the construction period of average-sized projects. The two SEZs involved in this study were established at the end of 2006. Given the available land use information and the average construction speed in Ethiopia and Zambia, land use in four individual years (2000, 2006, 2012, and 2018) were finally selected to monitor the spatial change.
For all built-up areas within the research scope (Appendix A), this study focused on two aspects related to urban expansion and land use management. The first is its economic feature, reflecting whether urban expansion is accompanied by employment growth. All built-up areas were divided into ‘job-intensive’ (such as factories, shopping centers) and ‘non-job-intensive’ (mainly residential areas and schools, as well as a small number of blocks that cannot be identified). The second is the spatial characteristic, which reflects whether the newly expanded area is constructed following a specific spatial plan. A plot is defined as ‘planned’ if it is constructed in accordance with a specific road network (even if the road itself has not yet been built), or ‘unplanned’ if not.
Based on the classification above, the speed and spatial pattern of urban expansion before and after SEZ construction are quantitively depicted with three indicators. The first indicator was defined as the ‘planning proportion (PP)’ of urban expansion—The ratio of the area of planned plots to the total area of newly expanded plots. It measures the changes in the control level of construction in the area before and after the implementation of SEZs, i.e., whether urban expansion happens more in ‘a planned way’. The PP value was calculated as follows:
where SPn refers to the area of planned plots and Sn refers to the area of total expansion in a certain monitoring period. The second and third indicators were defined as the “concentration index (CI)” and “primacy index (PI)” of urban spatial expansion. The most prominent spatial representation of uncontrolled urban sprawl is disorderly construction in all directions. The two indicators—The concentration index and primacy index therefore together reflect the extent to which the construction of SEZs has changed the original uncontrolled expansion of the cities, i.e., whether urban expansion happens more in ‘a concentrated way’, especially more in ‘an SEZ-leading way’. Dividing built urban spaces into concentric sectors and evaluating the spatial feature in each sector were used as an effective method to analyze the characteristics of urban expansion in different directions [39]. According to the structural characteristics of the city where the zone is located, the built-up area of the city was divided into four dimensions by main roads or other essential spatial elements (such as rivers, railways, and main roads). The four spatial dimensions were named as A–D dimensions based on their spatial distance from the SEZ (A is the nearest, D is the farthest) (Figure 3a,b).
PPn = SPn/Sn
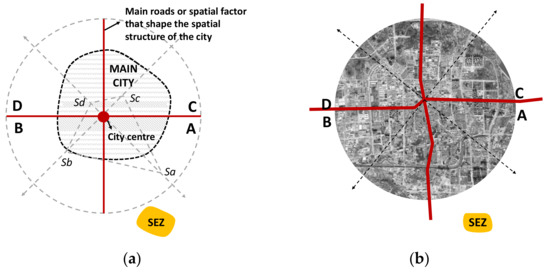
Figure 3.
Assessing the spatial impact of an SEZ: (a) How to divide and name the built-up area of a city; (b) An example.
The ‘concentration index’ reflects the degree of concentration of spatial expansion in a specific dimension. It is the standardized variance of the expanded area per period in each sector: the larger the CI value (variance), the more significant the difference between the expansion areas of each sector—The spatial expansion is relatively more concentrated in one (or two) sector(s). The ‘primacy index’ reflects how significant the spatial expansion is in the dimension of the SEZ compared to other dimensions. It is the ratio of the expansion rate of the zone area (dimension A) to the most considerable expansion rate of the left three. The two indicators were thus calculated as follows:
where CIn + 1 is the standardized variance of the growth rate of expanded area (within a continuous built-up area) in each dimension (Si) in a particular base year (n + 1), and Si is the average of the area of spatial expansion in four dimensions. San is the expanded area in dimension A, and Smax(b,c,d) stands for the most massive expansion in the rest three dimensions. In the meantime, it is quite common to continuously calculate the gravity center of the built-up area of a city to monitor the general change of the direction of urban expansion [40]. Here two similar spatial analysis tools (which can be automatically executed by ArcGIS) were additionally used to shape the overall spatial impact of SEZs on maps. The first one is the standard deviational ellipse reflecting the directional distribution of newly constructed blocks (the shorter the two axes, the more concentrated the spatial expansion is). The second one is the mean center of these new blocks, which can be recognized as the spatial center of urban expansion (the closer the center is to the SEZ, the stronger the zone’s impact on urban expansion is) (Appendix A).
In order to understand the reason why SEZs projects have produced corresponding spatial impacts on nearby cities, this study analyzed the spatially related policies, laws, and plans of the two countries and the specific regions (cities) collected through field research and online retrieval. Also, this study, as a part of a broader research project, involved interviews with participants related to SEZ and urban development in Ethiopia and Zambia (including policy-makers/directors of urban planning/construction department, land management department and other land-/SEZ-related public departments, SEZ developers/developing companies, and SEZ investors/tenants). The interviews were conducted through two field surveys in 2016 and 2018, respectively, and lasted about 50 days in total (some supplementary interviews were conducted online in 2018 and 2019). More than 80 interviewees from 42 institutions participated in the semi-structured interviews (Table 1). The interviews mainly focused on the logic in the decision-making process of site selection and investment, the relationship between different participants, and the corresponding impact on the construction of SEZs and urban expansion. We analyzed the dominant factors considered by different participants when making decisions related to spatial construction. Notably, we assessed the role of the government in this process and the influence of their actions on other participants’ decisions.

Table 1.
Institutions and interviewees involved in the study.
4. Results
Generally, all indicators reflected the fact that EIZ and the Chambishi MFEZ have both remarkably changed the original spatial expansion of the cities where the zones are located, in terms of speed, direction, function, structure, and concentration (Figure 4). However, the two zones have ‘improved’ the quality of spatial expansion to different extents, and the impact on local spatial appreciation has also been very different. As far as the indicators used in this study have shown, the ‘positive’ effects of EIZ are more significant than those of the Chambishi MFEZ.
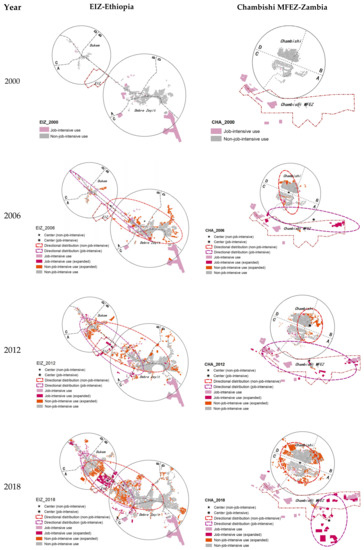
Figure 4.
Urban expansion before and after the SEZs were established.
4.1. Spatial Expansion before and after SEZ Projects
In the Ethiopian EIZ case, especially after the zone’s operation in 2009, the zone has significantly changed the spatial expansion of the two cities—Dukem and Bishoftu. The spatial expansion rate shows that both cities have expanded more rapidly after the EIZ developer started the zone construction. Between 2000 and 2006, the two cities have expanded by a third. During the latter two periods, the two cities expanded more than a half in each period. In 2018, the built area (excluding EIZ) of Dukem and Bishoftu has more than doubled compared to that in 2006 (Table 2).
Table 2.
Expanding rate of the built-up area in the EIZ case.
Moreover, the EIZ has profoundly changed the composition of expanded urban land use. Before the zone was established, there was little increase in local employment: job-intensive land use in the two cities increased by merely 2.8 per cent from 2000 to 2006, and only 3.3 per cent of the newly expanded urban area actively produced jobs. After 2007, as the EIZ was attracting industrial activities to the area, job-intensive use of land started expanding at a faster pace, with 30.8 and 58.5 per cent growth rates during period B and period C, respectively. The percentage of job-intensive areas has remarkably increased (from 20.4 to 30.9 per cent). In the meantime, the significance of the EIZ in providing industrial spaces has been rising. The zone contributed 40.0 per cent of job-intensive land use between 2013 and 2018, compared to only 20.0 per cent in the previous period, which shows the increasing attractiveness of EIZ for industrial activities.
In Chambishi, the town has expanded at a similar pace with the MFEZ. After the MFEZ was established in 2006, the spatial expansion of Chambishi town significantly accelerated. As the number of companies in the zone was increasing, more residents have been attracted to the area. From 2012 to 2018, the built area of Chambishi town saw a 76.8 per cent expansion (Table 3). Due to poor economic diversification, Chambishi town has seen little industrial development during a time when the copper industry weakened. Since the CCS started operation in 1998, the company has been the sole job provider in the region. From 2000 to 2006, the increase in job-intensive use of Chambishi town was negligible (merely 2.1 per cent, excluding the usage provided by a subsidiary of the MFEZ developer).
Table 3.
Expanding rate of the built-up area in the Chambishi MFEZ case.
While the zone was growing, it remained the primary area for industrial agglomeration. However, its dominance as the only industrial area kept decreasing (although the MFEZ is far from being fully occupied). During period B and C, total job-intensive land use in the region expanded by 31.5 and 71.0 per cent. However, the MFEZ contribution decreased to 38.8 per cent in the latter period from 65.4 per cent in the former. The declining dominance of the Chambishi MFEZ as the primary industrial area, on the one hand, shows that the zone has stimulated broader industrial development in the region. On the other hand, it also shows that the MFEZ has no absolute advantage in attracting businesses compared to the region outside. The dilemma reflects a lack of ‘speciality’ of the MFEZ in attracting business, which can be clearly observed in the EIZ case.
4.2. Planning Proportion of Expanded Area before and after SEZ Projects
Since the construction of the SEZs has significantly changed the overall construction activity of the region and has had a particular impact on planning and land use management, the planning proportion underwent significant changes before and after the construction of the two zones. In the EIZ case, the overall planning proportion index of the newly expanded area increased from 0.28 in the first period to 0.52 in the third, with a large part of newly expanded areas following a specific layout of the road network (though in many areas the roads have not been constructed yet). In the Chambishi case, however, the overall planning proportion of urban expansion kept decreasing. In period A, the index was as high as 0.70, since a new refining company CCS was the main project of the region, and few construction activities had been carried out outside the zone. While the growth of the MFEZ attracted more residents and investors, the government was not able to enforce land management in time. As a result, the overall planning proportion of urban expansion dropped to 0.45 in period C, although the planning proportion outside the zone slightly increased to 0.28 (rapidly increasing numbers of squatters within the zone have significantly reduced the PP index) (Table 4). The effects above, however, cannot be isolated as zone effects without more ‘zone-related’ indices.
Table 4.
Planning Proportion of newly expanded areas in the two cases.
4.3. Specific Spatial Impact of SEZs
Before the EIZ was created, new construction projects in Dukem and Bishoftu were mainly local farmers’ self-built houses to meet their family use. At this stage, construction activities, as the standard deviational ellipses show (especially the industrial ellipse which is dramatically shrinking towards the EIZ) (Figure 4), were somewhat scattered. No external incentives or intentions were shaping urban expansion. As EIZ was growing, spatial expansion was reshaped. The concentration index of newly expanded areas increased from 0.22 to 0.33, showing a generally more concentrated urban expansion. As the primacy index has shown, the zone area (dimension A) immediately became the main expanding direction, with the index rising from 0.43 to 1.20 during the monitoring periods (Table 5). Urban expansion to the three no-zone directions has significantly degraded compared to that in the zone-dominated direction. The mean centers of both job-intensive and non-job-intensive new areas kept approaching the EIZ, showing a more zone-directed expansion of cities.
Table 5.
Concentration status of urban expansion in Dukem and Bishoftu.
Compared to urban expansion between 2000 and 2006 when self-built houses dominated construction activities, more industrial constructions sprung up in the region after EIZ was set up. Factories agglomerated in and around EIZ to benefit from the comparatively more complete public facilities, especially the power provision. In the meantime, housing construction has increased too. As agglomerating investors have provided thousands of jobs, labor influx from the remote rural area has fueled a massive demand for housing. Original residents in both Dukem and Bishoftu have taken a keen grasp of this opportunity and built a large number of houses for rent. Vigorously construction activities for the last decade converged the two initially separated cities together with the EIZ, creating a combined urban area—A new industrial city.
The Chambishi MFEZ, in contrast, has produced fewer directive spatial impacts than the EIZ. Enclosed by the electrical corridor in the north and railways in the south, the southern part of the Chambishi town has minimal space for future expansion (Figure 5a,b). As a result, the northern part of the town, without a spatial planning and proper infrastructure provision, has recently seen the most construction activities. Specifically, the concentration index has declined to 0.41 in period C, compared to 0.79 in period A, showing a more scattered and directionless urban expanding trend. In the meantime, the primacy index shows that the zone dimension has not been the main direction of urban expansion (partly because of the limited spaces in this dimension). Nevertheless, the index (increased dramatically from 0.02 to 0.80) shows that the zone has indeed attracted more people and industries to agglomerate. Unlike in Ethiopia, where the two separated cities have shown a clear trend to expand towards EIZ, the Chambishi case sees no such integration.
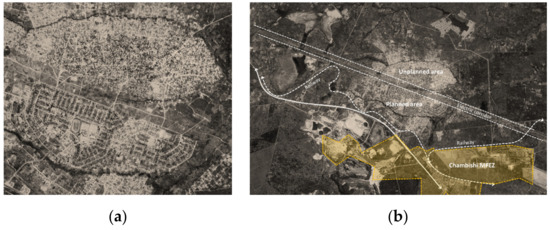
Figure 5.
Spatial conditions of Chambishi: (a) Built-up area of the town; (b) Spatial limitations.
4.4. Spatial Appreciation Stimulated by SEZs
In addition to the difference in direct spatial impacts, the two SEZs have also produced different effects on the local spatial appreciation. In 2007, the EIZ developer got the land use rights (for phase I) from the local government (the Oromia state government) at a price of only ETB 1 per square meter (USD 0.03/m2) as compensation with an extra ETB 1 per square meter each subsequent year as rent. After more than 10 years of development, Dukem and Bishoftu have significantly expanded, and their land prices have kept increasing. In 2018, when the EIZ developer decided to purchase the other piece of land reserved for phase II, the local government asked for a much higher price than that for the first phase. The developer finally got the land use rights for ETB 68 per square meter (USD 2.4/m2) as compensation and ETB 18 per square meter (USD 0.6/m2) as rent for each following year. This was a compromise for both sides after several rounds of negotiation but marked a major increase compared to the initial land price, which is beneficial for local governments. Urban expansion led by SEZ construction is becoming a profitable process.
In contrast, little spatial appreciation was observed in Chambishi after the MFEZ was set up. From 2007 to 2018, the land price in Chambishi barely increased. Even in Kitwe, the land price merely increased by ZMW 0.1 per square meter (USD 0.01/m2), which is negligible considering the magnitude of depreciation of the Zambian Kwacha. The massive investment in infrastructure in and outside the Chambishi MFEZ has produced little spatial value addition. The MFEZ developer has seen no increase in the rent, which is their primary income currently. The biggest beneficiary of spatial appreciation perhaps is the local farmers who have illegally occupied the undeveloped land of the SEZ by building houses and planting crops and asking for compensation from the zone developer. Due to the inadequate supervision of land use by the local government and the lack of enforcement for illegal land occupations, neither the government nor the zone developer have obtained spatial appreciation. Urban spatial expansion continued to be an uncontrolled and unprofitable process.
5. Discussion
The two SEZs, both learning from the Chinese SEZ experience, have produced diverging impacts on local spatial expansion and appreciation. The results are closely related to the local government’s action and decision-making over planning and land use management when launching the SEZ projects. SEZs are typical government-led development projects. Therefore, in Ethiopia, where the government has more actively participated in zone development, the EIZ has had a more significant positive effect on urban spatial expansion and land use optimization and has generated more spatial appreciation than the Chambishi MFEZ. The development of the SEZ and the accumulation of urban capital, as well as the enhancement of local government’s development capabilities, have formed a mutually reinforcing relationship in Ethiopia. In contrast, in Zambia, due to the lack of government participation, the SEZ development and urban spatial expansion were not strategically integrated. Correspondingly, spatial optimization or appreciation were not as remarkable was observed in Ethiopia.
5.1. Intended Spatial Plan and Enforced Land Management in Ethiopian SEZs
The positive spatial effects of the EIZ first attributes to its advance spatial planning and suitable location. To maximize the positive spatial effect of SEZs to drive urban spatial expansion and population agglomeration, the Ethiopian government has drawn on China’s SEZ planning experience and formulated a construction model of “SEZ + city + reserved development hinterland” (Figure 6). The primary goal of this construction model is to drive the orderly expansion of those secondary cities. Therefore, the SEZ sites are mostly located in the suburbs of the target secondary cities and have convenient transportation links with the cities. As the deputy CEO of Ethiopia’s Industrial Park Development Corporation (IPDC) passionately explained with a sketch:
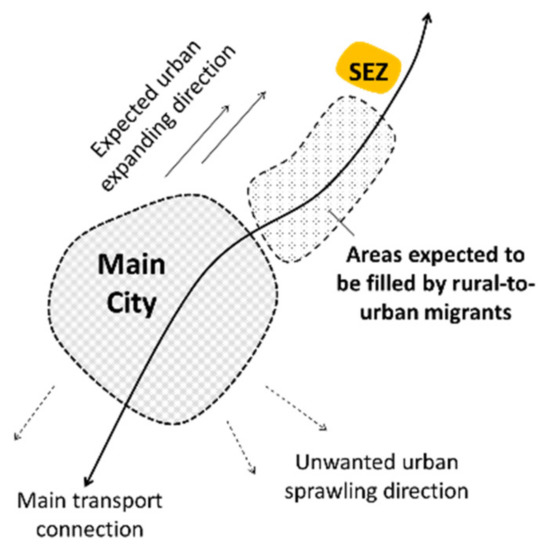
Figure 6.
How SEZs can promote secondary cities (IPDC).
When you build an industrial park here along the main road at a distance from the city, not too far, the industrial park will provide many jobs. People from a rural area will come and settle down here (drawing blocks in the middle area between the city and the park) … Ten years, fifteen years later, you will get a big city. (Interview with the deputy CEO of the IPDC)
Such a separated but not too remote position of the SEZ leaves a hinterland available for future rural-to-urban migrants between the zone and the city. In the meantime, future expanding spaces for both the zone and the city are available, so that the SEZ will not be at the center of the future ‘big city’, which is essential especially when the current city is comparatively small but has significant potential for future expansion. Securing future benefits from the hinterland, and avoiding adverse effects due to the irreversibility of massive spatial construction (such as possible spatial contradictions caused by excessive expansion of SEZs or cities), as previous research has demonstrated [30], is precisely the reason why the government needs to conduct planning. Also, by privileging the reserved hinterland through public service provisions, such as infrastructure, education and health facilities, and the like, unwanted and uncontrolled urban sprawl in other directions is supposed to be reduced. The EIZ has specifically played such a role by pre-considering the spatial relationship with surrounding cities and locating at a suitable site. As the manager of the zone stated:
We locate the zone here because it is not far from the capital city (Addis Ababa) … the site is relatively flat, which can reduce the cost of infrastructure… it locates between Dukem and Bishoftu which means recruitment would not be a problem… the newly built expressway from Addis Ababa to Adama (another important big city of Ethiopia) and the Addis-Djibouti railway pass by our zone (Interview with the manager of the EIZ)
With such an elaborately selected location, the EIZ, during the urban expansion process, has acted as a spatial incentive—or put it in Lefebvre’s words, has created ‘centrality’ [33]. EIZ attracted residents and companies to settle around in the designated area and thus reduced uncontrolled and random urban expansion into other directions. Another study analyzing the spatial expansion of six towns in Ethiopian Oromia State also confirmed this phenomenon: all towns have expanded surrounding Addis Ababa except for Dukem [41] which, as displayed in the previous section, has expanded towards the EIZ.
Like in many other African countries, illegal squatters prevail in Ethiopian cities. Compared to land acquisition, solving the problems of unplanned and illegal occupation of land is more challenging and controversial. Researchers indicate that ‘except in urban centers with master plans and zoning in effect, people in Ethiopia have been using the land, for far too long, in unplanned and uncontrolled fashion’ [42]. It is recorded that the land acquisition process usually lasts for several years in Ethiopia due to various disputes caused by unclear detailed land management policies [43]. In order to enforce land management and improve the efficiency of land use during the construction of SEZs, the Ethiopian government has played an active “executing and coordinating” role. When the EIZ was about to be launched in 2006, the federal government authorized the Oromia state government to complete the land acquisition process. This action has remarkably improved the efficiency of land acquisition (the EIZ developer obtained the full land-use right within a few months instead of several years) and reduced conflicts over the transaction of land ownership. Recently, to further improve the efficiency of SEZ development across the country, the Ethiopian government authorized IPDC in 2015 to exercise land acquisition rights and act as a land reserve institution with the cooperation of the eleven state/city governments.
More importantly, by executing land expropriation in advance and establishing a land reserve agency, the government has further capitalized the land and facilitated a more complete and formal land market. The IPDC—as the agent of the federal government that operates SEZs—is also able to optimize its business model by actively participating in land management. Both local governments (the Oromia state government and Dukem city government) and the zone developer can benefit from land appreciation in this model. Their redevelopment capacity has thus been enhanced, which enables them to further invest in infrastructure to improve investment conditions. In the meantime, growing rent stimulates the need for a secondary land market so that zone tenants can obtain the long-term land-use right to reduce rental costs and to enable the land to act a considerable fixed asset for financing. In 2015, the Ethiopian federal government issued the first secondary land certificate in the EIZ, making the zone a pilot area for the secondary land market. The monopolization of the primary land market and the establishment of the secondary land market create a formalized and win-win land management system based on public-private cooperation. The virtuous circle of development and capital accumulation through SEZs thus starts.
5.2. Copromised Land Management and Privately Captured Spatial Appreciation in Zambian SEZs
While the significant positive spatial effect of the Ethiopian SEZs was attributed to an active government, the incapability of the Zambian government in land management has produced opposite effects. According to the Zambian Land Act (1995), the piece of planned and leased land within the Chambishi MFEZ is supposed to be protected against invasion. However, in practice, the expected protection from the government is often not in presence. Before the Chambishi MFEZ was established, a few houses stood around the old railway station at the central area of the planned MFEZ. The zone developer left those houses untouched, since they are not in the start-up area of the zone. However, when the zone was growing, local farmers moved into the zone and illegally built houses adjacent to the existing residential area. By 2018, the area has significantly expanded several times compared to the size in 2016 (Figure 7a–c). Some farmers even grew maize in the northern part of the zone where the land was still empty.
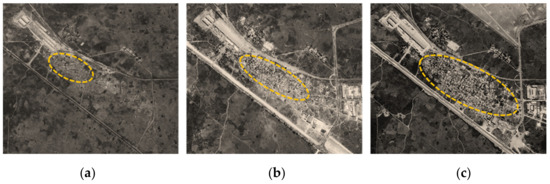
Figure 7.
Increasing presence of ‘squatters’ within the Chambishi MFEZ: (a) 2006 (No Chambishi MFEZ); (b) 2012; (c) 2018.
As the construction of the second phase became imminent, the zone developer tried to persuade local farmers to move away from the land that they illegally occupied. The negotiation, however, failed and squatters claimed ten years’ compensation for ‘their’ maize and ‘their’ land. Since the zone developer has no administrative rights and does not want to have any confrontation with local people, it cannot and does not want to evict the squatters forcibly. The developer has instead turned to the local government for coordination. However, the ‘coordination’ did not work because the zone developer expected conformity with any existing law to occur (which requires compulsory acquisition, eviction, or demolition in illegal occupation areas). A local legislative committee asserted that the developer should compensate all the farmers in the zone, including those illegal squatters. This irrational coordination made the situation deadlocked until mid-2018 when a new policy required the developer to clear the land within two years or the current houses built by squatters will be recognized as legal property. Annoyed by this ‘absurd’ requirement, the developer complained to the Kalulushi government again. The intervention of the mayor of Kalulushi municipal finally ‘solved’ the problem at the price of the developer: the zone developing company needs to pay the ‘compensation’ (though slightly lower than what the legislative committee asked before) required by invaded farmers. Due to the lack of enforced land management, legally possessing the land use rights does not mean effectively avoiding the contradiction of land use, especially when a foreign company is involved. As the manager of the Chambishi MFEZ said:
We know they are squatters. But what can we do? We don’t want tension with local people. We have more concerns (as a Chinese state-owned company). Every step and every decision must take into account the impact on the local community. We should always take care of whether a thing we did might hurt our national image. Without firm support from local government, it’s tough. (Interview with the manager of the Chambishi MFEZ)
Illegal land occupation, as can be observed in other Zambian SEZs (as well as other developing projects), has become a significant obstacle for urban development because it has significantly reduced the efficiency and increased the cost. Not only did the government fail to protect the public interest in the process of urban construction as scholars pointed out [30], it also increased the uncertainty in the development process due to incapability. Aiming to ‘eliminate the growth of unplanned areas through the timely provision of shelter or serviced building plots’, Zambia’s new national land policy, however, offers no solution to existing invasions. The measures in the policy, such as ‘urging local authorities to raise funds for planning and surveying’, or ‘enabling systems for timely planning, surveying and servicing land for development in the urban fringe’ [44], are all soft measures to encourage planned land use rather than to forbid and eliminate unplanned land use. As a result, the hot potato issue of squatter eviction is left in the hands of investors—In the Chambishi MFEZ case, this was the zone developing company. With no legal right to evict any person or demolish any building, the zone developer has no choice but to count on the (incapable) government to ‘protect’ them from invasion.
Under such compromised forms of land use management, “usufruct” has gradually evolved into a land-use tradition which is “occupation equals to (makes) legal possession”. With this occupation-made possession, illegal land occupation is becoming more and more popular. The boundary between (actual) occupation and (legal) land possession is completely blurred, making illegal occupation normalized or even legalized, which further impedes land acquisition and reduces the efficiency of development and construction projects, including SEZs. Neither the local government nor the zone developer has obtained economic benefits from the significant investment of the SEZ. On the contrary, squatters have enjoyed extra profits by claiming ‘illegal’ compensation. Conflicts caused by land transactions, as has been observed by previous research [31,32], extended chaotic urban expansion and compromised public interests (SEZ development and orderly urban expansion in this case) in a lack of enforced land management system.
5.3. The Role of Government in Controlled and Profitable Urban Expansion within an SEZ Framework
Uncontrolled and scattered spatial expansion are representations of absence or failure of the implementation of planning intentions. It shows a social form where government authority is weak in urbanization field. Put it in Schafran’s theory, a ‘control sector’ is underdeveloped, and the economies of urbanization are disconnected to social reproduction [45]. This disconnection leads to weaker government control in urban development as the revenue from the betterment of public service cannot be channeled without a properly designed system. This series of negative features means that the government, as ‘an enterprise managing space’ [34], has failed its business.
The creation of SEZs in this sense can create spatial incentives and enforce control first in a specific area—Creating centrality and corresponding spatial scarcity [33]. For African governments (as well as governments in other developing countries), using SEZs as a way of government intervention and a simplified planning approach [10] to optimize urban land use is practical. However, to reverse uncontrolled and unprofitable urban expansion through SEZs depends on whether the government can fulfil its function during the zone development process.
By delivering a suitable spatial plan and providing hardware and software through two public agents—IPDC and EIC (in charge of the hardware and software for SEZs respectively), Ethiopian federal and regional governments actively participated in SEZ development. The government, instead of the zone developer, deals with disputes and contradictions over land use, while SEZs are fully integrated with public urban development plans. SEZs proliferate with firm support from the government and in turn have produced significant economic profits in terms of rent, tax, and spatial appreciation, which return to the developer and the government (Figure 8a). The development ability of the government and its designator (though economically unsustainable for the short term) can be continuously enhanced during the process. It is possible to say that by actively producing public goods—SEZs—the Ethiopian government is making itself a successful entrepreneurial government. Although this enterprise, as Zhao indicates [34], cannot be assessed only by its claimed goals and principals but by its efficiency of input and output, the Ethiopian government’s products—SEZs are indeed reversing urban expansion in a more controlled and profitable way.
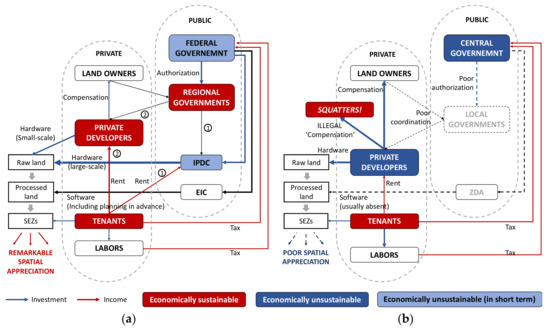
Figure 8.
SEZ ‘business models’: (a) Ethiopia; (b) Zambia. (Source: Compiled and depicted by the authors according to the interviews with relevant participants).
The Zambian government (especially the local government), however, has been absent from the zone development process. Even the designator of the central government—The Zambian Development Agency, which is supposed to be the leading supporter of SEZ development, is powerless. Due to the lack of necessary support from the government, zone developers are struggled to make profits, and SEZ development has been sluggish. SEZs and cities are separated, and spatial appreciation is negligible. The economic output of the SEZ is thus limited to the single aspect of taxation (Figure 8b). While the zone developer is economically unsustainable, the government remains incapable of delivering public goods and promoting the quality of urban expansion. The Zambian government (both central and local) is an absent administrator/coordinator rather than a participator/manager in its SEZs ‘business’. It is not surprising that the whole business model of Zambian SEZs is unsustainable and expected beneficiary participators have struggled to survive.
6. Conclusions
Uncontrolled and scattered urban expansion has imposed significant pressure on many African governments seeking to meet the demand for public service and infrastructure. The resulted stagnated cities have severely weakened the economies of urbanization. This study has shown that by developing SEZs, the government can experiment with a new land management approach and create spatial incentives to optimize urban land use. The extent, to which SEZs can produce such positive effects, however, depends highly on whether the government can deliver an advance spatial plan and effectively enforce land management.
With an advance spatial planning, the authority over land management and the commitment to ensuring the priority of land provision to public projects (such as SEZs), the government can produce spatial incentives—The centrality of a specific space. With such spatial incentives, the government can stimulate urban expansion in specific directions, and in turn, benefit from orderly urban expansion and significant land value addition. For many African countries where uncontrolled and unprofitable urban spatial expansion prevails, the budget for urban development is also limited. While dual land tenure system or even informal and illegal land tenure has been a big challenge for orderly and profitable urban expansion, SEZs, as this paper has shown, provide a chance to reverse this gradually. By creating SEZs within specific boundaries, the government can unlock broader promotion and formalization of urban expansion and bring urban land use on a more productive and profitable way.
There are some limitations to this study. First, there are some unavoidable deviations in the assessment of spatial expansion because the land use might be misidentified and the accurate blueprints of the relevant cities were usually unavailable (some planning were still under preparation at the time of the field survey). Secondly, due to time and material constraints, and the relatively short period of SEZs being implemented in the two countries, the sample size of interviews is slightly insufficient, which affects the comparability of the relevant factors between the two countries. With further development of SEZs in the two countries and the adjustment of related departments, future research can follow up on this. In the meantime, the impacts of different types of SEZs (such as public/private, domestic-/foreign-leading) under different policy environments can be further distinguished in future research.
Author Contributions
Conceptualization, J.X.; methodology, J.X.; validation, J.X. and X.W.; formal analysis, J.X.; investigation, J.X. and X.W.; resources, J.X.; data curation, J.X.; writing—original draft preparation, J.X.; writing—review and editing, J.X.; visualization, J.X.; supervision, X.W.; project administration, X.W.; funding acquisition, X.W. Both authors have read and agreed to the published version of the manuscript.
Funding
This research was funded by The National Key Research and Development Program of China: Research Cooperation and Exemplary Application in Planning of Overseas Industrial Parks, grant number 2016YFE0201000.
Acknowledgments
The authors would like to thank Miles Larmer for comments and advice during the review of a very early draft of this paper. The authors would also like to thank Xiao Chen, Shengbo Zhao, and Kai Liu, who participated in the field research in Ethiopia and shared some research data.
Conflicts of Interest
The authors declare no conflict of interest. The funders had no role in the design of the study; in the collection, analyses, or interpretation of data; in the writing of the manuscript, or in the decision to publish the results.
Appendix A
- The World Bank data (https://data.worldbank.org/) shows that from 1989 to 2018, the average annual growth rate of world urban population has been around 2 per cent—Half of that in the SSA.
- According to the World Bank data (https://data.worldbank.org/), from 1990 to 2014, the proportion of people live in slums in Africa has decreased from 67 to 55 per cent (the world proportion decreased from 47 to 33 per cent). Infrastructure is severely insufficient on the continent. Access to electricity in Africa, for example, has been significantly improved from 1990 (16 per cent) to 2016 (43 per cent), which is still much lower than the world average (which was 87 per cent in 2016). Sanitation is much worse. Only 28 per cent of African population use ‘at least basic sanitation’ (which means improved sanitation facilities without sharing with other households compared to) while the world level is 68 per cent.
- Most African SEZs unfortunately have ‘failed’ in terms of facilitating industrialization, especially when compared to their Asian counterparts: a World Bank report shows that in 2007, 114 African SEZs have created 1 million jobs (0.2% of the total) and 8.6 billion exports (48.7% of the total), while 991 Asian SEZs have created 61 million jobs (2.3% of the total) and 851 billion exports (41% of the total).
- Among the five countries (including Egypt, Ethiopia, Mauritius, Nigeria and Zambia) participating in the earliest China-Africa cooperation zones (six zones in total), only Ethiopia and Zambia have no experience in SEZ development. Mauritius was one of the first countries in Africa to set up SEZs as early as the 1970s. Egypt and Nigeria also established their first SEZs in the 1990s. The history of the China-Egypt Suez Economic and Trade Cooperation Zone can be traced back to 1994 (the TEDA Group was selected to operate an industrial park in cooperation with Egypt). Besides, EIZ and Chambishi MFEZ are more similar in function compared with other cooperation SEZs: the Mauritius Jinfei Economic and Trade Cooperation Zone is more like a resort; the Lekki Free Trade Zone in Nigeria is planned to be a satellite city of Lagos; the Suez Economic and Trade Cooperation Zone is planned to be a new industrial city with multiple functions such as residence, tourism and manufacturing. EIZ and the Chambishi MFEZ are generally focused on manufacturing.
- Maps have been reproduced by the author in ArcMap. In order to minimise the misleading results caused by deviation (such as inaccuracy in visual interpretation or neglects of small-scale construction projects on the satellite maps in 2.5 metres per pixel), the comparison will always use relative (instead of absolute) value.
- For example, the construction period of a regular real estate project usually takes 2~3 years. However, there is two-month built skyscraper using pre-manufacturing and assembling technology, as well as unfinished small housing projects after several years’ construction (which is quite common in Africa).
- The “research scope” is defined as the continuous built-up area of the SEZs and the city where it is located (including continuous built-up areas beyond the urban administrative divisions), while excluding green space and sporadic land. The “built-up area” refers to the blocks with more than 80% buildings completed in a certain base year compared to 2018.
- It should be noted that the methodology used here perhaps would only be revealing and convincing for small-sized cities or towns like the cases in this thesis. Big cities with more complex spatial structures and more complicated spatial dynamics need extra analysis.
References
- Muggah, R.; Hill, K. African Cities Will Double in Population by 2050. Here Are 4 Ways to Make Sure They Thrive. 2018. Available online: https://www.weforum.org/agenda/2018/06/Africa-urbanization-cities-double-population-2050-4%20ways-thrive/ (accessed on 27 April 2019).
- Angel, S.; Blei, A.M.; Parent, J.; Lamson-Hall, P.; Sánchez, N.G.; Civco, D.L.; Lei, R.Q.; Thom, K. Atlas of Urban Expansion (The 2016 Edition), Volume I: Areas and Densities; New York University: New York, NY, USA; UN-Habitat: Nairobi, Kenya; Lincoln Institute of Land Policy: Cambridge, MA, USA, 2016. [Google Scholar]
- Collier, P. African urbanisation: An analytical policy guide. Oxf. Rev. Econ. Policy 2017, 33, 405–437. [Google Scholar] [CrossRef]
- Cain, A. African urban fantasies: Past lessons and emerging realities. Environ. Urban. 2014, 26, 561–567. [Google Scholar] [CrossRef]
- Xu, J.; Dieter, J.; Wang, X. Discussion of Impact of China’s ‘Industrial Park Mode’ on Ethiopian Economic Development: A Collaborative-park Perspective. Urban Plan. Int. 2018, 33, 41–47. [Google Scholar]
- Farole, T. Special Economic Zones in Africa: Comparing Performance and Learning from Global Experiences; The World Bank: Washington, DC, USA, 2011. [Google Scholar]
- Bräutigam, D.; Tang, X. African Shenzhen: China’s special economic zones in Africa. J. Mod. Afr. Stud. 2011, 49, 27–54. [Google Scholar] [CrossRef]
- Farole, T.; Moberg, L. Special economic zones in Africa: Political economy challenges and solutions. In The Practice of Industrial Policy: Government—Business Coordination in Africa and East Asia; Page, J., Tarp, F., Eds.; Oxford University Press: Oxford, UK, 2017. [Google Scholar]
- Newman, C.; Page, J. Industrial Clusters: The Case for Special Economic Zones in Africa; WIDER Working Paper 2017/15; WIDER: Helsinki, Finland, 2017. [Google Scholar]
- Lamson-Hall, P.; Angel, S.; DeGroot, D.; Martin, R.; Tafesse, T. A new plan for African cities: The Ethiopia urban expansion initiative. Urban Stud. 2019, 56, 1234–1249. [Google Scholar] [CrossRef]
- Ota, T. The Role of Special Economic Zones in China’s Economic Development as Compared with Asian Export Processing Zones: 1979–1995. Asia Ext. 2003, 3, 1–20. [Google Scholar]
- Shah, S. Special Economic Zones in South Asia: A Comparative Analysis of Bangladesh, Sri Lanka, and India; Harvard University: Cambridge, MA, USA, 2008. [Google Scholar]
- Goswami, A.; Park, C. Asian Economic Integration Report 2015: How Can Special Economic Zones Catalyse Economic Development? Asian Development Bank: Mandaluyong, Philippines, 2015. [Google Scholar]
- AfDB. African Economic Outlook 2019; African Development Bank: Abidjan, Ivory Coast, 2019. [Google Scholar]
- Yuan, J.; Eden, L. Export processing zones in Asia: A comparative study. Asian Surv. 1992, 32, 1026–1045. [Google Scholar] [CrossRef]
- Farole, T.; Akinci, G. Special Economic Zones: Progress, Emerging Challenges, and Future Directions; The World Bank-Directions in Development-Trade: Washington, DC, USA, 2011. [Google Scholar]
- UNDP. If Africa Builds Nests, Will the Birds Come? Comparative Study on Special Economic Zones in Africa and China; UNDP Working Paper Series, No.06-2015; UNDP: Beijing, China, 2015. [Google Scholar]
- Naeem, S.; Waheed, A.; Khan, M.N. Drivers and Barriers for Successful Special Economic Zones (SEZs): Case of SEZs under China Pakistan Economic Corridor. Sustainability 2020, 12, 4675. [Google Scholar] [CrossRef]
- Meisenhelder, T. The developmental state in Mauritius. J. Mod. Afr. Stud. 1997, 35, 279–297. [Google Scholar] [CrossRef]
- Kiiza, J. Institutions and Economic Performance in Africa: A Comparative Analysis of Mauritius, Botswana and Uganda; UNU-WIDER Research Paper No. 2006/73; UNU-WIDER: Helsinki, Finland, 2006. [Google Scholar]
- Wang, J.; Yang, L. The overseas expansion model and enlightenment of Singapore development zone. J. Int. Econ. Coop. 2013, 2, 20–23. [Google Scholar]
- Sosnovskikh, S.; Cronin, B. The effects of culture, attitudes and perceptions on industrial cluster policy: The case of Russia. Compet. Chang. 2020, 1–32. [Google Scholar] [CrossRef]
- Liu, C.; Li, X.; Hang, X. Path toward city-industry integration in new urban development zones. Urban Plan. Forum 2012, S1, 104–109. [Google Scholar]
- Zeng, Z.; Zhou, J.; Xiao, S. Traditional Industrial Park Transition and Restructuring for Industry-city Integration. Planners 2013, 29, 46–50. [Google Scholar]
- Zou, D.; Cong, H. Spatio-Temporal Diversity Pattern of City-Industry Integration and Its Influencing Factors in China. Econ. Geogr. 2019, 39, 66–74. [Google Scholar]
- Shen, X. Discussion on the Layout Mode of Modern Industrial Park. In Proceedings of the Urban Planning Annual Conference, Tianjin, China, 12–14 September 2009. [Google Scholar]
- Clarke, N. Of People, Politics and Profit: The Political Economy of Chinese Industrial Zone Development in Nigeria. Ph.D. Thesis, University of Oxford, Oxford, UK, 2014. [Google Scholar]
- Nel, E.; Rogerson, C. Re-Spatializing development: Reflections from South Africa’s recent re-engagement with planning for Special Economic Zones. Urbani Izziv 2014, 25, S24–S35. [Google Scholar] [CrossRef]
- Tang, X.; Tang, X. From Government Initiative to Market Orientation: The Path of Sustainable Development of Overseas Industrial Zones. Foreign Aff. Rev. 2019, 36, 39–61. [Google Scholar]
- Ding, C.; Song, Y.; Knaap, G.; Moore, T. Urban Planning under Market System; China Architecture & Building Press: Beijing, China, 2009. [Google Scholar]
- Gough, K.; Yankson, P. Land Markets in African Cities: The Case of Peri-urban Accra, Ghana. Urban Stud. 2000, 37, 2485–2500. [Google Scholar] [CrossRef]
- Chimhowu, A. The ‘new’ African customary land tenure. Characteristic, features and policy implications of a new paradigm. Land Use Policy 2019, 81, 897–903. [Google Scholar] [CrossRef]
- Lefebvre, H. Espace et Politique—Le Droit à la Ville II/2e. Editions Economica, Paris; Li, C., Translator; Shanghai People’s Publishing House: Shanghai, China, 2000. [Google Scholar]
- Zhao, Y. Explaining the urban growth on the basis of new price theory. Urban Plan. Forum 2011, 6, 12–19. [Google Scholar]
- UNTCAD. World Investment Report 2019: Special Economic Zones; UNTCAD: Geneva, Switzerland, 2019. [Google Scholar]
- Feng, X.; Li, R.; Mo, H.W. Study of Urban Expansion and Driving Factor Using RS and GIS. Remote Sens. Technol. Appl. 2009, 25, 202–208. [Google Scholar]
- Li, F.; Li, X.; Li, H. Urban Sprawl Study Based on Spectral Mixture Analysis Method. Urban Dev. Stud. 2010, 17, 119–124. [Google Scholar]
- Mao, W.; Hu, D.Y.; Cao, R.; Deng, L. Monitoring urban expansion of Zhejiang Province using MODIS/EVI data products and DMSP/OLS night-time light data. Geogr. Res. 2013, 32, 1325–1335. [Google Scholar]
- Yu, J.; Jiao, L.M.; Dong, T. Macrocosmic and Microcosmic Views to the Analysis on the Directional Heterogeneity of Urban Expansion Progress. Geogr. Geo-Inf. Sci. 2019, 35, 90–96. [Google Scholar]
- Gao, N.; Ge, Y.; Song, X. Study of Urban Expansion and Driving Factors in Xi’an City based on Night-time Light Data. Remote Sens. Technol. Appl. 2019, 34, 207–215. [Google Scholar]
- Terfa, B.; Chen, N.; Zhang, X.; Niyogi, D. Urbanization in Small Cities and Their Significant Implications on Landscape Structures: The Case in Ethiopia. Sustainability 2020, 12, 1235. [Google Scholar] [CrossRef]
- Gebeyehu, Z.H.; Rakotomala, H.; Saint-Macary, C.; Gubert, F. Responsible land governance: Towards an evidence-based approach. In Proceedings of the Annual World Bank Conference on Land and Poverty, Washington, DC, USA, 20–24 March 2017. [Google Scholar]
- IFC. Creating Markets in Ethiopia: Sustaining Progress towards Industrialisation; The World Bank: Washington, DC, USA, 2019. [Google Scholar]
- ZMLNR. Draft National Land Policy; Zambia Ministry of Land and Natural Resources: Lusaka, Zambia, 2017. [Google Scholar]
- Schafran, A.; McDonald, C.; Lopez Morales, E.; Akyelken, N.; Acuto, M. Replacing the services sector and three-sector theory: Urbanization and control as economic sectors. Reg. Stud. 2018, 52, 1708–1719. [Google Scholar] [CrossRef]


Publisher’s Note: MDPI stays neutral with regard to jurisdictional claims in published maps and institutional affiliations. |
© 2020 by the authors. Licensee MDPI, Basel, Switzerland. This article is an open access article distributed under the terms and conditions of the Creative Commons Attribution (CC BY) license (http://creativecommons.org/licenses/by/4.0/).