Abstract
Air pollution remains a serious concern for European citizens. The relative contribution of mopeds and motorcycles to air pollution started to increase as the levels from other vehicles started to decrease. The information on emission levels of Euro 4 motorcycles is limited because they were only recently introduced into the market (2016). In this study, the emissions of a 1 L Euro 4 motorcycle were determined with two drivers and two different sampling configurations (i.e., open or closed transfer tube to the dilution tunnel; both allowed in the current regulation). The motorcycle respected the current Euro 4 limits and even the future Euro 5 limits for most pollutants (CO 600 mg/km, NOx 48 mg/km, total hydrocarbons 60 mg/km). The particulate emissions, which are not regulated for this category of vehicles, were also very low and fulfilled the current limits of passenger cars (particulate mass < 0.5 mg/km, particle number 3 × 10¹¹ p/km). The total particle emissions (i.e., including volatiles) were also low with the open configuration (6 × 10¹¹ p/km). They increased more than one order of magnitude with the closed configuration due to desorption of deposited material from the transfer tube. For the gaseous pollutants, there was no significant difference between open or closed configuration (CO2 within 0.3%, rest pollutants 10%), but they were different between the two drivers (CO2 1.3%, rest pollutants 25%–50%). The main message from this work is that open and closed configurations are equivalent for gaseous pollutants but the open should be used when particles are measured.
1. Introduction
Air pollution and climate change are the biggest environmental concerns for European citizens. As a result, there is growing political, media and public interest. Although air pollution affects the whole population, certain groups are more vulnerable to its effects on health, such as children, elderly people, pregnant women and those with pre-existing health problems. People living next to busy roads or industrial areas face higher exposure to air pollution. The European Union’s (EU) clean air policy is based on three main pillars [1]:
- Ambient air quality standards set out in the Ambient Air Quality Directives.
- National emission reduction commitments established in the National Emission Ceilings (NEC) Directive.
- Emission and energy efficiency standards for key sources of air pollution, from vehicle emissions to industry.
In 1997, Directive 97/24/EC implemented Euro 1 standards to reduce air pollutant emissions from two- and three-wheel vehicles, referred to as L-category vehicles in later directives. Standards were adopted in two stages for mopeds and one stage for motorcycles. Directive 2002/51/EC amended Directive 97/24/EC in 2002 and implemented standards Euro 2 and 3 for motorcycles (Table 1). In 2013, Regulation (EU) No 168/2013 and in 2014, supplemental technical Regulation (EU) 134/2014 expanded the number of L-categories and established implementation dates for Euro 4 and 5. The Euro 5 emission limits are at the same levels with the limits of passenger cars. However, in contrast to passenger cars, solid particle number (SPN) emissions are not regulated. Many studies have shown that motorcycles’ SPN emissions can be high, exceeding the SPN limit of passenger cars. Furthermore, there is a high fraction of particles below 23 nm, which is the current lower size in the regulations [2,3]. In a study with Euro 4 mopeds and motorcycles, half of the motorcycles exceeded the limit [4] and the concentration of 10 to 23 nm particles was 10%–65% of the >23 nm particles. Another study found that the total particles (i.e., including volatiles) were 2 to 4.4 times higher than the SPN >10 nm levels [3]. However, concerns were raised regarding whether the setup of L-category vehicles is appropriate for PN measurements [5]. Due to the higher exhaust gas temperatures and the long residence times in the tube connecting the vehicle to the dilution tunnel, artefacts were noted with the typical “closed” configuration: desorbed material from the tubing formed particles that were considered as particles from the vehicle [6]. Using an open configuration, (i.e., diluting at the tailpipe) no such artefact particles appeared [6].

Table 1.
Emission limits for motorcycles (displacement > 150 cm3 for Euro 3, or L3e-A2/A3 with maximum speed > 130 km/h for Euro 4 and 5).
Registered mopeds (engine displacement < 50 cm3) and motorcycles, collectively called powered two-wheelers (PTWs) accounted for more than 35 million vehicles in EU-28 in 2017, more than 10% of the passengers’ mobility fleet [7,8]. More than 25% of the PTWs are registered in Italy. In Europe, the share of households holding PTWs in 2015 was 10%–25% [9]; however, the percentage is much higher in Asian cities [9,10,11]. The annual registrations of motorcycles in the EU increased in recent years, exceeding one million both in 2018 and 2019. The registrations of mopeds, which are one third of the motorcycles, on the other hand decreased. The relative contribution of mopeds and motorcycles to air pollution started to increase as the levels from other vehicles started to decrease. The market share of Euro 4 motorcycles in 2020 is estimated to be around 10%–15% assuming that 65%–100% of registrations since 2016 fulfil the Euro 4 standards, and assuming a fleet of 25 million motorcycles (it was 24 million in 2018). There are many studies that have examined the emissions of motorcycles [12,13,14,15,16,17,18,19,20,21,22,23,24], but not many for large displacement motorcycles [25,26,27,28]. However, the data for Euro 4 motorcycles are almost non-existent, with limited data in the Euro 5 L-category study [29] (no emission results for Euro 4 motorcycles) or sometimes at reported values from type approval authorities [30].
The objective of this work is to present the gaseous and particulate emissions of a Euro 4 motorcycle. The variability of different drivers and different setups (open or close transfer tube to the dilution tunnel) will also be examined.
2. Materials and Methods
The motorcycle was Euro 4 type approved, with 1 L engine displacement, 70 kW max power at 7500 rpm and 100 Nm max torque at 6000 rpm, with 1100 km on the odometer. It belonged to the high-performance motorcycles category (L3e-A3) because the power/weight ratio was >0.2 kW/kg, and the maximum power > 35 kW. It had manual transmission, electronic injection and three-way catalyst. The empty mass was 230 kg and an inertia of 310 kg was used for testing. Reference gasoline fuel with 5% ethanol content was used.
Figure 1 presents the setup. The Vehicle Emissions Laboratory (VELA 1) of the European Commission—Joint Research Centre (JRC) (Ispra, Italy) is a climatic emission test cell with a single axis roller dynamometer. All tests were conducted at an ambient temperature of 23–25 °C and relative humidity of 45%–55%. The exhaust of the motorcycle was diluted in a full dilution tunnel with constant volume sampling (CVS). A CVS flow rate of 7.2 m3/min was used.
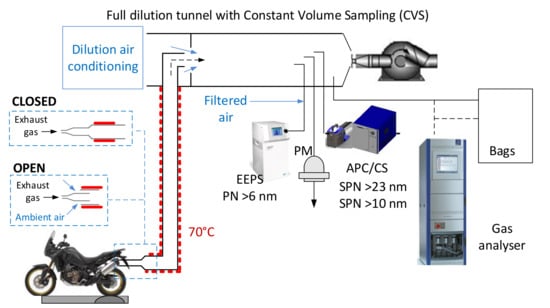
Figure 1.
Experimental setup showing the two configurations with open and closed transfer tube to the full dilution tunnel. APC = AVL particle counter; CVS = constant volume sampling; CS = catalytic stripper; EEPS = engine exhaust particle sizer; PN = particle number; SPN = solid particle number.
Gas pollutants were measured from the dilution tunnel in real time with analyzers AMA i60 (from AVL, Graz, Austria). A small part of the diluted gas was also collected in bags and was analyzed for the gaseous pollutants at the end of the cycle with the same set of analyzers (Figure 1). The principle of operation of the analyzers was: non-dispersive infrared detection for CO and CO2, chemiluminescence for NOx, and hot (191 °C) flame ionization detection for total hydrocarbons (THC) and methane (CH4). The gas analyzers had different calibration ranges and the most appropriate was used during the tests, depending on the measured concentration. The typical uncertainty was 2% for concentration levels above the limit of detection, as in this study. Combined with the uncertainty of the calibration gases, linearity, and dilution tunnel flow (around 2%), a combined uncertainty of 5% was calculated for the gaseous pollutants [31].
For the determination of PM mass, 47 mm Teflon-coated glass-fiber Pallflex (CT, United States) TX40H120-WW filters were used with a flow rate of 50 L/min, as described in the Regulation (EU) 2014/134.
An AVL particle counter (APC) 489 (AVL, Graz, Austria) [32], compliant with the light-duty vehicle regulations, was connected to the dilution tunnel. The system consisted of a hot diluter at 150 °C, a catalytic stripper at 350 °C [33], and a final porous diluter operating with room-temperature filtered air. For sub-23 nm, a catalytic stripper is necessary for the removal of volatile particles according to the latest Global Technical Regulation (GTR 15) for light-duty vehicles [34,35]. The applied particle number concentration reduction factor (PCRF) was 500 (50 × 10). The PCRF was determined by the manufacturer during the calibration of the instrument and combined the dilution and average particle losses at 30, 50 and 100 nm, as required in the light-duty regulation. Downstream of the second dilution two AVL butanol condensation particle counters (CPCs) with 50% counting efficiency at 23 nm and 65% efficiency at 10 nm were used to measure the PN concentrations of solid particles > 23 (SPN > 23 nm) and >10 nm (SPN > 10 nm), respectively. The specific counting efficiencies are defined in GTR 15 [35].
An engine exhaust particle sizer (EEPS 3090) (model 3090 from TSI, Shoreview, MN, USA) was connected to the full dilution tunnel using a simple diluter (dilution ratios 2:1 to 3:1). The EEPS measured particle size distributions from 5.6 to 560 nm, based on particle charging and measuring their current at the electrometers where they deposited. The fractal (soot) inversion algorithm was applied [36]. As there was no thermal treatment, all particles (i.e., solids and volatiles) were measured (PN > 6 nm).
Two sampling configurations were applied, both allowed in the L-category regulation: the closed, where the whole exhaust gas was diluted at the full dilution tunnel, and the open were the transfer tube was left open around the motorcycle’s tailpipe, thus some dilution was taking place already there. The open configuration is sometimes used when mopeds or small motorcycles are tested in order to minimize the effect of the CVS suction on the engine. The dilution and cooling reduces the exhaust gas temperature, but it does not necessarily avoid condensation [37,38]. No differences of gaseous pollutants are expected, but for particles there might be an effect due to the dilution and cooling [37]. Disadvantages include mixing with unfiltered air, risk of contamination from dust suspended from the cooling fan, and uncontrolled and variable dilution at mixing point. For the experiments of this study, the dilution was 3.9–4.7:1 for the urban part, 2.8–3.9:1 for the rural part and 1.8–2.2:1 for the motorway part. The ambient air in the chassis dynamometer room was filtered.
The cycle was the WMTC (World Harmonized Motorcycle Test Cycle) stage 2, class 3, sub-class 3-2. The tests consisted of three parts of 600 s each. The first part represented urban driving, starting with cold engine and had a mean speed of 24.3 km/h. The second part represented rural driving with mean speed of 54.5 km/h and the last part motorway driving with mean speed of 94.2 km/h. The WMTC was introduced with Euro 4 and is based on actual driving patterns. For the calculations of the cycle emissions, the weighing factors of part 1 and part 3 were 25%, and 50% for part 2.
The tests were conducted with two drivers. The first one was experienced and conducted more tests in order to precondition the vehicle, thus driver 1 results should be considered more representative of the actual behavior of the motorcycle. The second driver had less experience with chassis dynamometer driving and did not practice driving the specific motorcycle. Both followed the cycle without speed trace violations. There are no driving indexes prescribed in the L-category regulation, but the driving style will be discussed in the Discussion section based on the driving indexes of the light-duty Regulation (EU) 2018/1832.
3. Results
Figure 2 presents real-time examples of the gaseous pollutants with the two drivers. Most CO2 was emitted during the motorway driving (last part of the cycle). Similarly, for NOx, at the high-speed part NOx emissions were high, with a significant contribution from the transients. CO and THC had high emissions during cold start and at the last part of the cycle. In general, there is good agreement of the two drivers for CO2, while for CO and THC (total hydrocarbons) driver 2 generated higher spikes during cold start. For NOx, driver 2 generated more spikes during the whole cycle.
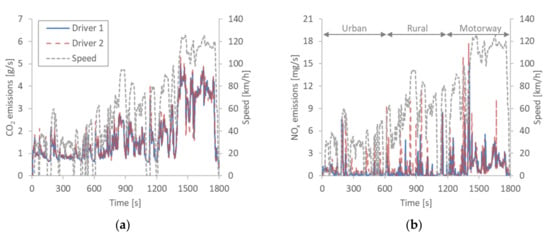
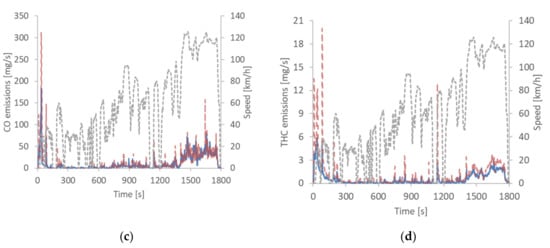
Figure 2.
Real-time emissions of the gaseous pollutants with the two drivers (Driver 1: blue line, Driver 2 red dashed line): (a) CO2; (b) NOx; (c) CO; (d) THC (total hydrocarbons). The speed profile is also plotted with grey dotted lines.
Figure 3 summarizes the cycle averaged results for the gaseous pollutants with the two drivers and the two configurations. The cycle average emissions were calculated weighing part 1 and part 3 at 25%, while part 2 was at 50%. The applicable Euro 4 limits are given, as well the future Euro 5 limits. All results were below the applicable Euro 4 limits. They were (including NMHC) also lower than the future Euro 5 limits, except for NOx with driver 2. The two drivers had 1 g/km difference for CO2, but for the same driver there was no difference between open and closed configurations. Similarly, for CO there was a difference between the two drivers, but not between open or closed configurations for the same driver. For NOx and THC there was difference between the two drivers; no difference between open and close configurations for driver 1, but a small difference for driver 2, probably due to the small differences in driving for the two cases.
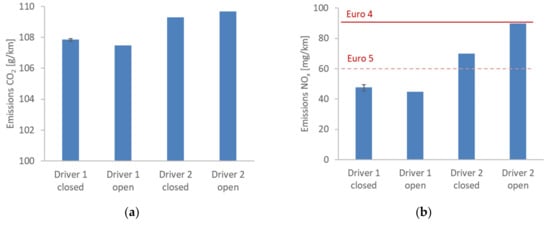
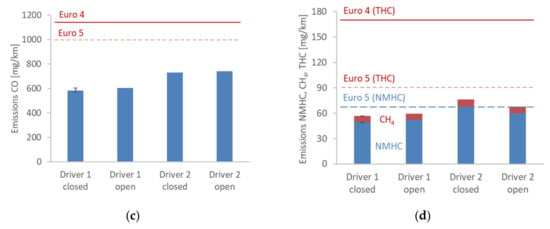
Figure 3.
Cycle emissions of the gaseous pollutants with the two drivers and configurations: (a) CO2; (b) NOx; (c) CO; (d) THC (total hydrocarbons), NMHC (non-methane hydrocarbons), CH4 (methane). The applicable Euro 4 limits are given with the red continuous lines, while the future Euro 5 with dashed lines.
Figure 4 summarizes the particulate emissions. The PM mass was lower than 0.5 mg/km (Figure 4a); almost 10 times lower than the future Euro 5 limit for diesel and gasoline direct injection engines. For driver 1 (open configuration), the PM mass was almost 0 mg/km (only 7 μg the filter weight increase). These low levels were close to the background levels of the facility. For this reason, no differences could be seen between drivers or configurations. The SPN > 23 nm emissions were 2–3 × 10¹¹ p/km; less than half of the passenger cars’ SPN > 23 nm limit. The SPN > 10 nm levels were double, reaching 6 × 10¹¹ p/km. The GMD (geometric mean diameter) as determined by the EEPS was 15.5 to 17.5 nm (open configuration) justifying the high sub-23 nm particle concentration. The SPN emissions of driver 1 were lower than those of the second driver. The closed and open configurations were similar for SPN > 23 nm, but the SPN > 10 nm was lower with the closed configuration compared to the open. The PN > 6 nm were at the SPN > 10 nm levels for the open configuration but more than one order of magnitude higher with the closed.
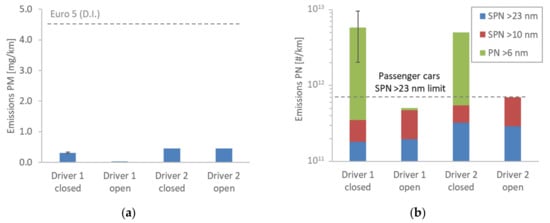
Figure 4.
Particulate emissions with the two drivers and the two sampling configurations: (a) particulate matter (PM) mass. The grey dashed line shows the limit applicable to Euro 5 diesel and gasoline direct injection (D.I.) engines; (b) particle number (PN) and solid particle number (SPN) emissions. The grey dashed lines shows the SPN >23 nm limit applicable to passenger cars.
Figure 5 plots the real-time SPN emissions above 23 and 10 nm, along with the PN emissions above 6 nm. Most particles were produced during accelerations. The cold start emissions were not particularly high, compared to the rest of the cycle. The closed configuration had lower concentrations, except at the high-speed part with the EEPS measuring PN > 6 nm. The concentrations increased by orders of magnitudes when the exhaust gas temperature exceeded 300 °C.
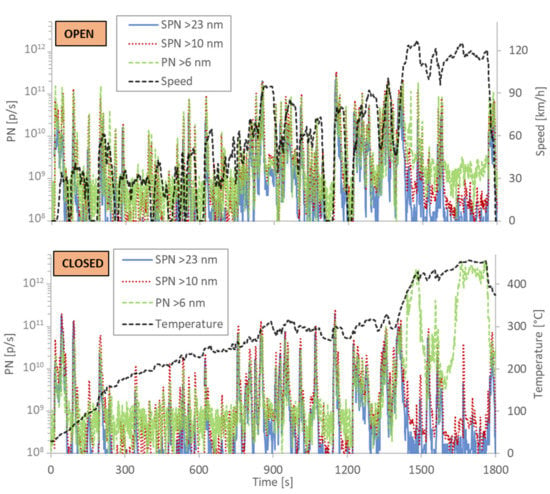
Figure 5.
Real-time particle number (PN) emissions with the same driver 2 and the two sampling configurations: open (upper panel) and closed (lower panel).
4. Discussion
This study examined the emissions of a 1 L Euro 4 motorcycle with two drivers and two configurations (open and closed). The first driver was more experienced in chassis driving and practiced the cycle before the official tests, while the second did not. In the closed configuration, the whole exhaust gas was transferred to the full dilution tunnel via a 4 m tube heated at 80 °C. In the open configuration, ambient air was mixed with the exhaust gas at the tailpipe (dilution ratios around 2–4:1) and the diluted exhaust was transferred to the dilution tunnel. This resulted in lower exhaust gas temperatures in the transfer line.
For the gaseous pollutants, there was no significant effect of the sampling configuration, while the influence of the driver was significant (Table 2). The influence of the driver on CO2 (fuel consumption) and emissions in real driving is well known [39]. In a predetermined cycle, though, the influence is much smaller and in some cases it can be attributed to different gear selection [40]. Here none of these are the reason, because they were the same for the two drivers. Small differences could only been seen in the lambda values (see Appendix A, Figure A1) and only minor in the speed traces (see Appendix A, Figure A2). In all cases the emissions respected the Euro 4 limits and they were much lower compared to those reported in the literature for older motorcycles [26,27,28]. The specific motorcycle could also fulfil the upcoming Euro 5 limits (except NOx with driver 2). Euro 5-compliant motorcycles will have to reduce non-methane hydrocarbons without increasing NOx; the former (NMHC, but also THC and CO) needs the catalyst at lean conditions and the second (NOx) needs the catalyst at rich conditions [41]. Thus, the future challenge is being at stoichiometric conditions in all transient operations across the test cycle. Nevertheless, the current results indicate that at least for large engine displacement motorcycles the emissions have been improved significantly and probably motorcycles are the class with the lowest emissions in the L-category. However, this statement has to be confirmed with more vehicles, assessment of the emissions on the road, and after more mileage accumulation. Higher emissions on the road have often been reported for passenger cars, even for gasoline ones for CO and NOx [42]. On-road testing of motorcycles is challenging due to the need of small portable emission measurement systems (PEMS). Recent studies showed that this is feasible [43]. Until Euro 3 there were no durability requirements. A durability study [44] on a 500 cm3 one-cylinder scooter found that the CO emissions exceeded the Euro 3 limit after only 2000 km and NOx after 5000 km. Durability mileage, also indicated as useful life values, as determined in Annex VII of Regulation (EU) No 168/2013, is 35,000 km for motorcycles with maximum speed > 130 km/h. The Euro 4 deterioration factors are 1.3 for CO and 1.2 for NOx and THC. This would mean that a 20%–30% increase is expected until the end of the useful life of the motorcycle.

Table 2.
Comparisons of emissions between open and closed configurations and between drivers.
The driving style had an effect also on the SPN emissions, which were in general higher with the second driver (Table 2, last row). Yet, they were below the applicable SPN limit for passenger cars. One important finding was that the closed configuration resulted in approximately 30% lower SPN >10 nm emissions compared to the open configuration (Table 2). This was not so evident for the SPN >23 nm emissions (differences within ±10%). This has been noted in other studies as well and has been attributed to particle agglomeration from the tailpipe to the dilution tunnel, when the tailpipe particle concentrations are high for both light-duty vehicles [45] and two-wheelers [37]. The SPN >23 nm concentrations were at levels that the agglomeration was not significant, while the SPN >10 nm levels were high enough to result in a 30% decrease. The most interesting finding of this study, though, was the huge difference of PN >6 nm measurements between open and closed configurations. The high increase started when the exhaust gas temperature exceeded 300 °C. At such high temperatures any deposited or desorbed material in the transfer line could be released. It can be assumed that the released material nucleated during cooling and dilution in the full dilution tunnel and resulted in high particle concentrations. Such desorption and high concentration of nucleation mode particles was reported in a dedicated study on the influence of the transfer line on particulate emissions [46]. With the open configuration, the exhaust gas temperature in the transfer tube was much lower due to the dilution taking place directly at the tailpipe (<200 °C vs. <450 °C). Thus, no desorption took place in the transfer line and there were no precursors to nucleate in the dilution tunnel. It is not clear though whether sub-6 nm particles (which was the lower detection size of the EEPS instrument) pre-existed (i.e., emitted from the motorcycle). In this case, the high concentrations with the closed configuration would be due to heterogeneous nucleation of the desorbed material on the pre-existing particles. The high scatter and their appearance when the solid particles concentration was low indicate that they were volatile in nature and not true emissions of the motorcycle. Similar results and conclusions were drawn from regeneration tests of a diesel vehicle, where the EEPS at the tailpipe measured low PN >6 nm concentrations, while at the full dilution tunnel it was orders of magnitude higher [47]. Similar volatile artefacts have been reported in the past for passenger cars [48,49]. The high amount of volatile particles might interfere with the solid particle measurements [3].
Table 3 summarizes the contribution of cold start and the last relatively constant high-speed part on the emissions with the two drivers. The contribution of each part (urban, rural, motorway) is given in the Appendix A in Table A1. The highest contribution to gaseous pollutants emissions came from the high-speed driving (around 50% of the emissions). The engine was running slightly rich, resulting in lower conversion efficiency in the three-way catalyst (TWC) (see Appendix A, Figure A1). It is also possible that the catalyst was sized for the specific speed so that the limits would be respected without oversizing it to achieve near zero emissions. Cold start also contributed significantly (14%–38%), and was even higher than the highway driving when expressing the contribution of emissions as ratios to CO2. Driver 2 resulted in higher emissions during cold start than driver 1. This was due to the small differences in the driving style to follow the cycle route (see Appendix A, Figure A1). It is difficult to characterize the driving style. The RMSSE (root mean squared speed error) of the two drivers had a small difference of 0.07 km. However, the IWR (inertial work rating) had 7% difference. To put the differences into context, although not comparable due to different cycles, for light-duty vehicles the limits are RMSSE < 1.3 km and IWR < 4%. Details for the calculations can be found in SAE J2951. Applying the speed-distance CO2 correction which is applicable to light-duty vehicles since September 2019, the second driver would need to reduce 0.7 g/km more than the first driver, bringing the CO2 emissions of the two drivers very close to each other. Details for the calculation can be found in the Commission Regulation (EU) 2018/1832 amending the Commission Regulation (EU) 2017/1151 or in the literature [50].

Table 3.
Contribution of cold start (first 300 s) and last 400 s of high-speed driving to total emissions with the two configurations and drivers.
5. Conclusions
In this study, the emissions of a 1 L Euro 4 motorcycle were measured with two drivers and two configurations (open and closed transfer tube to the full dilution tunnel). Open and closed configurations gave similar results on gaseous pollutants (CO2 within 0.3%, rest pollutants 10%) but the driving style had an influence on the emissions (CO2 1.3%, rest pollutants 25%–50%). This raises concerns of whether driving indexes, similar to those used in the light-duty regulations, should be introduced. Nevertheless, the emission levels respected the Euro 4 limits and they were even lower than the upcoming Euro 5 limits with the exception of NOx with one driver (CO 600 mg/km, NOx 48 mg/km, total hydrocarbons 60 mg/km). The majority of the emissions (around 50%) was produced in the high-speed part of the cycle, but cold start also contributed significantly (around 25%). The findings of this study should be confirmed with more vehicles, on-road driving emissions, and higher mileage at the odometer, close to the end of the useful life of the motorcycle.
One important finding was that the open configuration was more representative of the actual particulate emissions of the motorcycle (3 × 10¹¹ p/km). The closed configuration resulted in lower solid particle emissions due to agglomeration (30%), but most importantly very high total particle emissions (i.e., including volatiles) (more than one order of magnitude) due to desorption of deposited material in the transfer tube to the dilution tunnel during high-speed driving. Thus, mixing directly at the tailpipe (e.g., open configuration or mixing tee) should be preferred for motorcycle measurements.
Funding
This research received no external funding.
Acknowledgments
The author would like to acknowledge A. Bonamin, M. Sculati, D. Leseuer, and F. Forloni for their technical assistance in the execution of the tests.
Conflicts of Interest
The author declares no conflict of interest. The opinions expressed in this manuscript are those of the author and should in no way be considered to represent an official opinion of the European Commission. Mention of trade names or commercial products does not constitute endorsement or recommendation by the European Commission or the author.
Appendix A
The lambda value during the cycle with the two drivers (closed configuration) is plotted in Figure A1. Deviation from 1 is noted during the urban part (>1) and the highway part (<1), and during decelerations.
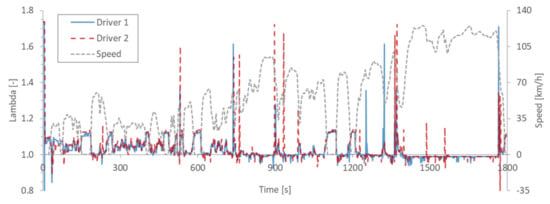
Figure A1.
Real-time lambda values over the cycle with the two drivers (closed configuration).
Figure A2 compares the speed traces of the two drivers for the urban part, where the highest differences were noted.
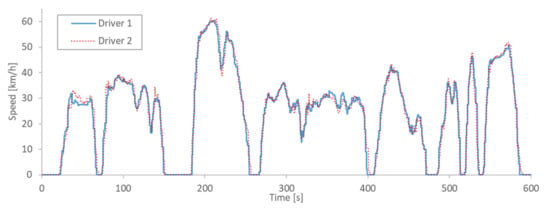
Figure A2.
Actual speed traces with the two drivers.
The emissions of each part [mg/km] or [p/km] can be calculated by multiplying the percentages (Table A1) with the emission rates (Figure 3 and Figure 4) and the ratio d/di where di is the distance of the respective part (urban 4 km, rural 9 km, motorway 15.7 km) and d is the total distance (=28.8 km).

Table A1.
Contribution of cold start urban part (first 600 s) and motorway part (last 600 s) to the total emissions with the two configurations and drivers (no weighing factors).
Table A1.
Contribution of cold start urban part (first 600 s) and motorway part (last 600 s) to the total emissions with the two configurations and drivers (no weighing factors).
| Part of Cycle | Config. | Driver | CO2 | CO | NOx | THC | CH4 | SPN23 | SPN10 | PN6 |
|---|---|---|---|---|---|---|---|---|---|---|
| Urban 600 s | Closed | 1 | 18% | 20% | 20% | 35% | 29% | 27% | 22% | 1% |
| Urban 600 s | Open | 1 | 18% | 18% | 21% | 35% | 29% | 13% | 15% | 21% |
| Urban 600 s | Closed | 2 | 18% | 25% | 25% | 41% | 32% | 28% | 24% | 0% |
| Urban 600 s | Open | 2 | 18% | 16% | 23% | 34% | 27% | 10% | 17% | 21% |
| Motorway 600 s | Closed | 1 | 55% | 68% | 61% | 51% | 56% | 35% | 39% | 98% |
| Motorway 600 s | Open | 1 | 55% | 68% | 58% | 52% | 55% | 42% | 41% | 39% |
| Motorway 600 s | Closed | 2 | 54% | 62% | 52% | 44% | 52% | 34% | 40% | 99% |
| Motorway 600 s | Open | 2 | 54% | 68% | 54% | 50% | 56% | 45% | 44% | 46% |
References
- European Environment Agency (EEA). Air Quality in Europe: 2019 Report; Publications Office of the European Union: Luxembourg, 2019; ISBN 978-92-9480-088-6. [Google Scholar]
- Giechaskiel, B.; Zardini, A.; Martini, G. Particle emission measurements from L-category vehicles. SAE Int. J. Engines 2015, 8, 2322–2337. [Google Scholar] [CrossRef]
- Kontses, A.; Ntziachristos, L.; Zardini, A.A.; Papadopoulos, G.; Giechaskiel, B. Particulate emissions from L-Category vehicles towards Euro 5. Environ. Res. 2020, 182, 109071. [Google Scholar] [CrossRef] [PubMed]
- Giechaskiel, B.; Zardini, A.A.; Lähde, T.; Perujo, A.; Kontses, A.; Ntziachristos, L. Particulate emissions of Euro 4 motorcycles and sampling considerations. Atmosphere 2019, 10, 421. [Google Scholar] [CrossRef]
- Giechaskiel, B. Differences between tailpipe and dilution tunnel sub-23 nm nonvolatile (solid) particle number measurements. Aerosol Sci. Technol. 2019, 53, 1012–1022. [Google Scholar] [CrossRef]
- Giechaskiel, B. Effect of sampling conditions on the sub-23 nm nonvolatile particle emissions measurements of a moped. Appl. Sci. 2019, 9, 3112. [Google Scholar] [CrossRef]
- ACEM Association des Constructeurs Européens de Motocycles. Market Data. Available online: https://www.acem.eu/market-data-previous-years (accessed on 2 November 2020).
- European Commission. Directorate General for Mobility and Transport. In EU Transport in Figures: Statistical Pocketbook; Publications Office of the European Union: Luxembourg, 2019; ISBN 978-92-76-03843-6. [Google Scholar]
- Dorocki, S. Changes in the market of two and three-wheeled motor vehicles in Europe at the beginning of the 21st century. EBER 2018, 6, 175–193. [Google Scholar] [CrossRef]
- Tan, X.; Zeng, Y.; Gu, B.; Wang, Y.; Xu, B. Scenario analysis of urban road transportation energy demand and GHG emissions in China—a case study for Chongqing. Sustainability 2018, 10, 2033. [Google Scholar] [CrossRef]
- Iqbal, A.; Afroze, S.; Rahman, M.d.M. Vehicular PM emissions and urban public health sustainability: A probabilistic analysis for Dhaka city. Sustainability 2020, 12, 6284. [Google Scholar] [CrossRef]
- Costagliola, M.A.; Murena, F.; Prati, M.V. Exhaust emissions of volatile organic compounds of powered two-wheelers: Effect of cold start and vehicle speed. Contribution to greenhouse effect and tropospheric ozone formation. Sci. Total Environ. 2014, 468–469, 1043–1049. [Google Scholar] [CrossRef]
- Momenimovahed, A.; Olfert, J.S.; Checkel, M.D.; Pathak, S.; Sood, V.; Singh, Y.; Singal, S.K. Real-time driving cycle measurements of ultrafine particle emissions from two wheelers and comparison with passenger cars. Int. J. Automot. Technol. 2014, 15, 1053–1061. [Google Scholar] [CrossRef]
- Yang, H.; Hsieh, L.; Liu, H.; Mi, H. Polycyclic aromatic hydrocarbon emissions from motorcycles. Atmos. Environ. 2005, 39, 17–25. [Google Scholar] [CrossRef]
- Tsai, J.-H.; Huang, P.-H.; Chiang, H.-L. Air pollutants and toxic emissions of various mileage motorcycles for ECE driving cycles. Atmos. Environ. 2017, 153, 126–134. [Google Scholar] [CrossRef]
- Zamboni, G.; Carraro, C.; Capobianco, M. On-road instantaneous speed measurements on powered two-wheelers for exhaust emissions and fuel consumption evaluation. Energy 2011, 36, 1039–1047. [Google Scholar] [CrossRef]
- Zamboni, G.; Prati, M.V.; Carraro, C.; Malfettani, S.; Costagliola, M.A.; Meccariello, G.; Marelli, S.; Capobianco, M. Influence of Driving Cycles on Powered Two-Wheelers Emissions, Fuel Consumption and Cold Start Behavior; SAE International: Warrendale, PA, USA, 2013. [Google Scholar] [CrossRef]
- Hassani, A.; Hosseini, V. An assessment of gasoline motorcycle emissions performance and understanding their contribution to Tehran air pollution. Transp. Res. Part D Transp. Environ. 2016, 47, 1–12. [Google Scholar] [CrossRef]
- Iodice, P.; Senatore, A. New research assessing the effect of engine operating conditions on regulated emissions of a 4-stroke motorcycle by test bench measurements. Environ. Impact Assess. Rev. 2016, 61, 61–67. [Google Scholar] [CrossRef]
- Lin, Y.-C.; Chou, F.-C.; Li, Y.-C.; Jhang, S.-R.; Shangdiar, S. Effect of air pollutants and toxic emissions from various mileage of motorcycles and aerosol related carcinogenicity and mutagenicity assessment. J. Hazard. Mater. 2019, 365, 771–777. [Google Scholar] [CrossRef]
- Fu, J.; Deng, B.; Liu, X.; Shu, J.; Xu, Y.; Liu, J. The experimental study on transient emissions and engine behaviors of a sporting motorcycle under World Motorcycle Test Cycle. Energy 2020, 211, 118670. [Google Scholar] [CrossRef]
- Tung, H.D.; Tong, H.Y.; Hung, W.T.; Anh, N.T.N. Development of emission factors and emission inventories for motorcycles and light duty vehicles in the urban region in Vietnam. Sci. Total Environ. 2011, 409, 2761–2767. [Google Scholar] [CrossRef] [PubMed]
- Yang, H.-H.; Liu, T.-C.; Chang, C.-F.; Lee, E. Effects of ethanol-blended gasoline on emissions of regulated air pollutants and carbonyls from motorcycles. Appl. Energy 2012, 89, 281–286. [Google Scholar] [CrossRef]
- Chiang, H.-L.; Huang, P.-H.; Lai, Y.-M.; Lee, T.-Y. Comparison of the regulated air pollutant emission characteristics of real-world driving cycle and ECE cycle for motorcycles. Atmos. Environ. 2014, 87, 1–9. [Google Scholar] [CrossRef]
- Andersson, J.D.; Lance, D.L.; Jemma, C.A. DfT Motorcycle Emissions Measurement Programmes: Unregulated Emissions Results; SAE International: Warrendale, PA, USA, 2003. [Google Scholar] [CrossRef]
- Vasic, A.-M.; Weilenmann, M. Comparison of real-world emissions from two-wheelers and passenger cars. Environ. Sci. Technol. 2006, 40, 149–154. [Google Scholar] [CrossRef] [PubMed]
- Iodice, P.; Senatore, A. Exhaust emissions of new high-performance motorcycles in hot and cold conditions. Int. J. Environ. Sci. Technol. 2015, 12, 3133–3144. [Google Scholar] [CrossRef]
- Kumar, R.; Durai, B.K.; Saleh, W.; Boswell, C. Comparison and evaluation of emissions for different driving cycles of motorcycles: A note. Transp. Res. Part D Transp. Environ. 2011, 16, 61–64. [Google Scholar] [CrossRef]
- Ntziachristos, L.; Vonk, W.A.; Papadopoulos, G.; van Mensch, P.; Geivanidis, S.; Mellios, G.; Papadimitriou, G.; Steven, H.; Elstgeest, M.; Ligterink, N.E.; et al. Effect Study of the Environmental Step Euro 5 for L-category Vehicles; Publications Office of the European Commission, European Commission: Luxembourg, 2017; ISBN 978-92-79-70203-7. [Google Scholar]
- Kraftfahrt-Bundesamt (KBA). Pollutant Type Test Values of Two, Three and Light Four-Wheeled Vehicles (Category L: Mopeds, Light Motorcycles, Trikes und Quads); Report SV 2.1.1. September 2020. Available online: https://www.kba.de/EN/Typgenehmigung_en/Fahrzeugtypdaten_amtlDaten_TGV_en/Auskuenfte_Informationen_en/Veroeffentlichungen_en/SV2_en.html (accessed on 2 November 2020).
- Giechaskiel, B.; Clairotte, M.; Valverde-Morales, V.; Bonnel, P.; Kregar, Z.; Franco, V.; Dilara, P. Framework for the assessment of PEMS (portable emissions measurement systems) uncertainty. Environ. Res. 2018, 166, 251–260. [Google Scholar] [CrossRef]
- Giechaskiel, B.; Cresnoverh, M.; Jörgl, H.; Bergmann, A. Calibration and accuracy of a particle number measurement system. Meas. Sci. Technol. 2010, 21, 045102. [Google Scholar] [CrossRef]
- Amanatidis, S.; Ntziachristos, L.; Giechaskiel, B.; Katsaounis, D.; Samaras, Z.; Bergmann, A. Evaluation of an oxidation catalyst (“catalytic stripper”) in eliminating volatile material from combustion aerosol. J. Aerosol Sci. 2013, 57, 144–155. [Google Scholar] [CrossRef]
- Giechaskiel, B.; Melas, A.D.; Lähde, T.; Martini, G. Non-volatile particle number emission measurements with catalytic strippers: A review. Vehicles 2020, 2, 342–364. [Google Scholar] [CrossRef]
- Lahde, T.; Giechaskiel, B.; Martini, G. Development of Measurement Methodology for Sub 23 nm Particle Number (PN) Measurements; SAE International: Warrendale, PA, USA, 2020. [Google Scholar] [CrossRef]
- Wang, X.; Grose, M.A.; Avenido, A.; Stolzenburg, M.R.; Caldow, R.; Osmondson, B.L.; Chow, J.C.; Watson, J.G. Improvement of Engine Exhaust Particle Sizer (EEPS) size distribution measurement–I. Algorithm and applications to compact-shape particles. J. Aerosol Sci. 2016, 92, 95–108. [Google Scholar] [CrossRef]
- Giechaskiel, B.; Zardini; Lahde, T.; Clairotte, M.; Forloni, F.; Drossinos, Y. Identification and quantification of uncertainty components in gaseous and particle emission measurements of a moped. Energies 2019, 12, 4343. [Google Scholar] [CrossRef]
- Giechaskiel, B.; Zardini, A.A.; Clairotte, M. Exhaust gas condensation during engine cold start and application of the dry-wet correction factor. Appl. Sci. 2019, 9, 2263. [Google Scholar] [CrossRef]
- Pavlovic, J.; Fontaras, G.; Ktistakis, M.; Anagnostopoulos, K.; Komnos, D.; Ciuffo, B.; Clairotte, M.; Valverde, V. Understanding the origins and variability of the fuel consumption gap: Lessons learned from laboratory tests and a real-driving campaign. Environ. Sci. Eur. 2020, 32, 53. [Google Scholar] [CrossRef]
- Giechaskiel, B.; Riccobono, F.; Vlachos, T.; Mendoza-Villafuerte, P.; Suarez-Bertoa, R.; Fontaras, G.; Bonnel, P.; Weiss, M. Vehicle emission factors of solid nanoparticles in the laboratory and on the road using portable emission measurement systems (PEMS). Front. Environ. Sci. 2015, 3. [Google Scholar] [CrossRef]
- Stone, R. Introduction to Internal Combustion Engines, 4th. ed.; SAE International: Warrendale, PA, USA, 2012; ISBN 978-0-7680-2084-7. [Google Scholar]
- Valverde, V.; Mora, B.A.; Clairotte, M.; Pavlovic, J.; Suarez-Bertoa, R.; Giechaskiel, B.; Astorga-LLorens, C.; Fontaras, G. Emission factors derived from 13 Euro 6b light-duty vehicles based on laboratory and on-road measurements. Atmosphere 2019, 10, 243. [Google Scholar] [CrossRef]
- Vojtisek-Lom, M.; Zardini, A.A.; Pechout, M.; Dittrich, L.; Forni, F.; Montigny, F.; Carriero, M.; Giechaskiel, B.; Martini, G. A miniature portable emissions measurement system (PEMS) for real-driving monitoring of motorcycles. Atmos. Meas. Tech. 2020. [Google Scholar] [CrossRef]
- Favre, C.; Bosteels, D.; May, J.; De Souza, I.; Beale, L.; Andersson, J. An Emissions Performance Evaluation of State-Of-The-Art Motorcycles over Euro 3 and WMTC Drive Cycles; SAE International: Warrendale, PA, USA, 2009. [Google Scholar] [CrossRef]
- Giechaskiel, B.; Lähde, T.; Drossinos, Y. Regulating particle number measurements from the tailpipe of light-duty vehicles: The next step? Environ. Res. 2019, 172, 1–9. [Google Scholar] [CrossRef] [PubMed]
- Yang, J.; Pham, L.; Johnson, K.C.; Durbin, T.D.; Karavalakis, G.; Kittelson, D.; Jung, H. Impacts of exhaust transfer system contamination on particulate matter measurements. Emiss. Control Sci. Technol. 2020, 6, 163–177. [Google Scholar] [CrossRef]
- Giechaskiel, B. Particle number emissions of a diesel vehicle during and between regeneration events. Catalysts 2020, 10, 587. [Google Scholar] [CrossRef]
- Maricq, M.M.; Chase, R.E.; Podsiadlik, D.H.; Vogt, R. Vehicle Exhaust Particle Size Distributions: A Comparison of Tailpipe and Dilution Tunnel Measurements; SAE International: Warrendale, PA, USA, 1999. [Google Scholar] [CrossRef]
- Hall, D.E.; Dickens, C.J. Measurement of the Number and Size Distribution of Particles Emitted from a Gasoline Direct Injection Vehicle; SAE International: Warrendale, PA, USA, 1999. [Google Scholar] [CrossRef]
- Pavlovic, J.; Marotta, A.; Ciuffo, B.; Serra, S.; Fontaras, G.; Anagnostopoulos, K.; Tsiakmakis, S.; Arcidiacono, V.; Hausberger, S.; Silberholz, G. Correction of test cycle tolerances: Evaluating the impact on CO2 results. Transp. Res. Procedia 2016, 14, 3099–3108. [Google Scholar] [CrossRef]
Publisher’s Note: MDPI stays neutral with regard to jurisdictional claims in published maps and institutional affiliations. |
© 2020 by the author. Licensee MDPI, Basel, Switzerland. This article is an open access article distributed under the terms and conditions of the Creative Commons Attribution (CC BY) license (http://creativecommons.org/licenses/by/4.0/).