Article

Attractiveness of Bike-Sharing Stations from a Multi-Modal Perspective: The Role of Objective and Subjective Features

1
Faculty Civil Engineering and Geosciences, Delft University of Technology, 2628 CD Delft, The Netherlands
2
Department of Mining and Civil Engineering, Technical University of Cartagena, 30203 Cartagena, Spain
*
Author to whom correspondence should be addressed.
These authors contributed equally to this work.
Sustainability 2020, 12(21), 9062; https://doi.org/10.3390/su12219062
Submission received: 4 September 2020 / Revised: 13 October 2020 / Accepted: 28 October 2020 / Published: 31 October 2020

Abstract

:
When analysing the performance of bike-sharing scheme (BSS) stations, it is common to find stations that are located in specific points that capture the interest of users, whereas nearby stations are clearly underused. This uneven behaviour is not totally understood. This paper discusses the potential factors influencing station attractiveness, supported by the related literature on cyclists’ and pedestrians’ preferences and the characteristics of the stations themselves. The existing literature addresses these topics independently, while this work unites them by proposing a non data-extensive methodology that allows the attractiveness of BSS stations to be assessed. Attractiveness in this context is understood as the set of physical, environmental and service-related features of a bike station that make it more appealing for BSS users than nearby stations. Special attention is paid to differentiating objective features, based on facts, from subjective features, those influenced by personal perceptions. This classification becomes important in this context because subjective aspects can change from one geographical location to another, making the findings related to these aspects difficult to apply to other regions. Moreover, the assessment of the stations’ levels of safety and security is included. Thus, the proposed measure of attractiveness of BSS stations provides a balanced overview of several features. The consideration of station attractiveness when designing BSS layouts will help to refine the design of new layouts and will assist in conducting an appropriate diagnostic evaluation of the existing ones. This tool will allow urban and transportation planners to reduce re-balancing costs and to maximise user satisfaction at a low cost, which have a direct impact on improving the urban sustainability. The proposed method is applied to the Dublin bike sharing scheme, Dublinbikes, with good performance results.

1. Introduction

Cycling is recognised as a fundamental element when planning sustainable cities, providing a low-emission solution for the last-mile problem of highly congested and overcrowded cities. Despite the many advantages of cycling, some aspects hinder the transition from less sustainable transport modes. It requires acquiring a bike and having it available when needed. To overcome these issues, bike-sharing schemes (BSS) were created.
When analysing the performance of BSS stations, it is common to find stations at specific locations that capture the interest of BSS users, whereas nearby stations are clearly underused. This behaviour has been observed in the BSS of Dublin [1] and in the BSS of Paris [2]. This uneven behaviour, which might not have been foreseen in the design of BSS layouts, can result in avoidable expenditure due to the re-balancing of the system and the unsatisfactory experience of users who have to invest more time and effort to obtain and return bicycles.
Bike stations are small-scale transport nodes—places where modes of transport are shifted. Users arrive on foot and depart on bikes or vice versa. Thus, important feature of bike stations are the peaceful co-existence of cyclists and pedestrians.
The problem of identifying cyclists’ motivations and preferences has attracted considerable attention in recent years, favoured by the development of big data methods and GIS applications. For example, a large number of studies aim to identify the primary factors affecting bikeability, such as road layout and traffic variables [3,4,5,6]. Harkey et al. [7] proposed the bicycle compatibility index (BCI) to evaluate the compatibility of bicycles with motor vehicles in a roadway, and, recently, subjective aspects have also been considered, such as riders’ stress levels, pathway aesthetics or perceived psychological distance [8,9,10].
In addition, walkability measures the attractiveness of an area from the pedestrian’s perspective. Numerous tools and methods have been put forward to measure walkability, such as auditing tools [11], inventories [12], surveys and indices [13,14,15].
Another important feature of bike station is the attractiveness of the station itself and its environment. In this regard, most papers analyse why a station is selected based on individual cyclist’s characteristics, trip characteristics and destination characteristics [16,17], or they estimate potential service demand, especially in cities where BSSs have not yet been implemented [18].
Nevertheless, little attention has been paid to the multi-modal study of factors that might influence the attractiveness of BSS stations considering the following three categories: pedestrians, cyclists and station infrastructure. Attractiveness in this context is understood as the set of physical, environmental and service-related features of a bike station that make it more appealing for BSS users than nearby stations. These three categories (cyclists, pedestrians and station infrastructure) have not been discussed together before, which is, from the authors’ view, an oversimplification of the real problem.
The goal of this paper is to gain a better understanding of the factors that might influence the attractiveness of some BSS stations at the expense of others nearby, taking into account the modes of transport involved (on foot and by bicycle) and the characteristics of the stations themselves. For this purpose, a set of neighbouring bike stations is compared using the proposed methodology that assesses the potential factors influencing station attractiveness. The list of factors considered is supported by related literature on cyclists’ and pedestrians’ preferences and the characteristics of the stations themselves. Special attention is paid to differentiating objective from subjective features. Objective factors include those aspects that are based on facts, and therefore can be unequivocally measured after assuming some premises and uncertainties. Subjective factors cannot be unequivocally measured, as they depend on the perceptions and experiences of the actors involved. This classification becomes important when defining attractiveness because subjective aspects can change from one geographical location to another. For instance, it is difficult to extrapolate results from the Netherlands in terms of biking preferences to be used in the USA. Furthermore, differentiation between safety and security is considered. The results will help to determine the best places to locate the stations from the user’s perspective, and to locate stations not only based on the physical distance between them (for instance, a distance of 250-300 metres between stations is usually considered), but also on the influence radius of the stations. Thus, this research contributes to promoting sustainable urban transport and making cities inclusive and safe (Sustainable Development Goal number 11).
The main contributions that this research provides to the study of BSS station attractiveness are:
  • A methodology to refine the design of new BSS layouts and to conduct diagnostic evaluations of existing BSSs. The methodology is non data-expensive to ease application to different BSSs.
  • Joint analysis of cyclists’ and pedestrians’ perspectives, along with an analysis of the characteristics of the stations themselves.
  • Differentiation between objective and subjective features and their consideration in the methodology.
  • Assessment of stations’ levels of safety and security.
  • Use of relative values instead of absolute values due to their application to areas with similar characteristics of population density and offered services (e.g., commercial district), that is, areas presenting no significant differences in terms of user demand. This allows the dissociation of user demand distribution.
For this reason, the set of studied bike stations have to belong to an area with similar characteristics of population density and offered services, that is, areas presenting no significant differences in terms of user demand. By doing this, the user demand can be considered as a non distinguishing factor.
In order to accomplish the research objectives, the following steps are taken.
  • A review of the literature on cyclists’ preferences during the last five years is carried out. In particular, factors related to cycle lanes, pedestrian ways and BSS station characteristics are enumerated, in addition to whether the relationship with nearby stations is taken into account.
  • A selection of indicators to assess the attractiveness of bike stations is made. Special attention is paid to differentiating objective from subjective factors and the classification between safety and security.
  • A methodology to measure the attractiveness of bike stations combining walkability, bikeability and characteristics of the station itself is developed.
  • The methodology to determine applicability and relevance to the real world is applied to Dublinbikes.
The paper is structured as follows. Factors identified in the literature that can influence the attractiveness of BSS stations are reviewed and categorised in Section 2. In Section 3, the concepts and factors presented in previous sections are used to define sets of indicators that might influence the attractiveness of BSS stations according to walkability, bikeability, the station itself and the objectivity or subjectivity of each item. The proposed methodology to assess the potential factors influencing station attractiveness is described in Section 4 and its application to Dublin BSS is shown in Section 5. Finally, in Section 6, conclusions are drawn.

2. Literature Review

2.1. Scope

Bike stations are multi-modal in character. They are places that allow the co-existence and interaction of pedestrians and cyclists. However, when a BSS is designed or evaluated to improve its performance, most of the scientific manuscripts focus only on bikeability related aspects.
Bikeability, cycleability and rideability are terms used to refer to the attractiveness of an area from cyclists’ perspectives, which is measured by a number of factors that can be broadly classified into cyclists’ comfort and safety and the level of service of the bicycle network. For example, there are a number of studies aiming to identify the primary factors affecting bikeability such as road layout (lane width and curb lane) and traffic variables (volume, speed and ambient traffic density understood as the amount of vehicular volume in relation to cyclist movement) [3,4,5,6,19,20].
Moreover, the research goal is usually the understanding of bike station destination choice behaviour. Thus, most recent papers have analysed the topic based on individual cyclist’s characteristics (e.g., age and gender), trip characteristics (e.g., time of day and purpose or type of user) and destination characteristics (e.g., distance from the origin station, bicycle infrastructure variables and land use) [16,17]. However, station characteristics such as whether the station offers information on how it works, how clear the offered information is or the station’s environmental conditions (cleanliness, shade, lighting) are not analysed. Although these factors could be thought to play a minor role, they might not be negligible when several nearby bike stations have to compete against each other.
Research works about planning and analysis of cycling infrastructure and BSSs available on the database Google Scholar from January 2015 to December 2019 have been reviewed and summarised in Table 1. Given the aim of the research, the keywords ‘Bike-share station characteristics’ and ‘Bikeability’ (also ‘cycleability’) were used as primary search elements to know the cyclists’ preferences. Next, these keywords have been combined with others, such as ‘walkability’, ‘pedestrians’, ‘nearby bike stations’ and ‘bike station choice’. Thus, sets of combinations of these keywords have been selected in the search engine: ‘Bike-share schemes AND pedestrians’, ‘Bike-share schemes AND walkability’, ‘bikeability AND walkability’ or ’Choice nearby bike stations’. The selected papers were screened. After the first screening, 65 papers were selected because of their main topic was analysis, planning or design of BSSs. In a second round, according to their scopes, 27 manuscripts were carefully read and used to formalise an updated overview of the research trends about cyclists, pedestrians and bike-station characteristics in BSSs.
Table 1 groups its columns in six areas. Columns 2 and 3 identify the manuscript’s goal, i.e., BSS analysis or BSS planning, and Columns 4 to 12 indicate the paper scope. More precisely, it indicates when the physical, environmental and service-related features of cycle lanes shown in Figure 1 were considered. Furthermore, mobility patterns or demand studies along with interactions among cycle lanes and road-traffic variables, public transport, pedestrians and nearby BSS stations have been specified, as well as whether the station characteristics themselves have been taken into account in the analysis. Columns 13–15 provide the data source, that is, if data come from GIS data, surveys or another database source. Columns 16–21 are related to the methodology or approach applied in the reviewed papers. Finally, the last three columns indicate if safety and security features or an explicitly distinction between objective or subjective characteristics are discussed. The aim is to demonstrate the recent state of the art in the field, the features and interactions considered and how the proposed methodology provides a new viewpoint (see the last row of Table 1). An integrative perspective of BSS users is considered here, analysing their behaviour when they are pedestrians before or after renting the bicycles, when they are cyclists using the bicycles, and also when they are taking or docking them. Safety and security aspects are considered, and objective and subjective items distinguished.

2.2. Input Data

The consideration of physical (e.g., topography, cycle lane layout) and environmental (e.g., noise, pollution) characteristics of the studied areas are the main input data in almost all the papers considered (see [16,22,23,27], among others). Meanwhile, service-related characteristics, such as cleanliness, information points, amenities and other facilities have started to appear in the last two years [32,33,35,38].
The study of interactions of bike lanes with road traffic, public transport and their associated infrastructures (e.g., bus stops) is quite frequent [16,24,34,37]. Furthermore, the considered features are very similar, for example, length or density of major roads, traffic volume during peak hours and density of bus stops. Nevertheless, the consideration of pedestrians in the studies is not so evident, and the factors studied are very different. Ref. [17] consider the walking distance from each bike station to the nearest parking lot and subway entrance, whereas [10] include only the distance from homes to public bike rental stations. Other authors measure the degree of separation between cycle lanes and pedestrian streets [26] or the average sidewalk width in the studied area [33,34].
As Table 1 shows, the majority of authors who consider the characteristics of the bicycle station itself as well as its relationship to neighboring bicycle stations, do not agree on the influence area to analyse. Ref. [27] work with the stations within a 300 m radius, whereas [28] select a 500 m radius and [33] study a 1 km2 buffer zone.
More than half of the listed papers take into account user demand characteristics (e.g., gender, age and population density) and mobility patterns [21,23,30,31,37,42]. These data are usually difficult to estimate in a design phase and to obtain when the BSS is operational. Data collection requires considerable work and time before it can be included into a model. Acknowledging this handicap, this paper proposes an approach that does not require this extensive information because it compares bike stations located within an area with the same demand. As a consequence, it is pointless to include demand-related factors as a distinguishing aspect to be compared in this context. Note that the total bike demand of a station will depend on both the attractiveness of the station and the total amount of users. In other words, attractiveness will modify the share of the total amount of users that a bike station would receive in an equally-distributed manner.
In relation to the source, GIS tools have gained importance due to their ease of interpretation and quality as an open source. For these reasons, this is the chosen tool for this paper.

2.3. Methodology

The majority of studies are based on statistical methods, which are quite data-intensive [6,16,26,29,32]. Statistical methods are useful for systems in use, but they have limited practicality in the design phase. It is not certain that the developed statistical models could be applicable to other cities or even other areas within the same city, because it would have to be verified that the underlying statistical populations were the same.
A local spatial score framework is proposed in this paper, similar to that used by [22,23,25,33,36,37,39,40]. This metric allows the detection of a significant number of factors affecting pedestrians, cyclists and bike stations. Cyclists have not been prioritised over pedestrians when analysing the attractiveness of bike stations, as they represent both modes of transport of BSS users.

2.4. Objective and Subjective Indicators

Special attention is given to an emerging trend identified in the publications dealing with the assessment and design of BSS and bikeability—namely, objective versus subjective features. In some cases, this differentiation is reflected by the distinctive use of the terms safety and security. In fact, there has been a clear trend towards acknowledging subjective behaviour when dealing with BSS in recent years (since 2018).
The authors emphasise the important distinction between objective and subjective factors in the proposed methodology. Objective factors include those aspects that are based on facts, and therefore can be unequivocally measured after assuming some premises and uncertainties. They can be either directly assessed, for example, walking distance, or indirectly assessed through related indicators [43], such as the number of road accidents as a proxy for road safety. Subjective factors cannot be unequivocally measured, as they depend on the perceptions and experiences of the actors involved. For instance, the level of enjoyment of a route will vary with individual preferences.
However, these two types of factors are not clearly distinguished in the literature. This distinction is either neglected in the majority of cases, or not explicitly indicated (See Table 1). When authors appreciate subjectivity, it is not quantified due to the complexity of assessing it. As a result, the variability of the findings increases and the identification of common patterns to be extrapolated to areas with different cultural backgrounds becomes challenging. To solve this problem, [34] use grey numbers in criterion measures, which denote the possible values of a criterion performance in a range rather than with an exact value. Another approach is presented by [38], who propose the concept of subjective distance to characterise the coverage area of bicycle stations and their levels of service, considering users’ (subjective) perceptions of the distance from their origin to the nearest bicycle station. Other authors [33,41] explicitly indicate that they only observe objective factors.

2.5. Safety Versus Security

Although some languages do not distinguish between the terms safety and security (the Spanish language uses only the word ‘seguridad’ to refer to both concepts), the English language differentiates between being safe and secure. In this paper, safety is linked to the idea of being protected from a hazard, for instance the ability to protect cyclist from vehicular traffic, whereas security implies having the feeling of being protected. Thus, security implies subjectivity because it depends on users’ perception. For example, a cyclist prefers greenery routes but another cyclist does not prefer greenery routes because this user feels there are more possibilities of being attacked (more hides behind trees and brushes exist). In this regard, [40] use the term cycling quality that includes three subjective aspects, namely, ‘perceived safety’ (i.e., ‘security’ according to the previous definition), comfort and attractiveness of streets from cyclists’ point of view.
Physical characteristics of sidewalks (walkway width), cycle lanes (shared/segregated, bikeway width, slope), roads (vehicle speed, number of lanes) and crossing facilities are the basic safety indicators for pedestrians and bikers [6,23,33,34]. Road accidents also are significant for assessing safety. Ref. [25] fit a model to predict the potential for accidents based on the presence of both types of road users, i.e., drivers and cyclists, when there are shared cycle lanes, and, recently, Kamel et al. [42] developed the Bike Safety Index (BSI), a crash prediction model that includes variables such as vehicle kilometres travelled in the area, cyclist kilometres travelled in the same area, average link length and signal density.

3. Overview of Assessment Indicators

The study of the interactions among neighbouring bike stations is the goal of this research. For this purpose, a set of nearby bike stations is compared in order to gain a better understanding of the features that might influence the attractiveness of some BSS stations over nearby stations.
The classification of the factors potentially affecting the attractiveness of BSS stations is presented in Table 2, Table 3 and Table 4. These tables reflect those aspects that can be used to rank the stations considering pedestrians’ and cyclists’ preferences and the characteristics of the stations themselves, respectively. Weather conditions are not relevant in this context because they are not distinguishing factors when analysing stations located in the same area. Following the same reasoning, the set of studied bike stations have to belong to an area with similar characteristics of population density and offered services (e.g., commercial district), that is, areas presenting no significant differences in terms of user demand. By doing this, the user demand can also be considered as a non-distinguishing factor. Given that the target stations are compared against the others, relative values are applied instead of absolute values.
Table 2 and Table 3 deal with the aspects to be considered when analysing walkability and bikeability associated with a given station, respectively. Given that both terms refer to an area rather than a specific spot, they should be analysed in regard to the area surrounding the bike station. In the case of walkability, walking coverage of a 300 m radius (Euclidean distance), or a 5-min walking distance, is proposed because according to [2], every additional meter of walking distance to a station decreases the likelihood of using a bike. This reduction is even more significant at distances greater than 300 m. Other authors have used this distance to analyse the influence area of a bike station [16,24]. In parallel, a 600 m radius (Euclidean distance) has been suggested for the riding coverage that corresponds to a 5-min riding distance, considering that riding speed is double walking speed in the city. The third table, Table 4, includes the aspects related to the station itself.
For each table, assessment indicators and some metric examples are listed. The last three columns are new contributions which give information about (i) the relation to users’ perceptions, which means whether the indicator is considered to be objective (low perception dependence) or subjective (high perception dependence), (ii) whether the metric has a dissuasive effect on station usage, and (iii) its connection to safety or security, or both aspects. For example, when considering both pedestrians’ and cyclists’ perspectives, land topography, defined as the positive gradient of slope (upward), is considered to have low perception dependence because it can be assumed that nobody prefers going uphill since more physical effort is needed. Thus, it is considered to be a dissuasive item (“yes”) as users avoid hilly routes. In other words, there is a negative correlation between the so-defined land topography and pedestrians and cyclists’ preferences. Besides, this item is related to safety because a correlation between the indicator and the number of accidents could be considered. On the other hand, crowds is a subjective item (high perception dependence) because some people like to go around crowded areas, whereas other people do not. Thus, the dissuasive effect does not apply. It depends on individuals’ preferences, and, for the same reason, this item is related to security, the feeling of being more or less protected.
The three tables are the base of the methodology explained in the following section.

4. Bike Station Attractiveness Methodology

The attractiveness of a BSS station is a dimensionless measure of the influence a station has in attracting users to take or dock a shared bicycle. The proposed measure can be used when defining optimal BSS layout in order to refine some specific areas, or when a diagnostic evaluation of an existing BSS is conducted to improve its performance.
The following five steps describe the methodology that urban and transportation planners can easily follow in order to identify the most and least attractive bike stations, to understand which factors cause this ranking and obtain some insights on the best strategy to follow to reduce re-balancing costs and to maximise user satisfaction at a low cost.
Step 1: Area definition. Define the set of BSS stations under evaluation. The reasons for conducting this analysis could be to study a problematic area in depth before BSS implementation or to understand the uneven user behaviour observed in a specific BSS. The set of selected stations should belong to the same attraction area (e.g, shopping district or the surroundings of a station). That is, stations in areas with major demand differences should be analysed separately.
Step 2: Selection of assessment indicators. According to the characteristics of the area where the analysed bike stations are located, assessment indicators from Table 2, Table 3 and Table 4 are selected, along with the chosen metrics. Only distinguishing indicators are required. Depending on the metric, this can be considered as a quantitative measure or a categorical measure. If it is considered as a categorical measure, the scale should be defined, for instance, very low (0), low (1), medium (2) and high (3). A weight can be given to those items that are more important than others to the research. Furthermore, in this step it is important to identify whether the metric implies a positive relationship to the increased usage of the station (marked as “+”) or a negative relationship (marked as “−”). Whereas identifying this relationship for objective aspects is relatively straightforward, special attention should be paid to subjective indicators given that they will depend on geographical and cultural factors, making them case-specific. For this reason, this approach considers that the relationship can be either positive or negative, and thus the entire range will be studied. The same process is applied to the safety/security item, with the interval related to security ranging from positive to negative impact.
Step 3: Evaluation of indicators. Assign metric scores to each indicator for every bike station studied. The key aspect of this step is to rate the stations based on relative values instead of absolute values due to their application to specific areas. This means that the evaluation of each bike station is related to its neighbouring bike stations when a categorical indicator is assessed. The bike stations are compared and evaluated. For a given indicator, the best and the worst stations are identified and receive the highest and lowest score values. Then, the rest of the stations can be proportionally ranked using these two extremes as references. Absolute values can also be used, however, this is not necessary.
Step 4: Determination of total score for bike station attractiveness. To compare the stations, the total score accounting for bike station attractiveness is calculated. Assuming that a set of K stations is studied, the total score of k-th station, S k , can be computed as the weighted summation of the normalised individual scores received; that is,
S k = i = 1 I w i S k i i = 1 I w i , k = 1 K
where w i denotes the weight associated with each metric i. The weight selection is discussed in Section 4.1. Each normalised individual score, S k i , is computed according to
S k i = m k , i m 0 , i k = 1 K m k , i m 0 , i k = 1 K , i = 1 I
where the assigned relative score, m k , i , is normalised to guarantee that the smallest score is zero, and the summation of the scores for metric i is equal to 1. The variable m 0 , i denotes the worst value within the values given for the analysed metric i.
It is noted that the sum of all the scores for the bike station set is k = 1 K S k = 1 . That means that if none of the analysed stations are more attractive than the others, all of them will obtain a total attractiveness score of S k = 1 / K . A larger value of S k denotes that the station is more attractive than the others, at the expense of less attractive ones.
As indicated in Step 2, the metrics are either positively or negatively correlated to the increased usage of the station, or non determined, as in the case of subjective indicators. This information will be required to define the worst value of each indicator, m 0 , i . That is, when a positive correlation exists (e.g., the longer the ‘maximum walking distance without traffic interaction’ in the surroundings of a station, the more appealing the station will be), the worst value assigned to the set of stations will be m 0 , i = min { m 1 , i , m 2 , i , , m K , i } . In the case of a negative correlation, the worst value will be assigned according to m 0 , i = max { m 1 , i , m 2 , i , , m K , i } . An example of negative correlation is shown in the metric ‘average traffic density’, as larger values result in a reduction of bike station usage in the studied area.
When the effect of the indicator is subjective, three options are studied; that is, the existence of a positive correlation, a negative correlation and null correlation. In the last case, the stations will not score.
Based on how the metrics are grouped, bike stations can be compared from two different perspectives: (i) total score and the contribution to this score of walkability, bikeability and station-related factors, and (ii) total score and the contribution to this score of objective and subjective factors. In parallel, total scores in relation to safety and security can be computed.
Step 5: Analysis results. The bike stations are assessed according to the previous scores and compared. The analysis facilitates an understanding of the performance of the studied bike stations and provides recommendations on operational and practical improvements based on all the factors involved, especially those identified as critical factors.

4.1. Selection of Weights

Weight selection depends on the available data. If a diagnostic evaluation is conducted, the existing demand, that is, the station usage will probably be available. Thus, weights can be calibrated using this information. On the other hand, if the layout of a new BSS is refined within the design stage, demand will not be available. In this case, weights can be selected by either using weights calculated in other areas with similar characteristics (e.g., a similar type of city in the same region) or assuming balanced weights.
The estimation of weights based on known demand is conducted by minimising the error between the station attractiveness and its usage. When balanced weights are assumed, the three main contributors to the attractiveness, that is, walkability, cycleability and station-related factors are equally weighted. Furthermore, the factors included in each category are equally scored. In this way, there is not a clear preference for any factor, which can be seen as a controversial aspect. However, given the large number of factors considered, if there is one or several stations that are clearly more (or less) attractive when compared with the others, this should be observed even using balanced weights because the station(s) will systematically score higher (or lower) than the others.
The difference between choosing fitted or the balanced weights are presented in Section 5.

5. Examples of Application

In this section, the analysis of Dublin city BSS (Dublinbikes) illustrates the bike station attractiveness method, where some bike stations are substantially more attractive for BSS users than others in the vicinity, which exhibit poorer usage levels.
The performance of the Dublinbikes stations is analysed by [1]. To do so, they propose the turnover station ratio (TS) that reflects how many times the station capacity is used in a day. Based on the obtained ratio, they classify the stations as low, medium, normal or high TS, as shown in Figure 2. This provides a good picture of the performance of the BSS.
Step 1: Area definition. In this analysis, attention is paid to those stations that, despite being very close to each other, present very different TS and, therefore, unequal degrees of attractiveness from the perspective of users. The bike station attractiveness method is then applied to two sets of stations, which are shown in Area I (station numbers 7, 18, 24, 31, 60, 61 and 67) and in Area II (station numbers 2, 15, 16, 20, 40, 41 and 45) in Figure 2 and Figure 3.
Steps 2 and 3: Selection of assessment indicators and their evaluation. Tables presented in Appendix A provide the assessment indicators from Table 2 to Table 4, the chosen metrics, the scale when the metric is categorical, the considered weight and the metric relationship to increased usage of the station (marked as “+”) or a negative relationship (marked as “−”) as well as its related safety/security characteristics. Specifically, for categorical measures, scale A for preferences of pedestrians (Table A1) and bicyclists (Table A2) is defined: very low (0), low (1), medium (2) and high (3). Scale Y, yes (1) and no (0), is defined for the categorical measures of bike stations (Table A3). Balanced weight is considered, with a unit being given for each main indicator.
In this application case, land topography does not apply because it is not a distinguishing factor in the area considered (300 and 600 m radius). From the cyclist’s perspective, for the metrics ‘traffic interaction’ and ‘trouble spots’, two categorical metrics are considered: average traffic density at peak hours and the density of bus stops and tram lanes within a 600 m radius, respectively, using the same scale in both cases. When categorical metrics are applied, scores are given in a relative manner, identifying the best and worst stations, and scoring the intermediate stations proportionally because the aim is to compare the bike stations. Low perception dependency is related to objective factors, whereas high perception dependency is related to subjective factors, which imply different considerations according to individuals’ preferences. For instance, walk and cycle lane layouts have low perception dependence because it can be assumed that everyone prefers wide sidewalks and segregated cycle lanes. Moreover, these items are directly related to safety. However, place-related aspects are considered to have high perception dependency because routes with several points of interest are attractive for some users, however, for other users, they could be unpleasant due to crowds or noise. Following the same reasoning, positive and negative relationships to safety and security have been assessed.
The last columns of Table A1, Table A2, Table A3 indicate the assigned relative scores, m k , i , for each station and each metric, regarding neighbouring bike stations. Assigned scores are based on GIS data from open sources and on-site visits to the studied areas and their surroundings. The bike stations are compared and evaluated.
Step 4: Determination of total score for bike stations. The total score of each station is obtained by introducing the assigned relative scores, m k , i , of Table A1, Table A2, Table A3 into Equations (1) and (2).
In order to introduce the variability given by the subjective factors, positive, negative and null correlations are assumed for all the subjective metrics. Then, all the possible combinations have been considered through combinatorial simulations. In this way, the spectrum of potential subjective behaviours is reflected, resulting in a range of station attractiveness values rather than point estimates.
For both sets of stations, the obtained total scores are shown in boxplots. The results for the bike stations in group I (station numbers 7, 18, 24, 31, 60, 61 and 67) are shown in Figure 4, Figure 5 and Figure 6. Figure 7, Figure 8 and Figure 9 show the results for stations in group II (station numbers 2, 15, 16, 20, 40, 41 and 45). The figures are discussed in the next step.
To validate the proposed methodology, the total scores are compared with average weekly station turnover calculated as the ratio of the demand of each station and its capacity (see right axis and red circles in the figures). This average weekly demand considers the number of bikes docketed and taken at each station every 5 min, based on the data collected from 00.00 h, April 1st to 00.00 h, April 7th, 2019 (open source data from Smart Dublin website—https://data.smartdublin.ie/dataset/dublinbikes-api).
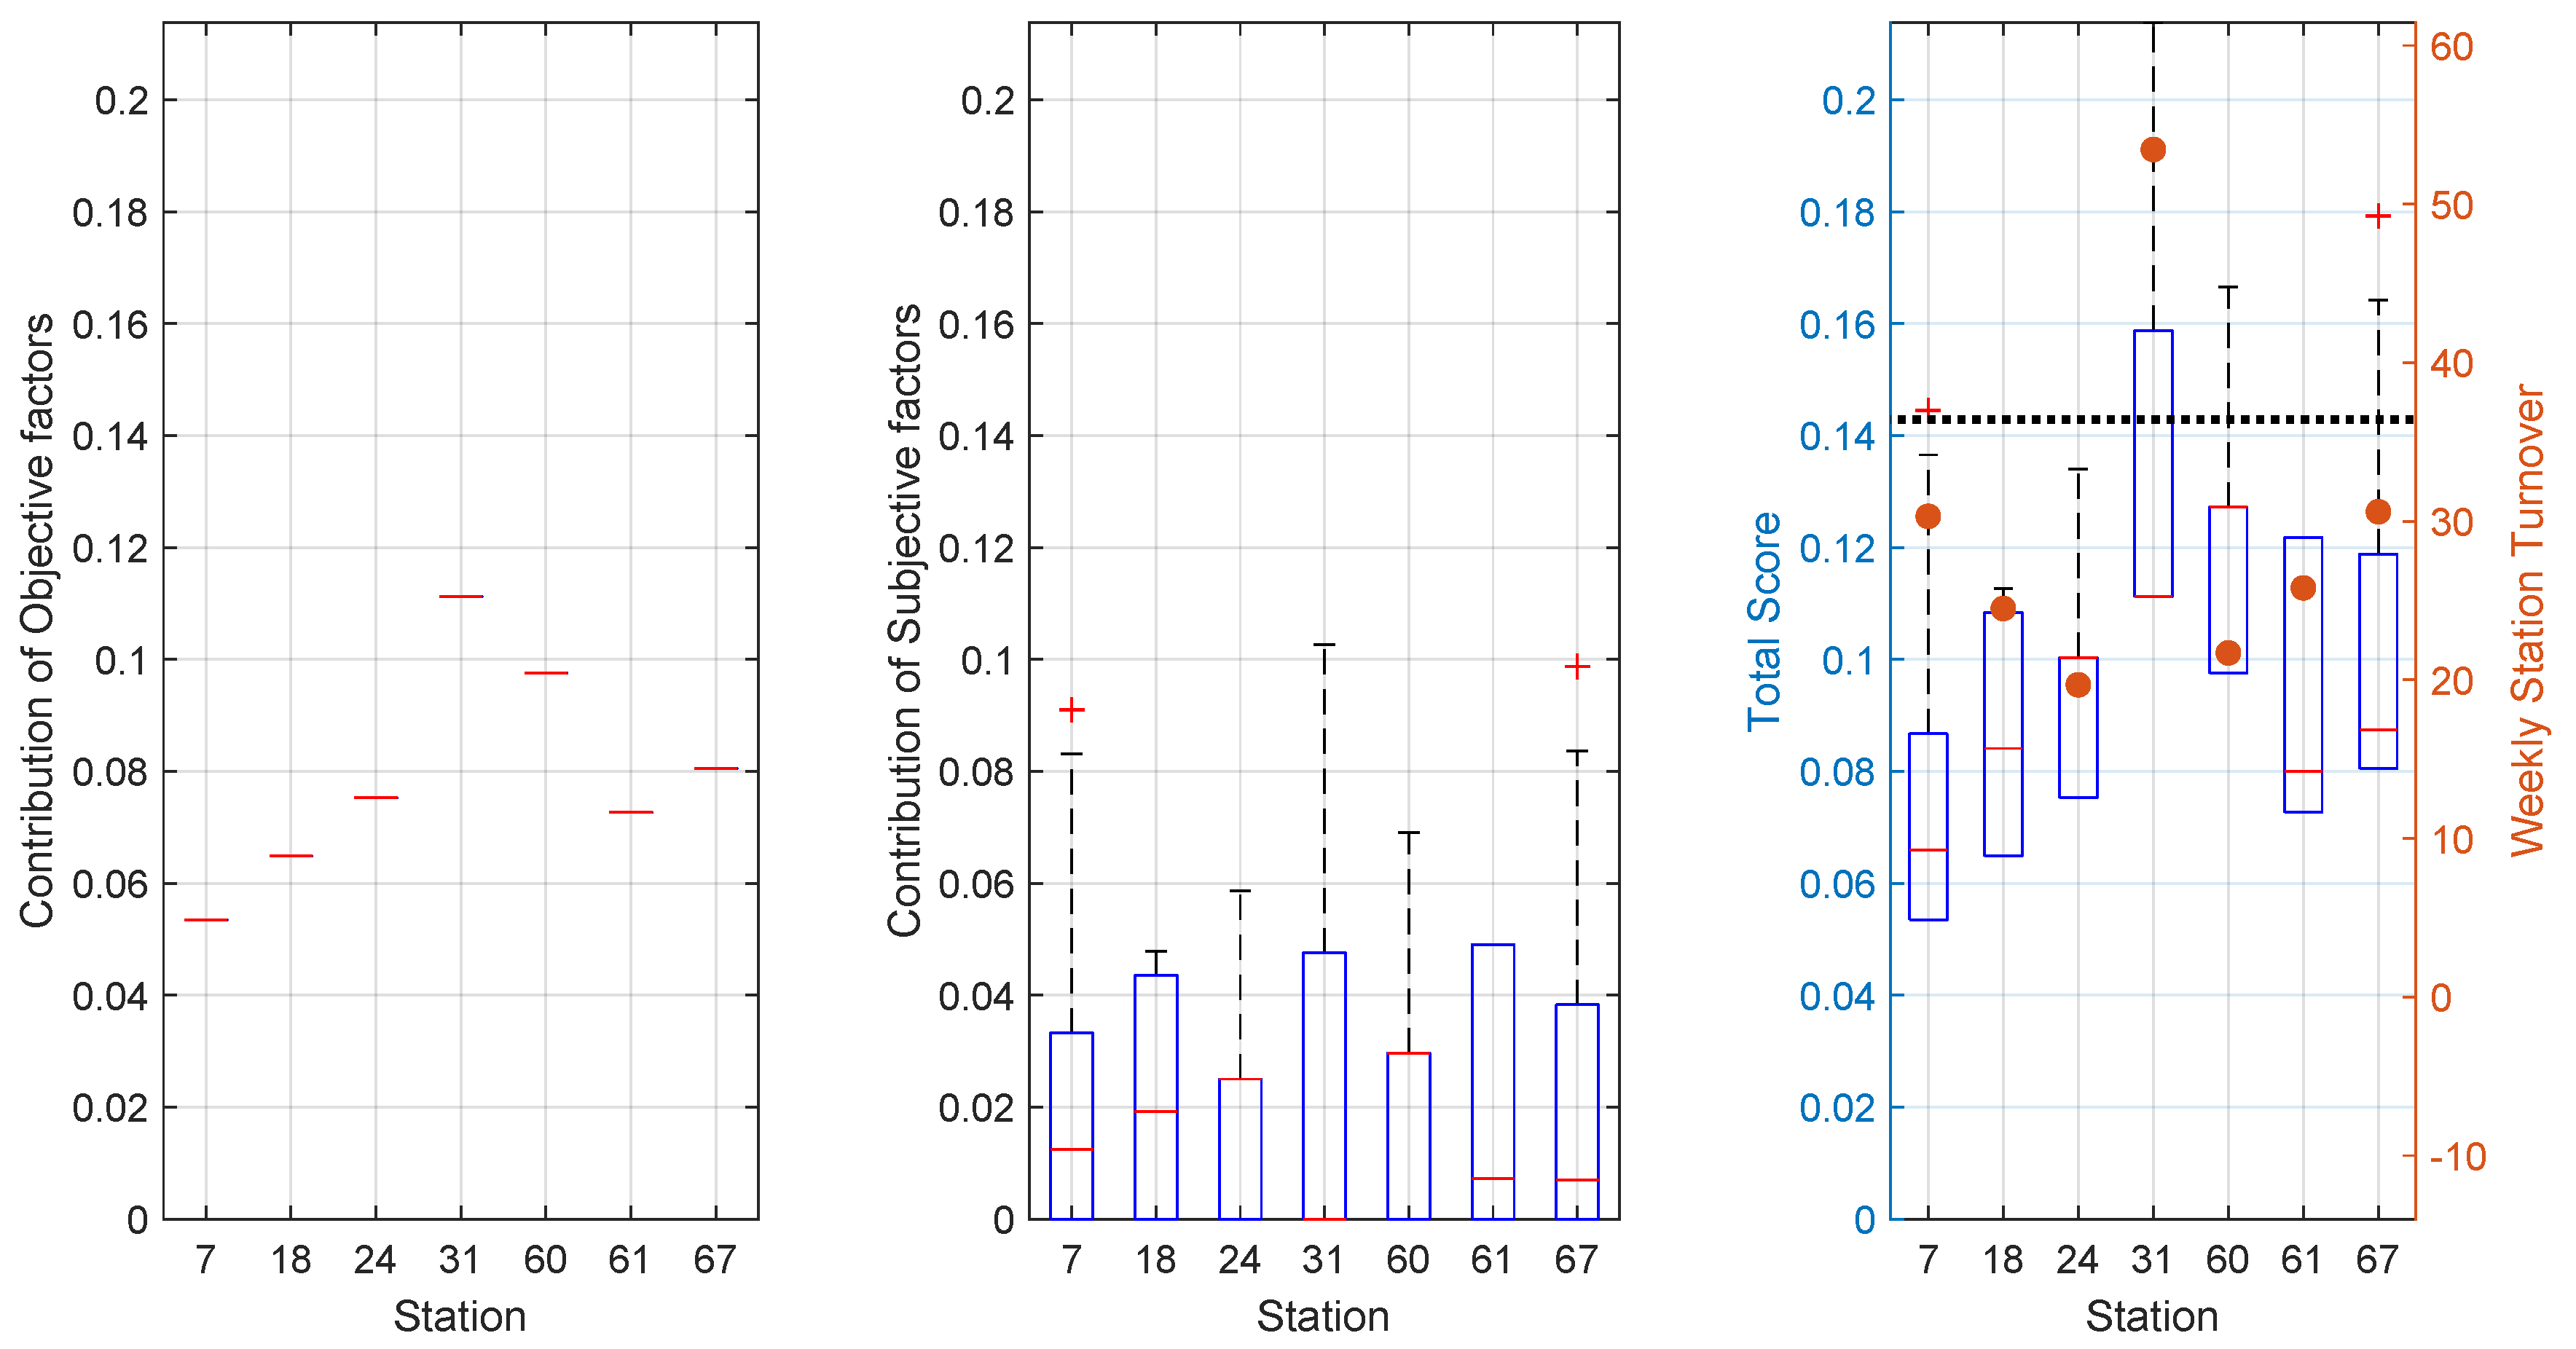
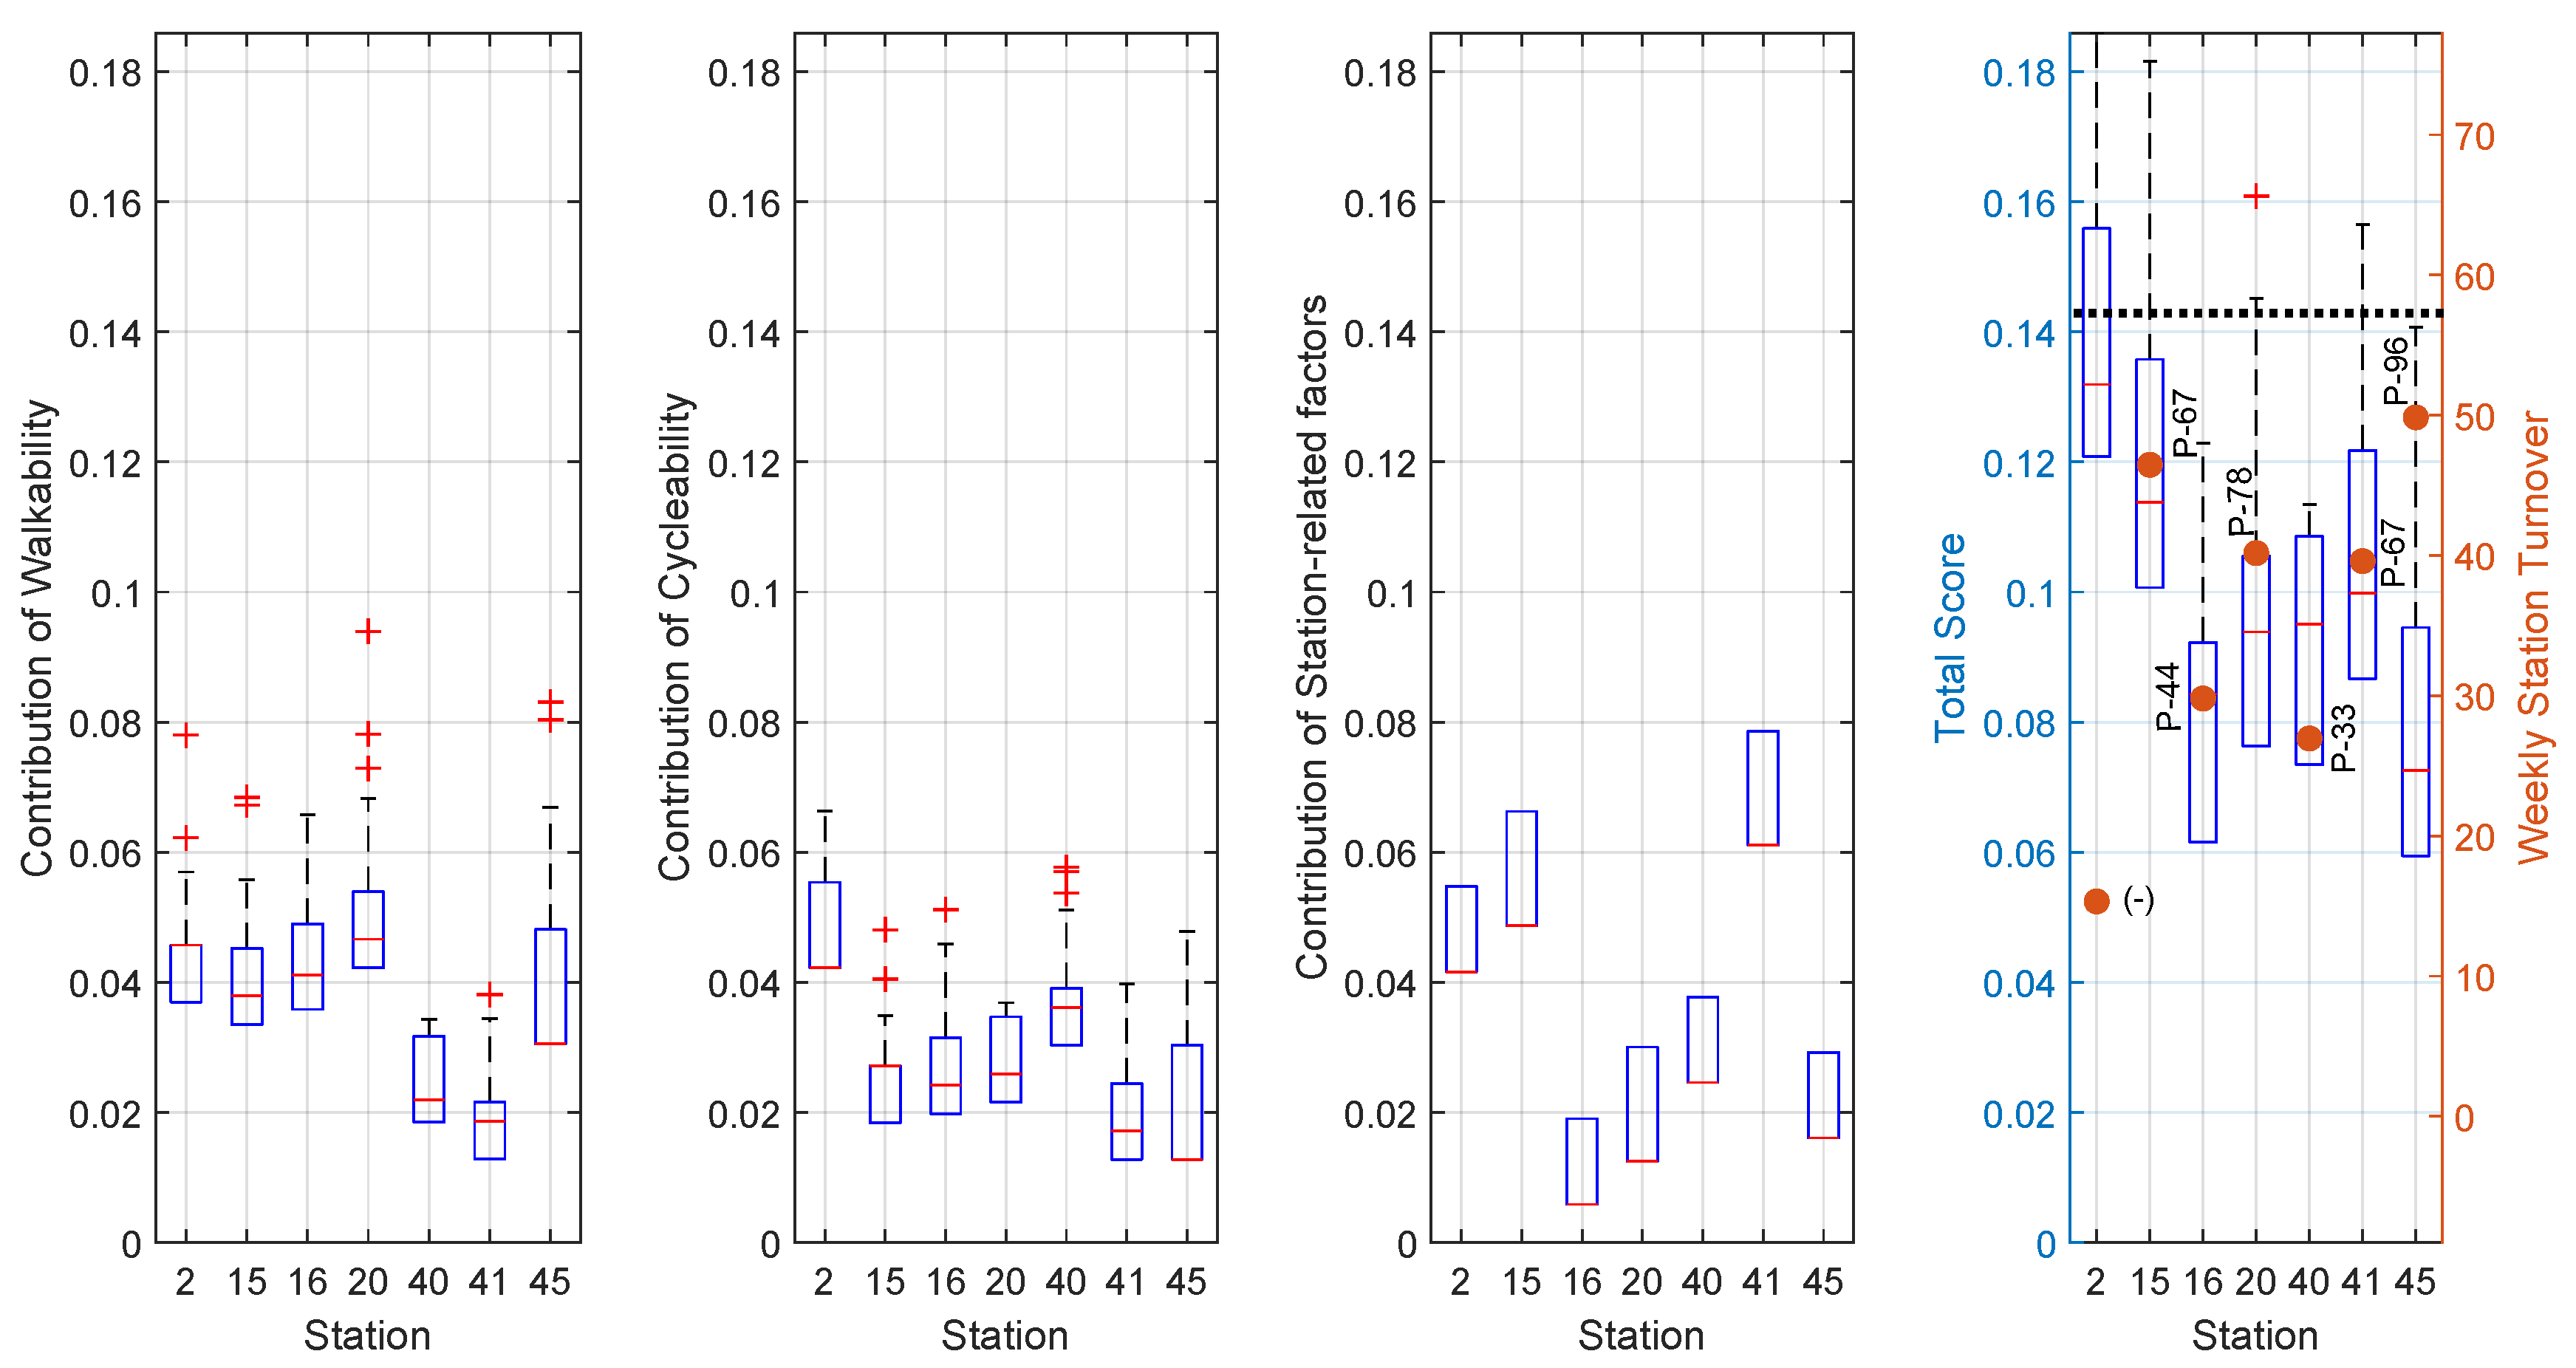
Step 5: Analysis results. The results of the attractiveness of the bike stations in group I (station numbers 7, 18, 24, 31, 60, 61 and 67) are shown in Figure 4, indicating the contribution of walkability, cycleability and station-related features, and in Figure 5, indicating the contribution of the objective and subjective factors to the total score. The observed station turnover ratios fall within the distributions (see last plot of Figure 4 and Figure 5). This is a good indicator of the methodology performance, although more studies should be conducted to establish a sufficient statistical correlation.
The most attractive station is Station 31. This is mainly due to the contribution of cycleability and station-related factors (see Figure 4). This station is also the most attractive when considering only objective factors (see Figure 5). If the stations were equally attractive, all of them would score 1 / 7 0.14 . Thus, Stations 18, 24 and 61 are below the average. There is not a clear set of indicators penalising the scores of these stations. From the interpretation of the results, their scores are due to the fact that these stations are close to stations that are simply more attractive. From pedestrians’ perceptions, Station 67 seems to be the most desirable, whereas for cyclists, Station 60 stands out above the rest.
Paying attention to the contribution of objective and subjective factors to the total attractiveness score (Figure 5), Stations 31 and 60 are the most attractive when considering objective factors, and Stations 31, 67 and 7 present the largest ranges of subjective factors. The scores obtained with the factors considered as subjective will depend on cultural and social aspects, differing among countries. Thus, determining the correlation between these factors and station usage based on observed data from other geographical areas can provide misleading results. Furthermore, age, gender and type of user (e.g., workers versus tourists) can result in different subjective scores because the correlation may change throughout the day and also the year. For this reason, it is important to consider objective and subjective factors separately, allowing for a better understanding of the aspects that affect BSS station attractiveness and levels of variability in the results.
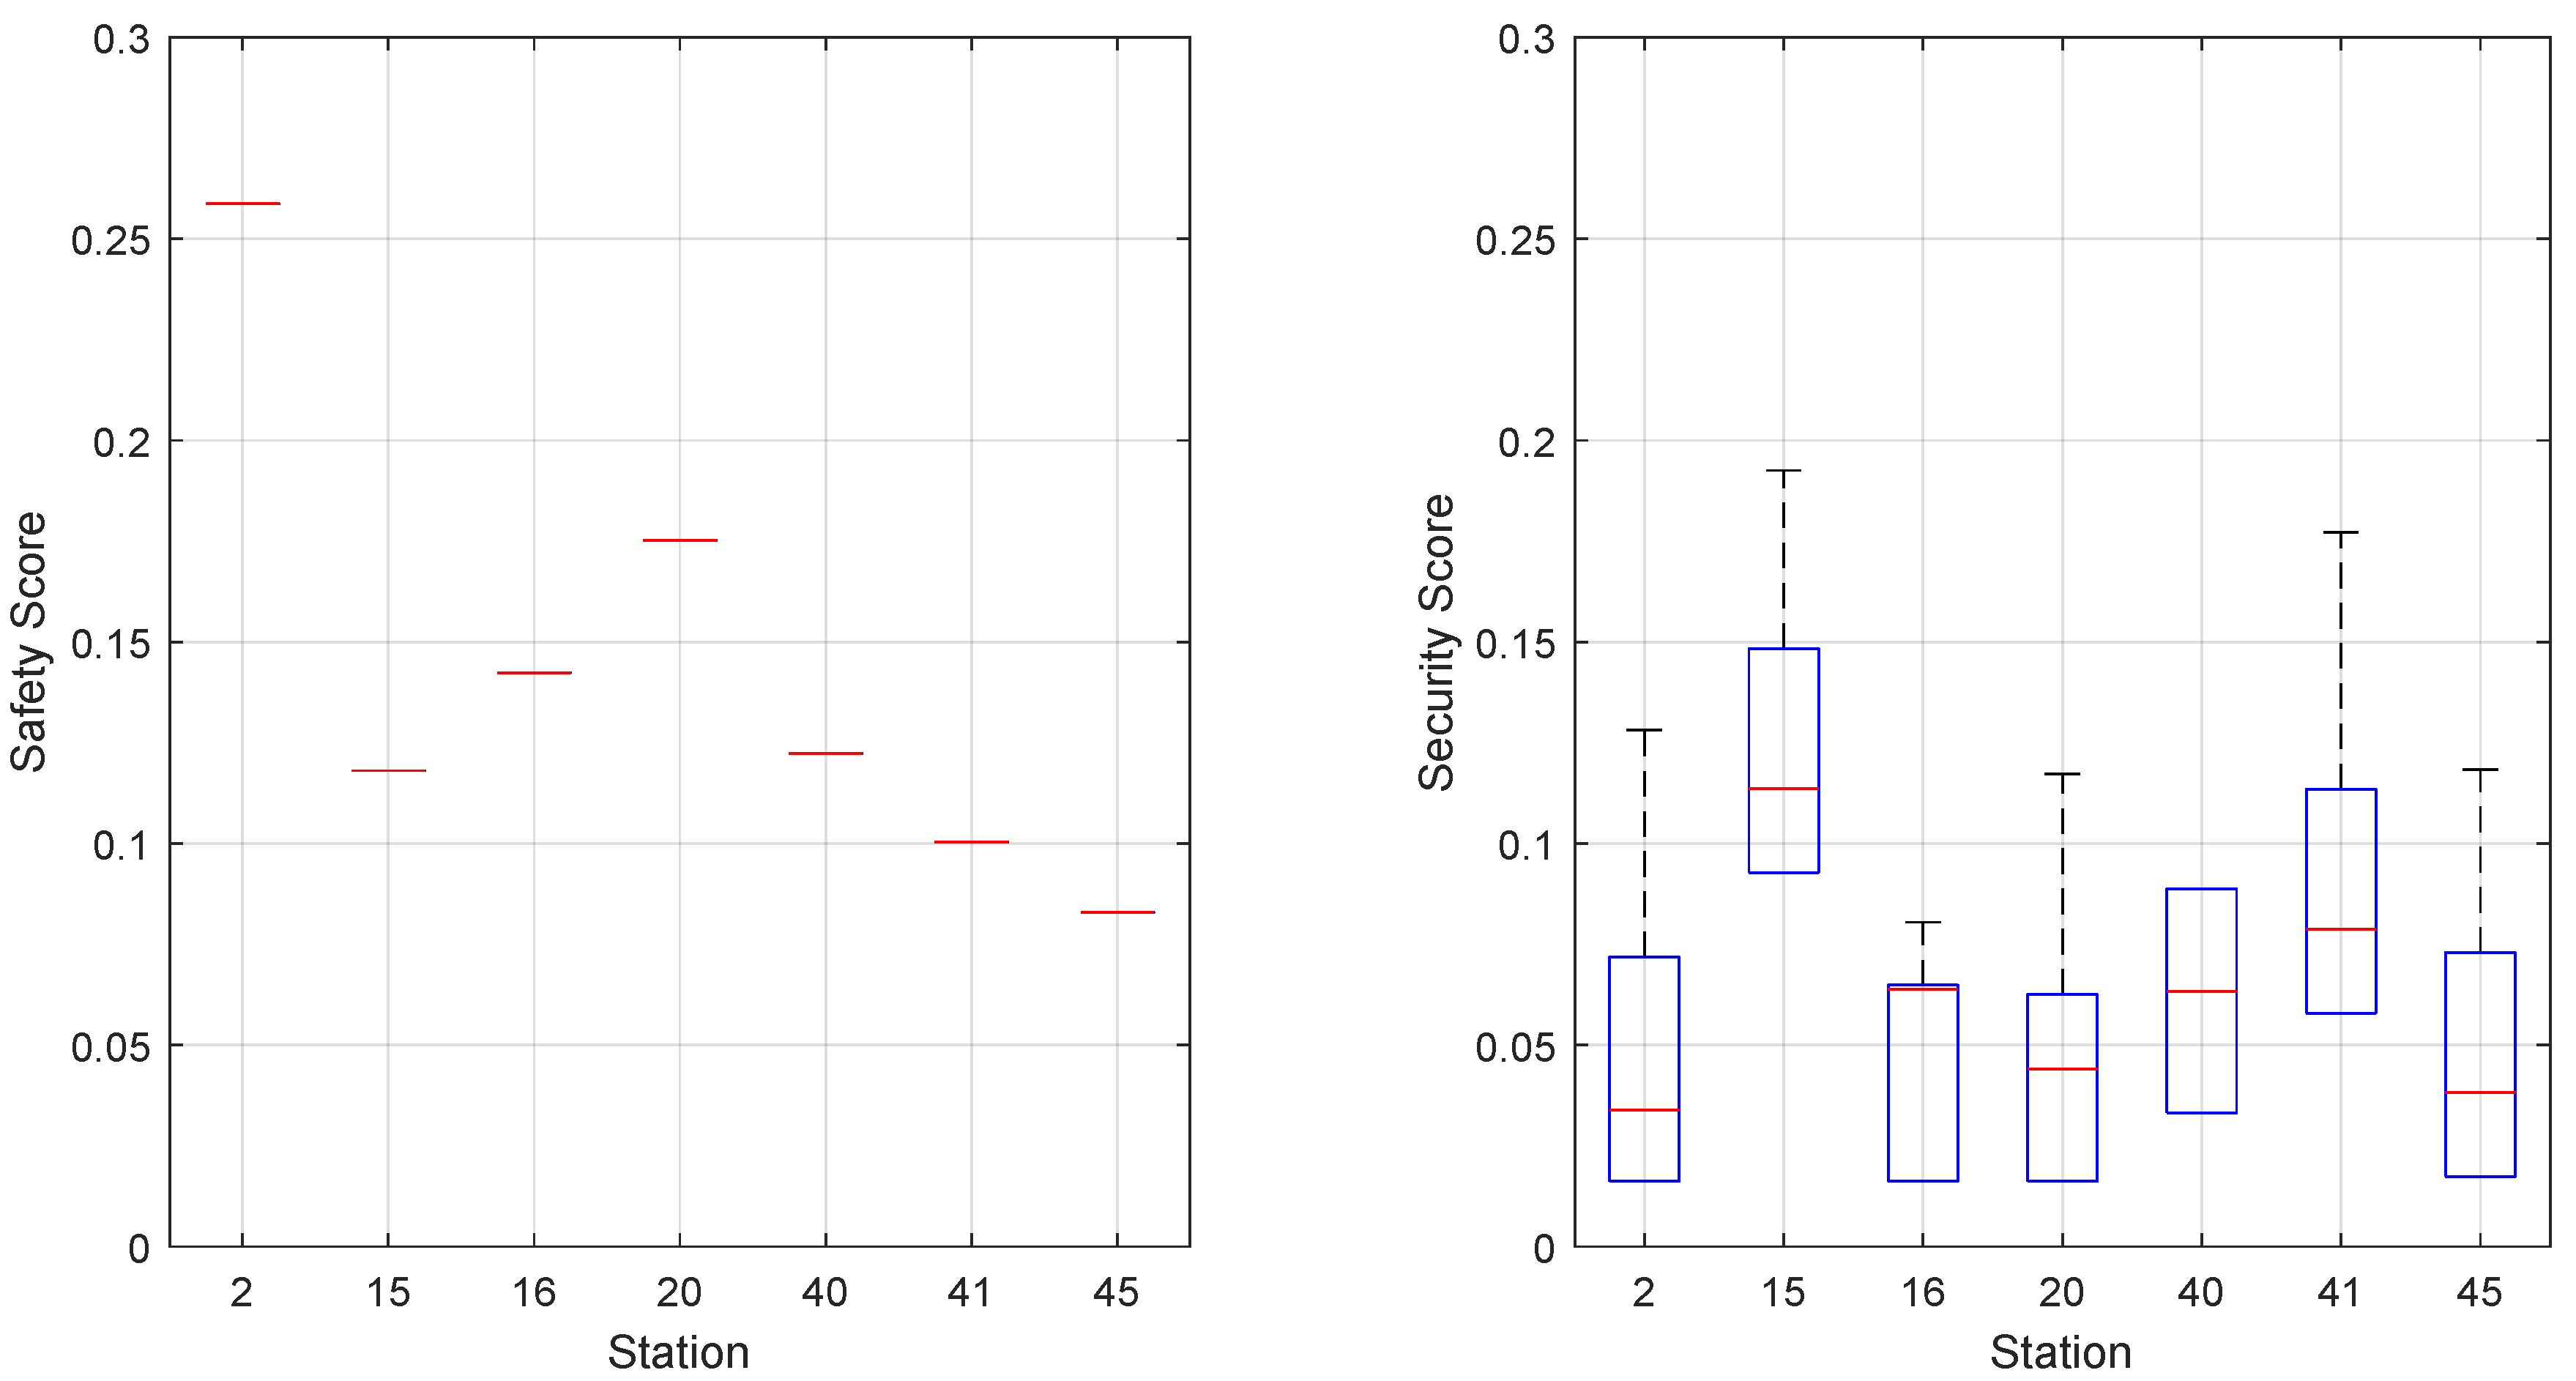
Figure 6 shows the ranking of the stations according to safety and security. The most attractive station (Station 31) is also considered to be the safest station, followed by Stations 60 and 67. From a security point of view, Station 18 exhibits the worst performance, maybe because it is the farthest from the centre of the city (see Figure 3a).
The results of the bike stations in group II (station numbers 2, 15, 16, 20, 40, 41 and 45) are shown in Figure 7, Figure 8 and Figure 9.
The total score of station attractiveness (last plot of Figure 7 and Figure 8) shows that most of the observed data fall into the range given by the box plots. The percentiles of the observed data with respect to the attractiveness distribution are given in the figures. Bike station number 2 is an exception to this with a higher attractiveness score than its neighbouring stations, but with fewer actual users than the other ones (for that reason, it is not possible to provide a percentile in Figure 7 for Station 2). This result suggests that Station 2 cannot be compared to the other stations because they belong to different influence areas. In other words, the assumption that demand is not a distinguishing factor is not valid here.
Disregarding the results of the outlying station, the following conclusions about the remaining stations are highlighted—the attraction scores of Stations 16, 40 and 45 are below average. In the case of Station 16, the lack of attractiveness is mainly due to station-related factors. For instance, there are no points of interest beside the station, and its capacity is the lowest, along with Station 45. This station also obtains the worst score in terms of security. In the case of Station 40, it is affected by the low contribution of walkability factors, mainly due to lower legibility of the urban space and the lack of amenities and points of interest in the surrounding area (see Figure 3b). This score has the lowest range of variability given by the subjective factors. In contrast, Station 20 obtains the best attractiveness score thanks to walkability factors, such as high legibility of the urban space and the walkway layout around the station (see Figure 3b). Interestingly, this station obtains the best score in terms of safety.
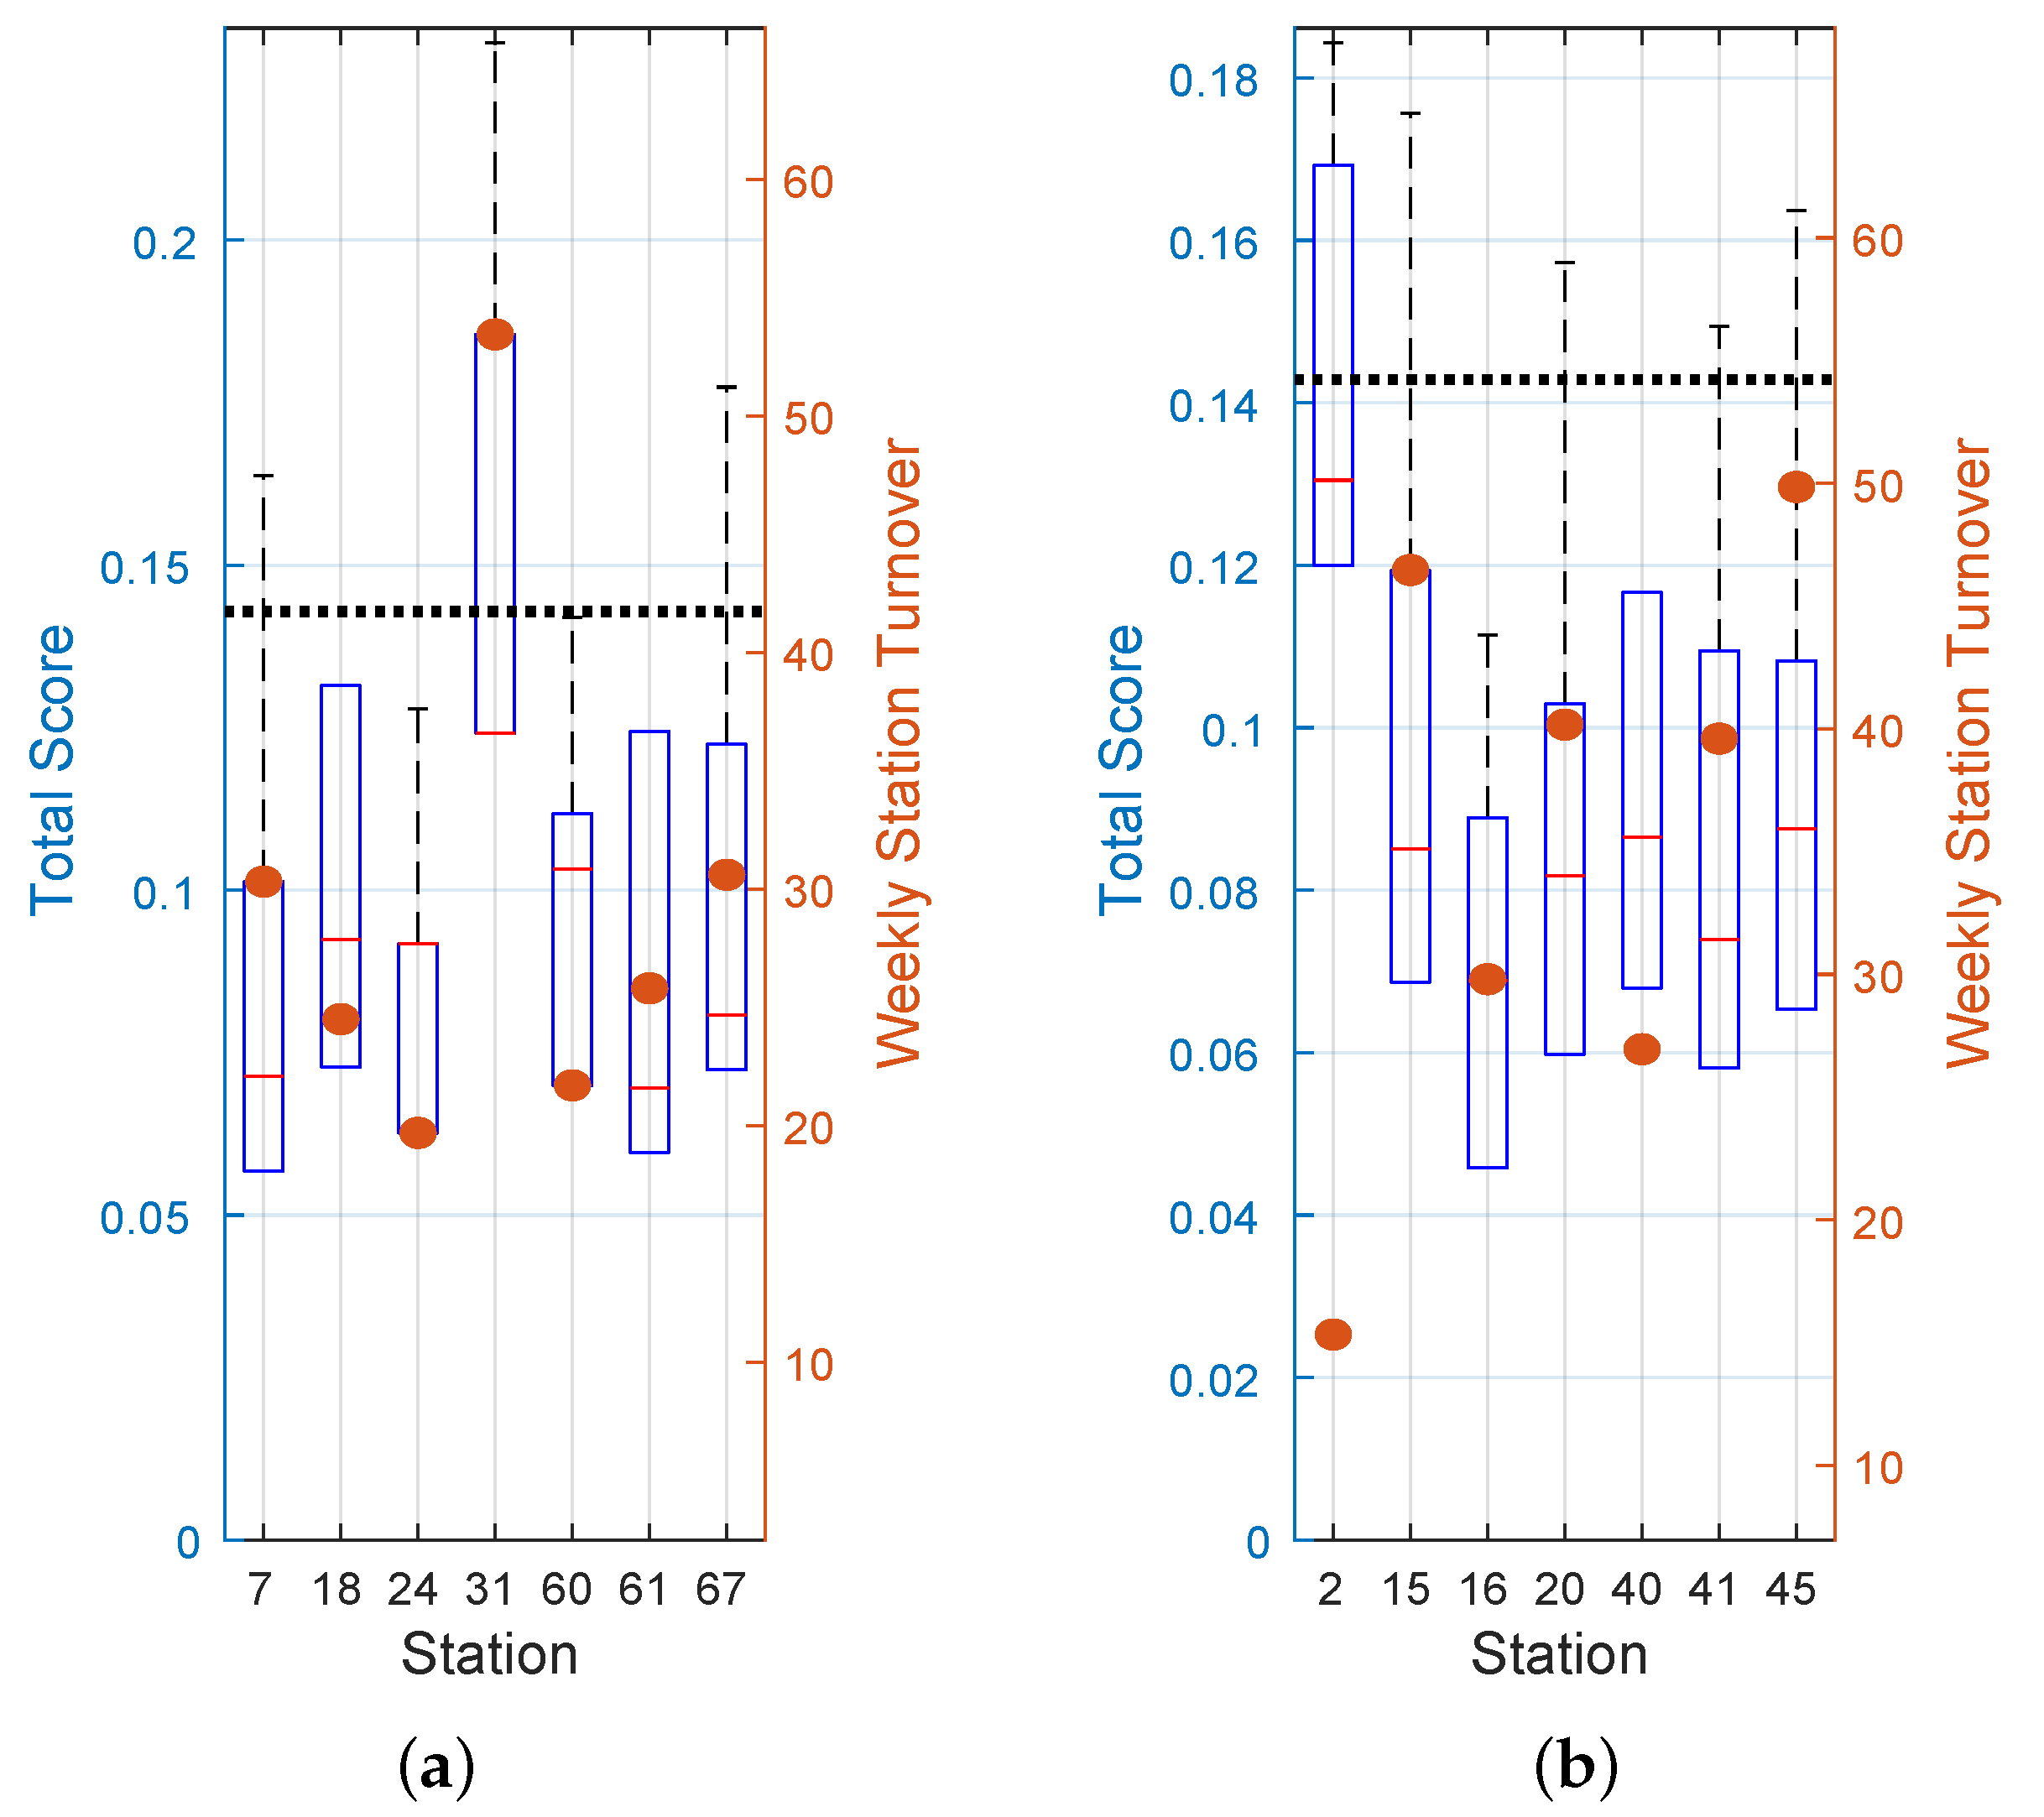
Figure 10 shows the results obtained when considering fitted weights as discussed in Section 4.1. In this case, the weights have been fitted using the average weekly station turnover calculated as the ratio of the demand of each station and its capacity (see Table 5). The conclusions derived from the analysis of Figure 10a do not change with respect to those obtained when analysing Figure 4, that is, Station 31 remains the most attractive station and Stations 18, 24 and 61 are below the average.
Figure 10b, consistently with Figure 7, shows again how bike station number 2 cannot be included in the analysis because it belongs to different influence areas. Therefore, the comparison among stations in Group II is not valid. This figure shows the importance of selecting a group of stations that share the same demand characteristics. If this assumption is not fulfilled, the results can be misleading.
The bike station attractiveness method gives an overview of a set of studied bike stations and helps to facilitate understanding of their strengths and weaknesses to guide future actions on BSSs. For example, provided that the attraction of a station which exhibits low interest from the cyclist’s point of view needs improving, actions aimed at reversing this weakness will serve to promote the use of the station (see, for instance, Stations 18 and 41), or, according to the obtained range of subjectivity and security, specific surveys could be useful to better understand how to optimise bike station operation.
The proposed method aims to approximate actual human behaviour, where decisions are based on a large number of factors (pros and cons). Despite the fact that some of the factors could be more important than others, considering a significant number of factors can result in a better representation of the real interest of a bike station rather than considering only a few of the supposedly most important ones.
Differentiating between objective and subjective features helps to identify those aspects that depend on geographical, social and cultural factors, making them case-specific. A survey campaign to determine BSS users’ preferences would complete this methodology and would help to reduce the variability of the subjective factors.

6. Conclusions

Bike-sharing schemes provide a low-carbon solution for city mobility. From the sustainability point of view, emissions caused by bike re-balancing are considered a major issue of BSSs, because trucks have to drive through the city redistributing bikes to guarantee that bikes and docks are always available. Therefore, re-balancing efforts are highly dependant on the adequate design of the BSS layouts.
BSS station attractiveness is understood as the set of physical, environmental and service-related features of a bike station that make it more appealing for BSS users than nearby stations. Special attention is paid to differentiating objective from subjective features and their relationships to safety and security aspects. This classification becomes important when defining attractiveness because subjective aspects can change from one geographical location to another, making the findings related to subjective aspects difficult to apply to other regions.
A bike station attractiveness method is developed to measure the attractiveness of bike stations considering walkability, bikeability and characteristics of the station itself. The existing literature addresses these topics partially or independently, while this work unites them by means of a non data-extensive methodology. The bike stations are compared and evaluated through relative values instead of absolute values due to their application to specific areas. This means that the assessment of each bike station is related to its neighboring stations. The proposed method is applied to the Dublin bike sharing scheme, Dublinbikes, with good performance results. It is noted that the attractiveness score cannot be taken as a proxy for the user demand, as the first will provide only a picture of the user’s preferences when compared with the nearby stations.
The bike station attractiveness method arises as an interesting tool to refine a new BSS layout that has been defined, based on broader aspects such as attraction areas and the distance between stations. It can also be used as a diagnostic tool to improve the performance of existing BSS in some specific areas. The optimal result when comparing a group of stations is when all of them have similar attractiveness. In this way, no station eclipses the others. Thus, the designer should act over the so-identified least attractive stations to increase their use. For instance, by removing street barriers for pedestrians or adding segregated lanes for cyclists if they do not exist. The results will also help to determine the best places to locate stations from a user’s perspective. This tool would allow urban and transportation planners to reduce re-balancing costs and to maximise user satisfaction at a low cost, which have a direct impact on improving urban sustainability.
In relation to future research, it would be interesting to complete the method with a campaign of surveys given to BSS users and stakeholders in order to better understand the impact of subjective features. Moreover, the application to other areas and other BSSs would allow for a comparative study of how the methodology works and how to better adjust metrics and weights, among other features not yet considered, such as the impact of the co-existence of dockless bike sharing systems.

Author Contributions

Both two authors have contributed in an equal manner to the study conception and paper development, being involved in all the phases such as material preparation, data collection, analysis and drafting of the manuscript. All authors have read and agreed to the published version of the manuscript.

Funding

The authors acknowledge Erasmus+ programme, specifically the Staff Mobility for Training (STT-2019/2020) for partial support of this work.

Acknowledgments

Authors would like to thank the two anonymous reviewers whose comments and suggestions helped improve and clarify this manuscript.

Conflicts of Interest

The authors declare no conflict of interest.

Appendix A

Table A1. Assessment indicators, metrics, weights and relative scores studying the attractiveness of two sets of stations in the Dublinbikes scheme. Related to pedestrians. Scale A: very low (0)/low (1)/medium (2)/high (3). Scale N: natural number.
Pedestrians: Walking Coverage Within a 300 m RadiusGroup I, m k , i Group II, m k , i
IndicatorMetricNot ApplyQuantitativeCategoriesWeightScalePer.Dep.Saf./Sec.71824316061672151620404145
Land topographyPercent grade along pathwayX 0 00000000000000
CrowdsPersons per area X1AHigh (+/−)Sec. (+/−)21331130310223
Traffic interaction and trouble spotsMaximum walking distance without traffic interaction within a 300 m radius X 1NLow (+)Saf. (+)358292297246236272340550580430375420287590
Walkway layoutDensity of streets with sidewalks with an obstacle-clear width >2 m within a 300 m radius X1ALow (+)Saf. (+)21322332223211
Environmental conditionsDensity of trees and green areas within a 300 m radius X1ALow (+)Sec. (+/−)01101112122123
Street connectivity and legibility of the urban spaceDisruptive capacity of the major barriers (i.e., rivers) within a 300 m radius X1/2AHigh (+/−)Sec.(−)32110013033132
Maximum distance of non-interrupted visual line to the station, with a maximum value of 300 m X 1/2NHigh (+/−)Sec. (+)30014523065177226300300280300300270300120
AmenitiesDensity of resting areas, benches and fountains within a 300 m radius X1AHigh (+/−)Saf. (+) Sec. (+/−)21232132123003
Weather protectionDensity of protections against rain within a 300 m radius X1ALow (+)Saf. (+)00000002333110
Place-related aspectsDensity of points of interest within a 300 m radius X1AHigh (+/−)Sec. (+/−)21131031202013
Table A2. Assessment indicators, metrics, weights and relative scores studying the attractiveness of two sets of stations in the Dublinbikes scheme. Related to bicyclists. Scale A: very low (0)/low (1)/medium (2)/high (3). Scale N: natural number.
Bicyclist: Riding Coverage Within a 600 m RadiusGroup I, m k , i Group II, m k , i
IndicatorMetricNot ApplyQuantitativeCategoriesWeightScalePer.Dep.Saf./Sec.71824316061672151620404145
Land topographyPercent grade along cycle route (uphill)X 0 00000000000000
Traffic interaction and trouble spotsAverage traffic density at peak hour X1/2ALow (−)Saf. (−)31333311321233
Density of bus stops and tram lane within a 600 m radius X1/2ALow (−)Saf. (−)33232120221033
Pedestrian interactionDaily number of pedestrians across a cycle lane sectionX 0 00000000000000
Cycle-lane layoutDensity of disaggregated cycle lanes within a 600 m radius X1ALow (+)Saf. (+)22203131111111
Environmental conditionsDensity of trees and green areas within a 600 m radius X1ALow (+)Sec. (+/−)00112112310211
Street connectivity and legibility of the urban spaceDisruptive capacity of the major barriers (i.e., rivers) within a 600 m radius X1/2AHigh (+/−)Sec. (−)22110012022121
Maximum distance of non-interrupted visual line to the station, with a maximum value of 600 m X 1/2NHigh (+/−)Sec. (+)45014523065177226352600280600600270600120
AmenitiesDensity of resting areas, benches and fountains within a 600 m radius X1AHigh (+/−)Saf. (+) Sec. (+/−)22133123221310
Weather protectionDensity of protections against rain within a 600 m radius X1ALow (+)Saf. (+)00011002011111
Place-related aspectsDensity of points of interests within a 600 m radius X1AHigh (+/−)Sec. (+/−)21133120120123
Table A3. Assessment indicators, metrics, weights and relative scores studying the attractiveness of two sets of stations in the Dublinbikes scheme. Related to bike stations. Scale N: natural number. Scale Y: yes (1)/no (0).
Bike StationGroup I, m k , i Group II, m k , i
IndicatorMetricNot ApplyQuantitativeCategoriesWeightScalePer.Dep.Saf./Sec.71824316061672151620404145
Level of serviceCapacity of the station X 1NLow (+)N.A.2920291620302029302029392920
Relation to nearby stationsDistance to the closest bike stations X 1/3NLow (−)N.A.262306192226260195243195220215195190265260
Number of stations within a 600 m radius X 1/3NLow (+)N.A.121181314713710767612
Number of docks within a 600 m radius X 1/3NLow (+)N.A.284290196355406166353202289206167193163353
BSS-related facilitiesExistence of information panels, screens, contact telephone, etc. X1YLow (+)Sec. (+)11111111111111
Environmental conditionsExistence of lamps lighting the station X1YLow (+)Saf. (+)11111111111111
AmenitiesExistence of benches X1YLow (+)Saf. (+) Sec. (+/−)00010001000010
Weather protectionExistence of shelters at the station X1YLow (+)Sec. (+)00000000100010
Place-related aspectsNumber of points of interest beside the station X1YHigh (+/−)Sec. (+/−)10110010101010

References

  1. Jiménez, P.; Nogal, M.; Caulfield, B.; Pilla, F. Perceptually important points of mobility patterns to characterise bike sharing systems: The Dublin case. J. Transp. Geogr. 2016, 54, 228–239. [Google Scholar] [CrossRef]
  2. Kabra, A.; Belavina, E.; Girotra, K. Bike-share systems: Accessibility and availability. Chic. Booth Res. Pap. 2018. [Google Scholar] [CrossRef] [Green Version]
  3. Sorton, A.; Walsh, T. Bicycle stress level as a tool to evaluate urban and suburban bicycle compatibility. In Transportation Research Record 1438, TRB; National Research Council: Washington, DC, USA, 1994; Corpus ID: 108037636; Available online: https://www.semanticscholar.org/paper/BICYCLE-STRESS-LEVEL-AS-A-TOOL-TO-EVALUATE-URBAN-Sorton-Walsh/0642bc77ce95b8f030df49b2af9280794fbd05df?p2df (accessed on 30 October 2020).
  4. Kirner-Providelo, J.; Penha-Sanches, S. Roadway and traffic characteristics for bicycling. Transportation 2011, 38, 765. [Google Scholar] [CrossRef]
  5. Winters, M.; Davidson, G.; Kao, D.; Teschke, K. Motivators and deterrents of bicycling: Comparing influences on decisions to ride. Transportation 2011, 38, 153–168. [Google Scholar] [CrossRef]
  6. Apasnore, P.; Ismail, K.; Kassim, A. Bicycle-vehicle interactions at mid-sections of mixed traffic streets: Examining passing distance and bicycle comfort perception. Accid. Anal. Prev. 2017, 106, 141–148. [Google Scholar] [CrossRef]
  7. Harkey, D.; Reinfurt, D.; Knuiman, M.; Stewart, J.R.; Sorton, A. Development of the Bicycle Compatibility Index: A Level of Service Concept, Final Report; Federal Highway Administration: Washington, DC, USA, 1998. [Google Scholar]
  8. Arentze, T.A.; Molin, E.J. Travelers’ preferences in multimodal networks: Design and results of a comprehensive series of choice experiments. Transp. Res. Part A Policy Pract. 2013, 58, 15–28. [Google Scholar] [CrossRef]
  9. Koh, P.; Wong, Y. Influence of infrastructural compatibility factors on walking and cycling route choices. J. Environ. Psychol. 2013, 36, 202–213. [Google Scholar] [CrossRef]
  10. Qin, H.; Gao, J.; Kluger, R.; Wu, Y.J. Effects of perception on public bike-and-ride: A survey under complex, multifactor mode-choice scenarios. Transp. Res. Part Traffic Psychol. Behav. 2018, 54, 264–275. [Google Scholar] [CrossRef]
  11. Moura, F.; Cambra, P.; Gonçalves, A. IAAPE-Pedestrian Accessibility and Attractiveness Assessment Tool When Planning for Walkability. Corpus ID: 14347951. Available online: https://www.semanticscholar.org/paper/IAAPE-Pedestrian-accessibility-and-attractiveness-Moura-Cambra/4c13800009829143e19844c1ea039c820b0a0dce (accessed on 30 October 2020).
  12. Gehrke, S.R. A Review of Walkability Measures and the Proposal of a Standardized Classification Scheme. In Proceedings of the Transportation Research Board 91st Annual Meeting, Washington, DC, USA, 22–26 January 2012. [Google Scholar]
  13. Oswald, B.; Michelle, R.; Phillips, B. Prioritizing pedestrian corridors using walkability performance metrics and decision analysis. J. Urban Plan. Dev. 2015, 142, 04015009. [Google Scholar] [CrossRef]
  14. Moura, F.; Cambra, P.; Gonçalves, A.B. Measuring walkability for distinct pedestrian groups with a participatory assessment method: A case study in Lisbon. Landsc. Urban Plan. 2017, 157, 282–296. [Google Scholar] [CrossRef]
  15. Cambra, P.; Moura, F.; Goncalves, A. On The Correlation of Pedestrian Flows To Urban Environment Measures: A Space Syntax and Walkability Analysis comparison case. In Proceedings of the 11th Space Syntax Symposium, Lisbon, Portugal, 3–7 July 2017; pp. 1–21. [Google Scholar]
  16. Faghih-Imani, A.; Eluru, N. Analysing bicycle-sharing system user destination choice preferences: Chicago’s Divvy system. J. Transp. Geogr. 2015, 44, 53–64. [Google Scholar] [CrossRef]
  17. Liu, J.; Li, Q.; Qu, M.; Chen, W.; Yang, J.; Xiong, H.; Zhong, H.; Fu, Y. Station site optimization in bike sharing systems. In Proceedings of the 2015 IEEE International Conference on Data Mining, Atlantic City, NJ, USA, 14–17 November 2015; pp. 883–888. [Google Scholar]
  18. Frade, I.; Ribeiro, A. Bicycle sharing systems demand. Procedia Soc. Behav. Sci. 2014, 111, 518–527. [Google Scholar] [CrossRef] [Green Version]
  19. Landis, B.W. Bicycle Interaction Hazard Score: A Theoretical Model; Transportation Research Board: Washington, DC, USA, 1994. [Google Scholar]
  20. Li, Z.; Wang, W.; Liu, P.; Ragland, D. Physical environments influencing bicyclists’ perception of comfort on separated and on-street bicycle facilities. Transp. Res. Part D Transp. Environ. 2012, 17, 256–261. [Google Scholar] [CrossRef]
  21. Frade, I.; Ribeiro, A. Bike-sharing stations: A maximal covering location approach. Transp. Res. Part A Policy Pract. 2015, 82, 216–227. [Google Scholar] [CrossRef]
  22. Krenn, P.J.; Oja, P.; Titze, S. Development of a bikeability index to assess the bicycle-friendliness of urban environments. Open J. Civ. Eng. 2015, 5, 451. [Google Scholar] [CrossRef] [Green Version]
  23. Oswald Beiler, M.; McGoff, R.; McLaughlin, S. Trail network accessibility: Analyzing collector pathways to support pedestrian and cycling mobility. J. Urban Plan. Dev. 2017, 143, 04016024. [Google Scholar] [CrossRef]
  24. Zhang, Y.; Thomas, T.; Brussel, M.; Van Maarseveen, M. Exploring the impact of built environment factors on the use of public bikes at bike stations: Case study in Zhongshan, China. J. Transp. Geogr. 2017, 58, 59–70. [Google Scholar] [CrossRef]
  25. Cooper, C.H. Using spatial network analysis to model pedal cycle flows, risk and mode choice. J. Transp. Geogr. 2017, 58, 157–165. [Google Scholar] [CrossRef]
  26. Manum, B.; Nordström, T.; Gil, J.; Nilsson, L.; Marcus, L. Modelling Bikeability. In Proceedings of the 11th International Space Syntax Symposium, Lisbon, Portugal, 3–7 July 2017; pp. 89.1–89.16. [Google Scholar]
  27. De Chardon, C.M.; Caruso, G.; Thomas, I. Bicycle sharing system ‘success’ determinants. Transp. Res. Part A Policy Pract. 2017, 100, 202–214. [Google Scholar] [CrossRef]
  28. Mattson, J.; Godavarthy, R. Bike share in Fargo, North Dakota: Keys to success and factors affecting ridership. Sustain. Cities Soc. 2017, 34, 174–182. [Google Scholar] [CrossRef]
  29. Cooper, C.H. Predictive spatial network analysis for high-resolution transport modeling, applied to cyclist flows, mode choice, and targeting investment. Int. J. Sustain. Transp. 2018, 12, 714–724. [Google Scholar] [CrossRef] [Green Version]
  30. Sun, F.; Chen, P.; Jiao, J. Promoting public bike-sharing: A lesson from the unsuccessful Pronto system. Transp. Res. Part Transp. Environ. 2018, 63, 533–547. [Google Scholar] [CrossRef]
  31. Feng, S.; Chen, H.; Du, C.; Li, J.; Jing, N. A hierarchical demand prediction method with station clustering for bike sharing system. In Proceedings of the 2018 IEEE Third International Conference on Data Science in Cyberspace (DSC), Guangzhou, China, 18–21 June 2018; pp. 829–836. [Google Scholar]
  32. Nielsen, T.A.S.; Skov-Petersen, H. Bikeability–Urban structures supporting cycling. Effects of local, urban and regional scale urban form factors on cycling from home and workplace locations in Denmark. J. Transp. Geogr. 2018, 69, 36–44. [Google Scholar] [CrossRef]
  33. Gu, P.; Han, Z.; Cao, Z.; Chen, Y.; Jiang, Y. Using open source data to measure street walkability and bikeability in China: A case of four cities. Transp. Res. Rec. 2018, 2672, 63–75. [Google Scholar] [CrossRef]
  34. Lin, J.J.; Wei, Y.H. Assessing area-wide bikeability: A grey analytic network process. Transp. Res. Part A Policy Pract. 2018, 113, 381–396. [Google Scholar] [CrossRef]
  35. Abolhassani, L.; Afghari, A.P.; Borzadaran, H.M. Public preferences towards bicycle sharing system in developing countries: The case of Mashhad, Iran. Sustain. Cities Soc. 2019, 44, 763–773. [Google Scholar] [CrossRef]
  36. Affonso, R.; Couffin, F. Aggregated Indicator for Assessing Station Criticality of Bike Sharing Systems. In Proceedings of the 2019 International Conference on Industrial Engineering and Systems Management (IESM), Shanghai, China, 25–27 September 2019; pp. 1–6. [Google Scholar]
  37. Loidl, M.; Witzmann-Müller, U.; Zagel, B. A spatial framework for Planning station-based bike sharing systems. Eur. Transp. Res. Rev. 2019, 11, 9. [Google Scholar] [CrossRef]
  38. Yuan, M.; Zhang, Q.; Wang, B.; Liang, Y.; Zhang, H. A mixed integer linear programming model for optimal planning of bicycle sharing systems: A case study in Beijing. Sustain. Cities Soc. 2019, 47, 101515. [Google Scholar] [CrossRef]
  39. Hamidi, Z.; Camporeale, R.; Caggiani, L. Inequalities in access to bike-and-ride opportunities: Findings for the city of Malmö. Transp. Res. Part Policy Pract. 2019, 130, 673–688. [Google Scholar] [CrossRef]
  40. Grigore, E.; Garrick, N.; Fuhrer, R.; Axhausen, I.K.W. Bikeability in Basel. Transp. Res. Rec. 2019, 2673, 607–617. [Google Scholar] [CrossRef]
  41. Porter, A.K.; Kohl, H.W., III; Pérez, A.; Reininger, B.; Pettee Gabriel, K.; Salvo, D. Bikeability: Assessing the Objectively Measured Environment in Relation to Recreation and Transportation Bicycling. Environ. Behav. 2020, 52, 861–894. [Google Scholar] [CrossRef]
  42. Kamel, M.B.; Sayed, T.; Bigazzi, A. A composite zonal index for biking attractiveness and safety. Accid. Anal. Prev. 2020, 137, 105439. [Google Scholar] [CrossRef] [PubMed]
  43. Nogal, M.; Morales Napoles, O.; O’Connor, A. Structured expert judgment to understand the intrinsic vulnerability of traffic networks. Transp. Res. Part A Policy Pract. 2019, 127, 136–152. [Google Scholar] [CrossRef]
Figure 1. Assessment factors of cycle lanes.
Sustainability 12 09062 g001
Figure 2. Classification of the stations of the Dublin bike scheme according to their station turnover ratio given by [1]. Source of background: Google Maps.
Sustainability 12 09062 g002
Figure 3. Location of BSS stations in (a) Area I and (b) Area II. Source of background: Google Maps.
Sustainability 12 09062 g003
Figure 4. Comparison of stations in group I. Total score of station attractiveness and contribution to the score of the walkability, cycleability and station-related factors. The circles represent the average weekly station turnover for each station and their percentiles with respect to the attractiveness distribution are indicated.
Sustainability 12 09062 g004
Figure 5. Comparison of stations in group I. Total score of station attractiveness and contribution to the score of the objective and subjective factors. The circles represent the average weekly station turnover for each station.
Sustainability 12 09062 g005
Figure 6. For the stations in group I, safety and security total scores.
Sustainability 12 09062 g006
Figure 7. Comparison of stations in group II. Total score of station attractiveness and contribution to the score of the walkability, cycleability and station-related factors. The circles represent the average weekly station turnover for each station and their percentiles with respect to the attractiveness distribution are indicated.
Sustainability 12 09062 g007
Figure 8. Comparison of stations in group II. Total score of station attractiveness and contribution to the score of the objective and subjective factors. The circles represent the average weekly station turnover for each station.
Sustainability 12 09062 g008
Figure 9. For the stations in group II, safety and security total scores.
Sustainability 12 09062 g009
Figure 10. Total score of station attractiveness obtained when considering fitted weights for (a) Stations in Group I and (b) Stations in Group II. The circles represent the average weekly station turnover for each station.
Sustainability 12 09062 g010
Table 1. List of selected publications about planning and assessment of cycling infrastructure and BSSs (2015–2019).
GoalScopeData SourceMethod/ApproachSaf./Sec.
AnalysisPlanning/DesignPhysical CharacteristicsEnvironmental Char.Service-Related FeaturesDemand/Mobility PatternsRoad-Traffic InteractionPublic Transport InteractionPedestrian ConsiderationBSS Station-Related FactorsInteraction Amongst StationsDatabaseGIS DataSurveys/Focus Group, etc.Descriptive/Qualitative ToolsSpace-SyntaxStatistical ApproachMetric ScoreMachine LearningOptimisation MethodsSafetySecurityObjective/Subjective
[21] X X XXX X
[16]X XXXXXX XXX X
[22] XXX X X
[17] X X XXXXXX X
[23]X X XXXX X X X
[6]X X X X X X X
[24]X XX XXX XXX X
[25] XX XX X X X X
[26]X X X X X XX
[27]X XX XXX X X XX
[28]X X X XXXX X
[29] XX X XX XX
[2]X XXX X XXX X
[10]X X XXX X X
[30]X XX X X XX X
[31] X X X XX X
[32]X X XXXX XXX X
[33]X XXX X XX X X X X
[34]X XXX XXX XXX X X X
[35]X XXX X X X X X
[36]X X XXXXX X
[37] X XXXX XX XX X X
[38] X XXX X X X X X X
[39]X X X X X X
[40]X XX X XX X XX
[41]X XX X X X X
[42]X XX XXX X X X
Present workXXXXX XXXXX X X X XXX
Table 2. Assessment indicators to study the attractiveness of BSS stations: Related to pedestrians. Walking coverage (within a 300 m radius, Euclidean distance).
IndicatorsDescriptionMetric ExamplesPercep. DependenceDissuasive EffectRelated to Saf./Sec.
Land topographyPositive gradient of slope (upward)Percent grade along pathway, number of stairsLowYesSafety
CrowdsA large number of people gathered togetherPersons per areaHigh-Security
Traffic interaction and trouble spotsPresence of other modes of transport (vehicles, buses, trams, bikes) and their related infrastructure along the pathway. Existence of trouble spots along walkways, such as bus stops, entrances, junctions, parking lots, traffic lights, etc.Number of pedestrian crossings, crossing facilities, traffic volume, existence of pedestrian streets, maximum walking distance without traffic interactionLowYesSafety
Walkway layoutPhysical characteristics of walkway layout to improve level of serviceWalkway width, surface conditions such as type and quantity of distresses, percent of adherence to handicap accessibility guidelinesLowNoSafety
Environmental conditionsNatural environment contaminated with harmful substances as a consequence of human activities, such as noise and pollution. Uncomfortable environment with lack of lighting, lack of cleanliness and lack of green areas, among other issuesNumber particles PM10, decibels, number of lamps per area, number of trees per areaLowYesSafety and security
Street connectivity and legibility of the urban spaceDirectness of pathways and density of connections (e.g., intersections, cul-de-sacs) in street networks. Lack of physical barriers, such as rivers, highways and mountains. Urban spaces should provide easy and seamless navigation and movement helping to improve people’s transitDepth distance, angular depth, intersection density, average block length, length of all the streets within an area, number of cul-de-sacsHigh-Security
AmenitiesPresence of desirable or useful features or facilities to walk comfortablyNumber of resting areas, benches, fountains, panel information and sign posts. Existence of CCTV and help pointsHigh-Security
Weather protectionPresence of urban equipment providing weather protection (e.g., shelters)Number of canopies, shelters or wind breaks. Existence of hazard warningsLowNoSafety
Place-related aspectsPresence of shopping areas, green areas and landmarks (e.g., schools, museums)Density of points of interest, proximity to shops, proximity to employment centres, proximity to open spaces and parks, existence of landmarks along walkwayHigh-Security
Table 3. Assessment indicators to study the attractiveness of BSS stations: Related to bicyclists. Riding coverage (within a 600 m radius, Euclidean distance).
IndicatorsDescriptionMetric ExamplesPercep. DependenceDissuasive EffectRelated to Saf./Sec.
Land topographyPositive gradient of slope (upward)Percent grade along cycle route (uphill)LowYesSafety
Traffic interaction and trouble spotsPresence of other modes of transport (e.g., heavy goods vehicles, buses and trams) along cycle routes. Existence of trouble spots along the cycle route, such as bus stops, entrances, junctions, pedestrian crossings, parking lots, junctions and traffic lightsTraffic volume, average vehicle speed, percentage of HGV, number of bus stops, number of accesses to properties, number of junctions, number of pedestrian crossings, number of adjacent parking lots, number of drop-off and pick-up pointsLowYesSafety
Pedestrian interactionPresence of pedestrians in cycle route when cycle lanes are shared with pedestrians (in sidewalks or greenways)Daily number of pedestrians across a cycle lane sectionLowYesSafety
Cycle-lane layoutExistence of cycle lanes and their physical characteristics to improve level of service, if exist (e.g., level of continuity, curb lanes, surface conditions, protective barriers such as tree lines, bollards, guardrails)Lane width, buffer width, surface conditions such as type and quantity of distresses, number of crossing facilities, number of protective barriersLowNoSafety
Environmental conditionsNatural environment contaminated with harmful substances as a consequence of human activities, such as noise and pollution. Uncomfortable environment with lack of lighting, lack of cleanliness and lack of green areas, among other issuesNumber particles PM10, decibels, number of lamps per area, number of trees per areaLowYesSafety and security
Street connectivity and legibility of the urban spaceDirectness of pathways and density of connections (e.g., intersections, cul-de-sacs) in street networks. Lack of physical barriers, such as rivers, highways and mountains. Urban spaces should provide easy and seamless navigation and movement helping to improve people’s transitDepth distance, angular depth, intersection density, average block length, length of all the streets within an area, number of cul-de-sacsHigh-Security
AmenitiesPresence of desirable or useful features or facilities to ride comfortablyNumber of resting areas, benches, fountains, panel information and sign posts. Existence of CCTV and help pointsHigh-Safety and security
Weather protectionPresence of urban equipment providing weather protection (e.g., shelters)Number of canopies, shelters or wind breaks. Existence of hazard warningsLowNoSafety
Place-related aspectsPresence of shopping areas, green areas and landmarks (e.g., schools, museums)Density of points of interest, proximity to shops, proximity to employment centres, proximity to open spaces and parks, existence of landmarks along cycle routeHigh-Security
Table 4. Assessment indicators to study the attractiveness of BSS stations: Related to stations.
IndicatorsDescriptionMetric ExamplesPercep. DependenceDissuasive EffectRelated to Saf./Sec.
Level of serviceDocking points and bikes available at a certain period of timeProbability of docking or bicycle availability at a certain period of time, capacity of the stationLowNoN.A.
Relation to nearby stationsIdentification of nearby stations within a 600 m radiusDistance to the closest bike stations, number of stations within a 600 m radiusLowNoN.A.
BSS-related facilitiesFacilities related to BSS and its operation, such as information about fees, timetables and a support help lineExistence of information panels, screens and contact telephoneLowNoSecurity
Environmental conditionsNatural environment contaminated with harmful substances as a consequence of human activities, such as noise and pollution. Uncomfortable environment with lack of lighting, lack of cleanliness and lack of green areas, among other issues.Number particles PM10, decibels, number of lamps per area, number of trees per areaLowYesSafety and security
AmenitiesPresence of desirable or useful features or facilities beside the station, such as benches, toilets and/or water dispensersNumber of benches, existence of toilets, water dispensersLowNoSafety and security
Weather protectionPresence of urban equipment providing weather protection (e.g., shelters)Number of canopies, shelters or wind breaks. Existence of hazard warningsLowNoSecurity
Place-related aspectsPresence of shopping areas, green areas and landmarks (e.g., schools, museums)Density of points of interest, proximity to shops, proximity to employment centres, proximity to open spaces and parks, existence of landmarks beside the stationHigh-Security
Table 5. Fitted weights based on the observed average weekly station turnover.
WalkabilityBikeabilityStation-Related
IndicatorWeightIndicatorWeightIndicatorWeight
topography0.00topography0.00level of service0.15
crowds0.11a. traffic. Int: traffic0.12a. nearby stat.: distance0.12
traffic interaction0.19b. traffic. Int: trouble spots0.08b. nearby stat.: number0.12
walkway layout0.11pedestrian interaction0.00c. nearby stat.: docks0.11
env. conditions0.08cycle-lane layout0.10BSS-related facilities0.00
a. legibility: barriers0.11env. conditions0.08env. conditions0.00
b. legibility: visual0.11a. legibility: barriers0.12amenities0.24
amenities0.11b. legibility: visual0.12weather protection0.00
weather protection0.00amenities0.12place-related0.27
place-related0.18weather protection0.07
place-related0.20
Publisher’s Note: MDPI stays neutral with regard to jurisdictional claims in published maps and institutional affiliations.

