Abstract
Semiarid regions are characterized by prolonged droughts and drought regimes. In Brazil, 57% of the northeast region is considered semiarid, with an average annual rainfall of less than 800 mm. This climatic condition imposes the need to conduct public policies and develop infrastructure in order to mitigate drought effects. In this context, the São Francisco River transposition project is an alternative to problems concerning city water supplying and aiming at decreasing socio-economic impacts resulting from water restrictions in this region. On the one hand, the river transposition has the potential to establish a new development cycle in Northeastern Brazil, while, on the other, electricity demands, estimated at 2533 GWh/year from 320 MW of installed capacity, require technological alternatives that ensure the project’s financial sustainability. In this context, this study presents proposals for arrangements concerning electric energy production through photovoltaic systems as an alternative supply for the transposition project. To this end, a study of the region’s photovoltaic solar potential was carried out. Based on the performed assessment, three production arrangement proposals that consider the use of (i) the lateral area and (ii) the transposition channel and (iii) part of the area of some reservoirs belonging to the transposition of São Francisco river. The study point out that the use of this potential for all three studied arrangements is favorable to supply, individually or in a combined form, the electrical energy demanded by the pumping stations installed.
1. Introduction
Northeastern Brazil occupies 18.25% of the total Brazilian territory, comprising 8,516,000 km2, with an estimated population of 54 million inhabitants (27% of the entire Brazilian population). In economic terms, this region contributes to approximately 14% of the Gross Domestic Product (GDP), 12% of industrial production and about 21% of agricultural production [1].
The Northeast as an institutionalized territorial space dates back to 1942, when the Brazilian Institute of Geography and Statistics (IBGE) structured the country’s Regional Division into five regions defined according to natural, social, cultural and economic aspects. However, its imagery construction is fundamentally shaped around the recurring drought phenomenon present in the region.
This region [1,2] also registers a significantly lower socioeconomic development level compared to central south Brazilian regions, with an Municipal Human Development Index (MHDI) mostly between 0.557 and 0.595 (2010 data), despite the economic advances noted in the last four decades. Poverty, when taken in the national context, is still an old trait that the economic dynamism of this century has not managed to alter significantly since the 1980s [3]. At first glance, persistent poverty in the Northeast is largely credited to a drought history in extensive areas located in the interior of most Northeastern states, most notably in the semiarid region, where demographic densities are lower and poverty rates, higher.
The Brazilian semiarid region extends over an area that covers most Northeastern states and part of the state of Minas Gerais, totaling 1262 municipalities comprising 1,127,953 km2—an area equivalent to France, Spain and Portugal combined—with an annual rainfall index below or equal to 800 mm, a Thornthwaite aridity index equal to or less than 0.50 and a daily percentage of water deficit equal to or greater than 60%, considering all days of the year [4,5]. Approximately 27 million people (12% of the country’s population) live in this area, making it one of the most populous semiarid areas of the planet, surpassing the population of countries with similar climatic attributes, like Israel, at 8 million, and Australia, at 25 million. Figure 1 presents a map of the Brazilian semiarid region according to the Superintendence for the Development of the Northeast (SUDENE) resolution of November 2017.
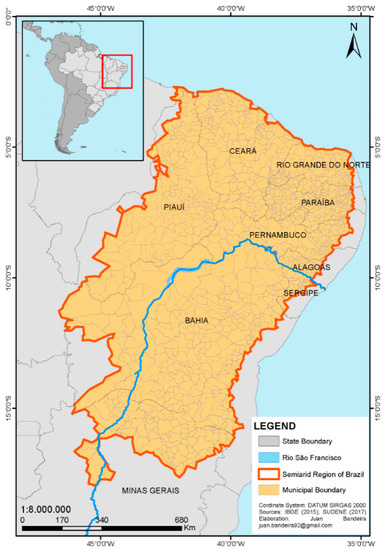
Figure 1.
Delimitation of the Brazilian semiarid region. Source, adapted from [5].
The region’s unfavorable hydrography is insufficient to sustain its large rivers and maintain perennial conditions during the long and recurrent drought periods [6]. The exception is the São Francisco River, which holds 1.7% of the national total freshwater and 70% of the entire Northeastern water supply. In this context, its water availability (average net water discharges observed in the courses of a hydrographic basin—amount per inhabitant a year) acquires a special meaning for the surrounding populations settled on its bed [7,8,9].
Faced with this scenario and guided by a necessary development and dynamization of the Brazilian northeast economy from the reduction of its historical water vulnerability through the implementation of an infrastructure capable of promoting better drought coexistence, the Federal Government made the São Francisco River Water Transposition Project possible.
In October 2019, this project was concluded, and the pre-operation phase launched. However, operational costs, concerning, in particular, the resources necessary to bear the electricity taxes demanded by the project, which account for about 70% of total operational costs, restricts its full operation.
It is important to highlight that all the electricity demanded for the transposition comes from the Brazilian National Interconnected System (SIN) whose main source is hydroelectric plants. Approximately 65% of Brazil’s installed capacity originates from hydroelectric plants [10], which may indicate potential system restrictions in extreme drought conditions in the future and may affect the transposition objectives.
On the other hand, the Northeast has an abundance of renewable energy resources, in highlight solar energy, potential alternative for sustainable transposition operations [11]. The Brazilian Solarimetric Atlas [12] reports that the Brazilian Northeast presents the highest potential for solar energy in Brazil, few solar irradiation indices variations, averaging between 5.39 and 5.59 kWh/m2/day. Additionally, in this region, the highest global solar irradiation values were found in the semi-arid area [13]. In the semi-arid region, the extremely dry environment and the high number of hours of sunshine all year round result in daily solar irradiation up to 6.50 kWh/m2/day [14]. Recent studies indicate that the lowest values of Global Horizontal Irradiation for the semi-arid Northeast region occur between the months of March and May, during the rainy season, and the average values of solar irradiation vary between 4.30 and 5.80 kWh/m2/day. The highest Global Horizontal Irradiation values, in turn, occur between the months of September and February, during the dry season, where average solar irradiation values vary between 4.90 and 6.30 kWh/m2/day [15], as shown in Figure 2.
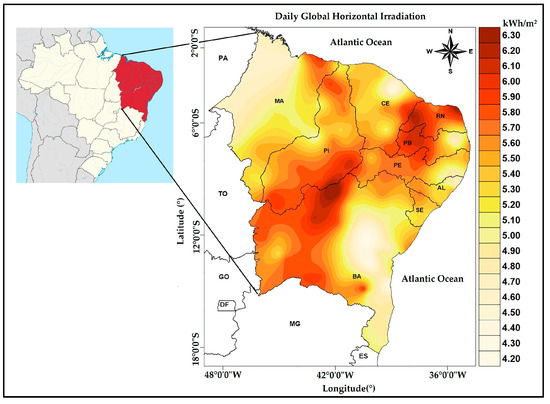
Figure 2.
Annual average of daily global solar irradiation at the surface (kWh/m2/day) in the Northeastern region of Brazil, Source: adapted from [15].
In this context, the history of water scarcity in the Northeastern semiarid region, in contrast to the recognized abundance of renewable energy resources in the region—with emphasis on solar energy—raises the possibility of using solar resources to supply the electricity for the energy demands of this important infrastructure project.
Infrastructure projects, like the one discussed here, demand high public resources for investment and maintenance, natural resources and incur social and environmental impacts. This increases the relevance of the debate on technological alternatives that minimize such impacts, as well as broadening the sustainability agenda from conception to full operation of these works, as guided by the Sustainable Development Goals (SDG–7) [16]. In this context, the adoption of photovoltaic technology, evaluated in this article, is in line with such guidelines, since it has the potential to reduce maintenance costs and socio-environmental impacts.
Thus, the article aims to evaluate the benefits of inserting productive electrical energy arrangements from large-scale solar photovoltaic systems. The aim is to contribute to the understanding of the technological and economic challenges, while using, as a background, the promotion of sustainability in the operation of these types of projects. The study developed here, based on the reality of the transposition of the São Francisco River, broadens the scope of its findings when extended to other regions of the world where the duality of the abundance of solar and the scarcity of water resources is also registered.
1.1. São Francisco River Transposition Project
The transposition project, termed PISF, is structured throughout 477 km comprising channels, tunnels and aqueducts, and classified into two axes, North and East. The North Axis ranges from Cabrobó (PE) to Cajazeiras (PB), 260 km in length and flowing through the states of Pernambuco, Ceará and Paraíba and 12 municipalities, while the East Axis, ranging from Floresta (PE) to Monteiro (PB), comprises 217 km flowing through three municipalities.
The aim of the PISF project is to transport water from the São Francisco River at a flow of up to 127 m3/s, at 99 m3/s in the North Axis and 28 m3/s in the East Axis, to branches that will supply most Northeastern semiarid regions. After its completion and when operating at full capacity, it is expected to benefit 12 million people settled in 390 municipalities throughout the four Northeastern Brazilian states covered by the project. It will, therefore, provide water security for this population, safeguarding sustainable access to adequate amounts of acceptable quality water to maintain the livelihoods of this population, promoting human well-being and population development in the area. Totals investments are estimated at USD 2.85 billion [8].
1.1.1. The Physical Structure of the PISF
In structural terms, the PISF comprises 13 aqueducts, four tunnels, nine pumping stations (EB), named EBI or EBV (three located at the North Axis and six at the East Axis), 27 reservoirs, eight 230-kV substations and one 69-kV substation, 250 km of high voltage transmission lines (230 kV) for both axes and distribution lines (6.9 kV, 13.8 kV and 69 kV). In addition to these physical structures, the project also plans to recover 23 reservoirs located in the region and build another 27 to expand pumping capacity during the second stage [17,18,19]. A summary of the physical structure dimension of the project is displayed in Table 1, with emphasis on the axes dimensions and the number of pumps required for each operation stage.

Table 1.
Physical structure of the PISF.
A simplified structure of each axis is displayed in detail in Figure 3 and in Figure 4, emphasizing the distances between pumping stations and the differences in channel heights at the pumping stations.
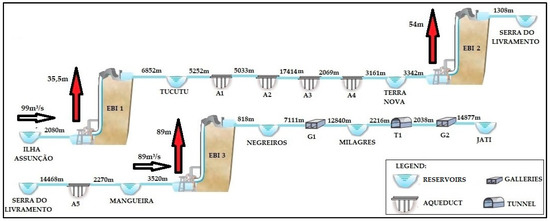
Figure 3.
PISF channels—North Axis. Source, adapted from [20,21].
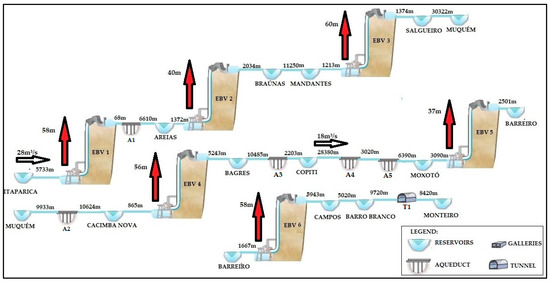
Figure 4.
PISF channels—East Axis. Source, adapted from [20,21].
Water transposition works have been sought out on a global basis and several countries have already adopted this technique. China, for example, is carrying out a similar project, still under construction and considered the largest transposition project in the world, with the aim of bringing water from the South to the North of the country, it will channel 25 billion cubic meters of water a year, covering about 1200 km through three channels [22,23]. This work, located in Beijing, is expected to be completed in 2050 and has been estimated as costing approximately USD 70 billion [24]. One of the project’s channels will transport 14.8 billion cubic meters of water a year, over a distance of 1156 km, making use of 23 water pumping stations with an installed capacity of 453 MW. During its partial operation, which began in 2014, the transposition has diverted 9.6 billion m3 of water, benefiting 53.1 million people [25].
1.1.2. PISF Operations
With about 97% of the PISF works completed, the project is partially operational, according to data from March 2020. All EBs in the East Axis are working at 50% of their nominal pumping capacity, while the North Axis has completed 94.92% of its planned works [26,27].
The transposition water is captured at two different points along the São Francisco River, one in the upstream channel of Assunção Island for the North Axis, close to Cabrobó (PE) and one downstream of the Itaparica dam for the Eastern Axis, between the cities of Floresta and Nova Petrolândia.
The Brazilian National Water Agency (ANA), responsible for implementing the management of Brazilian water resources [28], establishes that the steady and continuous pumping of the flow in both axes will be of 26.4 m3 (annual average corresponding to 1% of the river flow) intended for human and animal consumption, exceptionally reaching the project flow limit value—127 m3/s [26,29]. Figure 5 presents the general PSIF Map, emphasizing the axes and covered states.
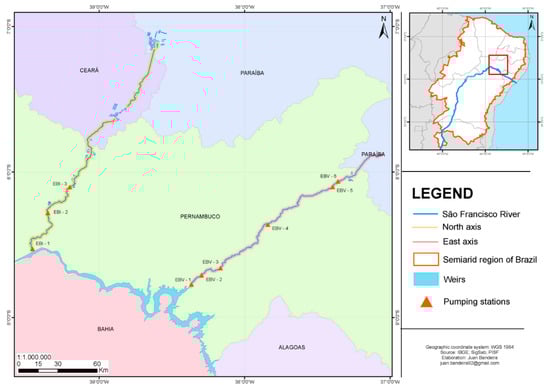
Figure 5.
General PISF map. Source, adapted from [30].
In order to contribute to the fluidity to this transported water, the PISF uses EB motor pumps to overcome route unevenness throughout the two axes. To this end, an installed capacity of approximately 105 MW is projected to supply the electrical demand of the first stage, reaching 320 MW when fully operational in the second stage. At full operation, water pumping will be carried out for up to 21 h during weekdays and for 24 h on weekends [31]. The annual electric energy demands by the EB are estimated at 835 GWh during stage 1 and 2533 GWh during stage 2, with a projected expenditure of USD 70 million a year concerning electricity purchases to supply PISF demands.
This new electric power demand results in the PISF applying pressure on existing generation units, adding costs to the system expansion and maintenance categories. In its pre-operation phase, the PISF demanded energy purchases at a cost of USD 50.00 per MWh in 2016, USD 69.00 per MWh in 2017 and USD 95.00 per MWh in 2018. Electricity expenditures for the PISF are increasing, as presented in Figure 6, reaching USD 53 million in 2019 [32]. These financial volumes have imposed public management concerns and, consequently, have led to decision-making advocating full PISF operations restrictions.
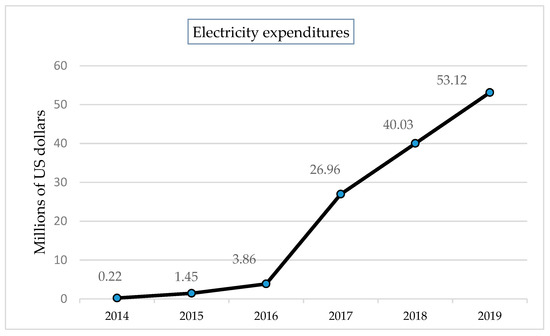
Figure 6.
Total electricity expenditures at the PISF.
The current PISF energy purchase model presents an inherent risk, since electricity purchases are made in a free consumer condition. This allows commercialization to take place in two different environments, namely the free market and the captive (regulated) market. Large consumers, with demands above 3 MW, can buy energy on the open market, defining price, term and volume.
It is worth noting that, in electricity supply scarcity scenarios, the practiced values certainly tend to exceed 2018 values, potentially enhancing the financial impacts of the project’s operation, which, despite having a high sunk cost, may, in the light of public policies, make it unfeasible.
In this scenario, the use of photovoltaic solar energy to supply PISF electricity demands is anchored in the economic-financial analysis developed through Levelized Energy Cost (LCOE) studies. LCOEs are, therefore, one of the metrics recurrently used in economic-financial analyses, defined as a measure of competitiveness of different energy generation technologies. This metric represents the generating plant’s construction and operation costs per MWh, in discounted monetary units, throughout the plant’s economic useful life cycle [33].
LCOE studies carried out by [34] consider the average price of the renewable energy auction held in January 2018, where a value between the price ceiling and the one auctioned at LEN 01/2018 of USD 66.91/MWh (USD to BRL average exchange rate for January 2018 is 3.213), was reached for photovoltaic technology, where the following LCOEs were obtained for the investigated productive arrangements: (i) USD 37.00 to USD 41.00; (ii) USD 53.00 to USD 59.00 and (iii) USD 40.00 to USD 44.00 [34]. Such studies conclude that the proposed arrangements are economically and financially viable, since their respective LCOE’s are below both the average auction price and their maximum value reached USD 97.10/MWh.
The adoption of solar photovoltaic technology in the study region must take place within an institutional environment that promotes a sustainability culture, strengthening the necessary relationship with the social, economic and environmental development spheres in the region. In this scenario, the implementation of projects of this nature can contribute to the promotion of the use and dissemination of photovoltaic technology as a prominent source in the electrical supply system and develop the entire production chain, leveraging local and regional income.
The materialization of these initiatives is not only dependent on actions of a technical and economic nature, but also strongly results from public policy actions applied to order market activities, contemplating technology transfer and the development of the national industry and its trade and service chain, as well as the technical framework formation within the scope of professional training and the formal educational path. According to [35], the lack of qualified professionals in the domestic market is an important barrier that must be overcome and public policies will have a direct impact on resource mobilization, while also enhancing entrepreneurial and training activities in the sector, thereby generating employment and income.
In these terms, it is imperative that photovoltaic projects, such as the arrangements proposed for the PISF, expand the benefits of their use beyond financial gains in terms of kWh as a function of the useful life of the utilized systems. It is then necessary to expand their positive impacts to different society segments, in order to develop a local production and service supply chain, in addition to research and knowledge production. These considerations create the necessary framework for a reflection that points to the importance of going beyond the traditional orientation, that permeates infrastructure projects. Therefore, new conceptions must be incorporated, including energy alternatives that consider natural resources and local potentials, such as photovoltaic solar energy.
At the same time as a strong demand for electric energy and a high volume of financial resources needed to operate transposition projects, such as the PISF, attention is also being paid to the potential effects of the water diversions, carried out upstream from the hydroelectric plants, may cause the generation capacity of these plants. In the case of the PISF, the plants located on the São Francisco river channel [36]. In adverse hydrological regime situations, this scenario may lead to local economic problems, increasing the dispatch of thermoelectric plants and, consequently, energy taxes. Figure 7 presents the hydroelectric plants belonging to the São Francisco Hydroelectric Company—CHESF—located on the São Francisco River and its respective installed capacities, as well as the water catchment points for the North and East axes.
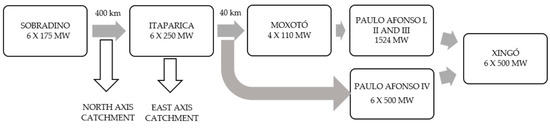
Figure 7.
São Francisco Hydroelectric Company (CHESF) Hydroelectric Plants on the São Francisco River. Source, adapted from [37,38].
Studies aimed at identifying water removal effects from the São Francisco basin at the average flow provided for the PISF in the CHESF system indicate that this activity presents potential and may cause average losses of about 240 MW to the hydroelectric complex downstream of the catchment [36], the equivalent of 2.4% of the nominal CHESF system capacity [39]. These studies, in spite of the uncertainties and the excess of information, point out the need to further these assessments, since, under unfavorable hydrological regimes, these effects can add difficulties to full PISF operations, as well as to the SIN energy supply.
1.2. The Solar Photovoltaic Potential
The analysis of the potential of renewable energy sources, such as solar, involves the verification of geographical, technical and economic aspects [40]. The theoretical potential is the theoretical limit of the primary resource. For sources derived from the solar source, this limit is the solar energy itself or solar energy converted into wind or biomass. The geographical potential is the theoretical potential reduced to the energy generated in areas that are considered available or desirable for their production. The technical potential is the geographical potential limited by the conversion losses from the primary source into secondary energy sources. Economic potential is the total amount of technical potential that, at cost levels, subsidies (incentive policies) and social constraints, are competitive with different energy alternatives.
Thus, the exploitable solar photovoltaic potential is the amount of electricity that can be produced from solar energy, considering the theoretical potential of the source (e.g., solar radiation), geographical characteristics (e.g., climate, relief and vegetation), technical constraints (e.g., photovoltaic conversion efficiency, area availability) and environmental and legislative constraints.
Concerning the theoretical solar potential, there are different approaches to estimate solar irradiation on a given collecting surface [41]: an approach that is based on the measurement of the local meteorological data, an approach that derives solar radiation from satellite data, and an approach that is a mixture of both, using terrestrial and satellite data. Solar radiation is affected by atmospheric conditions such as optical depth and turbidity (cloudiness); topographic features such as latitude, relief, roughness and shading; natural processes such as thawing, and evapotranspiration; and human activities. In most cases, the solar radiation incident on a surface is the result of the interaction between all these factors [42,43].
High-quality temporal-series solar irradiation data are crucial to a successful deployment of photovoltaic solar systems since it is the greatest impact variable on electrical power output [44]. Site-specific climatic data are important since technical and economic feasibility have a direct relation with the local solar resource, in both magnitude (high irradiance) and quality (low variability and high predictability) [45]. The key variable for fixed module, commonly used in large-scale Photovoltaic Systems (PVS), is Global Horizontal Irradiance (GHI), that is the amount of radiation received by a horizontal surface.
The technical potential can be estimated in terms of electric power or energy generation, per unit of area, and enable assessment of the absolute technical potential of the region. The overall performance of a Photovoltaic Plants (PVP), usually estimated on a yearly basis, is characterized by the final system yield (Yf), that figure representing the energy generated by the PV system normalized by the installed capacity peak power (kWh/kWp), and may be understood as the effective number of electricity generation hours [11]. The Performance Ratio (PR) is defined as the ratio between the final system yield, in operation conditions, to the reference yield (Yr), under ideal no-losses condition [11,46]. The PR includes the optical losses (Shadings, Incidence angle, soiling), the array losses (temperature operation, ageing, module quality, mismatch, wiring) and the system losses (inverter efficiency) [47,48,49]. The PR is useful for finding the efficiency of the entire PVP, regardless of module efficiency. Recent PV systems implementation reveals an annual PR that is typically around 0.8 [50].
The overall PVP capacity has also a relationship dependent on variables such as the PV module technology, the tilt angle of the array or inter-row spacing. These important PV system design parameters determine the area directly occupied by photovoltaic arrays in PVP, that is, the area of the PV generator—related to sum of the installed PV modules areas. Several studies of the technical potential in PV systems use a Ground Cover Ratio (GCR) to refer to the ratio between the PV array and the total ground area required for PV array installation [51,52]. The GCR has been identified as a key parameter enabling a sensitivity analysis of the PV technical potential. In general, the packing factor constantly decreases with increase in latitude and it is highest for fixed PV modules at optimum tilt angles, with GCR varying, almost linearly, from 0.9 to 0.45, at latitudes varying from 10° to 40°, respectively [53].
2. Methodology
A methodological path was applied to achieve the aims of this study, including a bibliography review concerning the São Francisco River transposition project characteristics and its importance for the Northeast Region, a survey of the available area within the PISF study region regarding solar potential; estimates concerning photovoltaic solar potential for electricity generation in the surveyed area; and the study of alternative productive electric energy arrangements from the use of PVP as a way to contribute to reduced dependence on the electric supply demands of interconnected systems, in infrastructure projects, as well as derived impacts, consequently contributing to the sustainability of projects of this scale.
Estimates concerning the photovoltaic solar potential for electricity generation in the transposition project area were performed using information available in the literature and in public and private organizations, in particular, the Brazilian Solarimetric Atlas [12,54] and its state versions [55] concerning solarimetric indices in PISF areas. The productive electric energy arrangements from PVP were obtained from solar potential calculations for the study region, using recurrent literature methods and analytical equations, aiming to fully supply the electric energy demands placed on the project. To do so, the annual average daily solarimetric indices of each pumping station were used, based on their geographical coordinates and the survey of the transposition project areas. Arrangements were defined according to the possible areas for PVP installation: 1. useful areas on the sides of the channels; 2. useful areas on the channels themselves; and 3. useful areas within reservoirs.
The São Francisco River water transposition project was first characterized by the useful PISF area survey, through an assessment of the entire documentary base presented in official publications and legal regulations [20,21,56,57,58], as well as on-site technical visits, aiming at data collection, comparisons and analyses as a way of revealing the reality experienced during the work execution.
2.1. Electrical Energy Demands of the PISF
Considering a scenario in which all PISF electricity demands are met during the pumping time (), the annual electricity required in per (i) for each PISF operation stage were calculated according to Equation (1).
where: is the pumping time, is the number of pumps for each EB and is the power of each pump, in .
2.2. Useful Available PISF Areas
2.2.1. Useful Areas on the Sides of the Channels and on the Channels Themselves
The sum of the lengths of the channels between catchments, pumping stations and dams and their respective widths on the lateral margins were used to calculate the total area available on the lateral earth strip and on the channels themselves. The strip of land with an average width of 200 m extending to the entire channel is PISF real estate, 100 m wide on each side starting from the central channel axis.
A width of 55 m was used on each margin for the calculation of the useful area in the lateral land strip of the channels, which can be occupied with photovoltaic solar modules. This value was defined based on possible exclusions related to channel slopes on both margins and service access roads, as presented in Figure 8.
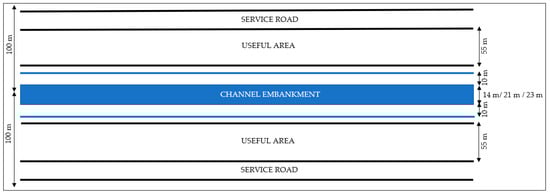
Figure 8.
Usable width throughout the channels.
Considering the entire length of the two axes—excluding areas cut by roads, bridges, walkways, culverts, tunnels and aqueducts—and using the measurements of the widths of the sides of the channels and their spans, the useful and favorable area for photovoltaic module installation on the sides of the channels in the North Axis comprise approximately 19.92 km2 and in the Eastern Axis, approximately 19.09 km2.
Channel width at the North Axis from the São Francisco River to EBI-3 comprises 23 m, decreasing to 21 m from EBI-3. The channel width at the East Axis is 14m along its entire length. Channel lengths were used to calculate the useful area and the installation of photovoltaic modules on fixed structures on the channel, approximately 3.94 km2 at the North Axis and 2.43 km2 at the East Axis. The available photovoltaic module installation areas by applying these premises are displayed in Table 2.
Table 2.
Useful area on the sides and on the channels themselves.
2.2.2. Available Reservoir Area
The reservoirs closest to the EBs were considered for the calculations concerning the total available area in PISF reservoirs. Table 3 presents the total area of some of the main PISF reservoirs, as well as the closest pumping station. In this study, we opted for a 25% portion of the total reservoir area as a useful area, in order to avoid module shading caused by the edge of the reservoirs, guaranteeing PVP integrity and functionality, even in situations of potential reservoir volume variations [59].
Table 3.
Reservoir areas near the pumping stations.
Considering 25% of the total area of the reservoirs, approximately 12,869,129 m2 of usable area for installing floating PVP is available.
2.3. Solar Potential of the PISF Region
The theoretical solar potential (solar radiation) was obtained by SunData software of the Reference Center of Solar and Wind Energy Sérgio Brito (CRESESB). The SunData software provides daily average monthly solar radiation values at any point of the Brazilian territory. The SunData database is composed by a 17 years history of satellite images and with information of more than 72,000 points in the whole Brazilian territory [54]. Figure 9 presents the Brazilian theoretical potential of solar radiation.
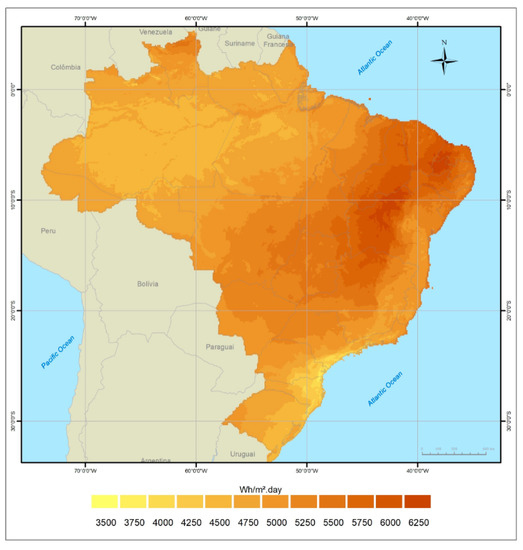
Figure 9.
Brazilian theoretical potential of solar radiation. Source, adapted from [12].
The annual geographical potential () of the overall PISF areas was obtained according to Equation (2).
where: is the estimated average daily solar radiation , in an incident plan, and is the total PISF area, in
2.3.1. Photovoltaic Electricity Generation Potential
The solar photovoltaic potential of the region was estimated by applying the data concerning available and suitable areas for the installation of photovoltaic modules and the annual average of local daily irradiation.
The total technical photovoltaic potential of the assessed region was obtained individually for each arrangement given around the EBs and the sum of the individual potentials. Concerning value solar modules, the maximum power values and the projection of the offered energy reflect the availability of the area and its solar potential in each stretch. It is noteworthy that the sum of all the proposed PVP application capacity and its energy generation projections are added in order to contribute to a total offer of the proposed arrangements.
The Ground Cover Ratio (GCR), defined as the ratio of the total PV generator area ( ) to the actual land area occupied by all the PV system ( ), according to Equation (3):
where: is generator area and is actual land area occupied by all the PV system, in
PVP sizing in each controlled arrangement, in the two stages, takes into account the inclination angle of the modules, the maximum power and the area occupied by the typical photovoltaic module and the losses and variations applicable. Thus, the proposed arrangements are modular and adjust to station demands.
Many studies provide theoretical bases for calculating the ideal slope angle using complex expressions [60], where some comprise simple linear expressions calculated as a function of local latitude [61,62]. An inclination angle (α) of 10° was chosen, since the entire PISF region is located at latitudes between 8° and 9°, corroborating the definitions stated in [63,64,65]. A correction factor for the inclined surface was used to correct the irradiation value in the regions of interest, as shown in Table 4 and according to [66].
Table 4.
Correction factor for a 10° inclined surface at 9° longitude.
Generic solar modules were used for PVP dimensioning, displayed in Table 5. Analytically, the potential installed power estimates were obtained from the surrounding PISF areas, PVP physical dimensions and annual electricity production estimates.
Table 5.
Generic solar module parameters.
The annual energy production estimate for each PVP was calculated according to Equation (4).
where: is the estimated average daily solar radiation , in a horizontal incident plan, GCR is the ground cover ratio, is the area, in occupied by all the PVP, is the nominal conversion efficiency of the solar module and is the performance ratio of the PVP.
Considering that the entire useful area occupied by PV generator () and the area of each generic module () adopted in this study, the number of modules ( ) installable in this area was determined according to Equation (5).
In this case, the installable photovoltaic potential of the PVP was calculated by multiplying the number of modules () by their peak power , in W, according to Equation (6).
The estimated average Capacity Factor was calculated using the ratio between the estimated annual energy and the energy production that would have been generated had the system been operating at full capacity, i.e., the entire potential installable period over the entire period [67,68], according to Equation (7).
The results obtained in the analytical analyses were compared with the values found using the PVSYST Photovoltaic Software [69], in order to validate the applied analytical method. PVSYST was chosen among the various existing software packages due to its interchangeable characteristics with other programs and practicality in quickly defining PVS general resources, in addition to its functionality in the use of geographic and solarimetric data and those that characterize photovoltaic modules and their inverters [70].
2.3.2. Productive Photovoltaic Electric Arrangements
Based on the dimensioning obtained from the viable usage areas and their solar potential, the following productive arrangements were proposed herein:
- Arrangement 1—aims to supply the entire electricity demands of the total EB with PVP installed in the available areas on the side of the channels, in both stages;
- Arrangement 2—aims to supply the electricity demands of the total of EB with PVP installed in the available areas on the channels themselves, in both stages;
- Arrangement 3—aims to supply the electricity demand of the total EB with PVP installed in the available 25% of reservoir areas in both stages;
It is important to highlight that channel coverage favors decreased water losses by evaporation and reduces algae growth [59]. Photovoltaic solar energy applied to floating structures in lakes, dams and weirs, among others, is one of the current solar industry trends and has been widely applied, especially in China. In Brazil, several projects have already adopted this technology [13,71]. Some studies indicate an efficiency gain for photovoltaic modules installed in Brazilian reservoirs [13,72]; the conservative rate of 7% was used in this work [10].
The electricity demands required for the two PISF stages were calculated for PVP dimensioning, according to the pumping time defined in the project and the sum of the powers of each pump in the different EBs.
3. Results and Discussion
3.1. PISF Electricity Demand
The pumping structure required for the PISF is shown in Table 6 alongside the power of each pump per lifting station, the total power of each station and their sum in each stage. The data magnitude is noteworthy.
Table 6.
Installed power of PISF pumps.
3.2. Solar Photovoltaic Potential of the Northeastern Semiarid
All PISF pumping stations, object of this study, are located in the State of Pernambuco. The geographic location regions of the EBs have Global Horizontal Irradiation indexes averages over 5.80 kWh/m2/day (In Figure 10). In the region of the Sertão de Itaparica (Petrolândia, Floresta, Jatobá and Itacuruba) on the river shores of the São Francisco, Global Solar Radiation exceeds 6.40 kWh/m2/day [55].
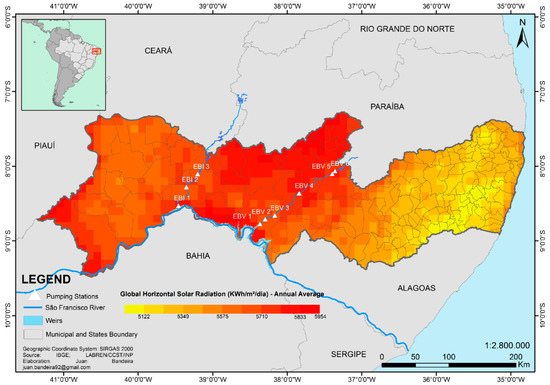
Figure 10.
Global horizontal irradiation map around pumping stations sites in Pernambuco State. Source, adapted from [55].
The monthly average solarimetric indices for each EB are shown in Table 7 obtained from the SunData program available at the CRESESB website [73] and presented by the Brazilian Atlas of Solar Energy [12]. The values in this table corroborate the aforementioned assumptions and characterize the PISF region as a suitable area for photovoltaic solar generation.
Table 7.
Solar irradiation at the PSIF pumping stations—horizontal plane.
Solar Photovoltaic Potential of Available PISF Areas
The calculations of the PISF solar potential that make up the arrangements proposed in this study were carried out using the average daily radiation data obtained and presented in Table 7, the useful available PISF areas, as presented in Table 2 and Table 3, an adopted generic module efficiency of 18% and a photovoltaic system performance rate (PR—ratio between the real yield and the expected PVS yield) of 80%, as adopted in [74].
Table 8 presents the electrical generation potential to be used around the PISF, according to the area delimitations defined in the survey, annual electric energy production estimates and the installable potential by channel length or reservoir area, in the specific case of arrangement 3. A total installable potential in the region of 10,488 MW and an estimated generation of 17,598 GWh of annual electricity are available, for an approximate of 19%.
Table 8.
Installable potential in the PSIF Region.
3.3. PISF Energy Demands
Considering the data displayed in Table 6, which presents the pumping stations demands, the annual electricity demands were calculated for each stage per pumping station (Table 9).
Table 9.
Annual energy demand from PISF pumping stations.
In general, total PV system losses are of approximately 18% [75], with losses between 10 and 40% reported in the literature. In the present study, the PV system losses discussed above were used to estimate a PR value for the PV system of arrangement 1, as presented in Table 10.
Table 10.
PVS loss estimates.
The number of installed module power values and the offered energy projection reflect the area availability in each stretch. Table 11 presents the dimensioning of the different photovoltaic generation units for each EB on arrangement 1, necessary for the PISF demands of steps 1 and 2. The table shows the total area occupied by the modules and the length of the channel required for each PVP.
Table 11.
Photovoltaic system dimensioning for arrangement 1— PVP installed in the lateral channel areas required by PISF demands.
Similarly, the necessary PVS for arrangements 2 and 3 were also dimensioned, as displayed in Table 12 and Table 13, respectively. A performance rate of 88% was adopted for both arrangements, reflecting an increase in photovoltaic module performance due to the cooling effect [10,68].
Table 12.
Photovoltaic system dimensioning for arrangement 2—PVP installed on the channel areas themselves required by PISF demands.
Table 13.
Photovoltaic system dimensioning for arrangement 3—PVP installed in reservoirs required for PISF supplying.
PVS dimensioning required for arrangement 3 is displayed in Table 13.
The arrangement sizing results were very similar when compared to those obtained using the PVSYST Photovoltaic Software [69], thus validating the applied methodology [76].
3.4. Solar Potential in the Region
This study indicates that the photovoltaic solar potential on the sides and on the channels themselves, either combined or individually, as well as in the reservoir area, would supply the electricity demands for PISF’s stages 1 and 2 when considering the entire useful area and solar potential available in the region. For stage 2, the photovoltaic solar potential of the channels themselves would be insufficient to supply the total electricity demands for the PISF, displayed in Figure 11.
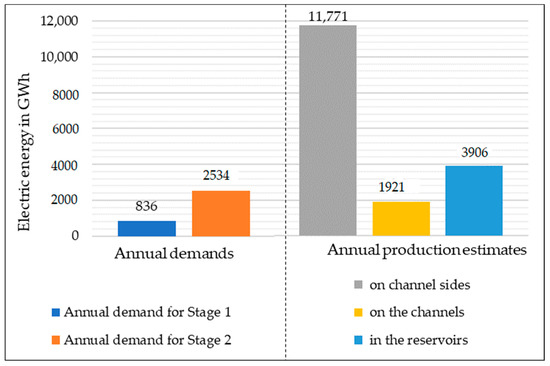
Figure 11.
Stages demands and annual solar energy potential in the PISF region.
Alternatively, the solar potential of the reservoirs and the sides of the channels could also be used. The use of different useful area combinations is an interesting option for the use of the evaluated solar potential to supply the PISF electrical energy demands in its several stages, with the possibility of generating surplus that can be commercialized on the energy market.
3.5. PV Arrangements for the PISF
After calculating the PVP dimensioning for each arrangement, an analysis was performed concerning the area installation demands for PVP in comparison with PSIF availability.
For arrangement 1, an area utilization factor of 0.67 was used. The illustration of this arrangement is shown in Figure 12.
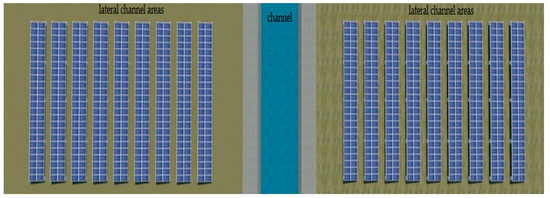
Figure 12.
Illustration of module disposition for arrangement 1.
Figure 13 portrays channel length requirements for the PVP installations for each EB (left scale) and the total (right scale), using arrangement 1, aiming at supplying the electricity demands of the first PISF stage. The conclusions are the same for the second stage supply.
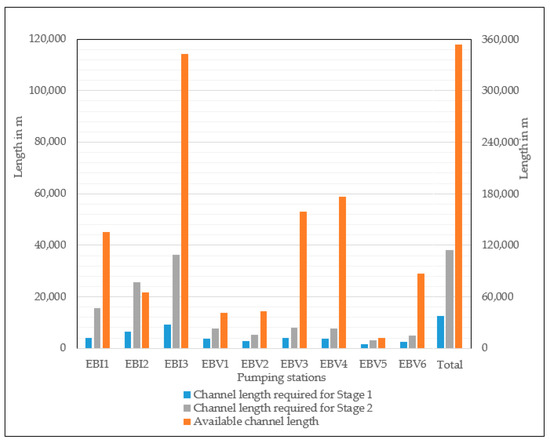
Figure 13.
Arrangement 1—length required to supply PISF electricity demands—PVP installed in the available areas on the side of the channels.
In a similar analysis, when considering only arrangement 2, Figure 14 indicates that for stage 1, all EBI stations and EBV stations 1, 3, 4 and 6 are long enough to install the necessary PVP power. To supply the PISF electricity demands in step 2, the use of only EBI-3 and EBV 3, 4 and 6 would be self-sufficient. In both stages, the excess space noted in the other stations could be used to supply the area requirements of the other stations. The joint use of arrangements 1 and 2 PVP are also presented as an alternative to supply the need for space for PVP installation in order to supply the entire electricity demands of stages 1 and 2.
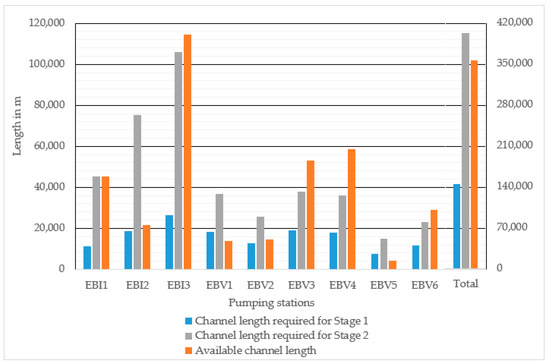
Figure 14.
Arrangement 2—length required to supply PISF electricity demands—PVP installed in the available areas on the channels themselves.
For arrangement 2, an area utilization factor of 1 was used. The illustration of this arrangement is shown in Figure 15.
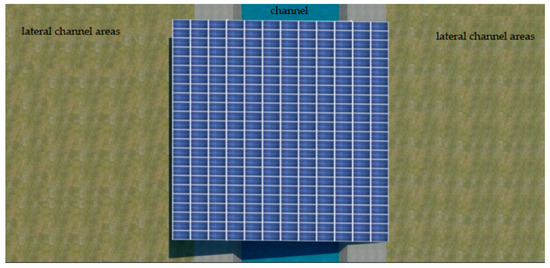
Figure 15.
Illustration of module disposition for arrangement 2.
Figure 16 graphically presents the useful areas of the reservoirs closest to each EB and the demands for the area required to install floating PVP to serve the pumping stations.
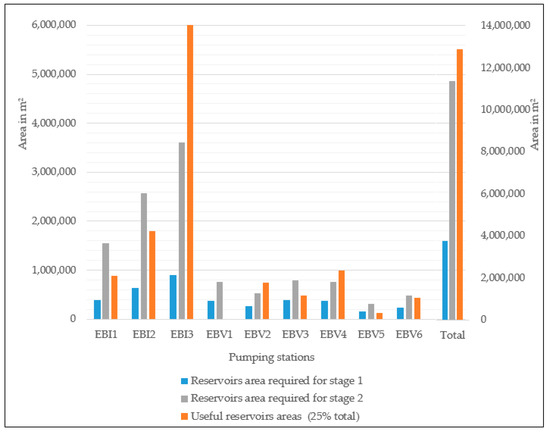
Figure 16.
Arrangement 3—length required to supply PISF electricity demands—PVP installed in the available 25% of reservoir areas in both stages.
It presents the installation area availability for a floating PVP to supply the electricity demands of PISFs’ only stages 1. By design option, the EBV2 area can be used to install PVP at stations EBV1 and EBV2.
For arrangement 3, an area utilization factor of 0.67 was used. The illustration of this arrangement is shown in Figure 17.
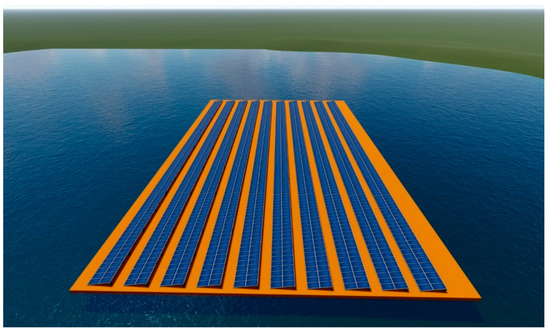
Figure 17.
Illustration of module disposition for arrangement 3.
Floating PVP can be implemented alongside PVP on the sides and on the channels themselves as an arrangement for the total PISF electricity demand supply. This association reduces the land space occupied by PVP along the channels.
4. Conclusions
On a planet-wide level, it is grounded in society that access to water enables the maintenance and reproduction of life, since this is an essential element for the survival of other living beings, as well as ecosystems. A lack of or improper access to water imposes wide-ranging impacts on people’s lives, affecting their health and socioeconomic development. Its importance is so particular that the United Nations (UN) recognizes access to clean and quality water in a safe way as a fundamental right to promote life in all entirety, also allowing for attention to all other rights credited to humans.
In Brazil, the Northeastern semiarid region has historically been the focus of attention in terms of guaranteeing the dissemination of drinking water supplies and promoting local socioeconomic development. The area’s annual rainfall rate is low, and a recurring prolonged drought phenomenon is noted, which has hampered the lives of about 27 million people who inhabit this region.
From the evaluation of the project of transposition of the São Francisco River, this article investigates productive electric energy arrangements using solar photovoltaic systems. It appears that, due to the high demand for electric energy imposed by the project, and, consequently, the financial volumes required to acquire this energy, photovoltaic solar energy can contribute to decrease the pressures imposed by electricity taxes on the project, as well as promote technology development in the region, favoring employment generation and local income.
During the implementation and pre-operation phase, the PISF demanded the movement of approximately USD 120 million in electricity acquisitions. In this scenario, government estimates point to an average cost of USD 70 million per year of operation.
This study points out that the vigorous use of the solar energy potential registered in the PISF area has proven favorable to the generation of electric energy through photovoltaic systems. In these terms, the research presents electricity generation estimates for four studied arrangements. i) PVP installed in available areas on the side of the channels; ii) PVP installed in available areas on the channels themselves; iii) PVP installed in 25% of available areas in the reservoirs; iv) PVP installed in all available areas around the PISF.
The estimated electric power generation potentials from PVP for arrangements 1, 2 and 3 were, respectively, 7022 MW, 1146 MW, 2320 MW totaling 10,488 MW.
- i.
- Arrangement 1 allows for an offer of 11,761 GWh/year, enough energy to supply the annual stage 1 PISF demands, estimated at 835.54 GWh/year and stage 2 demands, estimated at 2533.83 GWh/year. In this arrangement, to supply stage 1 demands, the PVP should have an installed capacity of approximately 500 MWp, occupying 38 km of channel length with photovoltaic modules. For stage 2 demands, the PVP must have an installed power of approximately 1500 MWp and fill 115 km of channel length.
- ii.
- Arrangement 2 presents an estimated supply of 1921 GWh/year, able to supply the entire demands of stage 1 or 75% of the demands of stage 2. To meet stage 1 demands, the PVP of this arrangement must have an installed capacity of approximately 455 MWp, with PV modules covering 144 km of channel length. For stage 2, the PVP must have an installed capacity of approximately 1378 MWp and fill 400 km of channel length. Usable length is not available for the North and East axes.
- iii.
- Arrangement 3 can offer 4446 GWh/year, energy that allows the total supply of stages 1 and 2, with approximately 452 MWp of installed power and PV module coverage in 3.7 km2 of reservoirs necessary to supply stage 1 energy demands. For stage 2, the PVP would require approximately 1372 MWp and occupy approximately 11.38 km2 of reservoir area with PV modules.
In the case of joint operation, the three proposed arrangements provided an estimated installed capacity of 10,488 MW, able to offer 18,128 GWh annually. For this arrangement, the estimated energy exceeds the PISF demand in its two stages by approximately seven-fold, thus allowing the project operator to choose to take advantage of this potential and also operate in the market offering the surplus, thereby generating additional PISF incomes. Another alternative would be to allow external operator bids on surplus areas, also assessing additional incomes to the project.
Whether or not the entire useful area of the PISF is used, PVP use for all arrangements is presented as a viable option to provide partial, complete or surplus electricity for sustainable PISF operations.
The present study argues that the adoption of solar photovoltaic technology must occur within an institutional environment that promotes a sustainability culture, strengthening the necessary relationship with regional social, economic and environmental development. It, therefore, demands actions to promote technological development and population training and qualification based on the area covered by the project, as a way of enabling employment generation and income.
In these terms, it is imperative that photovoltaic projects expand the benefits of their use beyond the strict market logic that focuses on the financial benefits of kWh as a function of the useful life of the applied systems. It is then necessary to expand positive impacts for different society segments, in order to develop a local production and service supply chain, in addition to research and knowledge production.
This article contributes to the knowledge regarding the adoption of photovoltaic systems in infrastructure projects, pointing out the need to be globally oriented from conception, to adopt sustainable technologies and practices adherent to SDG–7.
Author Contributions
Conceptualization, J.C.d.S.G., N.F.d.S. and M.A.V.F.; data curation and methodology, J.C.d.S.G., J.M.D.F., N.F.d.S., M.A.V.F. and M.G.P.; supervision, N.F.d.S. and M.A.V.F.; writing—original draft, J.C.d.S.G., J.M.D.F., N.F.d.S. and M.A.V.F.; and writing—review and editing, J.C.d.S.G., J.M.D.F., N.F.d.S., M.A.V.F. and M.G.P. All authors have read and agreed to the published version of the manuscript.
Funding
The research did not have the benefit from any funding as it was conducted in the context of a free public university.
Conflicts of Interest
The authors declare no conflict of interest. The funders had no role in the design of the study; in the collection, analyses, or interpretation of data; in the writing of the manuscript, and in the decision to publish the results.
References
- Cavalcante, R.G.; Freitas, M.A.V.; da Silva, N.F.; de Azevedo Filho, F.R. Sustainable groundwater exploitation aiming at the reduction of water vulnerability in the Brazilian semi-arid region. Energies 2019, 12, 904. [Google Scholar] [CrossRef]
- Pereira, M.G.; Da Silva, N.F.; Galvão, M.L.D.M.; Dantas, E.J.D.A. Scarcity and Abundance in the Brazilian Semiarid: The Strategies for Harnessing the Renewable Energy Potential of the Region (Re)Differentiating the Territory. Elsevier 2020. [Google Scholar] [CrossRef]
- Campos, J.N.B.; de C Studart, T.M. Droughts in northeastern Brazil: Origins, causes and solutions. Fourth Inter-Am. Dialogue Water Manag. 2001, 10. [Google Scholar] [CrossRef]
- de sousa Medeiros, S. Estabelecimento Agropecuários do Semiárido Brasileiro, 2017th ed.; do Semiárido, I.N., Ed.; Instituto Nacional do Semiárido: Campina Grande-PB, Brasil, 2018. [Google Scholar]
- Superintendência do Desenvolvimento do Nordeste Sudene—Delimitação do Semiárido. Available online: http://www.sudene.gov.br/delimitacao-do-semiarido (accessed on 28 August 2019).
- IBGE: Instituto Brasileiro de Geografia e Estatística. Available online: https://ww2.ibge.gov.br/home/geociencias/geografia/semiarido.shtm?c=4 (accessed on 27 August 2019).
- Agência Nacional das Águas. Conjuntura Recursos Hídricos do Brasil 2017 Relatório Pleno; Agência Nacional das Águas – ANA: Brasilia, Brazil, 2017.
- Regional Development Ministry—MDR: What Is the Project? Available online: http://www.mdr.gov.br/projeto-rio-sao-francisco/o-que-e-o-projeto/ (accessed on 27 August 2019).
- Ferrarini, A.D.S.F.; Filho, J.B.D.S.F.; Cuadra, S.V.; Victoria, D.D.C. Water demand prospects for irrigation in the São Francisco River: Brazilian public policy. Water Policy 2020, 1–21. [Google Scholar] [CrossRef]
- Motta, N.; Mambeli, R.; Lúcio, G.; Filho, T.; Redón-santafé, M.; Felipe, I.; Eduardo, V.; Valério, D.M. Use of floating PV plants for coordinated operation with hydropower plants: Case study of the hydroelectric plants of the São Francisco River basin. Energy Convers. Manag. 2018, 171, 339–349. [Google Scholar] [CrossRef]
- Pinheiro, H.H.C.; da Silva, N.F.; Branco, D.A.C.; Pereira, M.G. Photovoltaic solar systems in multi-headquarter institutions: A technical implementation in northeastern Brazil. Energies 2020, 13, 2659. [Google Scholar] [CrossRef]
- Pereira, E.B.; Martins, F.R.; de Abreu, S.L.; Rüther, R. Brazilian Atlas of Solar Energy, 2nd ed.; INPE, Ed.; INPE: São José dos Campos, Brazil, 2017; ISBN 9788517000300. [Google Scholar]
- Padilha Campos Lopes, M.; de Andrade Neto, S.; Alves Castelo Branco, D.; Vasconcelos de Freitas, M.A.; da Silva Fidelis, N. Water-energy nexus: Floating photovoltaic systems promoting water security and energy generation in the semiarid region of Brazil. J. Clean. Prod. 2020, 273. [Google Scholar] [CrossRef]
- Martins, F.R.; Pereira, E.B.; Silva, S.A.B.; Abreu, S.L.; Colle, S. Solar energy scenarios in Brazil, Part one: Resource assessment. Energy Policy 2008, 36, 2853–2864. [Google Scholar] [CrossRef]
- de Lima, F.J.L.; Martins, F.R.; Costa, R.S.; Gonçalves, A.R.; dos Santos, A.P.P.; Pereira, E.B. The seasonal variability and trends for the surface solar irradiation in northeastern region of Brazil. Sustain. Energy Technol. Assess. 2019, 35, 335–346. [Google Scholar] [CrossRef]
- Ods Home Page. Available online: https://documents-dds-ny.un.org/ (accessed on 15 June 2020).
- Lima, P.C. The Transposition of São Francisco River: An optimal Control Approach. Master’s Thesis, Universidade Federal de Pernambuco—UFPE, Recife, Brazil, 2006. [Google Scholar]
- Novais Pires, A.P. Structure and objectives of the São Francisco River Transposition: Versions of the same history. USP-GEOUSP 2019, 23, 182–197. [Google Scholar] [CrossRef]
- Dias, M. São Francisco River Transposition Civil Work: Challenges to the Brazilian Economy. Int. J. Bus. Manag. 2016, 4, 65–70. [Google Scholar]
- National Integration Ministry. Projeto de Integração do Rio São Francisco com Bacias Hidrográficas do Nordeste Setentrional - Lote D-Eixo Leste: Projeto Executivo do Lote D/Relatório Final dos Projetos; Consócio Ecoplan-Skill: Porto Alegre, Brasil, 2014.
- National Integration Ministry. São Francisco River Transposition-Final Report of The Executive Projects Lot C.; Consórcio TECHNE-PROJETEC-BRLi: Recife-PE, Brazil, 2015.
- Wilson, M.C.; Li, X.Y.; Ma, Y.J.; Smith, A.T.; Wu, J. A Review of the economic, social, and environmental impacts of China’s South–North Water Transfer Project: A sustainability perspective. Sustainability 2017, 9, 1489. [Google Scholar] [CrossRef]
- Webber, M.; Crow-Miller, B.; Rogers, S. The South–North Water Transfer Project: Remaking the geography of China. Reg. Stud. 2017, 51, 370–382. [Google Scholar] [CrossRef]
- South-North Water Transfer Project | International Rivers. Available online: https://www.internationalrivers.org/campaigns/south-north-water-transfer-project (accessed on 29 January 2020).
- China Builds Its River Transposition. Available online: https://exame.abril.com.br/revista-exame/china-constroi-sua-obra-de-transposicao/ (accessed on 13 February 2020).
- Evento Interativo—Projeto de Integração do Rio São Francisco com as Bacias Hidrográficas do Nordeste Setentrional (PISF): Portal e-Cidadania–Senado Federal. Available online: https://www12.senado.leg.br/ecidadania/visualizacaoaudiencia?id=15990 (accessed on 27 August 2019).
- Regional Development Ministry—MDR. Progress Report. Available online: http://www.mdr.gov.br/projeto-rio-sao-francisco/o-que-e-o-projeto/andamento-das-obras (accessed on 27 August 2019).
- National Water Agency—ANA. Bestowal No 2122, DECEMBER 21–2018. Available online: https://www.ana.gov.br/arquivos/resolucoes/2018/Outorgas/2122-2018_Outorga_de_Direito_de_Uso.pdf?161055 (accessed on 29 January 2020).
- Regional Development Ministr—MDR—Water Flow and Use. Available online: http://www.mdr.gov.br/projeto-rio-sao-francisco/o-que-e-o-projeto/vazao-e-uso-da-agua (accessed on 27 August 2019).
- PIRES, A.P.N. The Committee of the São Francisco River Basin: Water management and transposition of the São Francisco River. Ph.D. Thesis, Faculdade de Ciência e Tecnologia de Presidente Prudente (FCT-UNESP), Presidente Prudente-SP, Brazil, 2016. [Google Scholar]
- National Water Agency—ANA. Technical Note n° 390-2005-ANA; National Water Agency—ANA: Brasília, Brazil, 2005.
- Portal e-Cidadania - Senado Federal. Available online: https://www12.senado.leg.br/ecidadania/visualizacaoaudiencia?id=15990 (accessed on 17 February 2020).
- Guimarães, L.; dos, S. The Level Cost of Electricity and Its Impact on the Energy Transition. Available online: https://fgvenergia.fgv.br/sites/fgvenergia.fgv.br/files/coluna_opiniao_-_transicao_energetica.pdf (accessed on 17 February 2020).
- Ramos, E.G. EVTEA Para o Uso de Fonte de Energia Renovável no PISF: Uma Avaliação de Alternativas Para a Sustentabilidade Energética; Escola Nacional de Adimistração Pública: Brasília, Brazil, 2019. [Google Scholar]
- Carstens, D.D.; dos, S.; Cunha, S.K. da Challenges and opportunities for the growth of solar photovoltaic energy in Brazil. Energy Policy 2019, 125, 396–404. [Google Scholar] [CrossRef]
- Junior, J.d.S.P. Projeto De Transposição De Água Do Rio São Francisco; Camara dos deputados: Brasília-DF, Brazil, 2005. [Google Scholar]
- São Francisco Hydroelectric Company—CHESF. Sobradinho Floating Solar Power Plant. Available online: http://www.chesf.gov.br/pdi/Pages/UsinaSolarFlutuante.aspx (accessed on 3 September 2019).
- São Francisco Hydroelectric Company—CHESF. Generation Systems. Available online: https://www.chesf.gov.br/SistemaChesf/Pages/SistemaGeracao/SistemasGeracao.aspx (accessed on 13 December 2019).
- Hirai, M.N. Planejamento Nacional da Transposição do rio São Ferancisco; Universidade de São Paulo—USP: São Paulo-SP, Brazil, 2010. [Google Scholar]
- Angelis-Dimakis, A.; Biberacher, M.; Dominguez, J.; Fiorese, G.; Gadocha, S.; Gnansounou, E.; Guariso, G.; Kartalidis, A.; Panichelli, L.; Pinedo, I.; et al. Methods and tools to evaluate the availability of renewable energy sources. Renew. Sustain. Energy Rev. 2011, 15, 1182–1200. [Google Scholar] [CrossRef]
- Zhang, J.; Zhao, L.; Deng, S.; Xu, W.; Zhang, Y. A critical review of the models used to estimate solar radiation. Renew. Sustain. Energy Rev. 2017, 70, 314–329. [Google Scholar] [CrossRef]
- Duffie, J.A.; Beckman, W.A. Solar Engineering of Thermal Processes, 2nd ed.; Wiley-Interscience: New York, NY, USA, 1991. [Google Scholar]
- Ŝúri, M.; Hofierka, J. A new GIS-based solar radiation model and its application to photovoltaic assessments. Trans. GIS 2004, 8, 175–190. [Google Scholar] [CrossRef]
- Huld, T.; Müller, R.; Gambardella, A. A new solar radiation database for estimating PV performance in Europe and Africa. Sol. Energy 2012, 86, 1803–1815. [Google Scholar] [CrossRef]
- Gueymard, C.A.; Wilcox, S.M. Assessment of spatial and temporal variability in the US solar resource from radiometric measurements and predictions from models using ground-based or satellite data. Sol. Energy 2011, 85, 1068–1084. [Google Scholar] [CrossRef]
- International Electrotechnical Commission. International Electrotechnical Commission. IEC 61724:1998. Photovoltaic System Performance Monitoring e Guidelines for Measurement, Data Exchange and Analysis; Bureau of Indian Standards: New Delhi, Indian, 1998.
- Ross, R.G.; Smokler, M.I. Electricity from photovoltaic solar cells: Flat-Plate Solar Array Project final report. Volume VI: Engineering sciences and reliability. JPL Publ. 1986, 86–31, 12–13. [Google Scholar]
- Morcillo-Herrera, C.; Hernández-Sánchez, F.; Flota-Bañuelos, M. Practical method to estimate energy potential generated by photovoltaic cells: Practice case at Merida City. Energy Procedia 2014, 57, 245–254. [Google Scholar] [CrossRef][Green Version]
- Castro, R. Uma Introdução às Energias Renováveis: Eólica, fotovoltaica e Mini-Hídrica, 3rd ed.; Instituto Superior Técnico–IST Press: Lisboa, Portugal, 2018. [Google Scholar]
- IEA-PVPS. Analysis of Long-Term Performance of PV Systems—IEA-PVPS T13-05:2014; International Energy Agency: Paris, France, 2014; ISBN 9783906042213. [Google Scholar]
- Ong, S.; Campbell, C.; Denholm, P.; Margolis, R.; Heath, G. Land-Use Requirements for Solar Power Plants in the United States; NREL—National Laboratory of the U.S. Department of Energy: Denver, CO, USA, 2013; Volume NREL/TP-6A.
- Horner, R.M.; Clark, C.E. Characterizing variability and reducing uncertainty in estimates of solar land use energy intensity. Renew. Sustain. Energy Rev. 2013, 23, 129–137. [Google Scholar] [CrossRef]
- Martín-Chivelet, N. Photovoltaic potential and land-use estimation methodology. Energy 2016, 94, 233–242. [Google Scholar] [CrossRef]
- CRESESB—Reference Center of Solar and Wind Energy/CEPEL—Electric Power Research Center. Available online: http://www.cresesb.cepel.br/index.php?section=sundata& (accessed on 26 December 2019).
- Government of Pernambuco. Wind and Solar Atlas of Pernambuco. Available online: http://www.atlaseolicosolar.pe.gov.br/ (accessed on 7 January 2020).
- Techne-Project-BRLi and Regional Development Ministry. Final Report–Part 1: São Francisco River Integration Project with Hydrographic Basins of the Northeast. Executive Project of the Lot C–East Axis; Techne-Project-BRLi and Regional Development Ministry: Recife-PE, Brazil, 2015. [Google Scholar]
- Ministério da Transparência-Controladoria Geral da União. Relatório de Avaliação dos Resultados de Gestão; Ministério da Transparência-Controladoria Geral da União: Brasília, Brazil, 2016.
- Ministério da Transparência-Controladoria Geral da União-Secretaria Federal do Controle Interno. Relatório de Auditoria - No 201700224; Controladoria Geral da União—CGU: Brasília, Brazil, 2016.
- Farfan, J.; Breyer, C. Combining floating solar photovoltaic power plants and hydropower reservoirs: A virtual battery of great global potential. Energy Procedia 2018, 155, 403–411. [Google Scholar] [CrossRef]
- Jacobson, M.Z.; Jadhav, V. World estimates of PV optimal tilt angles and ratios of sunlight incident upon tilted and tracked PV panels relative to horizontal panels. Sol. Energy 2018, 169, 55–66. [Google Scholar] [CrossRef]
- Chang, T.P. The Sun’s apparent position and the optimal tilt angle of a solar collector in the northern hemisphere. Sol. Energy 2009, 83, 1274–1284. [Google Scholar] [CrossRef]
- Talebizadeh, P.; Mehrabian, M.A.; Abdolzadeh, M. Determination of optimum slope angles of solar collectors based on new correlations. Energy Sources Part A Recover. Util. Environ. Eff. 2011, 33, 1567–1580. [Google Scholar] [CrossRef]
- WWAP; Tran, M.; Koncagul, E.; Connor, R. United Nations World Water Assessment Programme. The United Nations world water development report 2016: Water and jobs. UN WATER 2016, 19, 1–12. [Google Scholar]
- Bosh: Installation and Safety Manual for the c-Si M60(S) NA 30117 and NA 42117 Families of Crystalline Photovoltaic Modules. Available online: http://www.bosch-solarenergy.de/media/bosch_se_serviceorganisation/kundendienst/north_america/crystalline_solar_modules/Bosch_Solar_Module_NA30117_NA42117_V11_29052013.pdf (accessed on 9 January 2020).
- Pinho, J.T.; Galdino, M.A. Manual de Energia Para Sistemas Fotovoltaicos; Grupo de Trabalho de Energia Solar -GTES-CEPEL-DTE-CRESESB: Rio de Janeiro, Brazil, 2014. [Google Scholar]
- Oliveira, F.T.V.; Gómez-Malagón, L.A. Otimização do ângulo de inclinação e orientação de painéis solares para a cidade de Petrolina. VII Congresso Brasileiro de Energia Solar. Available online: https://anaiscbens.emnuvens.com.br/cbens/article/view/717 (accessed on 18 October 2019).
- de Lima, L.C.; de Araújo Ferreira, L.; de Lima Morais, F.H.B. Performance analysis of a grid connected photovoltaic system in northeastern Brazil. Energy Sustain. Dev. 2017, 37, 79–85. [Google Scholar] [CrossRef]
- Mansouri Kouhestani, F.; Byrne, J.; Johnson, D.; Spencer, L.; Hazendonk, P.; Brown, B. Evaluating solar energy technical and economic potential on rooftops in an urban setting: The city of Lethbridge, Canada. Int. J. Energy Environ. Eng. 2019, 10, 13–32. [Google Scholar] [CrossRef]
- PVSyst—Logiciel Photovoltaïque. Available online: https://www.pvsyst.com/ (accessed on 13 December 2019).
- Sharma, D.K.; Verma, V.; Sing, A.P. Review and Analysis of Solar Photovoltaic Softwares. Int. J. Curr. Eng. Technol. No.2 2014, 4, 725–731. [Google Scholar]
- Bacelar, T.S. Characteristics of Environmental Conditions In the Sobradinho HPP Reservoir In The Context Of Floating Photovoltaic Generation. Master’s Thesis, PósGraduação em Tecnologias Energéticas e Nucleares-Universidade Federal de Pernambuco-UFPE-Brazil, Recife, Brazil, 2019. [Google Scholar]
- Do Sacramento, E.M.; Carvalho, P.C.M.; De Araújo, J.C.; Riffel, D.B.; Da Cruz Corrêa, R.M.; Neto, J.S.P. Scenarios for use of floating photovoltaic plants in Brazilian reservoirs. IET Renew. Power Gener. 2015, 9, 1019–1024. [Google Scholar] [CrossRef]
- Duffie, J.A.; Beckman, W.A. Solar Engineering of Thermal Processes, 4th ed.; Solar Energy Laboratory, University of Wisconsin: Hoboken, NJ, USA, 2013; ISBN 978-0470-87366-3. [Google Scholar]
- Castellanos, S.; Sunter, D.A.; Kammen, D.M. Rooftop solar photovoltaic potential in cities: How scalable are assessment approaches? Environ. Res. Lett. 2017, 12. [Google Scholar] [CrossRef]
- Miranda, A.B.C.M. Análise de Viabilidade Econômica de Um Sistema Fotovoltáico Conectado à Rede; Universidade Federal do Rio de Janeiro—UFRJ: Rio de Janeiro, Brazil, 2014. [Google Scholar]
- Roumpakias, E.; Stamatelos, A. Comparative performance analysis of grid-connected photovoltaic system by use of existing performance models. Energy Convers. Manag. 2017, 150, 14–25. [Google Scholar] [CrossRef]


Publisher’s Note: MDPI stays neutral with regard to jurisdictional claims in published maps and institutional affiliations. |
© 2020 by the authors. Licensee MDPI, Basel, Switzerland. This article is an open access article distributed under the terms and conditions of the Creative Commons Attribution (CC BY) license (http://creativecommons.org/licenses/by/4.0/).