Abstract
Electrifying bus transit has been deemed as an effective way to reduce the emissions of transit vehicles. However, some concerns about on-board battery hinder its further development. Recently, dynamic wireless power transfer (DWPT) technologies have been developed, which enable buses to charge in-motion and overcome the drawback (short service range) with opportunity charging. This paper proposes a mathematic model which optimizes the locations for DWPT devices deployed at stops and size of battery capacity for battery electric buses (BEB) in a multi-route network, which considers the battery’s service life, depth of discharge and weight. A tangible solution algorithm based on a genetic algorithm (GA) is developed to find the optimal solution. A case study based on the bus network from Xi’an China is conducted to investigate the relationship among optimized costs, greenhouse gas (GHG) emissions, battery service life, size of the battery capacity and the number of DWPT devices. The results demonstrated that a bus network powered by DWPT shows better performance in both costs (a 43.3% reduction) and emissions (a 14.4% reduction) compared to that with stationary charging at bus terminals.
1. Introduction
The impact of vehicle emissions has become one of the main global concerns. According to data from the International Energy Agency (IEA), transportation was responsible for 70% of total carbon emissions, and road transportation accounts for 75% of transportation carbon emissions. As one of the significant parts of urban public transportation, bus transit has been deemed as a sustainable and economical mode of travel and a potential way to mitigate traffic congestion and carbon emissions [1]. Some energy technologies applied in bus transit have been developed to address emissions issues, which include a hybrid electric bus (HEB), fuel cell electric bus (FCEB), and battery electric bus (BEB). BEB is considered to have a greater potential owing to its “zero tailpipe” feature, despite one major drawback being its short service range [2].
In recent years, some fast charging technologies have been developing rapidly, including dynamic wireless power transfer (DWPT), have been deemed promising to eliminate the range anxiety (short service range) of BEBs. Several countries as well as research institutes have conducted feasibility analyses [3,4]. In a real bus network (open environment), the DWPT can be installed at any bus stops to electrify BEBs [5]. To this end, its battery capacity as well as its weight could be substantially reduced (i.e., to around 30% less than that for a plug-in electric bus), and thus the energy consumption cost could be significantly cut down [6]. However, deploying DWPT devices could still be costly if the DWPT locations and battery capacity were not simultaneously optimized.
An optimization model is proposed in this study to determine DWPT locations and battery capacity for BEBs, the contributions of which are listed below:
- We formulate an innovative integer non-linear (MINLP) model to simultaneously optimize DWPT locations and battery capacity for a multi-route bus network that considers battery service life and battery weight, which may significantly affect total costs.
- Due to the complexity of the study’s combinatorial optimization problem (consisting of sets of battery types and potential bus stops), a tangible genetic algorithm (GA) is designed to solve the problem efficiently.
- The outcomes of the developed model and GA provide useful insights to policy makers for planning a DWPT bus network, while the relationship between some important input parameters and output variables is investigated.
The structure of this paper is as follows. Existing studies are reviewed in Section 2. In Section 3, we provide an overview of the model, and discuss its background and interpretation. The proposed GA is introduced and thoroughly explained in Section 4. Section 5 describes the numerical example as well as input parameters, for which simulation results under different charging technologies (e.g., DWPT and stationary charging), sensitivity analyses and energy consumption analyses are discussed. Finally, some findings and future study options are provided with the conclusion in Section 6.
2. Literature Review
Several studies have focused on the fast charging technology and investigated the distribution of public fast charging stations for private electric vehicles (EVs). Some researchers have employed a spatial-temporal model (STM) to optimize the location of fast charging stations with the aim of least conducting infrastructure investments that consider a real-world case (e.g., Wirges et al. [7] in Stuttgart, Mu et al. [8] in Britain and Tu et al. [9] in Shenzhen). Later, the activity-based model was proposed by Usman et al. [10] to determine the optimal locations of fast charging stations and the optimal charging process. Then, the demand-based model was employed by many researchers to determine the optimal locations of fast charging stations (e.g., Frade et al. [11] in Lisbon, Ko et al. [12] in Seoul and Shahraki et al. [13] in Beijing). The integer optimization technique used in this paper was also used by many previous researchers. Liu et al. [14] optimized the locations of charging facilities in different types, including plug-in charging stations as well as static and dynamic wireless charging facilities while considering the behavior of consumers. He et al. [15] compared the results of three integer models and identified the best model for optimizing the locations of charging stations for electric vehicles. He et al. [16] presented a integer linear model to determine the optimal locations of both energy storage devices and fast charging stations. A similar modeling technique was also used by Kunith et al. [17] to minimize the total infrastructure cost as well as the number of stations needed for a bus network, while also providing adequate battery capacity.
Most of the above studies focused on determining the optimal locations of public charging stations for private EVs except for He et al. [16] and Kunith et al. [17]. Due to the manufacture, deployment and maintenance costs, these charging devices must be installed at a limited number of locations. However, public transit, such as buses, in general differs from private EVs. Buses must pick up and drop off passengers at designated stops. As a result, the dwelling time (stopping at bus stops for passengers), accelerating time and decelerating time can be utilized to wirelessly recharge BEBs if DWPT devices are deployed.
Several studies have focused on the integer optimization of battery capacity and the DWPT locations for BEBs. Ko et al. [18] developed a non-linear integer model to minimize the total cost for a single bus route. The unit cost of one DWPT device under their model is determined by one inverter and the length of transfer pads. Jang et al. [19] developed a mixed integer model for a single bus route in a closed experimental environment where the DWPT devices could be installed along the route in the KAIST (Korea Advanced Institute of Science and Technology) system. Later, they [5] further extended the model to an open environment, where the DWPT was restricted to be installed only at bus stops. Liu et al. [20] proposed a deterministic integer model to determine the optimal DWPT locations for a multi-bus-route system. Then, they considered the uncertainty of energy consumption and bus travel time, further developing a robust integer location optimization model [4]. Wang et al. [21] proposed a integer linear model to optimize locations of wireless charging devices in the network where there are no bus terminals and the BEBs can only be charged at stops with charging devices. Chen et al. [22] presented a MINLP model to simultaneously determine bus operating frequency, DWPT locations and battery capacity as well as number of bus routes for a multi-route bus network.
The studies discussed above treated battery weight and service life as constants. However, a battery’s weight in practice varies along with its capacity. In addition, the locations of charging devices affect the battery’s depth of discharge (DOD) and service life. A linear correlation between battery weight and battery capacity has been discussed and formulated by Dunn et al. [23]. You et al. [24] proposed a rainflow cycle counting algorithm to estimate battery cycle life in the evaluation of economic battery viability, which has been employed to assess the energy consumption and efficiency of private EVs [25,26] and the life-cycle cost of a bus system [27,28]. Recently, Bi et al. [29] explored the relationship between the service life and DOD of a lithium-ion battery, which was applied to estimate the cost of electric bus transit powered by wireless charging technology. The results suggested that DOD and battery weight affected the optimal locations for charging devices and battery capacity.
As is illustrated in Table 1, in this study we consider the effects of battery service life, DOD and weight in the proposed model to optimize battery capacity and the locations of charging devices for a real-world multi-route bus network. Unlike previous studies, the proposed model discussed here aims to minimize the total cost, consisting of battery cost, charging devices cost and energy consumption cost, which can be used to assess the effects of battery weight and service life.

Table 1.
Comparison of the proposed model with some of the previous models.
3. Methodology
In this section, we firstly provide the background information for a battery electric bus powered by DWPT, and then present the assumptions, objectives, constraints and corresponding model derivation. Finally, the proposed model based on a general multi-route bus network is formulated.
3.1. Problem Description
The general DWPT devices deployed at a stop is shown in Figure 1, which is composed of the on-board pickup devices on the BEB, one inverter and several off-board transfer pads deployed underground. BEB may be recharged as required while passing though or dwelling at the bus stops to pick up and drop off passengers.
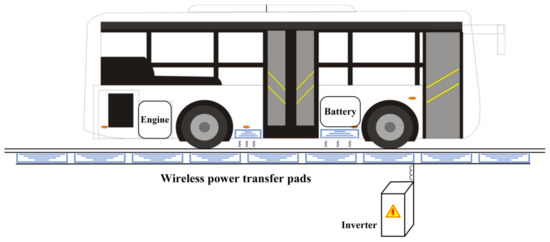
Figure 1.
The dynamic wireless power transfer (DWPT) facility.
3.2. Problem Description
The purpose of the model developed in this paper is to simultaneously determine the DWPT locations and battery capacity for a general multi-route bus network. To formulate the model, some assumptions were made:
- All the bus routes in the network begin from and terminate at bus terminals, which is in line with most bus transit systems.
- Buses are dispatched from the terminals with a fully charged battery and will be automatically charged as needed while passing through and stopping at bus stops with DWPT devices.
- All model parameters including the bus travel time and battery charging time are endogenously added into the model, but can also be determined based on travel speed along the route and dwell time at stops.
3.3. Model. Formulation
The electric bus network was denoted by the term , in which is the set of bus stops and L is the set of directed bus links. R is the set of all the bus routes in the network. denotes the stops without all of the bus terminals. and refer to a set of start and end bus terminals, respectively. is a subset of L denoting the set of links ( i, j) for route k. B is a set of all battery types. These notations are listed in Table 2.
Table 2.
Definition of sets.
The decision variables including DWPT locations and battery capacities of each route and all the intermediate variables are listed in Table 3 and Table 4, respectively, while other model parameters are summarized in Table 5.
Table 3.
Definitions of decision variables.
Table 4.
Definitions of variables.
Table 5.
Definitions of parameters.
3.4. Objective Functions
The objective of the proposed model was to minimize total costs consisting of annual costs of charging devices, battery and energy consumption, incurred by electrifying bus transit powered by DWPT. Note that these costs are amortized based on their lifespans. The cost of charging devices denoted as Z1 is formulated as Equation (2), in which denotes the DWPT devices cost per stop including the inverter and transfer pad costs. Equation (3) represents the battery cost denoted as Z2, in which is the unit cost of the battery, and , and denote bus fleet size, battery capacity and battery service life of route k, respectively. Equation (4) is the energy consumption cost denoted as Z3, where , and are the unit energy price, number of round trips per bus annually and energy consumption among nodes, respectively.
3.5. Constraints
The model constraints were classified into several parts, including DWPT locations, energy consumption, energy supply, battery life and service life, which are discussed as follows.
3.5.1. DWPT Locations
Equation (5) ensures that a bus can only be charged at stop i where a charging device is installed. The energy supply at stop i was determined by the product of the charging rate denoted as r and charging time denoted as .
3.5.2. Energy Consumption
A set of battery types with different capacities was denoted as B, which are commonly used in the industry [17]. Equation (6) ensures that the battery capacity of buses that are operated on each route are identical, but also includes the fact that their usage may vary in different routes. Thus, Equation (7) was employed to estimate the battery weight denoted as , where is the ratio of the battery capacity over the battery weight. Then, the relationship between the actual energy consumption rate was denoted as and the base rate of electric buses denoted as E was formulated in Equation (8), in which and represent the average passenger weight and net bus weight, respectively. With Equation (9), the energy consumption between stops i and j of route k can be determined. Equation (10) ensures that each BEB is fully charged when departing from a terminal. Equation (11) ensures that the battery level is restricted to always be higher than the lower limit and provide enough energy for traveling to the next stop.
3.5.3. Energy Supply
When a bus traverses link ( i, j), and are the energy consumption on the link and energy supply at stop j of route k, respectively. Then, the battery level denoted as was formulated as Equation (12) to ensure that this level would not exceed the upper bound denoted as .
3.5.4. Battery Service Life Estimation
As discussed earlier in the literature review, battery service life, which has vital importance for battery costs, has been proven to be closely related to DOD, which is jointly affected by battery capacity and DWPT locations. In this study, the lithium battery commonly used for BEBs was employed. For instance (see Figure 2), a bus can be recharged as it serves the passengers at stops with DWPT devices (i.e., stops 3, 7, 10, 13 and 18). Equation (13) was applied to find the greatest DOD. The correlation between theoretical battery service life-cycle denoted as and DOD denoted as was simulated [24,29] and formulated as Equation (14). Equation (15) was employed to estimate the battery service life. Figure 3 shows the non-linear regression curve representing battery service life and DOD. It was found that when the DOD increases from 15% to 80%, the battery service life drops from 12.7 to 1.1 years.
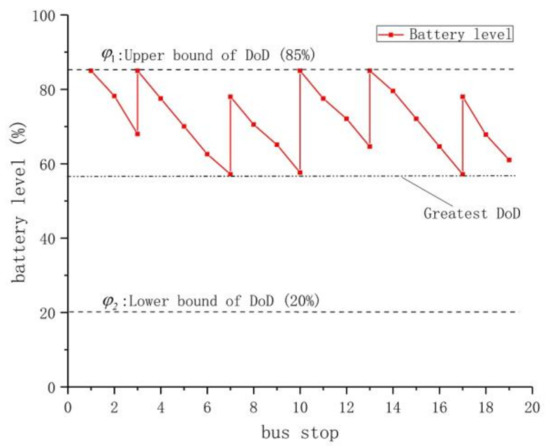
Figure 2.
Sample battery level.
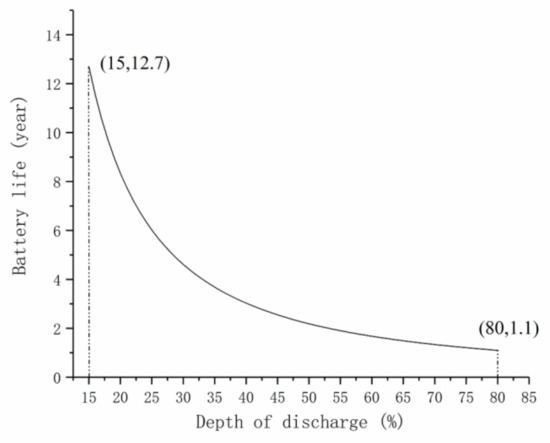
Figure 3.
Battery service life vs. depth of discharge (DOD) (Estimated by using the rainflow algorithm).
4. Solution Algorithm
The formulated model is a mixed integer non-linear problem, which can only be optimized in small cases. Thus, a tangible GA was designed for this step to solve the model efficiently. It is commonly acknowledged that GA, as one of the most popular and mature evolutionary algorithms, is able to deal with complicated problems [30] and to find an optimal solution robustly and efficiently [31]. The step procedure of the designed GA is illustrated in Figure 4, which begins with the initialization of a group of feasible populations. Then, objectives and constraints are employed to sort and evaluate the chromosomes. The crossover and mutation are specially designed, which are explained next. This process is repeated until the maximum number of generations is yielded.
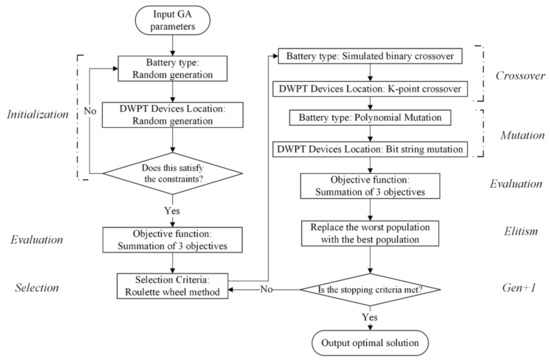
Figure 4.
Step procedure of the proposed genetic algorithm (GA).
4.1. Initialization
The chromosome is represented in Figure 5, where it is divided into two parts. The first part represents the battery type decision. The integer numbers in accordance with the battery type v assigned to each bus route k were randomly initialized from set B. For the second part, 0 or 1 was randomly assigned to every bus stop excluding bus terminals to represent whether DWPT devices are installed or not. Note that the energy constraints Equations (5)–(10) were employed in “constraints sorting” to ensure that every initialized solution is feasible.
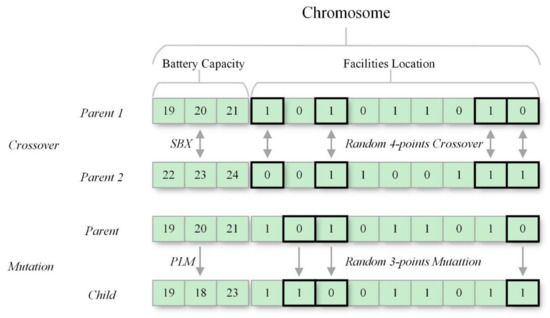
Figure 5.
Sample chromosome representation.
4.2. Initialization
Crossover plays a vital role in GA, which directly affects its speed and efficiency when searching for the solution. In this section, two different crossover operators are separately designed in accordance with the chromosome discussed earlier.
As shown in Figure 5, a simulated binary crossover (SBX) was developed for the first part (battery types). Different from other crossover operators for real parameter values, SBX has two special properties which enable the crossover operator to calculate self-adaptively, further accelerating the convergence of the algorithm
- The child solutions were generated proportionately to the difference between two selected parent solutions.
- Near parent solutions were more inclined to be chosen as child solutions.
The procedure of SBX in this research was as follows: and represent two selected parent solutions while and represent two child solutions, in which superscriptions n and n + 1 denote the parent and child generations, respectively. Firstly, Equation (16) initializes a parameter proportionate to the difference between parent and child solutions, which was employed to formulate a probability function in Equation (17). is an input distribution index. A smaller indicates a reduced probability of generating near parent solutions.
Equation (19) denotes the ordinate , where the randomly generated number q is employed to transform the probability curve from to q.
Then, two child solutions and were obtained in Equations (20)–(21).
For the second part (DWPT locations) in the crossover process (see Figure 5), we randomly chose several genes in parent chromosomes and switch them to generate child chromosomes.
4.3. Mutation
The mutation operator also attaches great importance to GA, which could consecutively affect the performance and convergence of GA [32]. Like the crossover designed earlier, mutation operators were designed in accord with the two decision variables set in the chromosome.
For the first part (battery types), several studies have demonstrated that polynomial mutation (PLM) shows better performance in a real-number-coded GA [33,34]. Thus, PLM was designed for , the procedure of which is presented as follows. Firstly, a polynomial distribution function is formulated in Equation (22), which is generated by a random generated number h and an input distribution index a. A smaller a indicates a reduced probability of generating near parent solutions.
Equation (23) defines the allowed perturbation denoted as between parent solution and child solution , where m denotes the chromosomes chosen to be mutated. Meanwhile, U and L represent the upper and lower limits of the solution. Thus, the child solution can be formulated as Equation (24).
For the second part (DWPT locations) in the mutation process (see Figure 5), we randomly chose several genes in the parent chromosomes and inverse them to generate child chromosomes.
5. Case Study
In this section, we employed a small-scale generalized multi-route bus network based on the real bus network from Xi’an China (see Figure 6), for which the developed MINLP model and GA were employed to simultaneously determine the optimal DWPT locations at bus stops and battery capacity. The bus stops in the system were already selected and located by the Xi’an transit agency according to the Xi’an urban transit planning and street pattern. The travel distances between the stops were estimated and collected from GIS, and the average passenger loads were assumed based on the historical data from Xi’an transit agency. The test bus network consisted of three bus routes, which are all bidirectional. Thus, all stops except the end stop of bus route should be labeled twice for in-bound and out-bound services. As illustrated in Table 6 and Figure 7, buses on route 1 start from stop 1 with a fully charged battery and end at stop 20. The layover time at stop 20 is 20 min. The fleet size and total distance (bi-direction) of the route are six buses and 19.6 km, respectively. Similar information for routes 2 and 3 is also listed in Table 6. Note that some bus stops are shared by multiple routes. The developed GA was coded and executed in MATLAB 2019.
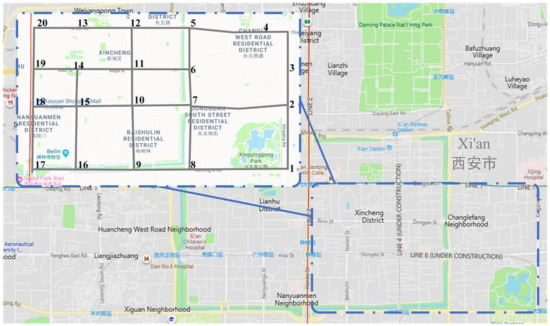
Figure 6.
The study bus network in Xi’an, China.
Table 6.
Route information of the study bus network.
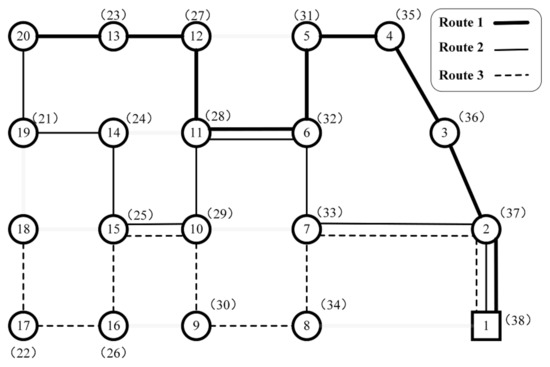
Figure 7.
The simplified link-node diagram of the study bus network.
5.1. Model. Parameters
The parameters need to be determined to evaluate energy consumption of each bus route and corresponding cost. The base energy consumption of a BEB was set as 2 kWh/mile (1.24 kWh/km) [22,29], which is only related to the weight of bus (including the weight of passenger and battery) and travel distance. The wireless charger power rate was assumed to be 100 kW [19,22]. The daily number of round trips per bus was estimated as 5, thus the annual number of round trips per bus became 1825. As suggested in previous studies [6,29], (coefficient between battery weight and battery capacity) and (coefficient between bus weight and energy consumption) were set as 0.13 kWh/kg and 45% [29]. Table 7 illustrates eight different battery types and corresponding capacities used in this study [22].
Table 7.
Battery types and corresponding capacities.
The service life of the DWPT device installed at the bus stop in this paper was set as 10 years. denotes the amortized unit cost for installing DWPT devices cost in one bus stop. is the unit cost for purchasing battery, which would also be amortized over its service life. The annual unit price of the DWPT devices installed at one bus stops including one inverter and 25-m power transfer pads is 2500 $/yr [4]. The unit price of battery is 500 $/kWh [29]. is the amortized unit energy cost per bus, which is calculated by the unit price of electricity (0.15 $/kWh) multiplying the number of annual round trips per bus (1825). Likewise, the annual greenhouse gas (GHG) emissions denoted as consists of the incurred emissions for producing DWPT devices, the battery and the consumed electricity while operating BEBs. As formulated in Equation (25), the parameters , and denote unit emission costs for DWPT devices, the battery and the consumed energy, respectively. All parameter values applied to compute were suggested by a previous study [6] and illustrated in Table 5. Regarding the GA, the input calculation parameters were determined experimentally and listed in Table 8.
Table 8.
Input GA parameters setting.
5.2. Results Analysis
Based on the optimized results and analyses, the relation among output results and input parameters was explored, which may further provide policy-makers with advice on adopting an electric bus system powered by DWPT technology under different scenarios. It is worth noting that we only considered annual energy consumption cost in accordance with the units of amortized battery and charging device costs.
The optimized results of the DWPT-powered electric bus system were compared with those of the stationary charging system. The corresponding output is listed in Table 9. It is worth noting that the stationary charging devices at bus terminals were not considered in the model due to the fact that both systems need to install them in bus terminals and that could not influence the final results.
Table 9.
Optimized results between bus systems with DWPT and stationary charging.
Table 9 indicates that all three bus routes with DWPT require smaller batteries than those with stationary charging. It was also found that the battery service life of these routes is just slightly deviating within a small margin (between 2.0 and 2.3 years) to yield the optimized output. It could also be explained by Equation (3) that a slight change of battery service life could cause a substantial rise in the battery cost and this depends on the trade-off between battery capacity and the number of DWPT devices in the bus system.
Figure 8 illustrates that the optimized total cost of the system with stationary charging is 352,590.5 $/yr, whereas the cost with DWPT could be significantly cut down to 199,602.5 $/yr (i.e., a 43% reduction). This indicates that the extra cost incurred by DWPT is much lower than the cost reduced by a smaller battery, further demonstrating the economic benefits of DWPT systems. Meanwhile, the GHG emissions with DWPT are 566,323.8 kg/yr, 14.4% lower than that with stationary charging bus system (661,414.9 kg/yr), which are determined by Equation (25). The optimized number of DWPT devices is 16, which are highlighted in gray and shown in Figure 9. It was observed that the DWPT devices are primarily suggested to be placed at the stops serving multiple bus routes. There are only two devices placed at the stops that only serve a single bus route (e.g., stops 3, 35), 10 devices placed at the stops shared by two routes (e.g., stops 6, 7, 10, 11, 15, 25, 28, 29, 32, 33), two devices shared by three routes (e.g., stops 2 and 37) and two devices located at the end of the routes (e.g., stops 18 and 20).
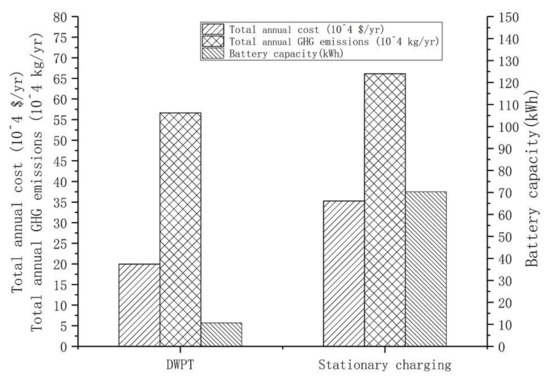
Figure 8.
Optimized results between bus systems powered by DWPT and stationary charging.
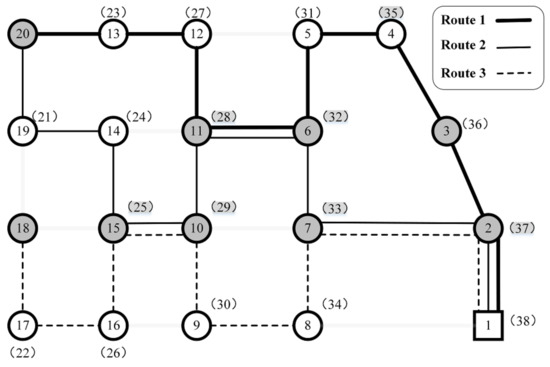
Figure 9.
Optimized locations of DWPT devices.
5.3. Sensitivity Analysis
A sensitivity analysis was conducted to explore the relation among decision variables, model parameters and the minimized costs. Values of some critical parameters, including battery unit price ($/kWh), wireless charging power rate (kW) and DWPT devices cost ($/yr) (e.g., inverter cost and transfer pad cost), were varied with certain range. The corresponding values of GHG emissions, number of DWPT devices, average battery capacity and average battery service life are displayed in Figure 10, Figure 11 and Figure 12. The baseline results are highlighted by gray-shaded areas. It is worth noting that the optimized results are sensitive to the changes in the parameters and shall be considered carefully by the policy makers.
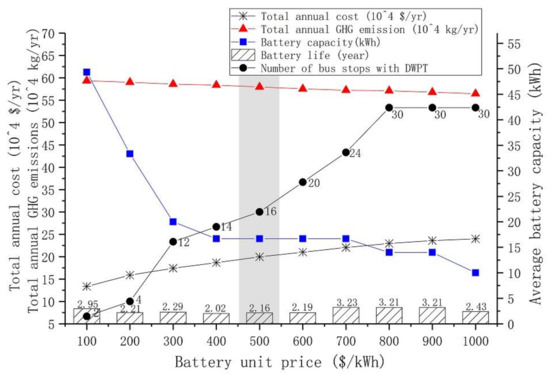
Figure 10.
Optimized results vs. battery unit price.
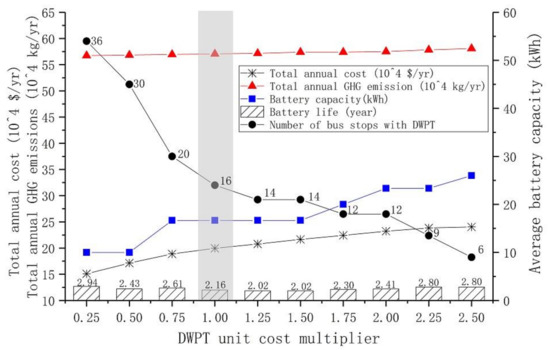
Figure 11.
Optimized results vs. DWPT unit cost multiplier.
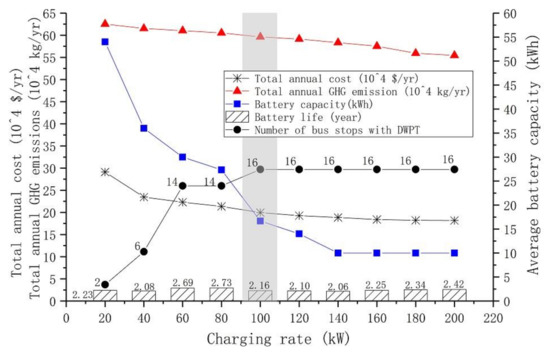
Figure 12.
Optimized results vs. wireless charging power rate.
Figure 10 shows that the total cost increases as the battery unit price goes up. The increase of the unit battery price leads to a substantial rise in the number of DWPT devices (from 2 to 30), while the average battery capacity decreases from 62.3 to 10 kWh. The GHG emissions slightly decreases because the emissions reduced by the decreased battery capacity are higher than that incurred by using more DWPT devices.
In Figure 11, the total cost increases as the DWPT cost multiplier increases. The increase of the unit DWPT cost results in a significant decrease in the number of DWPT devices (from 36 to 6), while average battery capacity increases from 12.3 to 27.3 kWh. The incurred GHG emissions slightly increase due to the trade-off between the changes of battery capacity and the number of DWPT devices.
In Figure 12, the total cost and the GHG emissions drop as the wireless charging power rate increases due to the smaller battery employed in the bus network. The optimal number of DWPT devices rises and remains at 16, which results in a significant decrease in the battery capacity from 55 to 10 kWh. It can be explained by Equation (12) that although a higher wireless charging power rate indicates that the BEB can recharge more power when driving through or dwelling at the bus stops with DWPT during the same period of time, the upper bound limits its recharging process in spite of the higher rate.
5.4. Energy Consumption Analysis
In this study, the energy consumption was assumed to be 1.24 kWh/km, but under real bus operations, it varies with different conditions (e.g., ambient temperatures, operating speed and stop spacing etc.). If those factors are ignored by decision makers, then some issues may arise for a DWPT electric bus system. In the extreme case where the deviation of energy consumption from expected values is substantially large, then electric buses may run out of battery power before they return to the bus terminal.
5.4.1. Ambient Temperature
Considering that the standard 12-m BEBs are employed in the study network, the corresponding energy consumptions for air conditioning and heating under different ambient temperatures suggested by a previous study [17] are listed in Table 10. To calculate the energy consumption rate under different temperatures, Equation (7) can be replaced by Equation (26), in which is the air condition (AC) power and the bus operating speed denoted as V is 25 km/h. As the temperature decreases from 15 °C to −15 °C or increases from 15 °C to 30 °C (listed in Table 10), extra energy consumption may incur due to the on-board heating or cooling air condition system. The corresponding number of DWPT devices, average battery capacity and average battery service life are displayed in Figure 13. It was found that when the temperature varies from −15 °C to 30 °C, the number of DWPT devices remains at 14, while the average battery capacity decreases from 38 kWh (−15 °C) to 23.33 kWh (15 °C) due to more electricity consumed for heating, then slight increases to 26.67 kWh (30 °C) due to more electricity being consumed for cooling, which implies that the battery capacity may be more sensitive to the changes in the temperature in the electric bus system powered by DWPT.
Table 10.
Average auxiliary power of an AC system for standard 12-m BEB.
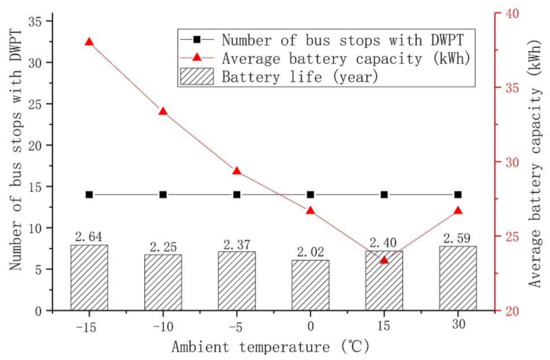
Figure 13.
Optimized DWPT devices and battery capacity vs. ambient temperature.
5.4.2. Bus Operating Speed
Bus operating speed is affected by many factors (e.g., traffic congestion, road conditions and operating policy, etc.). Decreased speed results in longer travel time and greater energy consumption (e.g., heating and AC systems). To approximate the consumed energy under different operating speeds, Equation (7) can also be replaced by Equation (26) in which ambient temperature is assumed to be 15 °C and the bus operating speed varies from 40 to 15 km/h. The optimized number of DWPT devices, average battery capacity and average battery service life are shown in Figure 14. It was found that when the operating speed decreases from 40 to 15 km/h, the number of stops with DWPT devices remains at 14 and the fleet average battery capacity increases from 19.33 to 37.33 kWh.
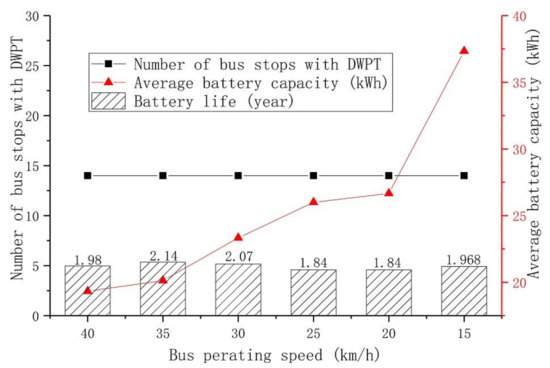
Figure 14.
Optimized DWPT devices and battery capacity vs. operating speed.
5.4.3. Bus Stop Spacing
The bus stop spacing may vary in different bus systems (e.g., an urban bus system or suburban bus system). Varied bus stop spacing may result in the change in the energy consumption between bus stops. To investigate how the bus stop spacing affects the optimization of the model, the values of the distance between two consecutive bus stops in this bus system are varied with certain range. As shown in Figure 15, as the bus stop spacing increases, both the optimized number of DWPT devices and average battery capacity increase due to more energy consumption caused by increased bus stop spacing, while the battery service life still remains between 2.0 and 3.0 years.
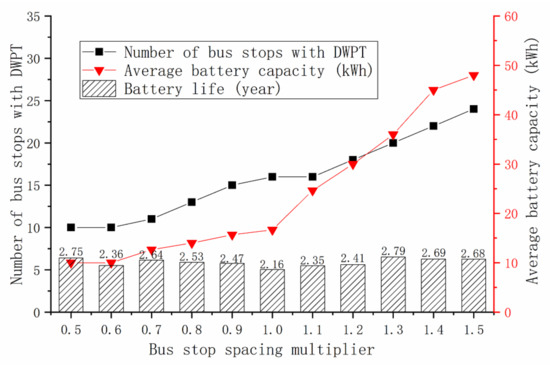
Figure 15.
Optimized DWPT devices and battery capacity vs. bus stop spacing.
5.5. Emission Analysis
A scenario analysis was conducted here to investigate the impact of the GHG emissions. A mechanism established by the U.S. Environmental Protection Agency (EPA) was employed to evaluate its impact. The objective function Equation (1) can be replaced by Equation (27), in which the costs and emissions can be jointly considered in one objective function with the given unit cost of emissions denoted as ($/ton), is the total summation of cost and emission, is total annual costs ($/yr) and is the total annual GHG emissions (kg/yr).
As shown in Figure 16, with an increase of (from 1 to 500), the optimal number of DWPT devices slightly increases and then remains at 20 while the average battery capacity tends to decrease, which indicates that DWPT may help reduce the GHG emissions of the bus system.
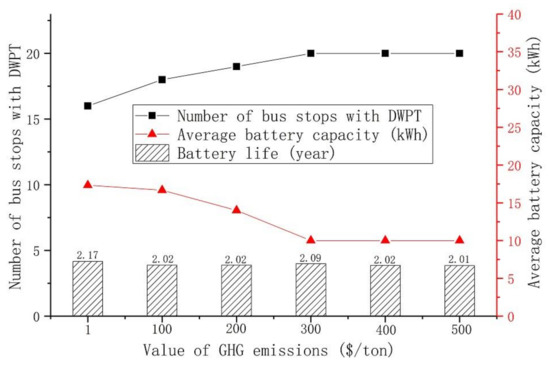
Figure 16.
Optimized DWPT devices and battery capacity vs. GHG emissions.
6. Conclusions
In this paper, an innovative MINLP model was developed based on a multi-route DWPT-powered bus network in an open environment. DWPT locations and battery capacity were simultaneously optimized with consideration of the impact of battery weight and battery service life. A tangible GA consisting of specially designed crossover and mutation operators was proposed to effectively solve a case study based on a real bus network from Xi’an, China.
The optimized results and corresponding analyses indicate the relationship among the minimized costs, GHG emissions, battery service life, battery capacity and DWPT locations based on varying key parameters, including battery unit price, DWPT cost, charging rate, ambient temperature, operating speed and GHG emissions. The major observations include that:
- The optimized total cost of a DWPT-powered bus system can be significantly reduced compared with that powered by a stationary charging system.
- The average battery service life is affected by battery capacity and the number of DWPT devices deployed, which slightly deviates between 2 and 3 years.
- More DWPT devices could be installed if the battery unit price is higher, wireless charging power rate is lower, DWPT cost is lower and the impact of the GHG emissions is considered. The deployment of DWPT seems to not be sensitive to the ambient temperature and operating speed.
The immediate extension of this study would involve developing appropriate models and tools to comprehensively determine bus routing, DWPT locations and battery capacity based on the bus system powered by DWPT. A model that analytically integrates the DWPT system optimization with the BEB charging coordination at bus terminals would also be a desirable extension.
Author Contributions
Conceptualization, S.C. and G.C.; methodology, S.C. and G.C.; software, G.C.; validation, D.H.; data curation, L.G. and M.L.; writing—original draft preparation, G.C.; writing—review and editing, S.C. and G.C.; supervision, D.H. All authors have read and agreed to the published version of the manuscript.
Funding
This research was funded in part by National Nature Science Foundation of China under Grant U1664264 and 51878066, in part by the Funds for Central Universities and Colleges of Chang’an University under grant 300102229304, 300102229201 300102220204 and 300102229111, in part by National Key R&D Program of China under grant 2020YFC1512004, in part by China Scholarship Council under grant 201806560035 and in part by Xi’an Technology Program under grant 2019218514GXRC021CG022 -GXYD21.5.
Acknowledgments
We would like to express our gratitude to two anonymous reviewers for their precious comments to improve our research.
Conflicts of Interest
The authors declare no conflict of interest.
References
- Xylia, M.; Leduc, S.; Patrizio, P.; Kraxner, F.; Silveira, S. Locating charging infrastructure for electric buses in Stockholm. Transp. Res. Part C Emerg. Technol. 2017, 78, 183–200. [Google Scholar] [CrossRef]
- Yong, J.Y.; Ramachandaramurthy, V.K.; Tan, K.M.; Mithulananthan, N. A review on the state-of-the-art technologies of electric vehicle, its impacts and prospects. Renew. Sustain. Energy Rev. 2015, 49, 365–385. [Google Scholar] [CrossRef]
- Jeong, S.; Jang, Y.J.; Kum, D. Economic Analysis of the Dynamic Charging Electric Vehicle. IEEE Trans. Power Electron. 2015, 30, 6368–6377. [Google Scholar] [CrossRef]
- Liu, Z.; Song, Z. Robust planning of dynamic wireless charging infrastructure for battery electric buses. Transp. Res. Part C Emerg. Technol. 2017, 83, 77–103. [Google Scholar] [CrossRef]
- Jang, Y.J.; Suh, E.S.; Kim, J.W. System Architecture and Mathematical Models of Electric Transit Bus System Utilizing Wireless Power Transfer Technology. IEEE Syst. J. 2016, 10, 495–506. [Google Scholar] [CrossRef]
- Bi, Z.; Song, L.; De Kleine, R.; Mi, C.C.; Keoleian, G.A. Plug-in vs wireless charging: Life cycle energy and greenhouse gas emissions for an electric bus system. Appl. Energy 2015, 146, 11–19. [Google Scholar] [CrossRef]
- Wirges, J.; Linder, S.; Kessler, A. Modelling the development of a regional charging infrastructure for electric vehicles in time and space. Eur. J. Transp. Infrastruct. Res. 2012, 12, 391–416. [Google Scholar] [CrossRef]
- Mu, Y.; Wu, J.; Jenkins, N.; Jia, H.; Wang, C. A Spatial-Temporal model for grid impact analysis of plug-in electric vehicles. Appl. Energy 2014, 114, 456–465. [Google Scholar] [CrossRef]
- Tu, W.; Li, Q.; Fang, Z.; Shaw, S.; Zhou, B.; Chang, X. Optimizing the locations of electric taxi charging stations: A spatial–temporal demand coverage approach. Transp. Res. Part C Emerg. Technol. 2016, 65, 172–189. [Google Scholar] [CrossRef]
- Usman, M.; Knapen, L.; Yasar, A.-U.-H.; Vanrompay, Y.; Bellemans, T.; Janssens, D.; Wets, G. A coordinated Framework for Optimized Charging of EV Fleet in Smart Grid. Procedia Comp. Sci. 2016, 94, 332–339. [Google Scholar] [CrossRef]
- Frade, I.; Ribeiro, A.; Gonçalves, G.; Antunes, A.P. Optimal Location of Charging Stations for Electric Vehicles in a Neighborhood in Lisbon, Portugal. Transp. Res. Rec. J. Transp. Res. Board 2011, 2252, 91–98. [Google Scholar] [CrossRef]
- Ko, J.; Shim, J.-S. Locating battery exchange stations for electric taxis: A case study of Seoul, South Korea. Int. J. Sustain. Transp. 2014, 10, 139–146. [Google Scholar] [CrossRef]
- Shahraki, N.; Cai, H.; Turkay, M.; Xu, M. Optimal locations of electric public charging stations using real world vehicle travel patterns. Transp. Res. Part D Transp. Environ. 2015, 41, 165–176. [Google Scholar] [CrossRef]
- Liu, H.; Wang, D.Z.W. Locating multiple types of charging facilities for battery electric vehicles. Transp. Res. Part B Methodol. 2017, 103, 30–55. [Google Scholar] [CrossRef]
- He, S.Y.; Kuo, Y.; Wu, D. Incorporating institutional and spatial factors in the selection of the optimal locations of public electric vehicle charging facilities: A case study of Beijing, China. Transp. Res. Part C Emerg. Technol. 2016, 67, 131–148. [Google Scholar] [CrossRef]
- He, Y.; Song, Z.; Liu, Z. Fast-Charging Station Deployment for Battery Electric Bus Systems Considering Electricity Demand Charges. Sustain. Cities Soc. 2019, 48, 101530. [Google Scholar] [CrossRef]
- Kunith, A.; Mendelevitch, R.; Goehlich, D. Electrification of a city bus network—An optimization model for cost-effective placing of charging infrastructure and battery sizing of fast-charging electric bus systems. Int. J. Sustain. Transp. 2017, 11, 707–720. [Google Scholar] [CrossRef]
- Ko, Y.D.; Jang, Y.J. The Optimal System Design of the Online Electric Vehicle Utilizing Wireless Power Transmission Technology. IEEE Trans. Intell. Transp. Syst. 2013, 14, 1255–1265. [Google Scholar] [CrossRef]
- Jang, Y.J.; Jeong, S.; Ko, Y.D. System optimization of the On-Line Electric Vehicle operating in a closed environment. Comp. Ind. Eng. 2015, 80, 222–235. [Google Scholar] [CrossRef]
- Liu, Z.; Song, Z.; He, Y. Optimal Deployment of Dynamic Wireless Charging Facilities for an Electric Bus System. Transp. Res. Rec. J. Transp. Res. Board 2017, 2647, 100–108. [Google Scholar] [CrossRef]
- Wang, X.; Yuen, C.; Hassan, N.U.; An, N.; Wu, W. Electric Vehicle Charging Station Placement for Urban Public Bus Systems. IEEE Trans. Intell. Transp. Syst. 2017, 18, 128–139. [Google Scholar] [CrossRef]
- Chen, G.; Hu, D.; Chien, S. Optimizing Battery-Electric-Feeder Service and Wireless Charging Locations With Nested Genetic Algorithm. IEEE Access 2020, 8, 67166–67178. [Google Scholar] [CrossRef]
- Dunn, J.B.; Gaines, L.; Sullivan, J.; Wang, M.Q. Impact of Recycling on Cradle-to-Gate Energy Consumption and Greenhouse Gas Emissions of Automotive Lithium-Ion Batteries. Environ. Sci. Technol. 2012, 46, 89–99. [Google Scholar] [CrossRef] [PubMed]
- You, S.; Rasmussen, C.N. Generic modelling framework for economic analysis of battery systems. Proceedings of IET Conference on Renewable Power Generation, Edinburgh, UK, 6–8 September 2011; pp. 1–6. [Google Scholar]
- Sathre, R.; Scown, C.D.; Kavvada, O.; Hendrickson, T.P. Energy and climate effects of second-life use of electric vehicle batteries in California through 2050. J. Power Sources 2015, 288, 82–91. [Google Scholar] [CrossRef]
- Bi, Z.; Kan, T.; Mi, C.C.; Zhang, Y.; Zhao, Z.; Keoleian, G.A. A review of wireless power transfer for electric vehicles: Prospects to enhance sustainable mobility. Appl. Energy 2016, 179, 413–425. [Google Scholar] [CrossRef]
- Lajunen, A.; Lipman, T. Lifecycle cost assessment and carbon dioxide emissions of diesel, natural gas, hybrid electric, fuel cell hybrid and electric transit buses. Energy 2016, 106, 329–342. [Google Scholar] [CrossRef]
- Lajunen, A. Lifecycle costs and charging requirements of electric buses with different charging methods. J. Clean. Prod. 2018, 172, 56–67. [Google Scholar] [CrossRef]
- Bi, Z.; Keoleian, G.A.; Ersal, T. Wireless charger deployment for an electric bus network: A multi-objective life cycle optimization. Appl. Energy 2018, 225, 1090–1101. [Google Scholar] [CrossRef]
- Harik, G.R.; Lobo, F.G.; Goldberg, D.E. The compact genetic algorithm. IEEE Trans. Evol. Comput. 1999, 3, 287–297. [Google Scholar] [CrossRef]
- Kratica, J.; Tošic, D.; Filipović, V.; Ljubić, I. Solving the simple plant location problem by genetic algorithm. RAIRO Oper. Res. 2001, 35, 127–142. [Google Scholar] [CrossRef]
- Leung, Y.W.; Wang, Y. An orthogonal genetic algorithm with quantization for global numerical Optimizationg. IEEE Trans. Evol. Comput. 2002, 5, 41–53. [Google Scholar] [CrossRef]
- Zeng, G.; Chen, J.; Li, L.; Chen, M.; Wu, L.; Dai, Y.; Zheng, C. An improved multi-objective population-based extremal optimization algorithm with polynomial mutation. Inf. Sci. 2016, 330, 49–73. [Google Scholar] [CrossRef]
- Jensen, M.T. Reducing the Run-Time Complexity of Multiobjective EAs: The NSGA-II and Other Algorithms. IEEE Trans. Evol. Comput. 2003, 7, 503–515. [Google Scholar] [CrossRef]


Publisher’s Note: MDPI stays neutral with regard to jurisdictional claims in published maps and institutional affiliations. |
© 2020 by the authors. Licensee MDPI, Basel, Switzerland. This article is an open access article distributed under the terms and conditions of the Creative Commons Attribution (CC BY) license (http://creativecommons.org/licenses/by/4.0/).