Article

Iceberg Indicators for Sow and Piglet Welfare

1
Institute of Animal Breeding and Husbandry, Christian-Albrechts-University, Olshausenstr. 40, 24098 Kiel, Germany
2
Institute for Animal Hygiene, Animal Welfare and Farm Animal Behaviour, University of Veterinary Medicine Hannover, Foundation, Bischofsholer Damm 15, 30173 Hannover, Germany
*
Author to whom correspondence should be addressed.
Sustainability 2020, 12(21), 8967; https://doi.org/10.3390/su12218967
Submission received: 30 September 2020 / Revised: 25 October 2020 / Accepted: 26 October 2020 / Published: 28 October 2020
(This article belongs to the Special Issue Animal Welfare and the United Nations Sustainable Development Goals)

Abstract

:
This study identifies iceberg indicators for welfare assessment in sows and piglets to enhance feasibility and sustainability of available protocols. Indicators of the Welfare Quality® protocol and of a German protocol were collected over 65 farm visits to 13 farms in Germany between September 2016 and April 2018. Data were analysed using partial least square structural equation modelling (PLS-SEM). A hierarchical component model was built (animal welfare = higher-order, Welfare Quality® principles = lower-order components). In sows, welfare was revealed to be most influenced by the principles good housing, good health and appropriate behaviour (path coefficients = 0.77, 0.86, 0.91). High coefficients of determination R2 indicated a large amount of explained variance (good housing R2 = 0.59, good health R2 = 0.75, appropriate behaviour R2 = 0.83). Stereotypies was the indicator most valuable to assess sow welfare. Additionally, the final model included the indicators panting, shoulder sores, metritis, mortality and an indicator assessing stereotypies in resting animals (indicator reliabilities 0.54–0.88). However, the model did not include the indicators lameness and body condition, which may be due to the farm sample. Welfare of piglets was most explained by the indicators carpal joint lesions, mortality, sneezing and undersized animals (indicator reliabilities 0.48–0.86).

1. Introduction

Scientifically based animal welfare assessment systems not only have an important role to play in the objective assessment of animal welfare [1], but should also be applied in the interest of sustainability [2]. When referring to sustainable animal husbandry, aspects such as animal health, environmental protection, productivity, food safety, food quality but also cost-effectiveness of production are related [3]. In this context, animal welfare is more than of ethical importance; it can also be used to maintain markets for animal products or to create new markets as public awareness and the importance of animal welfare is constantly growing. Therefore, any animal husbandry aiming at sustainable production should also maximise animal welfare and avoid potential negative impacts on the animals. The assessment of animal welfare should again be scientifically validated [2].
From a scientific point of view, animal welfare is considered a multidimensional construct [4]. The Welfare Quality® protocols, which were developed under scientific guidance as objective, i.e., valid and reliable, systems for the assessment of animal welfare in cattle, pigs and poultry [1], reflected this multidimensionality in four main principles: good feeding, good housing, good health and appropriate behaviour. Within the protocols, the principles were divided into twelve complementary but independent criteria, for which mainly animal-based indicators consisting of behavioural and physical observations were defined. Applying the indicators of these four principles, it is supposed to be possible to identify the main welfare issues in cattle, pigs and poultry [1]. However, the feasibility of the Welfare Quality® protocols has often been questioned. For example, a complete assessment in pigs can take up to eight hours [5]. Thus, the extent of the protocols restricts their applicability in practice [6,7,8,9].
Therefore, research is being conducted regarding possibilities to reduce the length of the protocols without losing accuracy. In pigs, these attempts considered, for example, the exclusion of highly correlated indicators, the replacement of assessments on-farm through assessments at the slaughterhouse, a reduction of the sample size or the elimination of indicators with low prevalence [10]. Another possible approach is using so-called iceberg indicators. Certain iceberg indicators are intended to provide an overall assessment of animal welfare, just as the visible tip of an iceberg reflects its invisible mass below the water surface. Iceberg indicators combine several indicators in one indicator, so that the variance in animal welfare is preserved and animal welfare can still be measured in its entirety [11].
The present study is the first of its kind that had the aim of reducing the Welfare Quality® protocol for sows and piglets to certain iceberg indicators. To do this, it applied partial least square structural equation modelling (PLS-SEM). These models were designed to allow the measurement of latent variables such as animal welfare and its associated principles of good feeding, good housing, good health and appropriate behaviour. For this purpose, the measurable indicators explaining the highest variance in the latent variables were included in the models via calculation of various algorithms, which simultaneously led to a reduction of the indicators to be recorded [12]. The models were originally designed for the economic sector [12,13,14], but are increasingly used in agricultural research, e.g., for the estimation of efficiency on farms or the measurement of latent variables such as positive emotions in pigs [15,16]. The Welfare Quality® protocol for sows and piglets was considered the gold standard for the assessment of welfare in sows and piglets and therefore the Welfare Quality® principles were used to construct the models [17]. Additional animal-based indicators of a German animal welfare assessment protocol [18] were recorded and included in the models but the indicators were sorted into the existing principles. With its results, the present study contributes to the practical application of animal welfare assessment systems and moreover to maintaining or increasing the sustainability of agricultural animal husbandry.

2. Materials and Methods

2.1. Data Collection and Processing

The data collection took place on 13 sow farms in Northern Germany between September 2016 and April 2018. The farms kept sows, i.e., female pigs (Sus scrofa domestica), either lactating or pregnant, for the purpose of reproduction and their piglets, i.e., pigs from birth until weaning [17]. Each farm was visited five times within ten months (day 0, day 3, week 7, month 5, month 10). A total of 4529 sows and 469 litters were observed. Especially in the longer intervals, due to the rotation in the production cycle, different animals were present in the stables so that the farm visits could be considered independent. The farms varied in terms of farm size (40 to 5000 sows) but also with regard to production mode (conventional or organic) or housing system (e.g., stable or dynamic groups in the gestation unit).
Each farm visit included the execution of the entire Welfare Quality® protocol for sows and piglets. In doing so, the protocol’s instructions and definitions were strictly adhered to. All information on the Welfare Quality® protocol for sows and piglets can be consulted in the protocol itself [17]. Moreover, further details on the data collection/farm types can also be found in Friedrich et al. [9]. In short, assessment in sows and piglets consists of a Qualitative Behaviour Assessment to evaluate the positive affective state of the animals, instantaneous scan sampling to record social and exploratory behaviour in sows, a human–animal relationship test in sows, the measurement of stereotypies in sows and various animal-based indicators, e.g., metritis in sows and panting in piglets. The Welfare Quality® protocol is supplemented by selected management-based and resource-based indicators, e.g., age of weaning or water supply.
Additional animal-based indicators in sows and piglets were assessed beyond the Welfare Quality® protocol. On the one hand, the novel indicator to assess stereotypies in sows as introduced by Friedrich et al. [19] was recorded. This assesses whether an animal has white-foamed saliva around the snout, which can be caused by increased chewing or tongue movements in association with stereotypic behaviour [19]. On the other hand, the additional indicators originated from the guideline “Animal welfare indicators: Practical guide—Pigs” [18], a German animal welfare assessment protocol for sows and piglets for the self-monitoring of farms published by Kuratorium für Technik und Bauwesen in der Landwirtschaft e.V. (KTBL). The experts involved in the development of the guideline have identified these additional indicators, including saliva around the snout, as relevant for sow husbandry. The definitions and categorisation criteria of these additional indicators are presented in Table 1.
The data collection was performed by one observer, who has been previously trained in the execution of the Welfare Quality® protocol for sows and piglets in a three-day training course held by members of the Welfare Quality® consortium. Experts involved in the development of the German animal welfare assessment protocol for sows and piglets schooled the observer in the assessment of the additional animal-based indicators. Pictures and video sequences were used for re-training after the first half of the data collection to prevent observer drift.
For the construction of the models, the data collected were further processed using the statistical analysis software SAS 9.4 [20]. Further processing included the following steps for each farm visit: the percentage of animals with unaffected animal welfare (category 0) was calculated for the animal-based indicators with a binary score or a three-point scale. Exceptions to this were applied to the Qualitative Behaviour Assessment and the instantaneous scan sampling as well as for the resource-based indicator water supply and the management-based indicator mortality in sows: the values of the Qualitative Behaviour Assessment were combined into one value using the calculation rule for growing-finishing pigs of the Welfare Quality® protocol for growing pigs [17]. For the instantaneous scan sampling, first, the proportion of all active sows in the predefined categories was calculated. Subsequently, the categories positive and negative social behaviour, pen investigation and use of enrichment were summarised to the indicator positive behaviours. Both social behaviour, which includes negative and positive social behaviour, and exploratory behaviour are defined in the Welfare Quality® protocol as appropriate behaviour [17]. The resource-based indicator water supply was given a unique value according to the calculation rule for growing-finishing pigs as well [17]. To avoid negative correlation between the indicators in a lower-order component, which has a negative effect on construct reliability [14], the management-based indicator mortality in sows was expressed as 100—mortality in the model.
By the end of data processing, two datasets (n = 65) had been created—one for sows, one for piglets. The number of indicators per principle was comparable (between three and eight indicators per principle in sows, between two and five indicators per principle in piglets), which is a basic requirement in the construction of a model in order to achieve validity [12].

2.2. Statistical Analysis

2.2.1. Basic Design of a Structural Equation Model and Extension to a Hierarchical Component Model (HCM)

Structural equation models usually consist of an inner structural model and outer measurement models. If only one level of constructs is to be measured, they are also called first-order models.
The structural model displays the hypothetical constructs based on theoretical considerations. Additionally, the structural model represents the causal relationships between the constructs in a path model. The structural model consists of endogenous and exogenous latent variables. Latent variables which explain other variables in the structural model are called exogenous and those which are explained in the model are called endogenous.
The measurement models are used to estimate the structural relationships of the latent variables with the indicator variables or manifest variables, respectively. The measurement models link the manifest variables with the latent variables and thus enable the unobservable constructs to be measured [12].
If complex constructs with more than one level are analysed, which was the case in this study, so-called hierarchical component models (HCM) with two levels of abstraction are applied instead of the previously explained first-order structural equation model. These models consist of a higher-order component linked to several lower-order components, which in turn are explained by measurable indicators. The lower-order component reflects the subdimensions of the higher-order component, which is a rather abstract construction level [21]. A graphical explanation can be found in Krugmann et al. [16], who applied this model to the analysis of positive emotions in pigs.

2.2.2. Assumptions and Construction of the HCMs in the Present Study

The present study investigated the hypothesis that animal welfare influences the Welfare Quality® principles of good feeding, good housing, good health and appropriate behaviour and that these principles can be used to measure animal welfare. Animal welfare represents the higher-order component that cannot be measured directly. The principles correspond to the lower-order components. By applying these principles, it is expected that animal welfare can be estimated. The principles in turn are influenced by animal welfare. In this case, it must be noted that, in the welfare assessment schemes used in this study, to date no indicators for piglets to measure the principle of appropriate behaviour have been included. Consequently, only three instead of four lower-order components were used in the model for piglets.
As explained above, each lower-order component is linked to measurable indicators. The indicators were assigned to the principles as defined in the Welfare Quality® protocol. In addition, other models were tested to find the model that best explains the variance in the dataset. In doing so, the indicators were also tested with allocations to principles other than those defined in the protocol taking into account logical considerations displayed in literature [21], e.g., the indicator shoulder sores was once assigned to the principle of good feeding and once to the principle of good health as a low body condition can provide a risk of developing shoulder sores but there is also an influence of shoulder sores on sows’ health [22,23]. Only the models that most effectively explained the variance of the dataset for sows and piglets are presented in the following.
The HCMs were calculated using the SmartPLS 3.0 software by Ringle et al. [24]. The models were constructed as reflective-reflective HCMs. This means that there is a reflective relationship between the higher-order and the lower-order components and that all constructs of the lower-order components are represented by reflective measurement models. With regard to the measurement models, reflective means that the indicators represent the underlying constructs and causality manifests itself from construct to indicators [21].
A case-wise deletion was applied to account for missing values. As the missing data was spread over the visits, certain farm visits were not systematically removed. The minimum sample size was 54 farm visits for sows and 36 farm visits for piglets. In each case, the sample size was larger than the number of structure paths directed at a specific construct in the model [21].

2.2.3. Evaluation of the HCMs

The resulting HCMs were evaluated in a two-stage process, first examining the measurement models and subsequently the structural model as suggested by Hair et al. [21].
To evaluate the measurement models, the internal consistency and the convergent validity were considered. The internal consistency is mirrored by the composite reliability (CR), which respects different loadings of the indicators. Values between 0 and 1 can be obtained by CR but should be between 0.60 and 0.70 in exploratory research studies. The convergent validity is measured by the individual indicator reliability (IR) and the average variance extracted (AVE). IR quantifies how much a latent component is represented by an indicator. Therefore, indicators with an IR ≤ 0.40 should be removed from the model [12,25]. For indicators with IR between 0.40 and 0.70 it should be verified whether their exclusion improves the quality criteria of the model [21]. In addition, the exclusion of indicators should always be carefully weighed and indicators should be preserved in the model if they contribute to the content validity of the model [21]. AVE describes the level to which a latent construct accounts for the variance of the underlying indicators. Values of ≥ 0.50 should be attained.
The structural model is evaluated using the path coefficient including their relevance and statistical significance and the coefficient of determination R2. The path coefficients quantify the relationship between the higher-order and lower-order component in the model. With values between −1.00 and +1.00, both the sign and the absolute value must be taken into account when examining the path coefficients [13]. The closer a path coefficient is to +1.00, the stronger the positive relationship between two constructs. Conversely, a value of −1.00 indicates a negative relationship. Whether these relationships are statistically significant is tested by bootstrapping [21]. The coefficient of determination R2, which indicates the extent to which one component is explained by another, is solely calculated for the lower-order components since these may be influenced by other components, both lower-order or higher-order. Thus, R2 indicates which proportion of the variance of a lower-order component is explained by the associated, preceding constructs. In marketing research, values of 0.25, 0.50 and 0.75 for R2 are classified as weak, moderate and substantial. Thus, the higher R2, the better a construct is explained [12,13,21].
Finally, the datasets were randomly divided into two halves (n = 32, n = 33) using the procedure PROC SURVEYSELECT in SAS 9.4. The resulting split-half datasets were also tested in the HCM to confirm the validity of the sows’ and piglets’ model [26].

2.3. Ethical Statement

The authors declare that the study was carried out strictly following national animal welfare guidelines. The animals in the study were normally kept farm animals, which were housed according to national and European law requirements (“German Animal Welfare Act” (German designation: TierSchG) [27] and the “German Order for the Protection of Production Animals used for Farming Purposes and other Animals kept for the Production of Animal Products” (German designation: TierSchNutztV) [28]). No pain, suffering or injury was inflicted on the animals during the study.

3. Results

3.1. Data Collection and Processing

The animal-based indicators of constipation, coughing, evidence of ectoparasites or skin condition, respectively, huddling, mastitis, pumping, rectal prolapse, ruptures and hernias, scouring, sneezing and uterine prolapse in sows as well as the animal-based indicators of coughing, neurological disorder, pumping, rectal prolapse, ruptures and hernias and splay legs in piglets could not be observed during data collection. All farmers complied with national law, thus, the space allowance for sows was adequate. However, the variance in the resource-based indicator space allowance was low (standard deviation 0.80), which is why this indicator could not be included into the model. The resource-based indicator farrowing crates did not show any variance but was always present in the best manifestation. There was no variance either in the management-based indicators nose-ringing and tail-docking in sows as well as castration, tail-docking and teeth-grinding in piglets as these procedures are partly prohibited by law in Germany, e.g., nose-ringing in sows, or their implementation is regulated by law. Conclusively, the above-named indicators were not included in the HCMs.
The included indicators’ descriptive statistics are presented in Table 2 for sows and Table 3 for piglets.

3.2. Initial HCMs

  • Sows
The initial HCM for sows was constructed applying the Welfare Quality® principles of good feeding, good housing, good health and appropriate behaviour. Thus, the four principles as lower-order components were associated to one higher-order component, which was defined as animal welfare. The components were related to 20 indicators. The initial HCM for sows is presented in Figure 1.
2.
Piglets
No indicators were pre-set by the protocols to assess the principle of appropriate behaviour in piglets. Hence, only three lower-order components were used for the HCM in piglets (good feeding, good housing, good health). The components were associated to 11 indicators. Figure 2 presents the initial HCMs for piglets.

3.3. Final HCMs

The calculated HCMs were evaluated using the two-stage process and the quality criteria introduced above. This means that in the evaluation of the measurement models CR had to range between 0.60 and 0.70, AVE had to reach a value of 0.50 or higher and indicators were excluded if their IR was smaller than 0.40; the indicators’ appearance in the model was carefully reviewed if IR was between 0.40 and 0.70. In this context, the application of the rules relating specifically to IR led to the reduction of indicators and finally components. The evaluation of the structural model considered the path coefficients’ relevance and statistical significance and the coefficient of determination R2 [12,21,25].
  • Sows
The final HCM showed three remaining lower-order components for sows as can be seen in Figure 3. Besides the model itself, Figure 3 also illustrates several quality criteria of the model, i.e., IR, path coefficients and the coefficient of determination R2, which are discussed below. The components of the final HCM in sows were associated with seven indicators.
2.
Piglets
Two remaining lower-order components could be retained in the final HCM for piglets, which were related to four indicators. The final HCM with the respective quality criteria is shown in Figure 4.

3.3.1. Evaluation of the Measurement Models of the Final HCMs

The measurement models of the HCMs were evaluated for their reliability and validity using the test criteria IR, CR and AVE.
  • Sows
All indicators of the lower-order components displayed an IR ≥ 0.40 with the lowest IR being 0.77 for metritis, and thus, could be evaluated as reliable. The measurement models reached a CR ≥ 0.60. The highest CR in sows was achieved by appropriate behaviour, followed by good health and good housing. The validity of the measurement models was moreover examined by AVE, which showed values ≥ 0.50, hence, validity could be confirmed.
With regard to the higher-order component, i.e., animal welfare, the lowest IR was again achieved by metritis with IR 0.54. All indicators indicated sufficient reliability. Further, validity of the model was confirmed with respect to CR ≥ 0.60 and AVE ≥ 0.50. All values of the quality criteria are presented in Table 4.
2.
Piglets
Likewise, for piglets all indicators reached an IR ≥ 0.40 for the lower-order components with the lowest IR being 0.68 for undersized animals. The measurement models’ indicators could again be evaluated as reliable. In piglets, good health showed a higher CR than good feeding. Both passed the threshold of 0.60. The validity could be confirmed with AVE ≥ 0.50.
All quality criteria were also met for the higher-order component animal welfare. The values of the quality criteria for piglets are displayed in Table 5.

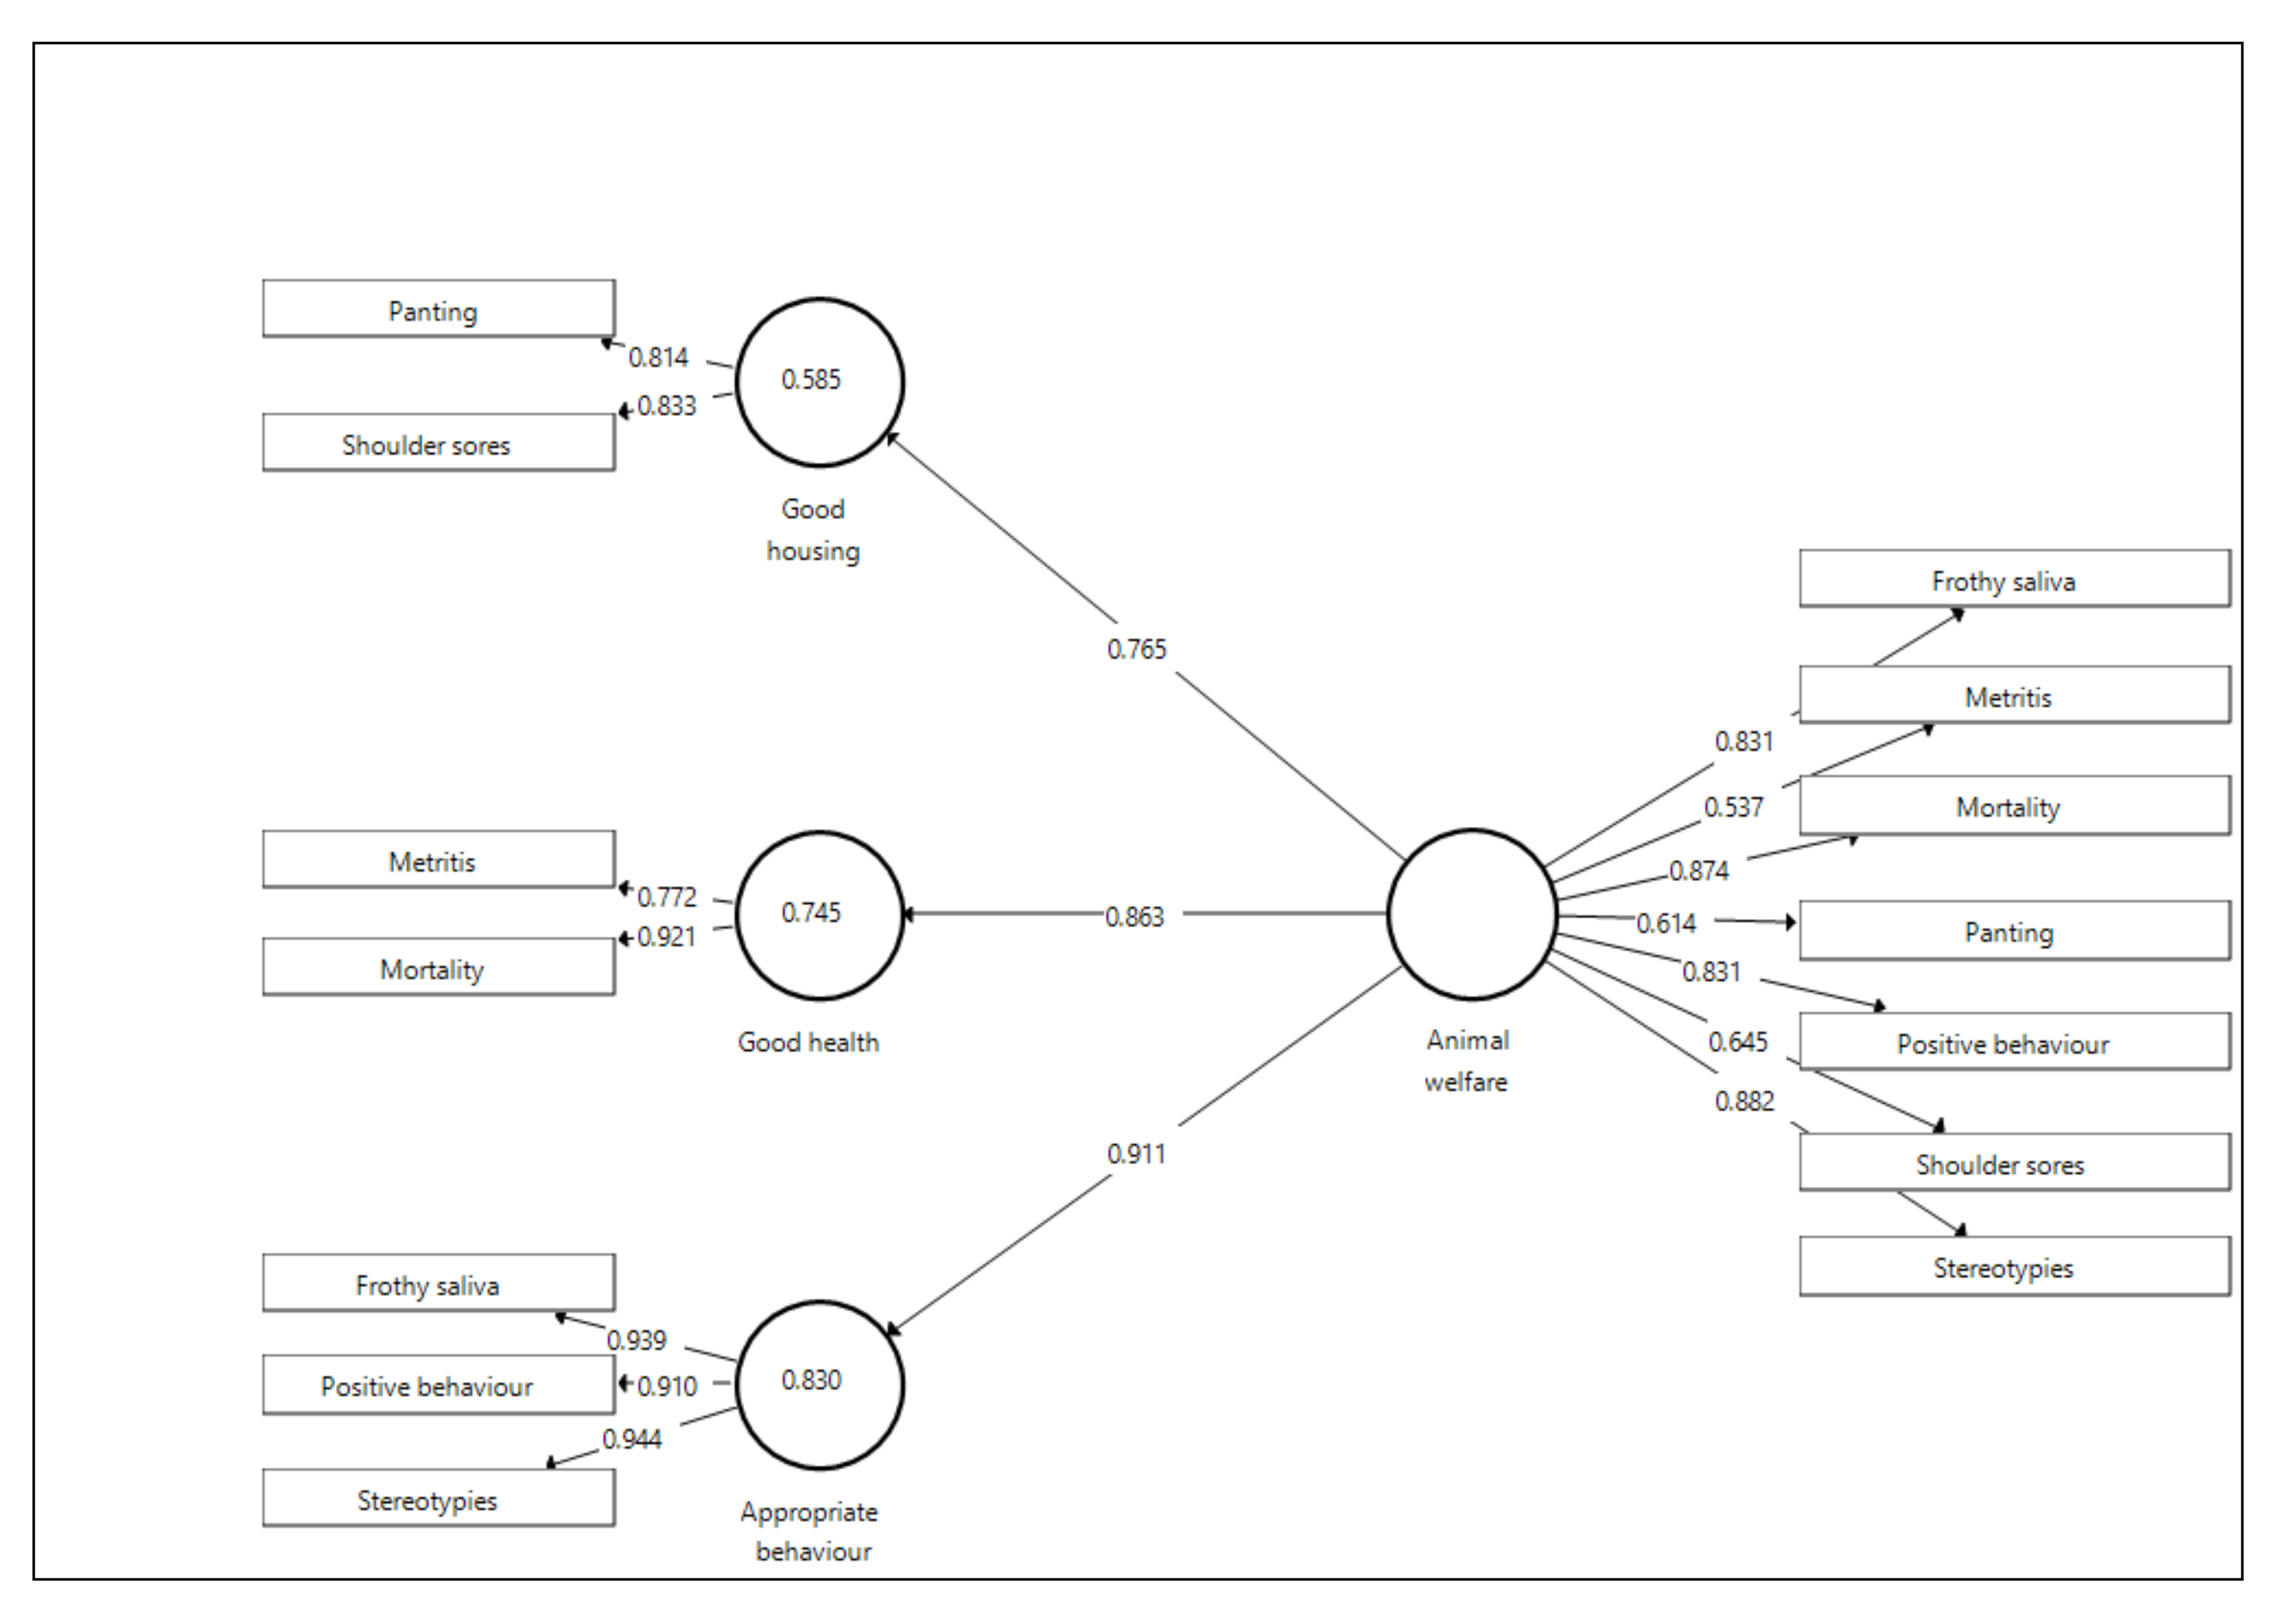
3.3.2. Evaluation of the Structural Models of the Final HCMs

The structural model was evaluated with regard to the path coefficient, their relevance and significance, and considering the coefficient of determination R2.
  • Sows
The relationships between lower-order components and the higher-order component were statistically significant (p < 0.05). Appropriate behaviour in sows was the lower-order component most influenced by animal welfare with a path coefficient of 0.91, followed by good health with a path coefficient of 0.86 and good housing with a path coefficient of 0.77 (Figure 3).
Concerning the values of R2, the structural model in sows explained 83.0% of the variance in appropriate behaviour, 74.5% in good health and 58.5% in good housing (Table 4).
2.
Piglets
Again, the relationships between lower-order components and the higher-order component were statistically significant (p < 0.05). Most affected by animal welfare in piglets was the component good health indicated by a path coefficient of 0.91, followed by good feeding with a path coefficient of 0.88 (Figure 4).
R2 indicated that 82.3% of the variance in good health and 77.0% of the variance in good feeding were explained by the structural model (Table 5).

3.3.3. Evaluation of the Split-Half HCMs

Likewise, the reliability and validity were evaluated for the split-half datasets for sows and for piglets. As a result, the quality criteria could confirm a similar tendency for both scenarios in sows and piglets as the final HCMs (Table 4 and Table 5). Again, the path coefficients presenting the relationship between higher-order component and lower-order components revealed statistical significance (p < 0.05).

4. Discussion

4.1. Data Collection and Processing and Initial HCMs

The 65 farm visits were considered independent although they were carried out on the same 13 farms. Due to the long interval of up to five months between visits, it can be assumed that different animals were observed as sows rotate through the farm as a result of the production cycle and piglets are weaned or newly born, respectively.
All data collected were converted to farm-level since the actual assessment also relied on a randomly collected sample that is meant to be representative for the farm under assessment [17]. The aggregation of data was also necessary, especially with regard to the Qualitative Behaviour Assessment and the categories of the instantaneous scan sampling, since in the design of the models it must be considered that approximately the same number of indicators is used for each component in order to avoid bias between components [21]. As there are no aggregation rules for sows and piglets for the indicators water supply and the Qualitative Behaviour Assessment, the rules for growing-finishing pigs were applied [17]. This seems appropriate as otherwise these indicators could not have been included in the models. The Qualitative Behaviour Assessment is generally proposed as an iceberg indicator to measure the animals’ positive affective state [29] and water supply as part of the criterion absence of prolonged thirst has already been mentioned as a potential iceberg indicator in cows [30]. It was therefore considered inappropriate not to include these indicators in the models.
Several indicators could not be measured during the data collection or had to be excluded from the models due to insufficient variance. In advance, attention was paid to include farms with varying size or production rhythms in the study to enhance the inter-farm variance. Studies on the Welfare Quality® protocol for sows and piglets are limited, but Scott et al. [31] already pointed out in a preliminary study on the protocol that especially severe deviations in animal welfare are rare. These results are consistent with the prevalence observed in the present study. In contrast, Dippel et al. [32] found a high level of thin sows, wounds on the body and vulva lesions when applying the Welfare Quality® protocol to organic farms. It is therefore possible that the results of this study would be different if the prevalence and variance of the indicators were different. Despite all attention paid to the selection of the farms, it is also possible that only farms with fewer animal welfare problems agreed to participate in the present study as participation was voluntary, affecting the prevalence observed. This is why further studies should be carried out to verify whether the existing prevalence of the indicators is indeed generally applicable for the population of sows and piglets in Germany or internationally under similar housing conditions. Only afterwards a final reduction of the indicators is reasonable to ensure that all aspects of animal welfare remain considered.
While constructing the models, case-wise deletion was carried out to deal with missing values in accordance with recommendations of Hair et al. [12]. The missing values were spread across all farm visits so that no systematic exclusion of observations can be assumed. The dataset’s sample size (n = 65) was minimally smaller than ten times the number of indicators in each lower-order components, e.g., good health in sows with eight indicators in the initial HCM, but was always larger than the number of structure paths (arrows) directed at each component in the model [12], thus considered appropriate.
The indicators were sorted into the principles as defined in the Welfare Quality® protocol, e.g., shoulder sores as indicator of the principle of good housing. A study of Czycholl et al. [33] revealed interferences and double-counting of the indicators of the Welfare Quality® protocol for growing pigs on the principles. Based on this fact, other assignments of indicators to principles were tested as well while developing the models of the present study taking into account relationships between indicators and principles described in literature. The indicator carpal joint lesions was assigned once to the principle of good feeding and once to the principle of good health since carpal joint lesions are developed while suckling but have an influence on piglets’ health [34,35]. This was also done for the indicator shoulder sores because sows have a higher risk of developing shoulder lesions if the body condition is low [22,23]. Further, the indicators to assess stereotypies were once assigned to the principle of appropriate behaviour and once to the principle of good feeding as stereotypic behaviour may result from persistent hunger [36]. The assignment chosen in the Welfare Quality® protocol is the one for which the models of the present study could explain the highest variance in the dataset. This is why only models using the assignment of the protocol are presented. Nevertheless, it is possible that other appropriate models exist which were not considered in this study [21].

4.2. Evaluation of the Measurement Models of the Final HCMs

  • Sows
Out of 20 indicators considered at the beginning, seven indicators qualified as reliable for the final HCM. Indicators were removed from the models if they did not meet the quality criterion for IR, which is an indicator loading greater than 0.40 and statistical significance [12,25]. If an indicator had an IR between 0.40 and 0.70, it was carefully evaluated to see whether removing the indicator from the model would increase the model’s quality criteria and conclusively its construct validity [21]. Another reason for the exclusion of indicators is the formation of so-called single-items, i.e., lower-order components associated with solely one indicator. The lower-order component good feeding and any remaining indicators were excluded from the models as it would have become a single-item due to the elimination of indicators during the course of the evaluation, which reduces the validity of the model and negatively influences the prediction validity according to Hair et al. [21].
The remaining indicators that were assigned to the lower-order component appropriate behaviour (positive behaviour, stereotypes, frothy saliva) appeared to be most suitable for the model, followed by mortality and the other animal-based indicators. The high loadings of the indicators, which were mainly ≥ 0.70, indicated that the indicators are well suited for measuring the components associated with them.
General validity of the measurement models was indicated since the values for CR passed the threshold of 0.60 [13]. Concluding, all components were sufficiently measured by the resulting indicators. Moreover, the validity of the measurement models was also confirmed since the thresholds for AVE were reached [13].
All indicators that were maintained in the model are based on a variety of causes, which emphasises their usefulness as iceberg indicators. The indicators are discussed in the following, sorted according to their importance in the model.
  • Stereotypies
Stereotypies are repeated sequences of the same movement without any recognisable function (e.g., [37,38,39]) and often occur in sows as oral activities such as sham chewing or chewing or licking of objects [40,41,42]. Stereotypies are generally recommended for the assessment of animal welfare [43] as they notify problems in welfare [44] and alert possible harm [45]. However, since animals that do not perform stereotypies do not automatically have an unaffected animal welfare [45], stereotypies should always be used in combination with other indicators to assess animal welfare.
  • Frothy saliva
Frothy saliva is a new indicator to assess stereotypies in sows introduced by Friedrich et al. [19]. The indicator does not evaluate the active behaviour of the animals, but whether foamed saliva is visible on the animals’ snouts, which may be due to increased oral activities carried out in advance. The indicator’s advantage is that it can also be applied to non-active animals and therefore can be recorded independently of the time of day or periods of activity as feeding times, respectively. Although the indicator needs to be further investigated, since the relationships with feeding and enrichment material are not yet fully clarified [19], the assessment of frothy saliva can provide initial information on affected animal welfare due to increased execution of stereotypies.
  • Positive behaviour
The aggregated indicator positive behaviour consists of the categories social behaviour, use of enrichment material and exploration of the pen, which are assessed through instantaneous scan sampling of the sows in the gestation unit. All these categories are defined as normal behaviour in pigs, i.e., behaviour performed in a natural environment because it is beneficial and stimulates biological processes [46]. Pigs are animals with strong social behaviour and form social groups [47]. Pigs also have a high level of exploratory instinct and spend a large part of the day in the wild searching for food (rooting) [46], hence, access to enrichment material and the possibility to explore the pen are of significant importance. The expression of natural behaviour is mentioned in the five freedoms as a key element for animal welfare [48]. While the other freedoms describe the absence of negative affections of welfare, e.g., absence of hunger, the expression of natural behaviour is associated with positive animal welfare and, therefore, fits well in the model, which aims to measure unaffected animal welfare.
  • Mortality
Mortality and in turn longevity are important indicators of animal welfare. Reduced animal welfare may be indicated by a high number of dead or euthanised sows [49]. Consequently, mortality is an iceberg indicator that unites multiple causes. For example, infections in the urinary or reproductive system are a significant factor for increased mortality in sows [50]. Similarly, lameness can result in increased mortality if it induces euthanasia [51].
  • Shoulder sores
Shoulder sores are pressure lesions that develop on the shoulders of sows and can be frequently observed in lactating sows [52]. Studies indicated a prevalence up to 34% (e.g., [53]). Shoulder sores are considered a multifactorial problem with risk factors being the sows’ body condition score, their lying position and the characteristics of the floor [22,23]. Thus, the use as an iceberg indicator is recommended as various factors affecting animal welfare can be reflected.
  • Panting
Panting, which is primarily assessed in the farrowing unit based on the Welfare Quality® protocol for sows and piglets, is known to be a temporary response to high ambient temperature or to fever [32]. Particularly in the farrowing unit, controlling the environmental temperature is difficult for the farmer as sows and piglets have different thermal needs [54]. Apart from the strong relationship with ambient temperature, panting is an indicator to signal whether animals, and thereby animal welfare, have been affected by heat or disease [32]. Consequently, this indicator mirrors more than one potential impairment of animal welfare, which makes its use as an iceberg indicator advisable.
  • Metritis
The Welfare Quality® protocol for sows and piglets pre-set the assessment of metritis as presence of a milky white vaginal discharge in sows in the farrowing and breeding unit. The recording of the presence of lochia or vaginal discharge has been used in other studies as part of the measurement of puerperal diseases, i.e., the assessment of the periparturient hypogalactia syndrome (PHS). In this context, raised body temperature in connection with clinical signs such as reduced appetite and reddening of the udder are recorded as well [55]. This means that the assessment of vaginal discharge is already an overall indicator of a more complex process. PHS, also named as mastitis-metritis-agalactia (MMA) complex [56], is a disease complex of global economic importance [57]. Moreover, it affects the sows’ productivity, e.g., rate of pregnancy or frequency of abortion [55] and is accompanied by high mortality rates [57].
2.
Piglets
Of the 11 indicators initially considered, four were considered reliable for the final HCM applying the quality criteria described for sows. The final HCM for piglets consisted of the lower-order component good feeding with the indicators carpal joint lesions and undersized animals and the component good health with the indicators mortality and sneezing. The lower-order component good housing and its remaining associated indicator were removed since it formed a single-item. The indicator carpal joint lesions seemed to be most suitable for the model, followed by mortality, sneezing and lastly undersized animals. All IR were ≥0.70 except for undersized animals, thus, high loadings were obtained presenting a strong relationship of the indicators with their associated components. Since the indicator undersized animals almost reached the threshold of 0.70 (IR = 0.68) the exclusion of undersized animals did not improve the quality of the model, hence, the indicator was preserved in the model.
All specifications regarding the quality criteria CR and AVE made in the discussion for sows also apply to piglets. The measurement model for piglets showed general validity. The model’s indicators are discussed in the following organised according to their importance in the model. Once again, all indicators have several causes, so that the use of these indicators as iceberg indicators is recommended.
  • Carpal joint lesions
Lesions of the skin are particularly caused by rough and abrasive floors [58] and occur when paddling during suckling [35], but also nutrition and genetics can have an influence [34]. The injuries occur particularly on the front legs [59]. Infections can penetrate these, which can lead to lameness [34]. Consequently, carpal joint lesions not only have several causes but can also influence animal welfare in several ways. Their use as iceberg indicators is recommended.
  • Mortality
The mortality of piglets is especially high in the first 72 h of life with the causes often being multifactorial, e.g., physical trauma caused by the sow, hypothermia, malnutrition, small or non-viable piglets or diseases as reviewed by Barnett et al. [60]. Similar to sows, a high mortality rate in piglets can indicate a variety of problems, which is why its use as an iceberg indicator is justified.
  • Sneezing
Sneezing together with coughing and pumping in piglets may point out respiratory problems [61]. The indicators coughing and pumping in piglets were not observed during data collection. It could be concluded from this that the farms were only confronted with rare respiratory problems during the visits. However, respiratory problems are multifactorial disease complexes and may be caused by different bacteria and viruses and are among the major causes of disease in pig farming [61]. This high relevance for pig farming should be taken into account when identifying iceberg indicators to assess animal welfare.
  • Undersized animals
Undersized or smaller animals run a risk of having worse thermoregulation [62,63]. Hypothermia can lead to starvation because these animals are less active and therewith less competitive at the udder [64,65]. Further, hypothermia and reduced activity can lead to crushing because weaker animals often react more slowly to movements of the sow. In addition, the risk of crushing is higher because these animals spend more time near the sow [66]. Smaller piglets consequently are subject to various welfare issues, which highlights the use of the indicator as an iceberg indicator.

4.3. Evaluation of the Structural Models of the Final HCMs

  • Sows
The relationships between the three lower-order components and the higher-order component was statistically significant, which was confirmed by bootstrapping. This means that good housing, good health and appropriate behaviour were significantly influenced by animal welfare. The most influenced component was appropriate behaviour followed by good health and good housing.
Returning to the multidimensionality of animal welfare mentioned in the introduction, Fraser defined animal welfare by the components basic health and biological functioning, natural living and the animals’ affective state [67]. All these three components are mirrored in the principles of good health, good housing and appropriate behaviour. Conclusively, all aspects of animal welfare as defined by Fraser [67] (housing, health, natural behaviour) are displayed in the final HCM for sows.
The indicators not considered and the removed principle of good feeding were not significantly influenced by animal welfare in the present study and consequently did not appear to be a suitable measure of animal welfare in the model. There are several explanations why indicators or the principle of good feeding have not been taken into account in the model: less importance for animal welfare than assumed, due to requirements in the model design or because of the prevalence observed in the present study. All explanations are discussed as follows.
It is possible that the indicators defined in the Welfare Quality® protocol and in the German guideline, which were not included in the final model, may provide less information about animal welfare than expected, e.g., the indicators defined for the principle of good feeding. The gold standard for the assessment of animal welfare are animal-based indicators since these mirror the animals’ response to their environment [68]. Hemsworth [69] concluded in his review on key determinants in pigs that animal welfare is not solely influenced by the environment but moreover how the environment is managed. In this way, even a longer suckling period for example could have no negative impact on the welfare of sows if the management ensures that the sow’s body condition score, which is the animals’ response to the environment, also remains unaffected. If body condition score is assumed to be the only significant indicator for the principle of good feeding, since it is the only animal-based indicator in this principle, the exclusion of this principle is less a result of the fact that feeding may not be relevant for sows but rather of the fact that the formation of single-items should be avoided in the design of the models [12]. This is especially likely given that other studies on the Welfare Quality® protocol for sows and piglets have found a high prevalence of deviations in sows’ body condition, hence, highlighted the indicator’s importance. In contrast, the present study found only a low prevalence. This could be explained by the selection of voluntary participating farms with perhaps minor animal welfare constraints and the limitation to 13 farms. The considerations with regard to the prevalence observed also applies to the indicator lameness, which only reached an average prevalence of 0.90% in the present study. Contrary, other studies confirmed that lameness is one of the main issues concerning animal welfare, with prevalence up to 16.9% [70]. Further, lameness can be a significant reason for unplanned culling of sows [71] and is considered a major problem in the loading of sows for slaughter [72]. Heinonen et al. [73] declared that lameness does not only affect locomotion, but each of the five freedoms [48] and consequently, for example, the ability to perform natural behaviour. In contrast, Heinonen et al. [73] also pointed out that differences between the prevalence of the different studies can also be due to different definitions of lameness or ways of assessing lameness. Compared to other definitions, the Welfare Quality® protocol only records relatively severe lamenesses. Hence, the prevalence of lameness may have been underestimated by applying the Welfare Quality® protocol in the present study. Consequently, before indicators are finally excluded from an assessment system, it must be carefully checked whether the reduced protocol really covers all main issues of animal welfare [10]. This will require further studies to confirm the prevalence identified in this study and consequently the models.
The use of iceberg indicators ensures that animal welfare is measured in its entirety despite the exclusion of indicators. As mentioned above, iceberg indicators combine several aspects of animal welfare in one indicator [11]. Hence, several of the excluded indicators may be represented by the remaining indicators in the final HCM. For example, lameness is also reflected (in parts) by mortality as described above. Further, a primary animal welfare issue concerning feeding in gestating sows is not the body condition score per se, but persistent hunger [74] and the frequently resulting stereotypies of restrictively fed sows [36], which is sufficiently displayed in the final HCM by the indicators stereotypies and frothy saliva. Thus, the feeding is not completely removed from the model. In the final model, stereotypic behaviour is measured by two indicators. The difference between the indicators is that the indicator stereotypies is used to assess sows’ active behaviour, while the indicator frothy saliva can also be applied to resting animals. Reducing the model to only one of the indicators did not improve the validity of the model. With regard to literature [12], it was therefore decided to keep both indicators in the model in order to have a more comprehensive view on the animals’ behaviour.
Finally, it is also possible that indicators do not measure what they are supposed to measure, which may have an influence on their presence or absence in the model. Whether indicators indeed measure what they are supposed to measure is questioned for example in the Qualitative Behaviour Assessment. The doubtful objectivity of this method has been addressed in other studies on-farm in pigs [8,75]. In addition, it was found in cattle that the Qualitative Behaviour Assessment is not suitable as an iceberg indicator [76]. Thus, besides feasibility, the choice of indicators should also consider validity and reliability to create an objective assessment tool [77].
With regard to the coefficient of determination R2, animal welfare explained 83.0% of the variance in appropriate behaviour, 74.5% in good health and 58.5% in good housing. The values for good health and appropriate behaviour can be regarded as good, the value for good housing is moderate [12,13]. This might suggest that it is more preferable to use the indicators of the principle of appropriate behaviour to assess animal welfare. However, maintaining Fraser’s [67] definition of animal welfare mentioned above, all aspects relating to animal welfare should be respected.
2.
Piglets
The statements made on the structural model for sows also apply to piglets. Similarly, a significant influence of the higher-order component, i.e., animal welfare, on the lower-order components, i.e., good feeding and good health, was found. Thereby, good health was more influenced by animal welfare than good feeding even though the difference was only slight.
Although this is a high proportion, it should be noted that no indicators for piglets are currently available to assess the principle of appropriate behaviour. Together with the small sample size due to missing values, the model for piglets should only be considered as a first approach. Further studies are necessary to develop indicators to assess behaviour in piglets or to confirm the existing model.
In summary, the present study provides an overview of so-called iceberg indicators which could be used to assess welfare in sows and piglets. The reduction of indicators can contribute to an increase in feasibility and thus also to the sustainability of the assessments, although Vermeer et al. [10] were concerned that a reduction of indicators only leads to a minimal time saving. However, by excluding the Qualitative Behaviour Assessment and the recording of resource-based indicators, at least one hour could be saved. The exact amount of time needed for an assessment with a reduced number of indicators should be tested on-farm subsequently. In addition, it should also be verified whether the prevalence obtained in the present study is generally applicable in order to validate the models. This ensures that no relevant welfare problems, which may not have appeared in the data collection of the present study, will be omitted, e.g., lameness in sows or deviations in their body condition score.

4.4. Evaluation of the Split-Half HCMs

The quality of the models and general validity of the HCMs was confirmed as the quality criteria for reliability and validity showed a similar tendency of the values in the split-half approaches [26].

5. Conclusions

The present study is one of the first studies aiming at identifying so-called iceberg indicators for the assessment of welfare in sows and piglets using PLS-SEM. PLS-SEM is a common method to visualise latent variables and can moreover be used to determine relevant indicators for these invisible constructs. The Welfare Quality® protocol for sows and piglets was applied as the gold standard and supplied by indicators defined in a German animal welfare assessment protocol for sows and piglets to be used for farms’ self-monitoring of animal welfare. The present study revealed that welfare in sows can be assessed measuring the Welfare Quality® principles of good housing, good health and appropriate behaviour. The initial indicators were reduced to panting and shoulder sores for the principle of good housing, mortality and metritis for the principle of good health and positive behaviour, stereotypies and frothy saliva, a new indicator to assess stereotypies, for the principle of appropriate behaviour. The principles of good feeding and good health were indicated to measure welfare in piglets. The final indicators were carpal joint lesions and undersized animals to assess good feeding and mortality and sneezing to assess good health. The results of the present study contribute to a more feasible assessment of animal welfare and thus to an increase in animal welfare. With increased animal welfare, the sustainability of animal husbandry can be strengthened. Still, the results may be limited by the fact that the data collection took place on only 13 voluntarily participating farms. The prevalence found for deviations in animal welfare was low, especially with regard to the body condition score and in the indicator lameness, differing from those observed in other studies, which may have led to the exclusion of these indicators from the model. The prevalence obtained in this study and thus the models should be validated in further studies before final modifications to the protocol can be applied.

Author Contributions

Conceptualization, L.F., J.K. and I.C.; data curation, L.F.; formal analysis, L.F. and I.C.; funding acquisition, J.K. and I.C.; investigation, L.F., J.K. and I.C.; methodology, L.F., J.K. and I.C.; project administration, I.C.; resources, J.K. and I.C.; software, L.F. and I.C.; supervision, J.K., N.K. and I.C.; validation, J.K. and N.K.; visualization, L.F.; writing—original draft, L.F.; writing—review & editing, L.F., J.K., N.K. and I.C. All authors have read and agreed to the published version of the manuscript.

Funding

This work was financially supported by the H.W. Schaumann Foundation. Further, we acknowledge financial support by Land Schleswig-Holstein within the funding programme Open Access Publikationsfonds.

Conflicts of Interest

The authors declare no conflict of interest.

References

  1. Blokhuis, H.J.; Veissier, I.; Jones, B.; Miele, M. Improving Farm Animal Welfare: Science and Society Working together: The Welfare Quality Approach; Blokhuis, H.J., Miele, M., Veissier, I., Jones, B., Eds.; Wageningen Academic Publishers: Wageningen, The Netherlands, 2013. [Google Scholar]
  2. Velarde, A.; Fàbrega, E.; Blanco-Penedo, I.; Dalmau, A. Animal welfare towards sustainability in pork meat production. Meat Sci. 2015, 109, 13–17. [Google Scholar] [CrossRef] [PubMed]
  3. Pethick, D.W.; Ball, A.J.; Banks, R.G.; Hocquette, J.F. Current and future issues facing red meat quality in a competitive market and how to manage continuous improvement. Anim. Prod. Sci. 2011, 51, 13–18. [Google Scholar] [CrossRef]
  4. Fraser, A.F.; Broom, D.M. Farm Animal Behaviour and Welfare; CAB International: Wallingford, UK, 1990. [Google Scholar]
  5. Veissier, I.; Winckler, C.; Velarde, A.; Butterworth, A.; Dalmau, A.; Keeling, L.J. Development of welfare measures and protocols for the collection of data on farms or at slaughter. In Improving Farm Animal Welfare: Science and Society Working Together: The Welfare Quality Approach; Blokhuis, H.J., Miele, M., Veissier, I., Jones, B., Eds.; Wageningen Academic Publishers: Wageningen, The Netherlands, 2013. [Google Scholar]
  6. Knierim, U.; Winckler, C. On-farm welfare assessment in cattle: Validity, reliability and feasibility issues and future perspectives with special regard to the Welfare Quality® approach. Anim. Welf. 2009, 18, 451–458. [Google Scholar]
  7. Blokhuis, H.J.; Veissier, I.; Miele, M.; Jones, B. The Welfare Quality® project and beyond: Safeguarding farm animal well-being. Acta Agric. Scand. A Anim. Sci. 2010, 60, 129–140. [Google Scholar] [CrossRef]
  8. Czycholl, I.; Kniese, C.; Büttner, K.; grosse Beilage, E.; Schrader, L.; Krieter, J. Test-retest reliability of the Welfare Quality® animal welfare assessment protocol for growing pigs. Anim. Welf. 2016, 25, 447–459. [Google Scholar] [CrossRef]
  9. Friedrich, L.; Krieter, J.; Kemper, N.; Czycholl, I. Test–retest reliability of the Welfare Quality Assessment protocol for pigs applied to sows and piglets. Part 2. Assessment of the principles good feeding, good housing, and good health. J. Anim. Sci. 2019, 97, 1143–1157. [Google Scholar] [CrossRef]
  10. Vermeer, H.M.; van Reenen, C.G.; Spoolder, H.A.M. Vereenvoudiging Welfare Quality® Protocol Voor Varkens. (English Summary: ‘Simplifying the Welfare Quality® Protocol for Pigs’); Rapport 622; Wageningen UR Livestock Research: Lelystad, The Netherlands, 2012. [Google Scholar]
  11. Farm Animal Welfare Council (FAWC). Farm Animal Welfare in Great Britain: Past, Present and Future; Farm Animal Welfare Council (FAWC): London, UK, 2009. [Google Scholar]
  12. Hair, J.F.; Hult, G.T.M.; Ringle, C.M.; Sarstedt, M. A Primer on Partial Least Squares Structural Equation Modeling (PLS-SEM); SAGE Publications Inc.: Los Angeles, CA, USA, 2014; ISBN 9781452217444. [Google Scholar]
  13. Henseler, J.; Ringle, C.M.; Sinkovics, R.R. The use of partial least squares structural equation modeling in marketing research. Adv. Int. Mark. 2009, 20, 277–320. [Google Scholar]
  14. Nitzl, C. Eine Anwenderorientierte Einführung in die Partial Least Square (PLS)-Methode, Industrielles Management. 2010. Available online: https://www.researchgate.net/publication/256023037_Eine_anwenderorientierte_Einfuhrung_in_die_Partial_Least_Square_PLS-Methode (accessed on 28 October 2020).
  15. Drews, J.; Czycholl, I.; Junge, W.; Krieter, J. An evaluation of efficiency in dairy production using structural equation modelling. J. Agric. Sci. 2018, 156, 996–1004. [Google Scholar] [CrossRef]
  16. Krugmann, K.; Warnken, F.; Krieter, J.; Czycholl, I. Are behavioral tests capable of measuring positive affective states in growing pigs? Animals 2019, 9, 274. [Google Scholar] [CrossRef] [Green Version]
  17. Welfare Quality®. Welfare Quality®. Assessment Protocol for Pigs (Sows and Piglets, Growing and Finishing Pigs); Welfare Quality® Consortium: Lelystad, The Netherlands, 2009. [Google Scholar]
  18. KTBL. Tierschutzindikatoren: Leitfaden für die Praxis—Schwein: Vorschläge für die Produktionsrichtungen Sauen, Saugferkel, Aufzuchtferkel und Mastschweine. 2016. Available online: https://docplayer.org/31295478-Tierschutzindikatoren-leitfaden-fuer-die-praxis-schwein.html (accessed on 28 October 2020).
  19. Friedrich, L.; Krieter, J.; Kemper, N.; Czycholl, I. Frothy saliva—A novel indicator to assess stereotypies in sows? Appl. Anim. Behav. Sci. 2020, 222, 104897. [Google Scholar] [CrossRef]
  20. SAS Institute Inc. User’s Guide (Release 9.4); SAS Institute Inc.: Cary, NC, USA, 2008. [Google Scholar]
  21. Hair, J.F.; Hult, G.T.M.; Ringle, C.M.; Sarstedt, M.; Richter, N.F.; Hauff, S. Partial Least Squares Strukturgleichungsmodellierung. Eine anwendungsorientierte Einführung; Franz Vahlen: München, Germany, 2017; ISBN 9783800653607. [Google Scholar]
  22. Cleveland-Nielsen, A.; Christensen, G.; Ersbøll, A.K. Prevalences of welfare-related lesions at post-mortem meat-inspection in Danish sows. Prev. Vet. Med. 2004, 64, 123–131. [Google Scholar] [CrossRef] [PubMed]
  23. Rolandsdotter, E.; Westin, R.; Algers, B. Maximum lying bout duration affects the occurrence of shoulder lesions in sows. Acta Vet. Scand. 2009, 51, 44. [Google Scholar] [CrossRef] [PubMed] [Green Version]
  24. Ringle, C.M.; Wende, S.; Becker, J.-M. “SmartPLS 3.” Boenningstedt: SmartPLS GmbH. 2015. Available online: http://www.smartpls.com (accessed on 28 October 2020).
  25. Bagozzi, R.P.; Yi, Y.; Phillips, L.W. Assessing construct validity in organizational research. Adm. Sci. Q. 1991, 36, 421–458. [Google Scholar] [CrossRef]
  26. Martin, P.; Bateson, P. Measuring Behaviour: An Introductory Guide; University of Cambridge: Cambridge, UK, 2007. [Google Scholar]
  27. Tierschutzgesetz in der Fassung der Bekanntmachung vom 18. Mai 2006 (BGBl. I S. 1206, 1313), das Zuletzt Durch Artikel 141 des Gesetzes vom 29. März 2017 (BGBl. I S. 626) Geändert Worden ist, 2006a. Available online: http://extwprlegs1.fao.org/docs/pdf/ger88974.pdf (accessed on 28 October 2020).
  28. Tierschutz-Nutztierhaltungsverordnung in der Fassung der Bekanntmachung vom 22. August 2006 (BGBl. I S. 2043), die Durch Artikel 3 Absatz 2 des Gesetzes Vom 30. Juni 2017 (BGBl. I S. 2147) geändert worden ist, 2006b. Available online: https://www.gesetze-im-internet.de/tierschnutztv/TierSchNutztV.pdf (accessed on 28 October 2020).
  29. Wemelsfelder, F.; Hunter, T.E.A.; Mendl, M.T.; Lawrence, A.B. Assessing the ‘whole animal’: A free choice profiling approach. Anim. Behav. 2001, 62, 209–220. [Google Scholar] [CrossRef] [Green Version]
  30. Heath, C.A.E.; Browne, W.J.; Mullan, S.; Main, D.C.J. Navigating the iceberg: Reducing the number of parameters within the Welfare Quality® assessment protocol for dairy cows. Animal 2014, 8, 1978–1986. [Google Scholar] [CrossRef] [Green Version]
  31. Scott, K.; Binnendijk, G.P.; Edwards, S.A.; Guy, J.H.; Kiezebrink, M.C.; Vermeer, H.M. Preliminary evaluation of a prototype welfare monitoring system for sows and piglets (Welfare Quality® project). Anim. Welf. 2009, 18, 441–449. [Google Scholar]
  32. Dippel, S.; Leeb, C.; Bochicchio, D.; Bonde, M.; Dietze, K.; Gunnarsson, S.; Lindgren, K.; Sundrum, A.; Wiberg, S.; Winckler, C. Health and welfare of organic pigs in Europe assessed with animal-based parameters. Org. Agric. 2014, 4, 149–161. [Google Scholar] [CrossRef]
  33. Czycholl, I.; Kniese, C.; Schrader, L.; Krieter, J. Assessment of the multi-criteria evaluation system of the Welfare Quality® protocol for growing pigs. Animal 2017, 11, 1573–1580. [Google Scholar] [CrossRef]
  34. Penny, R.H.C.; Edwards, M.J.; Mulley, R. Clinical observations of necrosis of the skin of suckling piglets. Aust. Vet. J. 1971, 47, 529–537. [Google Scholar] [CrossRef]
  35. Mouttotou, N.; Hatchell, F.M.; Green, L.E. The prevalence and risk factors associated with forelimb skin abrasions and sole bruising in preweaning piglets. Prev. Vet. Med. 1999, 39, 231–245. [Google Scholar] [CrossRef]
  36. Appleby, M.C.; Lawrence, A.B. Food restriction as a cause of stereotypic behaviour in tethered gilts. Anim. Sci. 1987, 45, 103–110. [Google Scholar] [CrossRef]
  37. Wood-Gush, D.G.M.; Duncan, I.J.H.; Fraser, D. Social stress and welfare problems in agricultural animals. In Behaviour of Domestic Animals; Hafez, E.S.E., Ed.; Baillière Tindall: London, UK, 1975. [Google Scholar]
  38. Kiley-Worthington, M. Behavioural Problems of Farm Animals; Oriel Press Limited: London, UK, 1977; ISBN 0853621632. [Google Scholar]
  39. Mason, G.J. Stereotypies: A critical review. Anim. Behav. 1991, 41, 1015–1037. [Google Scholar] [CrossRef] [Green Version]
  40. Fraser, D. The effect of straw on the behaviour of sows in tether stalls. Anim. Sci. 1975, 21, 59–68. [Google Scholar] [CrossRef] [Green Version]
  41. Stolba, A.; Baker, N.; Wood-Gush, D.G.M. The characterisation of stereotyped behaviour in stalled sows by informational redundancy. Behaviour 1983, 87, 157–182. [Google Scholar] [CrossRef]
  42. Terlouw, E.M.C.; Lawrence, A.B.; Illius, A.W. Influences of feeding level and physical restriction on development of stereotypies in sows. Anim. Behav. 1991, 42, 981–991. [Google Scholar] [CrossRef]
  43. Duncan, I.J.H.; Fraser, D. Understanding animal welfare. In Animal Welfare; Appleby, M.C., Hughes, B.O., Eds.; CAB International: Wallingford, UK, 1997. [Google Scholar]
  44. Appleby, M.C. What Should We Do about Animal Welfare? Blackwell Science: Oxford, UK, 1999; ISBN 0632050667. [Google Scholar]
  45. Mason, G.J.; Latham, N. Can’t stop, won’t stop: Is stereotypy a reliable animal welfare indicator? Anim. Welf. 2004, 13, 57–69. [Google Scholar]
  46. Bracke, M.B.M.; Hopster, H. Assessing the Importance of Natural Behavior for Animal Welfare. J. Agric. Environ. Ethics 2006, 19, 77–89. [Google Scholar] [CrossRef]
  47. Stolba, A.; Wood-Gush, D.G.M. The behaviour of pigs in a semi-natural environment. Anim. Sci. 1989, 48, 419–425. [Google Scholar] [CrossRef]
  48. Farm Animal Welfare Council. Second Report on the Priorities for Research and Development in Farm Animal Welfare; Ministry of Agriculture, Fisheries and Food: London, UK, 1993. [Google Scholar]
  49. Engblom, L.; Lundeheim, N.; Dalin, A.-M.; Andersson, K. Sow removal in Swedish commercial herds. Livest. Sci. 2007, 106, 76–86. [Google Scholar] [CrossRef]
  50. Chagnon, M.; D’Allaire, S.; Drolet, R. A prospective study of sow mortality in breeding herds. Can. J. Vet. Res. 1991, 55, 180. [Google Scholar]
  51. Anil, S.S.; Anil, L.; Deen, J. Evaluation of patterns of removal and associations among culling because of lameness and sow productivity traits in swine breeding herds. J. Am. Vet. Med. Assoc. 2005, 226, 956–961. [Google Scholar] [CrossRef]
  52. Herskin, M.S.; Bonde, M.K.; Jørgensen, E.; Jensen, K.H. Decubital shoulder ulcers in sows: A review of classification, pain and welfare consequences. Animal 2011, 5, 757–766. [Google Scholar] [CrossRef] [PubMed] [Green Version]
  53. Zurbrigg, K. Sow shoulder lesions: Risk factors and treatment effects on an Ontario farm. J. Anim. Sci. 2006, 84, 2509–2514. [Google Scholar] [CrossRef] [PubMed]
  54. Dong, H.; Tao, X.; Lin, J.; Li, Y.; Xin, H. Comparative Evaluation of Cooling Systems for Farrowing Sows. Appl. Eng. Agric. 2001, 17, 91–96. [Google Scholar] [CrossRef]
  55. Hoy, S. The impact of puerperal diseases in sows on their fertility and health up to next farrowing. Anim. Sci. 2006, 82, 701–704. [Google Scholar] [CrossRef]
  56. Martin, C.E.; Hooper, B.E.; Armstrong, C.H. A Clinical and Pathologic Study of Mastitis-Metritis-Agalactia Syndrome of Sows. J. Am. Vet. Med. Assoc. 1967, 151, 1629–1634. [Google Scholar]
  57. Bertschinger, H.U. Coliform mastitis. In Diseases of Swine, 8th ed.; Straw, B.E., D’Allaire, S., Mengeling, W.L., Taylor, D.J., Eds.; Iowa State University Press: Ames, IA, USA, 1999. [Google Scholar]
  58. Zoric, M.; Nilsson, E.; Lundeheim, N.; Wallgren, P. Incidence of lameness and abrasions in piglets in identical farrowing pens with four different types of floor. Acta Vet. Scand. 2009, 51, 23. [Google Scholar] [CrossRef] [Green Version]
  59. Furniss, S.J.; Edwards, S.A.; Lightfoot, A.L.; Spechter, H.H. The effect of floor type in farrowing pens on pig injury. I. Leg and teat damage of suckling piglets. Br. Vet. J. 1986, 142, 434–440. [Google Scholar] [CrossRef]
  60. Barnett, J.L.; Hemsworth, P.H.; Cronin, G.M.; Jongman, E.C.; Hutson, G.D. A review of the welfare issues for sows and piglets in relation to housing. Aust. J. Agric. Res. 2001, 52, 1. [Google Scholar] [CrossRef]
  61. Temple, D.; Llonch, P.; Mainau, E.; Manteca, X. On-farm and post-mortem health assessment. In Advances in Pig Welfare; Špinka, M., Ed.; Elsevier Woodhead Publishing: Sawston, Cambridge, UK, 2018; ISBN 9780081010129. [Google Scholar]
  62. Hayashi, M.; Ingram, D.L.; Dauncey, M.J. Heat production and respiratory enzymes in normal and runt newborn piglets. Neonatology 1987, 51, 324–331. [Google Scholar] [CrossRef]
  63. Herpin, P.; Damon, M.; Le Dividich, J. Development of thermoregulation and neonatal survival in pigs. Livest. Prod. Sci. 2002, 78, 25–45. [Google Scholar] [CrossRef]
  64. Stephens, D.B. Piglet survival: A review of some physiological considerations. Vet. Ann. 1971, 12, 64–73. [Google Scholar]
  65. Kelley, K.W. Environmental effects on the immune system of pigs. Pig News Inf. 1982, 3, 395–399. [Google Scholar]
  66. Weary, D.M.; Pajor, E.A.; Thompson, B.K.; Fraser, D. Risky behaviour by piglets: A trade off between feeding and risk of mortality by maternal crushing? Anim. Behav. 1996, 51, 619–624. [Google Scholar] [CrossRef] [Green Version]
  67. Fraser, D. Understanding animal welfare. Acta Agric. Scand. Sect. A 2008, 50, S1. [Google Scholar] [CrossRef] [Green Version]
  68. Johnsen, P.F.; Johannesson, T.; Sandøe, P. Assessment of Farm Animal Welfare at Herd Level: Many Goals, Many Methods. Acta Agric. Scand. Sect. A 2001, 51, 26–33. [Google Scholar] [CrossRef]
  69. Hemsworth, P.H. Key determinants of pig welfare: Implications of animal management and housing design on livestock welfare. Anim. Prod. Sci. 2018, 58, 1375. [Google Scholar] [CrossRef]
  70. KilBride, A.L.; Gillman, C.E.; Green, L.E. A cross sectional study of the prevalence, risk factors and population attributable fractions for limb and body lesions in lactating sows on commercial farms in England. BMC Vet. Res. 2009, 5, 30. [Google Scholar] [CrossRef] [Green Version]
  71. Zhao, Y.; Liu, X.; Mo, D.; Chen, Q.; Chen, Y. Analysis of reasons for sow culling and seasonal effects on reproductive disorders in Southern China. Anim. Reprod. Sci. 2015, 159, 191–197. [Google Scholar] [CrossRef]
  72. Thodberg, K.; Gould, L.M.; Støier, S.; Anneberg, I.; Thomsen, P.T.; Herskin, M.S. Experiences and opinions of Danish livestock drivers transporting sows regarding fitness for transport and management choices relevant for animal welfare. Transl. Anim. Sci. 2020, 4, txaa015. [Google Scholar] [CrossRef]
  73. Heinonen, M.; Peltoniemi, O.; Valros, A. Impact of lameness and claw lesions in sows on welfare, health and production. Livest. Sci. 2013, 156, 2–9. [Google Scholar] [CrossRef]
  74. Hutson, G.D. A note on hunger in the pig: Sows on restricted rations will sustain an energy deficit to gain additional food. Anim. Sci. 1991, 52, 233–235. [Google Scholar] [CrossRef]
  75. Friedrich, L.; Krieter, J.; Kemper, N.; Czycholl, I. Test−Retest Reliability of the ‘Welfare Quality® Animal Welfare Assessment Protocol for Sows and Piglets’. Part 1. Assessment of the Welfare Principle of ‘Appropriate Behavior’. Animals 2019, 9, 398. [Google Scholar] [CrossRef] [Green Version]
  76. Andreasen, S.N.; Wemelsfelder, F.; Sandøe, P.; Forkman, B. The correlation of Qualitative Behavior Assessments with Welfare Quality® protocol outcomes in on-farm welfare assessment of dairy cattle. Appl. Anim. Behav. Sci. 2013, 143, 9–17. [Google Scholar] [CrossRef] [Green Version]
  77. Velarde, A.; Geers, R. On Farm Monitoring of Pig Welfare; Wageningen Academic Publishers: Wageningen, The Netherlands, 2007. [Google Scholar]
Figure 1. Initial hierarchical component model for sows with latent variables (circles), indicators (rectangles), path coefficients representing the relationship between latent variables (arrows connecting circles) and indicator reliabilities (arrows connecting circles and rectangles).
Sustainability 12 08967 g001
Figure 2. Initial hierarchical component model for piglets with latent variables (circles), indicators (rectangles), path coefficients representing the relationship between latent variables (arrows connecting circles) and indicator reliabilities (arrows connecting circles and rectangles).
Sustainability 12 08967 g002
Figure 3. Final hierarchical component model for sows with latent variables (circles), indicators (rectangles), path coefficients representing the relationship between latent variables (arrows connecting circles) and indicator reliabilities (arrows connecting circles and rectangles).
Sustainability 12 08967 g003
Figure 4. Final hierarchical component model for piglets with latent variables (circles), indicators (rectangles), path coefficients representing the relationship between latent variables (arrows connecting circles) and indicator reliabilities (arrows connecting circles and rectangles).
Sustainability 12 08967 g004
Table 1. Additional animal-based indicators with definition and categorisation criteria as specified in the German animal welfare assessment protocol for sows and piglets published by Kuratorium für Technik und Bauwesen in der Landwirtschaft e.V. (KTBL) [18].
IndicatorCategoryDefinition
Sows
Evidence of ectoparasites0No evidence of ectoparasites
1Evidence of ectoparasites (lice or their eggs, beginning or manifested mange)
Trauma on teats and udder0≤4 lesions on the udder, teats without lesions
1≥5 lesions on the udder or ≥1 injured teat
Claw alterations 10No evidence of claw alterations
1Evidence of alterations (injured, overgrowth (claws, dewclaws, sole, heel), bleeding erosion (side wall), cracks (heel, sole, sole/heel junction, side wall), panaritium)
Frothy saliva 20No evidence of foamed saliva around the sow’s snout
1Evidence of foamed saliva around the sow’s snout
Piglets
Face lesions%≥3 bleeding or healing injuries
Carpal joint lesions%Bleeding or healing injury
Undersized animals%Animals possess at least two of the following characteristics: significantly smaller than the rest of the group, prominent ribs, sides of the body shrunk, long bristles
Note: 1 Solely assessed at the hind legs. 2 Definition based on Friedrich et al. [19].
Table 2. Descriptive statistics of indicators used in the hierarchical component model for sows. Category 0 (=unaffected welfare) was used in all animal-based indicators unless otherwise stated.
Related Relevant ComponentsIndicatornMean [%]Median [%]Minimum [%]Maximum [%]Standard Deviation [%]
Good feeding (lower-order)Body condition score6585.888.435.710013.3
Water supply 16584.610060.010019.5
Lactation length 26527.926.021.042.56.46
Good housing (lower-order)Bursitis6563.562.523.210019.5
Shoulder sores5478.580.020.010021.6
Manure on the body6590.992.165.71007.04
Panting6453.555.60.0010027.9
Good health (lower-order)Lameness6599.110086.71002.20
Wounds on the body6593.694.877.81005.60
Vulva lesions6589.593.360.010010.6
Mortality 3654.125.000.508.002.44
Metritis6594.096.466.71007.29
Local infection6586.187.536.110011.2
Claw alterations 46558.557.10.0010034.8
Trauma on teats and udder 46559.362.512.510025.8
Appropriate behaviour (lower-order)Positive behavior 46521.110.00.0084.021.6
Stereotypies6576.781.140.010019.3
Frothy saliva6553.055.012.510023.0
Human-animal relationship6555.455.00.0010023.2
Qualitative Behaviour Assessment 16542.720.01.5991.030.5
Note: 1 Calculation based on the aggregation of the Welfare Quality® protocol for growing pigs [17]. 2 Corresponds to the Welfare Quality® indicator age of weaning. 3 Integrated in the model as 100—Mortality. 3 Indicators derived from the German animal welfare assessment protocol for sows and piglets published by Kuratorium für Technik und Bauwesen in der Landwirtschaft e.V. (KTBL) [18]. 4 Percentage of positive behaviour in the number of active sows as the sum of all positive behaviour defined as normal behaviour in sows of the instantaneous scan sampling (social behaviour, pen investigation, use of enrichment material).
Table 3. Descriptive statistics of indicators used in the hierarchical component model for piglets. Category 0 (=unaffected welfare) was used in all animal-based indicators unless otherwise stated.
Related Relevant ComponentsIndicatornMean [%]Median [%]Minimum [%]Maximum [%]Standard Deviation [%]
Good feeding (lower-order)Weaning age 16527.926.021.042.56.46
Carpal joint lesions 23694.397.070.31006.80
Face lesions 23694.295.777.11006.00
Undersized animals 23698.510091.31002.20
Water supply 36584.610060.010019.5
Good housing (lower-order)Panting6595.710033.310011.9
Huddling6162.866.70.0010026.6
Good health (lower-order)Lameness6590.310025.010015.8
Mortality4513.913.69.7019.43.10
Scouring6594.110060.01009.90
Sneezing6597.610083.21004.20
Note: 1 Corresponds to the Welfare Quality® indicator age of weaning. 2 Indicators derived from the German animal welfare assessment protocol for sows and piglets published by Kuratorium für Technik und Bauwesen in der Landwirtschaft e.V. (KTBL) [18]. 3 Calculation based on the aggregation of the Welfare Quality® protocol for growing pigs [17].
Table 4. Indicator reliabilities (IR), coefficients of determination (R2), composite reliabilities (CR) and average variance extracted (AVE) of the final hierarchical component model (HCM) for sows, split-half consistency HCM-1 and split-half consistency HCM-2.
Latent ComponentIndicatorFinal HCMSplit-Half Consistency
HCM-1
Split-Half Consistency
HCM-2
IRCRAVER2IRCRAVER2IRCRAVER2
Lower-order
Good housingPanting0.810.81 10.68 10.59 10.850.780.650.530.790.810.680.69
Shoulder sores0.83 0.75 0.86
Good healthMetritis0.770.840.720.750.680.780.640.780.840.880.790.73
Mortality0.92 0.91 0.93
Appropriate behaviourPositive behaviour0.910.950.870.830.890.940.840.730.920.960.890.90
Frothy saliva0.94 0.93 0.95
Stereotypies0.94 0.93 0.95
Higher-order
Animal welfarePanting0.610.900.57- 20.650.870.50- 20.620.920.64- 2
Shoulder sores0.65 0.51 0.74
Metritis0.54 0.50 0.58
Mortality0.87 0.86 0.89
Positive behaviour0.83 0.77 0.88
Frothy saliva0.83 0.75 0.74
Stereotypies0.88 0.83 0.92
Note: 1 The values of CR, AVE and R2 are not calculated per indicator but solely for each component. 2 Coefficient of determination R2 is solely calculated for the lower-order components since these may be influenced by other components, both lower-order or higher-order.
Table 5. Indicator reliabilities (IR), coefficients of determination (R2), composite reliabilities (CR) and average variance extracted (AVE) of the final hierarchical component model (HCM) for piglets, split-half consistency HCM-1 and split-half consistency HCM-2.
Latent ComponentsIndicatorFinal HCMSplit-Half Consistency
HCM-1
Split-Half Consistency
HCM-2
IRCRAVER2IRCRAVER2IRCRAVER2
Lower-order
Good feedingCarpal joint lesions0.910.78 10.64 10.77 10.920.860.760.880.890.760.620.76
Undersized animals0.680.840.720.750.810.780.640.780.670.880.790.73
Good healthMortality0.860.840.720.820.780.820.700.870.920.810.680.80
Sneezing0.830.950.870.830.890.940.840.730.720.960.890.90
Higher-order
Animal welfareCarpal joint lesions0.860.820.54- 20.960.870.63- 20.820.790.50- 1,2
Undersized animals0.48 0.63 0.50
Mortality0.810.900.57- 20.640.870.50- 20.890.920.64- 2
Sneezing0.73 0.89 0.52
Note: 1 The values of CR, AVE and R2 are not calculated per indicator but solely for each component. 2 Coefficient of determination R2 is solely calculated for the lower-order components since these may be influenced by other components, both lower-order or higher-order.
Publisher’s Note: MDPI stays neutral with regard to jurisdictional claims in published maps and institutional affiliations.

