Abstract
Stump harvesting is predicted to increase with future increasing demands for renewable energy. This may affect deadwood affiliate biodiversity negatively, given that stumps constitute a large proportion of the coarse deadwood in young managed forests. Spatial decision support for evaluating the integrated effects on biodiversity and production of stump harvesting is needed. We developed a spatially explicit decision support system (called MapStump-DSS), for assessment of tree stump harvesting using biodiversity and economic criteria together with different scenarios for biodiversity conservation and bioenergy market prices. Two novel key aspects of the MAPStump-DSS is that it (1) merges and utilizes georeferenced stump-level data (e.g., tree species and diameter) directly from the harvester with stand data that are increasingly available to forest managers and (2) is flexible toward incorporating both quantitative and qualitative criteria based on emerging knowledge (here biodiversity criteria) or underlying societal drivers and end-user preferences. We tested the MAPStump-DSS on a 45 ha study forest, utilizing harvester data on characteristics and geographical positions for >26,000 stumps. The MAPStump-DSS produced relevant spatially explicit information on the biodiversity and economic values of individual stumps, where amounts of “conflict stumps” (with both high biodiversity and economical value) increased with bioenergy price levels and strengthened biodiversity conservation measures. The MAPStump-DSS can be applied in practice for any forest site, allowing the user to examine the spatial distribution of stumps and to obtain summaries for whole forest stands. Information depicted by the MAPStump-DSS includes amounts, characteristics, biodiversity values and costs of stumps in relation to different scenarios, which also allow the user to explore and optimize biodiversity and economy trade-offs prior to stump harvest.
1. Introduction
A continually growing demand for alternative renewable energy sources [1] has resulted in increased harvest of forest-based bioenergy (heat, electricity or transportation fuels) products in the Nordic and Baltic countries [2,3,4]. Primary forest residues from logging, in the form of slash (tops, branches and twigs) and tree stumps constitute major sources of forest–based bioenergy products [2,3]. Slash is currently extracted for bioenergy production in Sweden, whilst stumps have been under evaluation as a potentially significant future source of bioenergy. Although dependent on market demands, stump harvesting has been predicted to increase with the continued development of more cost-effective extraction methods and increasing energy prices [2,5,6,7,8,9]. Stumps may contribute as much as 25% of the bioenergy supply of woody biomass for bioenergy at the EU level [10]. In Sweden, the gross electric energy potential for stump harvesting within certain ecological and technological restrictions has been estimated to around 19 TWh per annum [11], and the potential is predicted to increase in the future [12,13]. Large-scale utilization of stumps for energy production has therefore become an accepted practice within certain restrictions by the Swedish Forest Agency [14] and the Swedish Government [15]. However, in order to understand trade-offs in different sustainability dimensions caused by optional decisions regarding forest-based energy production, such as in the case of an increasing future demand for stump harvesting, new methods and decision support systems (DSSs) are needed [16].
Stump harvesting is associated with several unique challenges compared to harvesting of stems and slash. Stump harvesting can only be made following final felling, and it is currently performed in the Nordic countries as a separate operation with a hydraulic excavator equipped with a stump harvesting tool that breaks and lifts the stump and coarse roots. Lifted stumps are thereafter transported to roadside landings with a forwarder. From a management point of view, the technical scale of the operation means that stump harvest is best made based on reliable information on the economic outcome. Moreover, decisions about whether to harvest a particular stump are often made by the operator based on very general recommendations for environmental protection, e.g., harvest no more than 70% of the stumps or avoid areas with low soil bearing capacity. Thus, the decision to invest in stump harvest at a particular clear-cut, as well as the decisions of which stumps to harvest, will depend on several criteria involving economic output as well as environmental concern.
The profit from stump harvesting greatly depends on the revenue from the harvested stumps and the cost of the harvesting operations [17]. Besides the extra source of income for the forest owner, stump harvest can reduce the need for mechanical site preparation and potentially reduce pest outbreaks [18,19]. External market demands and values determine the price paid for bioenergy, whilst harvesting costs depend on a number of different factors such as stump size, the excavating machinery, and forwarding costs to roadside landings [20]. However, uncertainties at the operational scale do not only concern the economic outcome of stump harvesting.
Increasing harvest of stumps implies more intensive use of forests, raising issues of environmental sustainability [19,21,22] and social acceptance [23]. The harvesting of stumps may affect the ecological state of the forest stand both in the short and long term [3,18,19]. In Sweden, the Governments environmental quality objective “Reduced Climate Impact” must be achieved in such a way and at such a pace that biological diversity and forest sustainability are not jeopardized according to other objectives of “A Rich Diversity of Plant and Animal Life” and “Sustainable Forests” (www.miljomal.se). One of Sweden’s official detailed environmental objectives is to increase deadwood volume in Swedish forests. Hence, reducing climate impact through increased use of deadwood-based bioenergy products conflicts with certain biodiversity objectives [24]. Concerns are that increased stump removal will affect deadwood affiliate biodiversity negatively, given that stumps constitute an important habitat legacy and a large proportion of the available deadwood in young managed forests [24,25,26,27]. On the other hand, stumps can be considered man-made deadwood substrates with lower biodiversity value than, for example, high stumps and logs [28]. The removal of stumps does not result in complete loss of deadwood habitat. Moderate slash and stump extraction (30%) in a landscape have been shown to result in small (<10%) population declines of deadwood-dependent beetles, macrofungi, and lichens, because they mainly occur on other dead wood types [29]. However, some species were only recorded in slash and stumps [29] and stump extraction for bioenergy has been shown to be associated with larger risk for biodiversity than fine woody debris extraction [30]. Stumps are more abundant in managed than unmanaged forests, and are especially important to consider in managed forests where they constitute a large part of the total coarse deadwood volume and are used by many deadwood-dependent organisms [30]. There is a growing bulk of North European research that seeks to evaluate the role of stumps as habitats for deadwood affiliate biodiversity [3,28,31,32,33]. This opens up new opportunities to synthesize current knowledge on stump affiliate biodiversity in analytical and spatially explicit DSSs that integrate both biodiversity and production objectives for stump harvesting.
One way of integrating disparate objectives is to use Multi-Criteria Analysis (MCA) techniques in natural resource management problems, suitable for analyzing mixed sets of qualitative and quantitative data (including e.g., expert evaluation, market, and non-market values). A large number of DSSs have been put forward for MCA for forestry problems focused on timber and certain non-timber criteria [34,35,36]. Recently these techniques have been employed for forestry problems relating to sustainable bioenergy management [37,38,39,40]. Decision support systems for analyzing multiple biodiversity and economy benefits and limitations of using different harvesting alternatives are being developed for forest residues such as branches and tops [37], including some larger-scale spatially explicit support tools [40,41]. However, these DSSs do not include stumps or spatially explicit substrate-level data. Given that stumps are discrete units of biomass that need to be harvested one by one, the decision to harvest stumps at the operational level needs to be made stump-wise. This allows a multi-criteria structured decision analysis of how extraction best can be applied to individual stumps to maximize the total utility across the forest site, or to support individual objectives. Moreover, modern techniques offer new opportunities to develop a DSS for stump harvesting at the site level, since harvesters produce detailed geographical and biometric information on individual stumps that can be combined with other geographical information [42].
Harvester information technologies today allow an increasing quantity of forest data to be recorded [43]. The recording of the data follows an international information standard StanForD [44] (www.skogforsk.se/english/projects/stanford/) and harvester data has traditionally been used for production reporting and to control the wood flow from forest to industry. However, the more extended harvester data now available with information on individual trees provides opportunities to use harvester data in new applications such as forest planning and management. In a study by Olsson et al. [42], harvest data provided the basic tree stump information needed to build a spatially explicit DSS to balance goals for soil protection and water quality against goals for economical profit during stump harvest.
The overall aim of this study was to develop a spatially explicit operational, multi-criteria MAPStump-DSS model for tree stump harvesting at the forest stand level to balance objectives of economically sound bioenergy production while avoiding significant adverse impacts on biodiversity. The MAPStump-DSS incorporates individual tree stump information directly from the standardized data recorded from timber harvesters, ensuring that the MAPStump-DSS builds on accurate and location-specific stump data. Mixed sets of qualitative and quantitative data, including expert evaluation of biodiversity values and economics of stump lifting and haulage, are employed. In an operational stage, end users will be able to adjust the biodiversity and economy scenario according to their preferences and evaluate the outcome graphically (e.g., stand maps and quantitative summaries of stump amounts, characteristics, biodiversity values and costs). In order to demonstrate and evaluate the capabilities of the MAPStump-DSS, we tested the DSS on a 45 ha case study forest stand representative of managed boreal forests in central Sweden. In our MAPStump-DSS we analyzed nine alternative scenarios of biodiversity conservation and bioenergy price market levels. We investigated to what extent objectives of biodiversity and economic criteria can be simultaneously accommodated and which trade-offs in terms of “conflict stumps” (defined as stumps with both high biodiversity and economical value) that may arise from stump harvesting according to the different scenarios. We also investigated how stump harvests under the different scenarios compare in their capacity to support individual objectives of biodiversity and economic criteria.
2. Materials and Methods
2.1. The MAPStump Decision Support System
The MAPStump-DSS consists of two submodels; one production submodel (PM; Section 2.5 and Section 2.6) implementing the economic criteria after the DSS by [42], and a new biodiversity submodel (BM; Section 2.3 and Section 2.4) with several criteria for biodiversity conservation. Similar to Olsson et al. [42], the MAPStump-DSS incorporates measurements of each harvested stem; including tree species, diameter at breast height (DBH) at 1.3 m re-calculated to stump diameters and biomass, and GPS-recorded positions of the harvester when the trees were cut.
In the MAPStump-DSS, each individual stump was given a harvest suitability score S ranging from 0 to 1. This is a crucial aspect of the MAPStump-DSS; the estimation of a unique score per stump for any harvested forest stand where the DSS is applied. At value 0 the stump is not at all suitable for harvest and at 1 the stump has the highest harvest suitability. Although it is up to the end-user to set preference values for harvest suitability, here we set the mid-range value 0.5 to represent the critical default threshold value where lower values (S < 0.5) would result in a decision to leave the stump in the ground, while higher values (S > 0.5) result in a decision to harvest the stump. We considered the mid-range value economy score SE above 0.5 to be economically feasible for stump harvest and biodiversity scores SB above 0.5 were generally also considered to contribute more to biodiversity according to species experts (see Section 2.3 and Section 2.4).
The overall MAPStump-DSS harvest suitability score S was estimated from equally weighing the criterion economy score SE and the criterion biodiversity score SB to S* using an additive function [45,46]:
The equally weighted score S* between economy and biodiversity criteria in Equation (1) can’t be used alone to produce a decision whether to harvest a stump or not. A decision to leave the stump in the soil will be made by the DSS if S* < 0.5. On the other hand, a value S* > 0.5 is not enough to decide to harvest a stump. Due to the fact that the economy score SE is the only criterion that can motivate stump harvest, a decision to harvest a stump will also require SE to be greater than 0.5. This leads to the estimation of the final harvest suitability score using the minimum value of S* and SE:
Both the economy score SE and the biodiversity score SB have the corresponding scale as the total harvest suitability score S. However, the biodiversity score SB uses the inverted scale (see Equation (1)) where a high value implies a high biodiversity value which corresponds to a low harvest suitability score. The detailed criteria and score setting of the two submodels are described in methods Section 2.3, Section 2.4, Section 2.5 and Section 2.6.
2.2. Study Site and Definition of Scenarios
To illustrate how the MAPStump-DSS works the 45 ha large forest stand “Abrahamsdammen” was selected for study based on the harvester data readily available from this stand. The study forest fulfills the stand recommendations for stump harvest suitability put forward by the Swedish Forest Agency, with respect to ecological and cultural conservation values, water and soil protection, as well as social values [14]. The forest was located in the hemiboreal vegetation zone in central Sweden (lat. 60.22°, long. 17.96°) on flat ground and with a coarse till as the dominating soil type. Mean annual air temperature is ca. 5 °C, growing season 180–200 days (days > 5 °C), and mean annual precipitation during the reference period 1961–1990 ca. 700 mm (Swedish Meteorological and Hydrological Institute available from: www.smhi.se). The forest stand was approximately 90 years old with a site index of 25 m height of dominant and co-dominant Scots pine trees in the stand at a base age of 100 years. In total 10 ha was left as retention areas, particularly on swampy ground. A total of 12,300 cubic meters was harvested, where 55% was Scots pine trees, 44% Norway spruce trees, and 1 % birch trees. Mean DBH for Scots pine was 29 cm (23–41 cm representing 90% of the standing tree volume) whereas Norway spruce and birch had mean DBH of 22 and 16 cm, respectively (17–28 cm respective 12–39 cm representing 90% of the standing tree volumes). The harvester generated information and spatial position for over 26,000 study stumps. To test how proximity to an area of high conservation value affects the MAPStump-DSS performance, we placed a fictive nature reserve adjacent to the stand in our GIS module (Figure 1).
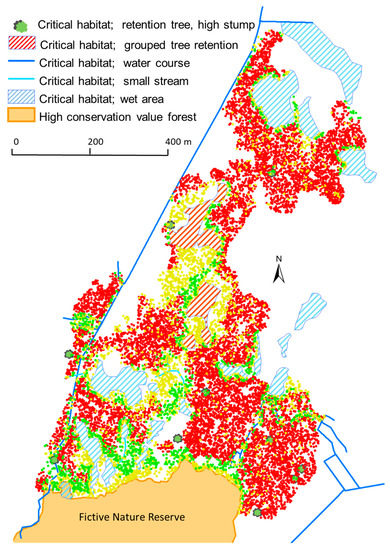
Figure 1.
Map of Abrahamsdammen study forest with dots representing individual harvested stumps according to the MAPStump-DSS under the medium bioenergy price scenario. All stumps of all colours (red, yellow and green dots) were harvested under the low level biodiversity scenario. These stumps represent 74% of all stumps on site. At medium biodiversity scenarios; red and green stumps were harvested. At high biodiversity scenarios; only red stumps were harvested.
In order to investigate how the level of biodiversity conservation and bioenergy market prices affect the MAPStump-DSS outcome we created nine scenarios. These scenarios consisted of three biodiversity scenarios with different levels of conservation concern and three economy scenarios with different price levels for bioenergy. The price levels were: low (−20% as compared with the baseline level of 8.5 EUR/MWh), medium (same as the baseline), and high (+20% compared with baseline). The three biodiversity scenarios were based on the current scientific literature, government recommendations, and experts’ evaluation of stump values for biodiversity (see biodiversity submodel BM, Section 2.3 and Section 2.4 for further details). In the lowest level of biodiversity conservation, biodiversity was not considered at all. In the medium and high levels, stumps within buffer zones around the fictive nature reserve and critical habitat such as individual retention trees and aggregated tree patches, wet areas and streams, were assigned higher biodiversity conservation values. The difference between the medium and the high level of biodiversity conservation was that the buffer zones in the high level were double those in the medium level (following a sigmoid function; Figure 2). We also used the biodiversity submodel to identify stumps that have high conservation value based not only on their position, but also giving higher values to large diameter stumps and stumps of deciduous tree species.
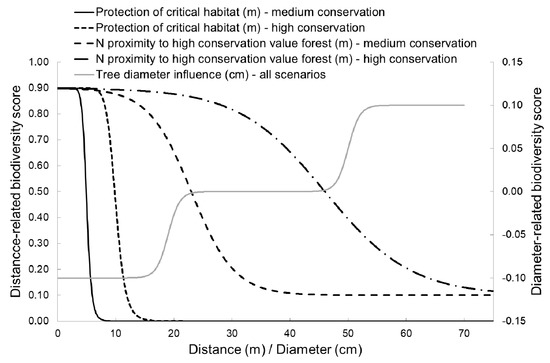
Figure 2.
Scenario-specific response functions of factors in the biodiversity submodel, where high values indicate considerable risk of damage upon harvesting, i.e., inverse biodiversity scores. Black lines and the y-axis on the left indicate distance-related scores (m) and the grey line and the y-axis on right indicate stump diameter related scores (cm).
2.3. The Biodiversity Submodel (BM)
Defining the biodiversity score SB for each stump involved a set of criteria relating to the importance for dependent (affiliate) biodiversity and location of stumps. Biodiversity criteria selection was based on scientific literature [3,18,19,22,29], current government recommendations [14], and expert evaluation. Expert evaluation refers to the estimation of potential impacts of stump harvest on the viability of deadwood affiliate biodiversity, obtained through semi-structured, face-to-face interviews conducted iteratively during the MAPStump-DSS development phase. A minimum of two species experts were interviewed concerning the potential stump harvesting effects on each of four specific organism groups. The criteria for selecting experts to interview were that they should be employed as a species expert or researcher at a university and have several years of field-based or research-based expertise on the habitat values of stumps and other types of deadwood for their organism group, in a Swedish context. The four organism groups considered were bryophytes (mosses and liverworts), fungi, insects (mainly beetles) and lichens dependent on deadwood. These deadwood-dependent groups were selected for evaluation, because they constitute some of the most abundant and diverse organism groups inhabiting deadwood, with many red-listed species [47]. The objective of these semi-structured interviews was two-fold: (i) to identify main problems related to stump harvest for a majority of deadwood affiliate biodiversity (open-ended qualitative questions), and (ii) to assign biodiversity scores for stumps (short answer or rating-scale responses). Detailed information, interview questions and relevant literature are available in the Supplementary Material S1: Expert evaluation of biodiversity criteria during stump harvest.
A few important biodiversity criteria were identified based on the scientific literature, government recommendations, and experts’ evaluation. It was highly important to consider the individual stumps’ characteristics, particularly size and tree species, as well as the organism groups’ dependency on sun-exposed deadwood; particularly evaluating the importance of stumps for common species that are obligate (strictly) or facultative (partly) deadwood dependent was identified as important. The importance of stumps for species (foremost beetles) of conservation concern and red-listed species was highlighted. Also, the protection of critical habitat and evaluating the importance of stumps in close proximity to critical habitat or structures, such as forest streams, surrounding mature forests, tree retentions, or created high stumps was identified as important. Lastly, the proximity of shaded stumps located on the northern side of high conservation value forests (e.g., possible positive edge effects, or spillover effects, of forest-interior cryptogams in matrix habitats bordering high conservation value forests such as nature reserves; [47]) was also identified as an important biodiversity criterion. Hence, the biodiversity value of each individual stump was not only identified to be dependent on the stump characteristics and organism group dependencies, but also on local characteristics of the harvested stand and spatial placement of stumps in relation to local stand characteristics. Following an initial interview with half of the experts (see Supplementary material S1 for information) and a literature review, the final interview questions were formulated to evaluate stump values in relation to stump characteristics and location for four “species profiles”: (k1) sun-exposed deadwood obligate species, (k2) sun-exposed deadwood facultative species, (k3) sun-exposed deadwood dependent species of conservation concern and red-listed species, and (k4) species dependent on shaded stumps. Hence, the experts identified (supported by the literature and own research) these four qualitative “species profiles” as particularly important to consider in a quantitative habitat value assessment of individual stump characteristics and locations.
2.4. Score Setting in the BM
The experts’ judgments and scorings were synthesized across organism groups for the four different species profiles, where mean score values for relevant organism groups yielded the basis for the species profile scores (denoted SBP) applied in the analysis (see Table 1 for a summary of the SB score setting). The relevant organism groups for each species profile were synthesized from experts’ judgments, subsequently resulting in mean values based on fungi, insects, and lichens for profile 1–2, insects (foremost beetles) for profile 3, and foremost bryophytes for profile 4 (Table 1). The biodiversity score SB was calculated as the maximum value of 1) the SBP score, which is based on stump dependency of the four different species profiles k 1 to 4 and 2) the SBN score, which is based on proximity to critical habitat and the northern side of high conservation value forests. As briefly mentioned above, the rationale behind the latter criteria was that previous studies have shown that species of conservation interest can colonize stumps close to high conservation value areas and especially stumps that are located in shaded positions (i.e., north of conservation value forests in the northern hemisphere) [47].

Table 1.
Summary table of the criteria applied in the SB score setting of individual stumps of different tree species in the biodiversity submodel BM; species profiles k 1 to 4 (see main text for description), stump diameter influence (showing the mean values for medium sized stumps), and critical habitat influence. The relevance of the different criteria for different organism groups, as identified by experts, are listed.
The species profile score SBP was calculated using the mean value of the four profile scores (k = 1 to 4) applying equal weights to profiles:
The species profile score for species profiles 1 to 3 were estimated from tree species () while species profile 4 was estimated from degree of shade (using distance as a proxy, Figure 2) from the northern side of forest stands of high conservation values ():
The value of the term was based on the mean scoring from the expert interviews (Table 1 shows mean score values for medium diameter stumps). In general, the biodiversity scores were considered higher for birch spp. than Norway spruce and Scots pine. The degree of shade score was calculated from the north directed distance from high conservation forest stands using a sigmoid function (Figure 2). The term in Equation (5) reflects the stump diameter influence and will add 0.1 to the stump species profile score for stump diameters over 50 cm, and subtract 0.1 for stump diameters below 19 cm, according to experts’ judgements of score values for small and large stumps (Figure 2). The experts did not consider it possible to provide a more detailed score setting in relation to stump size, and the function of was defined after this evaluation, using a double sigmoid function (Figure 2). The biodiversity score for proximity to critical habitats and the northern side of high conservation value forests SBN was calculated from the distance using a sigmoid function (Figure 2).
The sigmoid functions used to describe the stump value dependency on distances from objects with high conservation values and diameter make the biodiversity score continuously decrease, with the distances defined above, and increase with stump diameter. In this way, differences in biodiversity scores could be calculated along the whole range of relevant distances and diameters (0 to ∞).
2.5. The Production Submodel (PM)
We used the PM from the MAPStump-DSS by Olsson, Hannrup, Jönsson, Larsolle, Nordström, Mörtberg, Rudolphi and Strömgren [42] to calculate each stump′s harvest value score from an economic perspective. Here we briefly describe the PM, but for the full and detailed description please see [42]. The PM is based on the estimation of the profit from stump harvest at roadside landing, excluding costs for comminution and transport. The PM predicts the profit for each stump separately using individual tree information available from the harvester of roundwood harvest. The PM is composed of functions for stump energy content as calculated using allometric biomass equations for single trees of pine and spruce following Marklund [48] and birch following Repola, et al. [49]. These equations predict the oven-dry weight of the stump biomass and in our study the independent variables of the equations were retrieved from the harvester’s production data. The prize at roadside landing was set to 8.65 EUR/MWh at baseline (also the medium economy scenario) as derived from an inquiry commissioned by the major Swedish forest companies to examine cost levels in forest fuel working operations (T. Brunberg, Forest Research Institute of Sweden, personal communication 2016). Time consumption for stump lifting was calculated using equations from von Hofsten [20], whereas time for haulage of stumps had to be substituted with an equation describing time consumption for hauling tops and branches [50] since no available data were to be found on haulage of stumps [42]. Harvester positioning track data were used to locate the terrain strip roads, while the source of the base roads was Swedish official map data layers.
2.6. Score Settings in the PM
The PM estimates the production economy criterion score SE based on the same scale as the over-all MAPStump-DSS harvest suitability score S (see above). The value of SE was estimated from the profit from stump harvesting. The profit π was calculated for each individual stump from the energy content, E [MWh], the stump biomass price at roadside landing, P [EUR/MWh], the time consumption for lifting and hauling harvested stumps, tL, tH [h], and the machine cost per hour for the stump lifter and the hauler CL, CH [EUR/h]:
A logistic sigmoid function ranging from 0 to 1 was used to express the economy criterion SE from the profit π where break-even profit (π = 0) gave the corresponding score SE = 0.5. This point {π = 0.0, SE = 0.5} also had the score′s maximum rate of change with respect to profit (see [42] for further details).
Important to note here is that the time consumed for stump hauling, tH, is dependent on the local amount of stump withdrawal per hectare, i.e., the fewer neighboring stumps harvested the higher time consumption for stump hauling. At the same time, the local stump withdrawal per hectare is dependent on the final stump harvest or no harvest decision. Calculating the harvest suitability score S will therefore require a procedure of iterative calculations of Equation (2) to find a solution. The possible stump withdrawal per hectare will therefore iteratively affect the final stump harvest decision for finding the most economical solution.
2.7. Sensitivity Analysis of the MAPStump-DSS
To evaluate the modelled variables’ influence in the MAPStump-DSS, a sensitivity analysis using the elasticity coefficient [51] was performed for all of the significant variables in the MAPStump-DSS. The elasticity coefficient is a dimensionless value representing the relative change in DSS output resulting from a relative change in each individual variable input. The elasticity coefficient was calculated by increasing each variable by 4% [51]. The sensitivity analysis was used to characterize the DSS with respect to identifying variables with high influence on the MAPStump-DSS results. Sensitivity analyses were run on both the BM and the PM.
3. Results
3.1. Outcome of Scenarios Based on Biodiversity and Economic Criteria
We ran the MAPStump-DSS for nine combinations of three biodiversity conservation and three bioenergy price scenarios for Abrahamsdammen study forest, using harvester data on characteristics and geographical positions for >26,000 stumps. The resulting relationships, in terms of stump densities (based on oven-dry biomass), between scores of production and biodiversity are presented in scatterplots (Figure 3). These plots illustrate how increasing price levels affect the proportion of stumps that exceeds the cutoff value of SE > 0.5 for when it is economically feasible to harvest (moving from the left to the right in the panel) and how the proportion of stumps that is of conservation interest increases as biodiversity conservation criteria are strengthened (moving from bottom to the top of the panel). From these plots it was evident that it was not economically feasible to harvest practically any stumps at the low market price scenario, independent of the biodiversity conservation scenario.
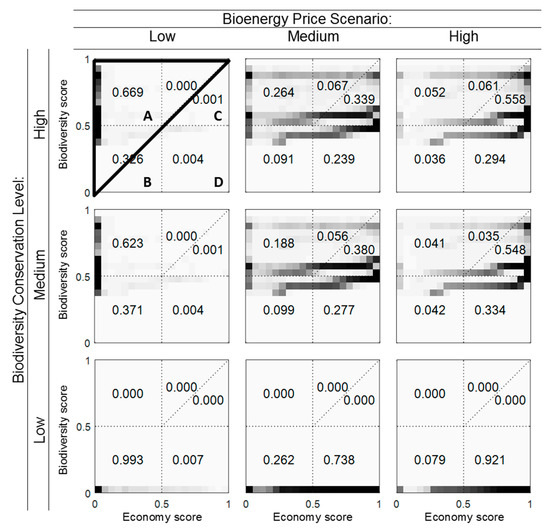
Figure 3.
Scatterplot of production and biodiversity scores according to the MAPStump-DSS of all stumps at Abrahamsdammen for nine combinations of bioenergy price scenarios (columns) and biodiversity protection scenarios (rows). For each field in the scatterplot, the grey-scaled pixels indicate the density of stumps and numbers represent the actual proportion of all stumps (both based on dry biomass). All fields above the transverse line in the upper left large triangle (A) were given a total score S < 0.5 by the overall MAPStump-DSS and were thus not considered for harvesting. All stumps in fields B, C, and D had a total score S > 0.5 and were thus suitable for harvesting. However, the economic production model excluded stumps in the small triangle field B as not profitable. Therefore, all harvested stumps were located in fields C and D. The upper right quadrant contains conflict stumps with biodiversity scores SB > 0.5 and economic scores SE > 0.5. The small lower right triangle field in quadrant C is harvested conflict stumps while the left upper triangle field is unharvested conflict stumps.
At medium and high price levels together with low biodiversity criteria (no considerations to biodiversity) the majority of the stumps (74 and 92%, respectively) were economically suitable for harvest (Figure 4a). However, when medium and high biodiversity criteria were considered, the site utility changed significantly and substantial proportions of the stumps were what we chose to call conflict stumps. Conflict stumps were defined as stumps which were economically suitable for harvest (economic score SE > 0.5) but unsuitable based on biodiversity criteria (biodiversity score SB > 0.5). These stumps represented over 40% of all stump biomass at medium price scenario and around 60% of all stump biomass at high price scenario (Figure 3). The relative total economic net return from the harvestable stumps at Abrahamsdammen was around three times as great under the high price scenarios compared to the medium price scenarios, and zero under the low-price scenarios (Figure 4b). At low bioenergy price levels, the majority of the stump biomass at the site were stumps with biodiversity scores SB > 0.5 at medium and high biodiversity scenarios (62 and 67% of stump biomass, respectively) and were not economically suitable for harvest (Figure 3 and Figure 5). At medium to high biodiversity criteria, between 24–33% of stump biomass at medium price levels and only between 8–11% of stump biomass at high price levels had biodiversity scores SB > 0.5 and could be set aside without any economic conflict (Figure 3 and Figure 5).
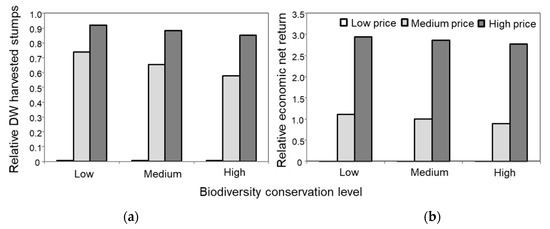
Figure 4.
Effects of nine scenarios of stump harvest with three levels of bioenergy market prices and biodiversity conservation, respectively, on (a) the total relative dry weight (DW) of harvested stump biomass and (b) total relative economic net return from harvested stumps at Abrahamsdammen. Values are relative, where 1 represents (a) the total biomass dry weight of all stumps at the site and (b) total economic net return at medium bioenergy market price and biodiversity protection scenario. Note that the value of “low” bioenergy price is zero and “low” biodiversity conservation is no protection of stumps.
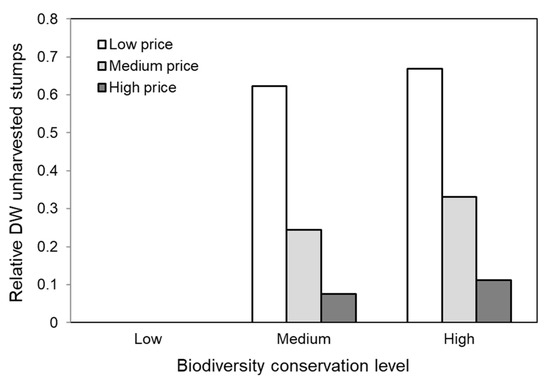
Figure 5.
The total relative dry weight of unharvestable stumps with high biodiversity scores SB > 0.5 from the total dry weight of all stumps at Abrahamsdammen, under nine scenarios of stump harvest with different levels of bioenergy market prices and biodiversity conservation.
The diameter distribution of dry weight biomass of stumps at Abrahamsdammen followed a bell-shaped distribution with average diameters of around 40 cm (range 10–70 cm; Figure 6). Increasing bioenergy prices from medium to high boosted the relative stump biomass output by making stump harvest more economically feasible to harvest, particularly in the lower diameter distribution range (20–40 cm in diameter). The biodiversity score response function for stump size was the same under medium and high biodiversity scenarios (Figure 2), hence it was not surprising that both biodiversity scenarios similarly favored a harvest of stumps skewed towards the smaller-size diameters independent of price levels (Figure 6). Collectively, these findings resulted in a greater relative biomass of conflict stumps in the 30–50 cm diameter distribution range at high price levels compared to medium price levels.
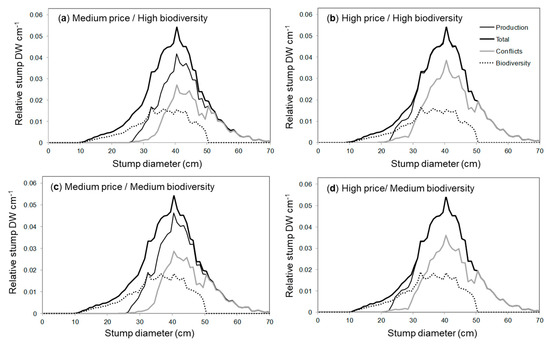
Figure 6.
Distribution of stump biomass dry weight (DW) across stump diameters (binwidth diameter class = 1 cm) based on medium and high biodiversity criteria under medium price levels ((a,c), respectively) and high price levels ((b,d), respectively) at Abrahamsdammen. Lines represent distribution of all stumps (= total), stumps with economic scores SE > 0.5 (= production); stumps that are unsuitable to harvest from a biodiversity perspective SB > 0.5 with economic scores SE < 0.5 (= biodiversity), and conflict stumps that are economically suitable for harvest SE > 0.5 but unsuitable based on biodiversity SB > 0.5 (= conflict).
Norway spruce was harvested to a greater extent than Scots pine under medium price levels, for all biodiversity conservation scenarios (Figure 7a). The dry weight of harvested Scots pine stumps also decreased substantially with increasing biodiversity conservation at medium price, whilst the reduction of harvested dry weight of Norway spruce with increasing conservation was very small. With high price levels, however, the harvested biomass of stumps generally was equally high for both Norway spruce and Scots pine at medium and high biodiversity conservation (Figure 7a). The total stump biomass was practically the same for Norway spruce and Scots pine (49.5% and 48.7% respectively). On the other hand, the average stump diameter for Scots pine (37 cm) was larger than for Norway spruce (28 cm). A stump diameter around 50 cm and above resulted in a higher biodiversity score, which more often caused the MAPStump-DSS to protect Scots pine over Norway spruce. Scots pine was also assigned slightly higher overall biodiversity scores by experts compared to Norway spruce (Table 1). Deciduous stumps were assigned the highest biodiversity scores in interviews, so it was not surprising that the harvested deciduous tree stump biomass decreased with increasing conservation levels for both medium and high bioenergy prices (Figure 7b).
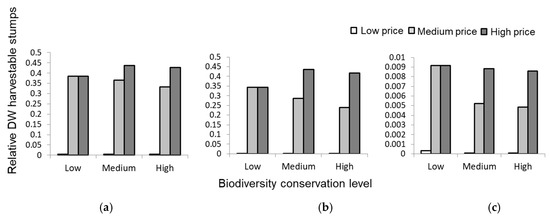
Figure 7.
Effects of nine scenarios of stump harvest with three levels of bioenergy market prices and biodiversity conservation, respectively, on the total relative dry weight (DW) of harvested stump biomass for (a) Norway spruce (Picea abies), (b) Scots pine (Pinus sylvestris) and (c) deciduous trees (mainly Betula spp.) at Abrahamsdammen. Values are relative, where 0.5 (a,b) represents half and 0.01 (c) only 1% of the total stump dry weight.
3.2. Spatial Patterns of Stump Harvest
The MAPStump-DSS provided simultaneous spatially explicit information on biodiversity and economic scores of individual stumps (Figure 1). This allows the end user to identify areas within the stand with high densities of stumps that are economically suitable for harvest whilst not jeopardizing the most valuable deadwood units and areas for biodiversity. The end user can explore and compare the spatial distribution of conflict stumps at different bioenergy price levels when changing the biodiversity conservation criteria (Figure 1). The spatial distribution of stump characteristics and costs (Figure 8) of unharvested stumps left in the soil with biodiversity score SB > 0.5 and economic scores SE < 0.5 can be explored across different scenarios. The MAPStump-DSS delineates and protects high cost stumps dependent on the spatial density of the harvested stumps and subsequent hauling times (see Supplementary material Figure S2: Maps of harvested stump density and hauling time). In order for the MAPStump-DSS to calculate the final set of harvested stumps, the DSS calculates and adjusts stump values iteratively. For each iteration, a limited number of harvested stumps with the lowest profit (highest cost) will be removed from the set of harvested stumps. The opposite occurs with the unharvested stumps with the highest profit. Consequently, areas with less favorable conditions can be entirely unharvested, while harvested stumps can be concentrated to certain favorable areas of the forest stand. This can be seen as a realistic feature of the MAPStump-DSS, it is intuitively preferable to concentrate stump harvest locally, and not harvest sparsely distributed stumps.
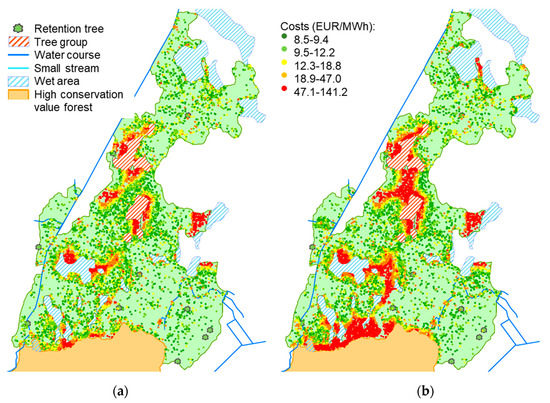
Figure 8.
The result from the MAPStump-DSS over Abrahamsdammen study forest with dots representing unharvested individual stumps with biodiversity scores SB > 0.5 and economy scores SE < 0.5 at medium (a) and high (b) biodiversity conservation scenarios, both under the medium bioenergy price scenario. The color of the dot represents the economic cost (EUR/MWh). The continuous high cost areas are the result of the hauling time dependency on the spatial density of harvested stumps (see Supplementary Material S2).
3.3. Sensitivity Analysis
From our sensitivity analysis it was clear that the production model parameter price at roadside had a strong positive influence on the profit and the harvested dry biomass (Figure 9a,b), whilst the cost per hour of forwarding and excavator lifting had a negative influence (Figure 9a,b). From the biodiversity models, Scots pine stumps had the greatest negative effect on the profit and the harvested biomass at Abrahamsdammen (Figure 9a,b), as a result of their larger size and greater importance (higher biodiversity score) for organisms depending on sun-exposed deadwood. Short distance to critical habitat, such as wet areas, retention trees and high stumps, also had a small negative influence on the profit and the harvested biomass.
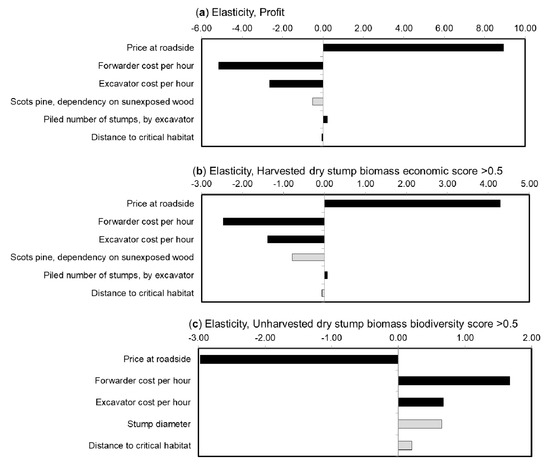
Figure 9.
Sensitivity analysis of the DSS. Parameter sensitivity was calculated as the elasticity coefficient (relative change of model with respect to relative change of parameter) on the total economic return (profit; (a)), dry weight of the harvested stump biomass (b), and unharvested stump biomass (c). Parameters in the economy submodel are shown as black bars and parameters in the biodiversity submodel as grey bars.
In opposite direction, the price at roadside had a strong negative influence on the unharvested biomass of stumps with biodiversity values SB > 0.5, whilst the cost per hour of forwarding and excavator lifting had a positive influence on them being left in the soil (Figure 9c). The stump diameter and distance to critical habitat had the greatest positive effect on the dry biomass of unharvested stumps with high biodiversity scores from all the biodiversity model parameters.
4. Discussion
4.1. The MAPStump-DSS for Assessment of Tree Stump Harvest
Our tests of the MAPStump-DSS on Abrahamsdammen study forest indicated that the DSS produced relevant spatially explicit information on the biodiversity and economic values of individual stumps, where amounts of conflict stumps increased with bioenergy price levels and strengthened biodiversity conservation to medium and high conservation scenarios. Central to the MAPStump-DSS’s value as a stump harvest support tool is its ability to a priori provide the end user with spatial information on individual stump values that can also be summarized over the whole stand. This allows the end user to identify areas within the stand with high densities of stumps that are economically suitable for harvest whilst not jeopardizing the most valuable deadwood units and areas for biodiversity. The end user can also explore trade-offs by comparing the spatial distribution of conflict stumps and obtain summaries of conflict stump values for the whole stand. Moreover, the MAPStump-DSS allows evaluation of how multiple values are influenced by changing bioenergy prices and biodiversity criteria. In contrast to general stump harvest guidelines from the Swedish Forest Agency [14] the MAPStump-DSS is operationally spatially explicit, site specific, and flexible towards evaluating multiple criteria and scenarios. More specifically, this is because of the MAPStump-DSS ability to utilize harvester data to provide (i) spatially explicit guidance for individual stumps based on the characteristics and distribution of stumps at the specific locality, (ii) the possibility to summarize trade-offs (i.e., conflict stumps) between biodiversity and economic criteria, and (iii) the flexibility to evaluate how changes in markets (i.e., possible future bioenergy prices) or societal/end-user preferences (i.e., level of biodiversity conservation, specific biodiversity criteria) could influence biodiversity and economic values.
The earlier DSS (called MAPStump-E) by Olsson, Hannrup, Jönsson, Larsolle, Nordström, Mörtberg, Rudolphi and Strömgren [42] showed that the MCA framework can function well as a support tool in stump harvest decisions concerning goals for soil protection and water quality against goals for economical profit. We now extend this DSS by demonstrating that it can also include and evaluate both qualitative and quantitative experts′ evaluations of stump biodiversity values. Similar to our study, the earlier DSS demonstrated a strong influence of the price of bioenergy on the biomass of stumps suitable for harvest. However, the proportion of conflict stumps was greater when considering biodiversity criteria than when considering soil protection and water quality criteria. At medium bioenergy price scenarios and medium biodiversity or environmental scenarios, the proportion of conflict stump biomass at Abrahamsdammen was 12% in MAPStump-E compared to 38% in our biodiversity-focused MAPStump-DSS. The general practical and precautionary recommendation by the Swedish Forest Agency [14] is to leave 15–25% of the stump biomass unharvested, in order to protect site and water quality, biodiversity, social and cultural values. The conflict stumps in MAPStump-E generally did not surpass this recommended level, with the exception of the high price and high environmental protection scenario [42]. Our MAPStump-DSS, on the other hand, predicted conflict stump biomass proportions between 34–56% for medium and high scenarios. Given that the medium biodiversity protection scenario in our study very much adhered to the general recommendations by the Swedish Forest Agency [14] in terms of the precautionary measures taken, the higher proportion of conflict stumps predicted in our study indicates that more than the recommended 15–25% of unharvested stump biomass may have conflicting values in terms of biodiversity and economy. The proportion of conflict stump biomass is however highly site specific; the amount and distribution of conflict stump biomass is directly dependent on the local site conditions and stump characteristics.
The Abrahamsdammen study site had a high proportion of around 22% (10 ha) of the harvested area as retained trees (patches and individual trees) and wet areas. This retention level is substantially higher than the mean from the country as a whole (3–5% of harvested area; [52]), implying that conflict stump amounts arising from buffer zones around these critical habitats might be higher in Abrahamsdammen than on stands with lower retention levels and no adjacent high conservation value habitats. However, in the sensitivity analysis, the distance to critical habitat had a very small negative effect on the profit and the harvested dry biomass. Instead, it was the Scots pine stumps that had the greatest negative influence on the profit and the harvested dry biomass. This was a result of their larger size at the study site and greater importance for organisms depending on sun-exposed deadwood, compared to Norway spruce stumps [29]. Scots pine stumps also had a greater influence since they comprised a substantial proportion of 55% of the stump biomass at the study site. Deciduous stumps, which are generally considered even more valuable from a conservation perspective [29], had a small influence at Abrahamsdammen since they only compromised around 1% of the stump biomass. The stump size distribution was also important, where increasing stump diameter had the greatest positive effect among biodiversity MAPStump-DSS parameters on the unharvested dry biomass of stumps with biodiversity scores > 0.5. In summary, the tree size and species composition of the specific site will influence the resulting stump harvest profit, harvested biomass, and biodiversity values.
4.2. Limitations with the MAPStump-DSS Study and Future Development Needs
A limitation with our test of the MAPStump-DSS was that it was applied at one forest site, and we may have overestimated the effects of forest conditions specific to this study site, and underestimated conditions not well represented (see foregoing paragraph). Hence, in the future development of the model it would be valuable to test the MAPStump-DSS on a greater range of forest site conditions. Another limitation with the MAPStump-DSS is that it has no access to the spatial distribution or the abundance of other types of deadwood that jointly form habitats for deadwood-dependent organisms [29]. Some of the additional deadwood types are protected from disturbance by stump harvesting through buffer zones in the MAPStump-DSS, but not evaluated per se in relation to stump values. In the future the MAPStump-DSS could be developed to also account for the biodiversity and economic values of retaining biomass of other types of co-occurring deadwood (e.g., standing dead retention trees, high stumps, logs and fine woody debris for slash extraction), when such data is available (currently not accessible through harvester or GIS data). The lack of information of other deadwood types may be particularly limiting if the MAPStump-DSS were to be applied over several stands in a landscape, where the stumps in these stands would likely represent an even smaller fraction of all deadwood [29] and it may also be important to incorporate connectivity measures of deadwood to assess biodiversity values [53,54].
In the future the MAPStump-DSS can also be improved by merging into an extended full version of DSS that incorporates and evaluates additional trade-offs or synergies against greenhouse gas emissions as well as soil and water properties. Increasing DSS complexity will surely introduce new challenges, whereby it is important that the decision support tool is adaptive enough to maintain scientific credibility whilst still being practically operational to multiple end users (e.g., [55]). The biodiversity submodel can be improved by including additional and new information of stump-biodiversity relationships, where long-term field-based experiments and monitoring may generate new insights. The expert judgments applied do provide subjective measures of stump-biodiversity relationships, although they are based on the experts in the field and the scientific literature. Additional evaluation of these relationships would nonetheless be valuable and could be achieved by testing the sensitivity towards (i) assigning different weights to the biodiversity parameters and criteria in the analysis according to the preferences of a broader range of decision makers and stakeholders, (ii) a range of threshold values for stump harvest rather than a single mid-range value, or (iii) applying the DSS on a broad range of forest stands with varying underlying forest conditions.
The production submodel refers to the current practices of stump harvest. The components of this submodel are also possible to follow up, including predictions of harvested stump biomass and costs of stump lifting and hauling. If the submodel should be used operationally, it is important that such validation studies are undertaken.
We showed that the bioenergy market prices were crucial for MAPStump-DSS implementation. As such, the whole energy market with underlying political incentives and technological developments [8,9], and production in forestry, set the outer frames for stump harvest generally [13,56]. The forest bioenergy market is still relatively new, and prices may change quickly due to changes in demand and supply. For instance, current declines in Swedish forest-based bioenergy markets have been attributed to the increasing use of imported European waste as energy source in district heating plants in Sweden. However, with the Paris Agreement adhering to limiting the increase in the global average temperature [57], the promotion of renewable energy remains on the rise, with aims of tripling investments in renewables by the year 2030. New biomass-fired combined heat and power plants are being built, or planned to be built, and will require large amounts of forest bioenergy [56]. This requires a growing contribution from biomass from renewable sources in the overall global energy strategy [58], which may cause bioenergy prices to increase in the future. It has been proposed that higher bioenergy prices could also be beneficial if used for compensation measures where part of the increased profit is used for creation of deadwood of high quality for biodiversity [59].
4.3. Spatial Stump Harvest Planning with the MAPStump-DSS
The forest stand is the operational scale for most conventional forest management, where final tree felling and residue harvest occur at the end of the rotation period. The MAPStump-DSS and MAPStump-E are unique in providing the end user with spatial information on multiple values at the substrate level, which allow identification of individual stump values as well as aggregations of stump values within the stand ([42]; this study). At larger spatial scales, GIS-based spatially explicit DSSs for forest residue (branches and tops) production has been developed, which also implements sub-models to analyze multiple economic, production and ecological criteria [40,41]. In comparison to these models, the most innovative aspects with MAPStump-DSS and MAPStump-E is that they merge and utilize georeferenced substrate data directly from the harvester with georeferenced stand data that are increasingly available to forest managers. This allows relatively easy application of the same DSS for any forest stands and aids detailed site-specific spatial planning. The application of the MAPStump-DSS could potentially be limited by the availability of georeferenced data on critical habitats and high conservation value habitats, although such data is typically increasingly available. The flexibility to analyze different economic and biodiversity scenarios also has implications for the spatial planning of the stump harvest. If bioenergy market prices increase, then harvest of stumps with smaller dimensions or stumps located in less accessible areas of the stand become economically feasible for harvest. This could either lead to retention of larger stumps for the benefit of biodiversity or that even more biomass will be removed with potential negative effects on biodiversity.
The design and assessment of bioenergy systems can benefit from using a landscape approach that recognize spatial heterogeneity and context, but insufficient data and participation are common barriers to implementation [60]. The MAPStump-DSS could overcome some of these barriers by utilizing increasingly available stump- and stand-level data of multiple values that can be adjusted for a range of management and stakeholder objectives represented in the landscape. The biodiversity MAPStump-DSS can be used to identify which stands in a landscape that are economically and biologically feasible to harvest for stumps, whilst adjusting for different levels of biodiversity concerns and economic opportunities. Concentration of stump harvest in a few selected stands with minimum transportation logistic costs may be economically beneficial. Also, concentrating stump harvest in a few stands with maximized stump withdrawal per hectare would reduce the costs for stump hauling, and may also allow for higher levels of biodiversity concern or compensatory measures in other stands. This would require a landscape approach for the planning of stump harvest. Species dependent on ephemeral deadwood habitats need to disperse and establish themselves in new habitats in the landscape as their habitats deterministically decompose. These species are habitat-tracking organisms and are never totally independent of the landscape heterogeneity and context. However, studies on biodiversity effects from different levels of stump harvesting (e.g., retention targets) at the landscape scale are still sparse [22,29]. Theoretical work using fictive species suggests that even low levels of stump harvest have the potential to threaten species specialized on sun-exposed coarse deadwood [27]. Recent empirical work indicates, however, that for most of the associated biodiversity the habitat loss at bioenergy harvest will still be small [29]. Empirical metapopulation data and forecasts have shown that negative effects on biodiversity (and climate) may also be transient in time [61]. Summarized over many stands in a whole landscape, the MAPStump-DSS values could potentially be used to identify which stands in a landscape are biologically and economically feasible to harvest for stumps and may provide new insights or testable research ideas regarding the spatial distribution of stump values across the landscape under different levels of harvesting. This could also increase our understanding of how different levels of stump harvesting may affect national environmental objectives, such as targets of increased amounts of deadwood in managed forests (www.miljomal.se). It has also been shown that if land managers collaborate more across landscapes, with operations that are better scheduled, and if a mix of bioenergy assortments are used at the combined heat and power plants, it is possible to make forest bioenergy a more competitive source of bioenergy [56].
Supplementary Materials
The following are available online at https://www.mdpi.com/2071-1050/12/21/8900/s1, Supplementary material S1: Expert evaluation of biodiversity criteria during stump harvest and Figure S2: Maps of harvested stump density and hauling time.
Author Contributions
Conceptualization, M.J., J.S., B.H., A.L., U.M., M.N., B.A.O. and M.S.; methodology, M.J., J.S., B.H., A.L., U.M., M.N., B.A.O. and M.S.; formal analysis, A.L.; investigation, M.J., J.S., B.H., A.L., U.M., M.N., B.A.O. and M.S.; data curation, M.J. and A.L.; writing—original draft preparation, M.J., J.S., B.H., A.L., U.M., M.N., B.A.O. and M.S.; writing—review and editing, M.J., J.S., B.H., A.L., U.M., M.N., B.A.O. and M.S.; visualization, M.J. and A.L. All authors have read and agreed to the published version of the manuscript.
Funding
This research was funded by Swedish strategic research program StandUp for Energy.
Acknowledgments
We are thankful to Pär Aronsson, Per-Anders Hansson and Heléne Lundqvist for initializing the project and their contribution and support. We especially thank Helene Lundqvist for funding acquisition. We are also thankful to the species experts which contributed with their knowledge to the project and participated in interviews: Anders Dahlberg, Göran Thor, Håkan Berglund, Jonas Victorsson, Mats Jonsell, Måns Svensson, Sandro Caruso, and Tomas Hallingbäck. Three anonymous reviewers have greatly improved the quality of the manuscript.
Conflicts of Interest
The authors declare no conflict of interest. The funders had no role in the design of the study; in the collection, analyses, or interpretation of data; in the writing of the manuscript, or in the decision to publish the results.
References
- Acosta-Michlik, L.; Lucht, W.; Bondeau, A.; Beringer, T. Integrated assessment of sustainability trade-offs and pathways for global bioenergy production: Framing a novel hybrid approach. Renew. Sustain. Energy Rev. 2011, 15, 2791–2809. [Google Scholar] [CrossRef]
- Röser, D.; Asikainen, A.; Raulund-Rasmussen, K.; Møller, I.S. Sustainable Use of Wood for Energy—A Synthesis with Focus on the Nordic–Baltic Region; Springer: Berlin/Heidelberg, Germany, 2008. [Google Scholar]
- Persson, T.; Egnell, G. Stump harvesting for bioenergy: A review of climatic and environmental impacts in northern Europe and America. Wires Energy Environ. 2018, 7, e307. [Google Scholar] [CrossRef]
- Routa, J.; Brännström, H.; Anttila, P.; Mäkinen, M.; Jänis, J.; Asikainen, A. Wood Extractives of Finnish Pine, Spruce and Birch–Availability and Optimal Sources of Compounds: A Literature Review; Natural Resources Institute Finland (Luke): Helsinki, Finland, 2017; p. 55. [Google Scholar]
- Jonsson, R. How to cope with changing demand conditions-The Swedish forest sector as a case study: An analysis of major drivers of change in the use of wood resources. Can. J. For. Res. 2013, 43, 405–418. [Google Scholar] [CrossRef]
- Helmisaari, H.S.; Kaarakka, L.; Olsson, B.A. Increased utilization of different tree parts for energy purposes in the Nordic countries. Scand. J. For. Res. 2014, 29, 312–322. [Google Scholar] [CrossRef]
- Laitila, J.; Nuutinen, Y. Efficiency of Integrated Grinding and Screening of Stump Wood for Fuel at Roadside Landing with a Low-Speed Double-Shaft Grinder and a Star Screen. Croat. J. Eng. 2015, 36, 19–32. [Google Scholar]
- Laitila, J.; Poikela, A.; Ovaskainen, H.; Vaatainen, K. Novel extracting methods for conifer stumps. Int. J. For. Eng. 2019, 30, 56–65. [Google Scholar] [CrossRef]
- Laitila, J.; Ranta, T.; Asikainen, A.; Jappinen, E.; Korpinen, O.J. The cost competitiveness of conifer stumps in the procurement of forest chips for fuel in Southern and Northern Finland. Silva. Fenn. 2015, 49. [Google Scholar] [CrossRef]
- Verkerk, P.J.; Anttila, P.; Eggers, J.; Lindner, M.; Asikainen, A. The realisable potential supply of woody biomass from forests in the European Union. For. Ecol. Manag. 2011, 261, 2007–2015. [Google Scholar] [CrossRef]
- Egnell, G.; Börjesson, P. Theoretical Versus Market Available Supply of Biomass for Energy from Long-Rotation Forestry and Agriculture–Swedish Experiences; IEA Bioenergy: Umeå, Sweden, 2012. [Google Scholar]
- SKA. Skogliga Konsekvensanalyser 2015–SKA15; Swedish Forest Agency: Jönköping, Sweden, 2015.
- Johansson, J.; Ranius, T. Biomass outtake and bioenergy development in Sweden: The role of policy and economic presumptions. Scand. J. For. Res. 2019, 34, 771–778. [Google Scholar] [CrossRef]
- Swedish Forest Agency. Stubbskörd–Kunskapssammanställning Och Skogsstyrelsens Rekommendationer; Swedish Forest Agency: Jönköping, Sweden, 2009.
- Swedish Government. En Skogspolitik I Takt Med Tiden; Ministry of Environment, Ministry of Enterprise, Eds.; Swedish Government: Stockholm, Sweden, 2008.
- Lahtinen, K.; Myllyviita, T.; Leskinen, P.; Pitkanen, S.K. A systematic literature review on indicators to assess local sustainability of forest energy production. Renew. Sustain. Energy Rev. 2014, 40, 1202–1216. [Google Scholar] [CrossRef]
- Lundmark, R.; Athanassiadis, D.; Wetterlund, E. Supply assessment of forest biomass-A bottom-up approach for Sweden. Biomass Bioenergy 2015, 75, 213–226. [Google Scholar] [CrossRef]
- Walmsley, J.D.; Godbold, D.L. Stump Harvesting for Bioenergy-A Review of the Environmental Impacts. Forestry 2010, 83, 17–38. [Google Scholar] [CrossRef]
- Ranius, T.; Hämäläinen, A.; Egnell, G.; Olsson, B.; Eklöf, K.; Stendahl, J.; Rudolphi, J.; Stens, A.; Felton, A. The effects of logging residue extraction for energy on ecosystem services and biodiversity: A synthesis. J. Environ. Manag. 2018, 209, 409–425. [Google Scholar] [CrossRef]
- von Hofsten, H. Skörd av Stubbar. Nuläge Och Utvecklingsbehov. Reviderad Version 2011. [Stump Harvesting. Present Situation and Need for Development. Revised Version 2011]; Skogforsk: Uppsala, Sweden, 2010. [Google Scholar]
- Strengbom, J.; Dahlberg, A.; Larsson, A.; Lindelöw, A.; Sandström, J.; Widenfalk, O.; Gustafsson, L. Introducing Intensively Managed Spruce Plantations in Swedish Forest Landscapes will Impair Biodiversity Decline. Forests 2011, 2, 610–630. [Google Scholar] [CrossRef]
- de Jong, J.; Akselsson, C.; Egnell, G.; Löfgren, S.; Olsson, B.A. Realizing the energy potential of forest biomass in Sweden-How much is environmentally sustainable? For. Ecol. Manag. 2017, 383, 3–16. [Google Scholar] [CrossRef]
- Rahman, A.; Khanam, T.; Pelkonen, P. People’s knowledge, perceptions, and attitudes towards stump harvesting for bioenergy production in Finland. Renew. Sustain. Energy Rev. 2017, 70, 107–116. [Google Scholar] [CrossRef]
- Geijer, E.; Andersson, J.; Bostedt, G.; Brännlund, R.; Hjältén, J. Is Stump Harvesting a Remedy for the Climate Crisis or a Curse for Biodiversity? An Interdisciplinary Study of Conflicting Goals. CERE Work. Pap. 2012, 2012. [Google Scholar] [CrossRef]
- Jonsell, M.; Schroeder, M. Proportions of saproxylic beetle populations that utilise clear-cut stumps in a boreal landscape-Biodiversity implications for stump harvest. For. Ecol. Manag. 2014, 334, 313–320. [Google Scholar] [CrossRef]
- Svensson, M.; Dahlberg, A.; Ranius, T.; Thor, G. Occurrence Patterns of Lichens on Stumps in Young Managed Forests. PLoS ONE 2013, 8. [Google Scholar] [CrossRef]
- Johansson, V.; Felton, A.; Ranius, T. Long-term landscape scale effects of bioenergy extraction on dead wood-dependent species. For. Ecol. Manag. 2016, 371, 103–113. [Google Scholar] [CrossRef]
- Bouget, C.; Lassauce, A.; Jonsell, M. Effects of fuelwood harvesting on biodiversity-A review focused on the situation in Europe. Can. J. For. Res. 2012, 42, 1421–1432. [Google Scholar] [CrossRef]
- Hiron, M.; Jonsell, M.; Kubart, A.; Thor, G.; Schroeder, M.; Dahlberg, A.; Johansson, V.; Ranius, T. Consequences of bioenergy wood extraction for landscape-level availability of habitat for dead wood-dependent organisms. J. Environ. Manag. 2017, 198, 33–42. [Google Scholar] [CrossRef]
- Ranius, T.; Hämäläinen, A.; Sjögren, J.; Hiron, M.; Jonason, D.; Kubart, A.; Schroeder, M.; Dahlberg, A.; Thor, G.; Jonsell, M. The evolutionary species pool concept does not explain occurrence patterns of dead-wood-dependent organisms: Implications for logging residue extraction. Oecologia 2019, 191, 241–252. [Google Scholar] [CrossRef] [PubMed]
- Jonsell, M.; Ols, C.; Victorsson, J.; Hellqvist, S. Diptera in clear-felling stumps like it dry. Scand. J. For. Res. 2019, 34, 673–677. [Google Scholar] [CrossRef]
- Jonsell, M.; Hansson, J. Logs and Stumps in Clearcuts Support Similar Saproxylic Beetle Diversity: Implications for Bioenergy Harvest. Silva. Fenn. 2011, 45, 1053–1064. [Google Scholar] [CrossRef]
- Victorsson, J.; Jonsell, M. Effects of stump extraction on saproxylic beetle diversity in Swedish clear-cuts. Insect Conserv. Diver 2013, 6, 483–493. [Google Scholar] [CrossRef]
- Kangas, J.; Kangas, A. Multiple criteria decision support in forest management-the approach, methods applied, and experiences gained. For. Ecol. Manag. 2005, 207, 133–143. [Google Scholar] [CrossRef]
- Diaz-Balteiro, L.; Romero, C. Making forestry decisions with multiple criteria: A review and an assessment. For. Ecol. Manag. 2008, 255, 3222–3241. [Google Scholar] [CrossRef]
- Nordström, E.M.; Holmström, H.; Öhman, K. Evaluating continuous cover forestry based on the forest owner’s objectives by combining scenario analysis and multiple criteria decision analysis. Silva. Fenn. 2013, 47. [Google Scholar] [CrossRef]
- Röser, D.; Pasanen, K.; Asikainen, A. Decision-support program “EnerTree” for analyzing forest residue recovery options. Biomass Bioenergy 2006, 30, 326–333. [Google Scholar] [CrossRef]
- Myllyviita, T.; Leskinen, P.; Leihtinen, K.; Pasanen, K.; Sironen, S.; Ktihkonen, T.; Sikanen, L. Sustainability assessment of wood-based bioenergy-A methodological framework and a case-study. Biomass Bioenergy 2013, 59, 293–299. [Google Scholar] [CrossRef]
- Carnbero, C.; Sowlati, T. Assessment and optimization of forest biomass supply chains from economic, social and environmental perspectives-A review of literature. Renew. Sustain. Energy Rev. 2014, 36, 62–73. [Google Scholar] [CrossRef]
- Sacchelli, S.; De Meo, I.; Paletto, A. Bioenergy production and forest multifunctionality: A trade-off analysis using multiscale GIS model in a case study in Italy. Appl. Energy 2013, 104, 10–20. [Google Scholar] [CrossRef]
- Pang, X.; Nordström, E.M.; Bottcher, H.; Trubins, R.; Mörtberg, U. Trade-offs and synergies among ecosystem services under different forest management scenarios-The LEcA tool. Ecosyst. Serv. 2017, 28, 67–79. [Google Scholar] [CrossRef]
- Olsson, B.A.; Hannrup, B.; Jönsson, M.; Larsolle, A.; Nordström, M.; Mörtberg, U.; Rudolphi, J.; Strömgren, M. A decision support model for individual tree stump harvesting options based on criteria for economic return and environmental protection. Scand. J. For. Res. 2017, 32, 246–259. [Google Scholar] [CrossRef]
- Arlinger, J.; Möller, J.J.; Sondell, J. A Description of Pri-Files. Background, Structure and Examples; Skogforsk: Uppsala, Sweden, 2003. [Google Scholar]
- Arlinger, J.; Nordström, M.; Möller, J.J. StanForD 2010. Modern Communication with Forest Machines; Skogforsk: Uppsala, Sweden, 2012. [Google Scholar]
- Ananda, J.; Herath, G. The use of Analytic Hierarchy Process to incorporate stakeholder preferences into regional forest planning. For. Policy Econ. 2003, 5, 13–26. [Google Scholar] [CrossRef]
- Keeney, R.L.; Raiffa, H. Decision Making with Multiple Objectives Preferences and Value Tradeoffs; Wiley: New York, NY, USA, 1976. [Google Scholar]
- Caruso, A.; Rudolphi, J.; Rydin, H. Positive Edge Effects on Forest-Interior Cryptogams in Clear-Cuts. PLoS ONE 2011, 6. [Google Scholar] [CrossRef]
- Marklund, L.G. Biomassafunktioner för Tall, Gran Och Björk I Sverige. [Biomass Functions for Pine, Spruce and Birch in Sweden.]; Institutionen för Skogstaxering: Umeå, Sweden, 1988; p. 100. [Google Scholar]
- Repola, J.; Ojansuu, R.; Kukkola, M. Biomass Functions for Scots Pine, Norway Spruce and Birch in Finland; Finnish Forest Research Institute: Helsinki, Finland, 2007; p. 28.
- Brunberg, T.; Eliasson, L. Basis for Production Standard for Tops and Branches Forwarders (Underlag för Produktionsnorm för Grotskotare); Swedish Forest Research Institute: Uppsala, Sweden, 2013. [Google Scholar]
- Loucks, D.P.; van Beek, E.; Stedinger, J.R.; Dijkman, J.P.M.; Villars, M.T. Model sensitivity and uncertainty analysis. In Water Resources Systems Planning and Management—An Introduction to Methods, Models and Applications; Springer: Cham, Switzerland, 2005. [Google Scholar]
- Gustafsson, L.; Baker, S.C.; Bauhus, J.; Beese, W.J.; Brodie, A.; Kouki, J.; Lindenmayer, D.B.; Lohmus, A.; Pastur, G.M.; Messier, C.; et al. Retention Forestry to Maintain Multifunctional Forests: A World Perspective. Bioscience 2012, 62, 633–645. [Google Scholar] [CrossRef]
- Ranius, T.; Snll, T.; Nordn, J. Importance of spatial configuration of deadwood habitats in species conservation. Conserv. Biol. 2019, 33, 1205–1207. [Google Scholar] [CrossRef]
- Komonen, A.; Muller, J. Dispersal ecology of deadwood organisms and connectivity conservation. Conserv. Biol. 2018, 32, 535–545. [Google Scholar] [CrossRef]
- Buchholz, T.S.; Volk, T.A.; Luzadis, V.A. A participatory systems approach to modeling social, economic, and ecological components of bioenergy. Energy Policy 2007, 35, 6084–6094. [Google Scholar] [CrossRef]
- Flisberg, P.; Frisk, M.; Ronnqvist, M.; Guajardo, M. Potential savings and cost allocations for forest fuel transportation in Sweden: A country-wide study. Energy 2015, 85, 353–365. [Google Scholar] [CrossRef]
- United Nations Framework Convention on Climate Change. Adoption of the Paris Agreement; United Nations: Paris, Franse, 2015. [Google Scholar]
- Banja, M.; Jégard, M.; Monforti-Ferrario, F.; Dallemand, J.-F.; Taylor, N.; Motola, V.; Sikkema, R. Renewables in the EU: An Overview of Support Schemes and Measures; European Commission, Joint Research Centre: Ispra, Italy, 2017. [Google Scholar]
- Ranius, T.; Caruso, A.; Jonsell, M.; Juutinen, A.; Thor, G.; Rudolphi, J. Dead wood creation to compensate for habitat loss from intensive forestry. Biol. Conserv. 2014, 169, 277–284. [Google Scholar] [CrossRef]
- Dale, V.H.; Kline, K.L.; Buford, M.A.; Volk, T.A.; Smith, C.T.; Stupak, I. Incorporating bioenergy into sustainable landscape designs. Renew. Sustain. Energy Rev. 2016, 56, 1158–1171. [Google Scholar] [CrossRef]
- Snall, T.; Johansson, V.; Jonsson, M.; Ortiz, C.; Hammar, T.; Caruso, A.; Svensson, M.; Stendahl, J. Transient trade-off between climate benefit and biodiversity loss of harvesting stumps for bioenergy. Gcb Bioenergy 2017, 9, 1751–1763. [Google Scholar] [CrossRef]
Publisher’s Note: MDPI stays neutral with regard to jurisdictional claims in published maps and institutional affiliations. |
© 2020 by the authors. Licensee MDPI, Basel, Switzerland. This article is an open access article distributed under the terms and conditions of the Creative Commons Attribution (CC BY) license (http://creativecommons.org/licenses/by/4.0/).