Characteristics Analysis of Commercial Gentrification in Seoul Focusing on the Vitalization of Streets in Residential Areas


Abstract
1. Introduction
2. Gentrification
2.1. Definition of Gentrification
2.2. Retail/Commercial Gentrification in Seoul
3. Research Methodology
3.1. Analytic Frame
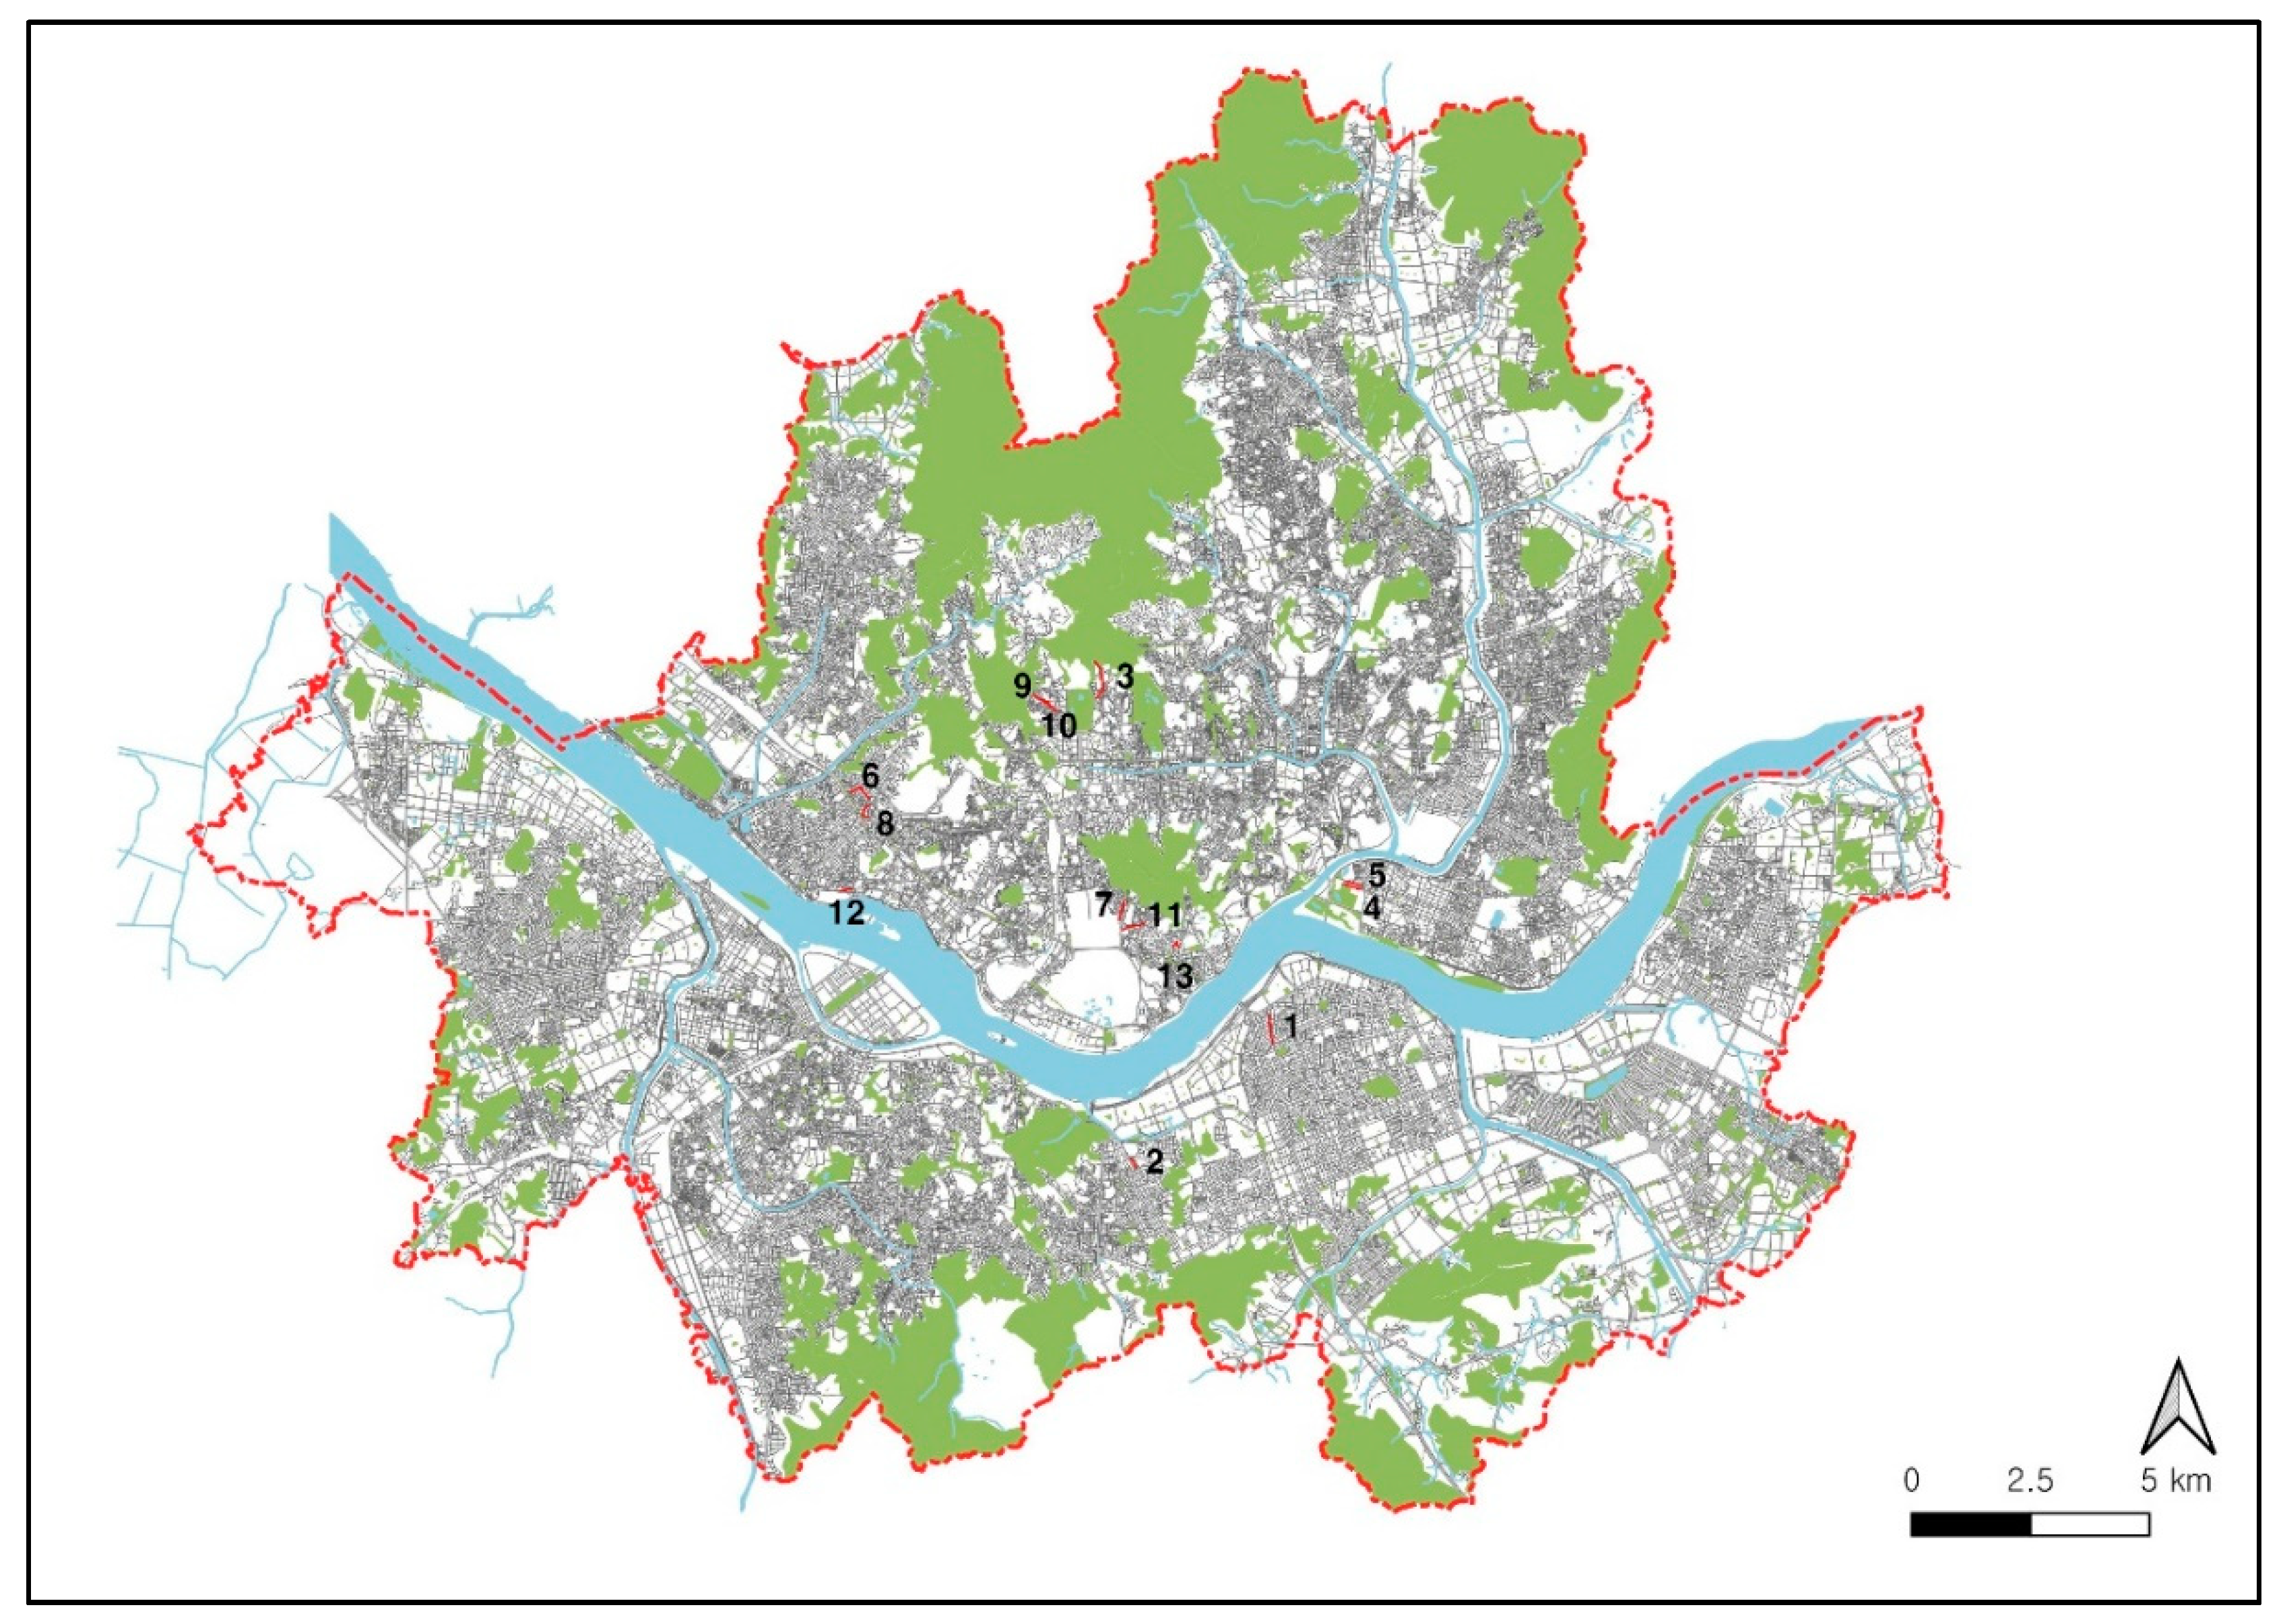
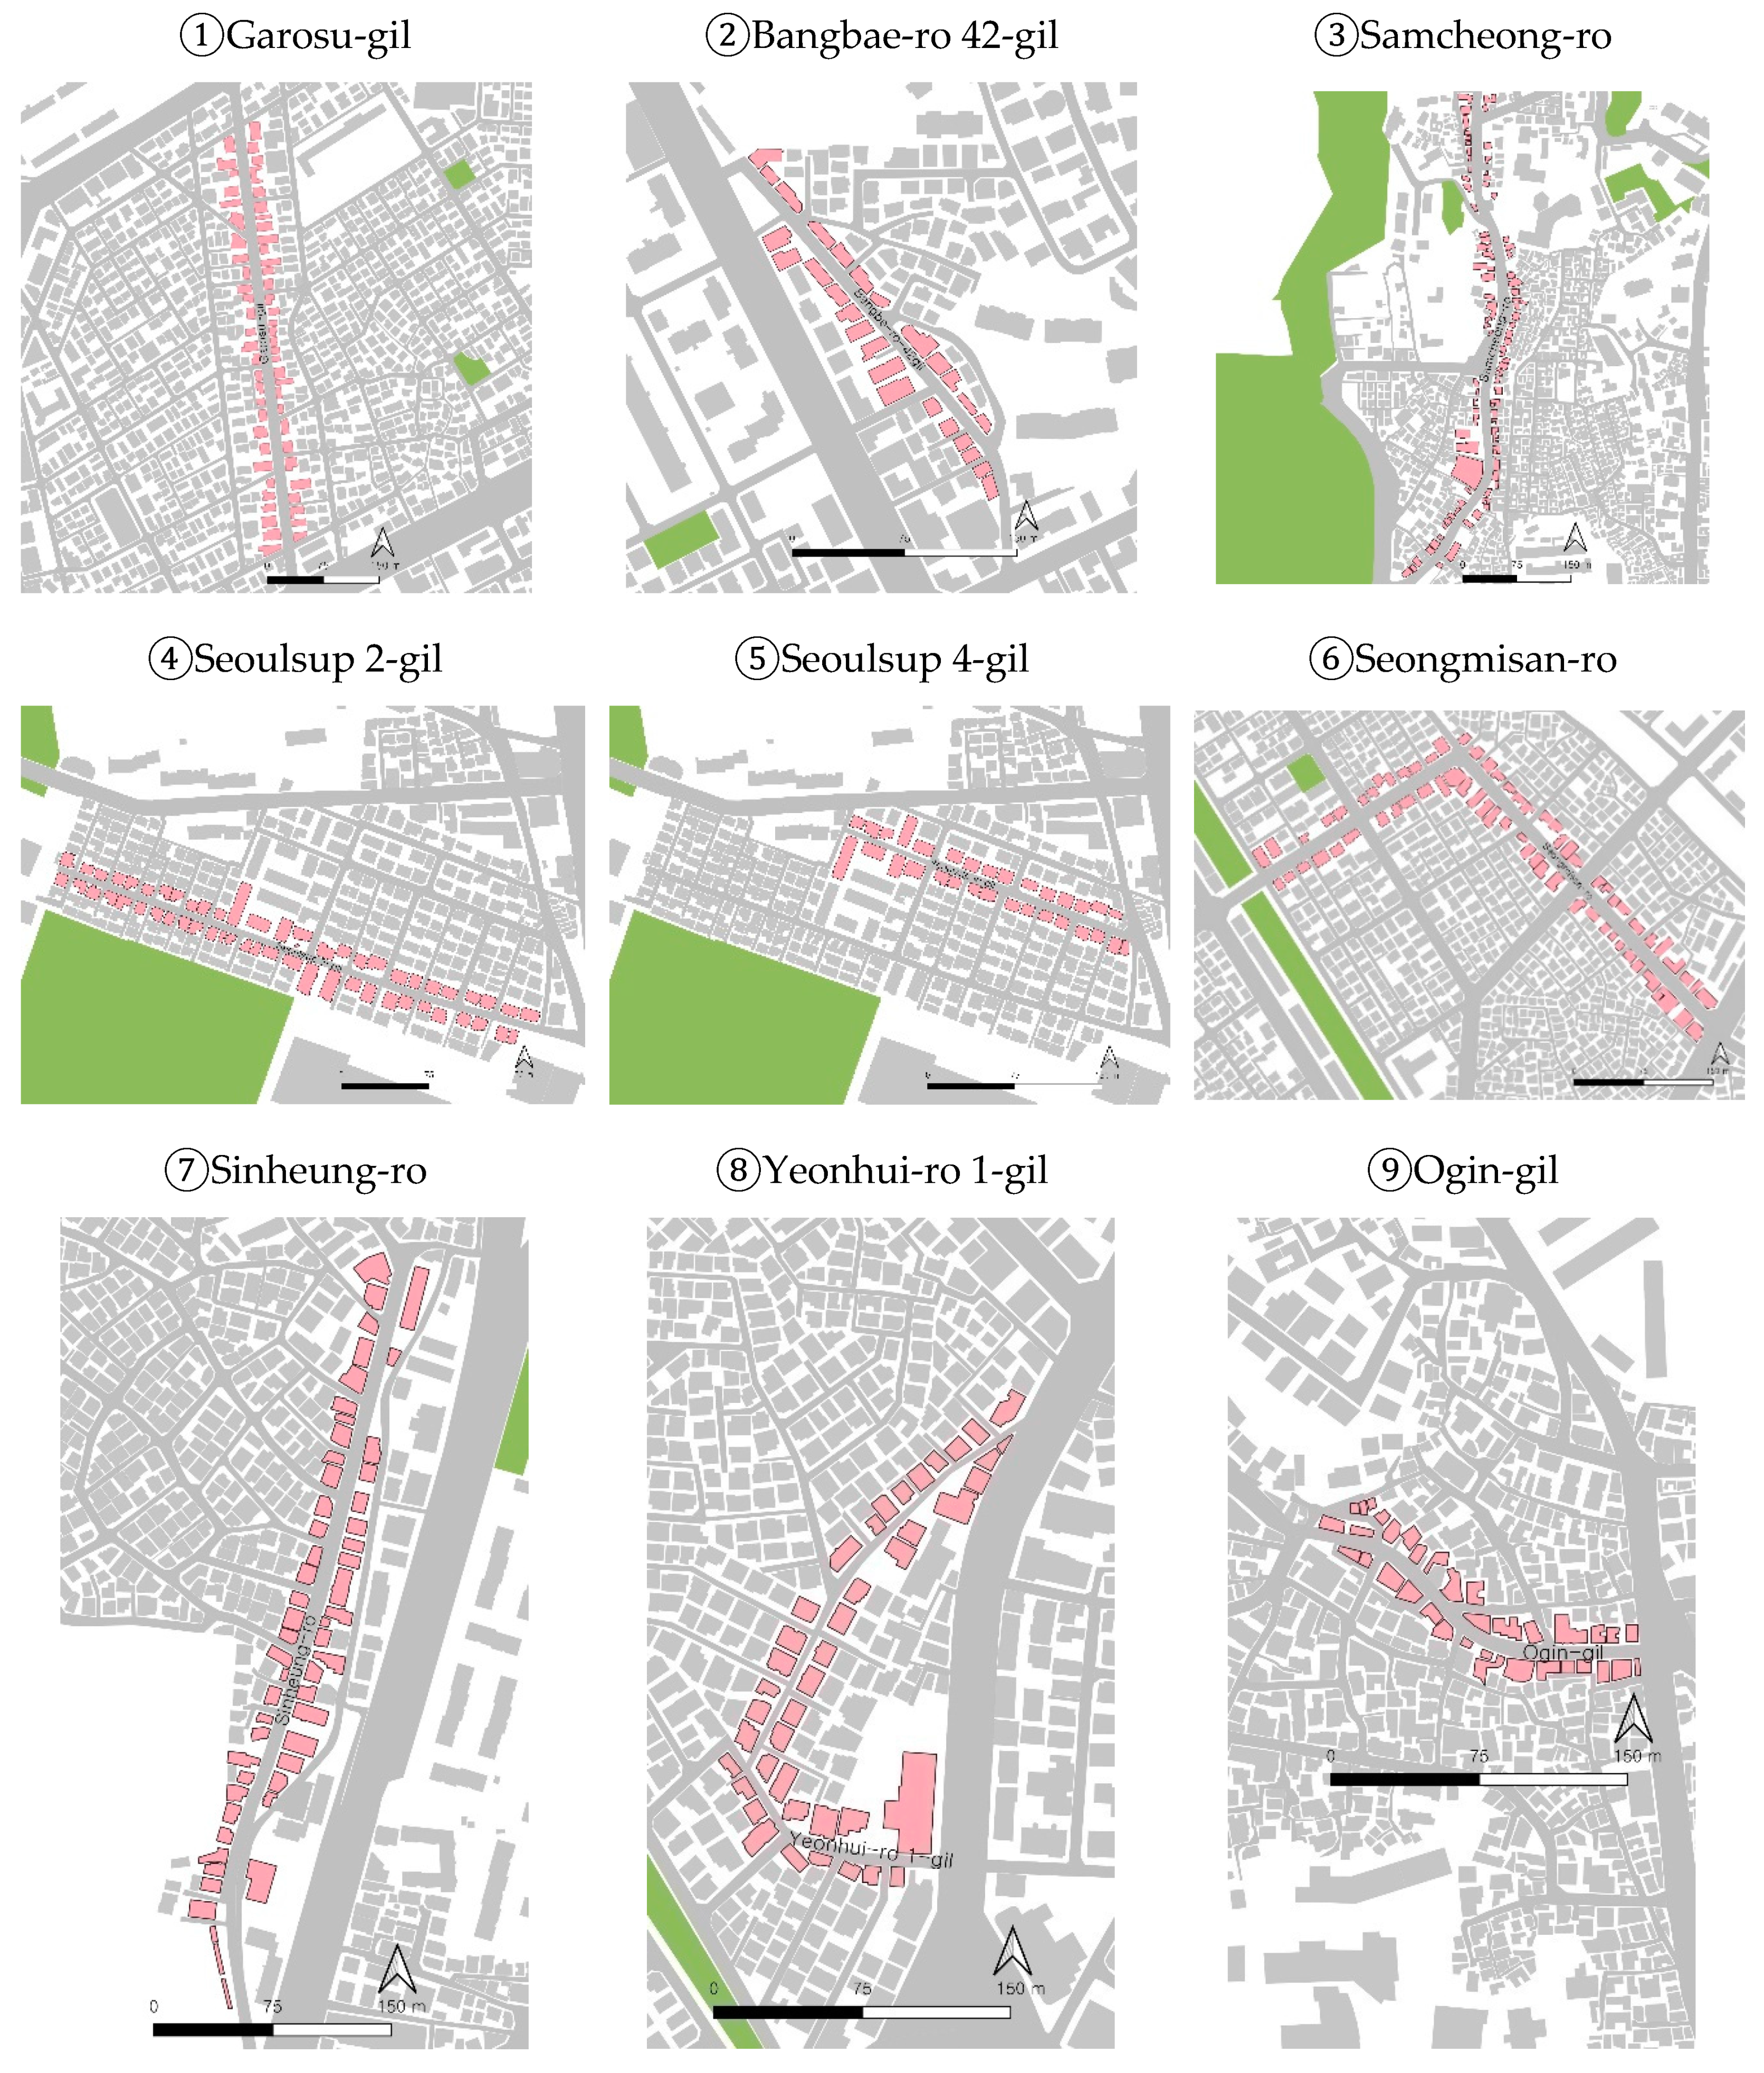
3.2. Study Site
3.3. Cluster Analysis
4. Variables
4.1. Birth
4.2. Replacement
4.3. Vacancy
4.4. Homogenization Index
4.5. Chain Stores
4.6. Vitalization
4.7. Front Width of Stores
5. Analysis
5.1. Basic Statistics
5.2. Cluster Statistics
5.3. Cluster Characteristic Analysis
6. Conclusions
Author Contributions
Funding
Conflicts of Interest
Appendix A


References
- Park, N.; Han, B. Discourses on the Meaning of Consumption in Cultural Space: Case Study of Free Admission Policy. J. Tour. Sci. 2009, 8, 145–168. [Google Scholar]
- Lee, I.; Bae, J. Transition of Building Uses in the Culture-based Vitalization of Commercial Streets—A Case Study of Garosu-Gil, Seoul. J. Urban Des. Inst. Korea Urban Des. 2013, 14, 127–140. [Google Scholar]
- Zukin, S.; Trujillo, V.; Frase, P.; Jackson, D.; Recuber, T.; Walker, A. New retail capital and neighborhood change: Boutiques and gentrification in New York City. City Commun. 2009, 8, 47–64. [Google Scholar] [CrossRef]
- Park, R.E. The City: Suggestions for the Investigation of Human Behavior in the City Environment. Am. J. Sociol. 1915, 20, 577–612. [Google Scholar] [CrossRef]
- Yoon, Y.; Park, J. The Rate of Commercial Gentrification in Seoul focusing on Changing Type of Business. Seoul Inst. 2016, 17, 17–32. [Google Scholar]
- Cohen, J. The cost of dichotomization. Appl. Psychol. Meas. 1983, 7, 249–253. [Google Scholar] [CrossRef]
- Relph, E. Place and Placelessness; Pion Ltd.: London, UK, 1976. [Google Scholar]
- Arefi, M. Non-place and placelessness as narratives of loss: Rethinking the notion of place. J. urban Des. 1999, 4, 179–193. [Google Scholar] [CrossRef]
- Choe, H.; Kim, Y.; Gu, D.; Lee, J. Understanding of Urban Landscape in Seoul; Association of Space & Environment Research: Seoul, Korean, 1993. [Google Scholar]
- Ritzer, G. The McDonaldization of Society, 5th ed.; Pine Forge Press: Oaks, CA, USA, 2008. [Google Scholar]
- The Korea Times. Impact of Gentrification. 2016. Available online: http://www.koreatimes.co.kr/www/news/opinon/2016/02/202_196220.html (accessed on 26 October 2020).
- Glass, R. Introduction to London: Aspects of Change; Centre for Urban Studies: London, UK, 1963. [Google Scholar]
- Atkinson, R.; Bridge, G. The New Urban Colonialism: Gentrification in a Global Context; Routledge: London, UK, 2004. [Google Scholar]
- Lees, L. Gentrification and social mixing: Towards an inclusive urban renaissance? Urban Stud. 2008, 45, 2449–2470. [Google Scholar] [CrossRef]
- Glass, R. London: Aspects of Change; MacGibbon & Kee: London, UK, 1964. [Google Scholar]
- Hamnett, C. Gentrification and urban location theory: A review and assessment. Progress in research and applications. Geogr. Urban Environ. 1984, 6, 283–319. [Google Scholar]
- Criekingen, M.; Decroly, J.M. Revisiting the diversity of gentrification: Neighbourhood renewal processes in Brussels and Montreal. Urban Stud. 2003, 40, 2451–2468. [Google Scholar] [CrossRef]
- Smith, N.; Williams, P. Alternatives to orthodoxy: Invitation to a debate. In Gentrification of the City; Routledge: London, UK, 1986; pp. 1–10. [Google Scholar]
- Hamnett, C. The blind men and the elephant: The explanation of gentrification. Trans. Inst. Br. Geogr. 1991, 1, 173–189. [Google Scholar] [CrossRef]
- Clark, E. The Order and Simplicity of Gentrification: A Political Challenge; Routledge: London, UK, 2005; pp. 261–269. [Google Scholar]
- Rodríguez-Barcón, A.; Calo, E.; Otero-Enríquez, R. Commercial gentrification in a medium-sized city: An ethnographic look at the transformation process of the historic centre of a Coruña (Spain). Urbanities-J. Urban Ethnogr. 2018, 8, 87–96. [Google Scholar]
- Wang, S.W.H. Commercial gentrification and entrepreneurial governance in shanghai: A case study of Taikang road creative cluster. Urban Policy Res. 2011, 29, 363–380. [Google Scholar] [CrossRef]
- Heo, J.; Jeong, Y.; Jung, C. Gentrification process and changing shop owners in commercial area on Gyeongridan street. Seoul Stud. 2015, 16, 19–33. [Google Scholar]
- Kim, H. A study on revitalization factors of garosu-gil and samcheongdong-gil, seoul. J. Archit. Inst. Korea. 2010, 26, 325–334. [Google Scholar]
- Lee, S.; Shin, G.; Yang, S. The development process and the livability factors of Garosu-gil as a commercial street in Sinsa-dong, Seoul. J. Urban Des. Inst. Korea 2011, 12, 77–88. [Google Scholar]
- Park, J.-A.; Jung, Y.-J. A Study on the occupancy of franchisor as the change factor of the identity in Commercial Street, Focused on Samcheongdong-Gil. J. Archit. Inst. Korea Plan. Des. 2013, 29, 215–223. [Google Scholar]
- Benediktsson, M.O.; Lamberta, B.; Larsen, E. Taming a “chaotic concept”: Gentrification and segmented consumption in Brooklyn, 2002–2012. Urban Geogr. 2016, 37, 590–610. [Google Scholar] [CrossRef]
- Yoon, Y.; Park, J. Stage classification and characteristics analysis of commercial gentrification in Seoul. Sustainability 2018, 10, 2440. [Google Scholar] [CrossRef]
- Choi, M.; Yang, W. Physical, economic, and social effects of commercial gentrification in residential area. J. Korea Plan. Assoc. 2018, 53, 123–136. [Google Scholar] [CrossRef]
- Kim, H.; Choi, M. Characteristics of commercial gentrification and change in perception of placeness in cultural districts: The case of Samcheong-dong and Sinsa-dong streets in Seoul. J. Korea Plan. Assoc. 2016, 51, 97–112. [Google Scholar] [CrossRef]
- Bridge, G.; Dowling, R. Micro geographies of retailing and gentrification. Aust. Geogr. 2001, 32, 93–107. [Google Scholar] [CrossRef]
- Zukin, S.; Braslow, L. The life cycle of New York’s creative districts: Reflections on the unanticipated consequences of unplanned cultural zones. City Cult. Soc. 2011, 2, 131–140. [Google Scholar] [CrossRef]
- Meltzer, R.; Capperis, S. Neighbourhood differences in retail turnover: Evidence from New York City. Urban Stud. 2017, 54, 3022–3057. [Google Scholar] [CrossRef]
- Meltzer, R.; Schuetz, J. Bodegas or bagel shops? Neighborhood differences in retail and household services. Econ. Dev. Q. 2012, 26, 73–94. [Google Scholar] [CrossRef]
- Yeom, J.; Yang, S. Empirical analysis of the vitalization step of Commercial Street in Samcheongdong-gil, Seoul through the restaurant change. Urban Des. Inst. Korea 2014, 15, 111–122. [Google Scholar]


| Positive Effects | Negative Effects |
|---|---|
| - | Involuntary extrusion due to rising rent |
| Stabilization of declining region | Causing community anger and conflict |
| Increase in property value | Affordable Housing Reduction, Speculative real estate price rise |
| Promote regional development | Involuntary migration of commerce/industry |
| Revitalization of real estate through government assistance | Increased vacancy rates and reduced population and stores due to higher rents |
| Promotion of social mixing | Loss of local diversity |
| Area | Street | Land Use | |
|---|---|---|---|
| 1 | A | Garosu-gil | Class Ⅱ general residential area |
| 2 | B | Bangbae-ro 42-gil | Class Ⅱ general residential area |
| 3 | C | Samcheong-ro | Class Ⅰ general residential area |
| 4 | D | Seoulsup 2-gil | Class Ⅰ & Ⅱ general residential area |
| 5 | Seoulsup 4-gil | Class Ⅱ general residential area | |
| 6 | E | Seongmisan-ro | Class Ⅱ general residential area |
| 7 | F | Sinheung-ro | Class Ⅰ general residential area |
| 8 | G | Yeonhui-ro 1-gil | Class Ⅱ general residential area |
| 9 | H | Ogin-gil | Class Ⅱ general residential area |
| 10 | Jahamun-ro 7-gil | Class Ⅱ general residential area | |
| 11 | I | Hoenamu-ro gil | Class Ⅱ general residential area |
| 12 | J | Wausan-ro 3-gil | Class Ⅱ general residential area |
| 13 | K | Itaewon-ro 42-gil | Quasi-residential area and Class Ⅱ general residential area |
| Category | Share of Birth | Share of Replacement | Share of Vacancy | Retail Diversity (HHI) | Share of Chain Stores | Vitalization | Front Width of Stores |
|---|---|---|---|---|---|---|---|
| Avg. | Avg. | Avg. | Avg. | Avg. | Avg. | Avg. | |
| A(Garosu-gil) | 0.00 | 2.38 | 1.19 | 2298.0 | 11.17 | 1.00 | 8.44 |
| B(Bangbae-ro 42-gi)l | 0.00 | 3.30 | 0.44 | 384.9 | 1.47 | 0.95 | 6.25 |
| C(Samcheong-ro) | 0.00 | 1.87 | 0.69 | 603.9 | 5.17 | 0.96 | 7.61 |
| D(Seoulsup 2, 4-gil) | 0.76 | 1.61 | 0.36 | 1670.4 | 0.32 | 0.62 | 8.62 |
| E(Seongmisan-ro) | 0.27 | 2.29 | 0.76 | 663.2 | 1.25 | 0.82 | 6.10 |
| F(Sinheung-ro) | 0.09 | 2.69 | 0.18 | 830.7 | 1.28 | 0.89 | 5.83 |
| G(Yeonhui-ro 1-gil) | 0.65 | 2.02 | 1.01 | 1395.4 | 0.64 | 0.69 | 6.74 |
| H(Ogin-gil, Jahamun-ro 7-gil) | 0.03 | 2.58 | 0.21 | 939.2 | 1.58 | 0.97 | 5.33 |
| I(Wausan-ro 3-gil) | 0.19 | 2.07 | 0.19 | 435.6 | 0.53 | 0.85 | 6.82 |
| J(Itaewon-ro 42-gil) | 0.00 | 6.74 | 1.23 | 790.0 | 1.51 | 0.98 | 4.33 |
| K(Hoenamu-ro gil) | 0.00 | 2.33 | 0.54 | 465.4 | 3.01 | 0.98 | 6.35 |
| Category | Cluster | ||
|---|---|---|---|
| 1 (n = 2) | 2 (n = 7) | 3 (n = 2) | |
| Birth | 0.707 | 0.072 | 0.000 |
| Replacement | 1.817 | 2.947 | 2.129 |
| Vacancy | 0.687 | 0.479 | 0.942 |
| HHI | 1532.903 | 627.803 | 1450.918 |
| Share of chain stores | 0.479 | 1.530 | 8.171 |
| Vitalization rate | 0.656 | 0.930 | 0.980 |
| Front width of stores | 7.677 | 5.704 | 8.027 |
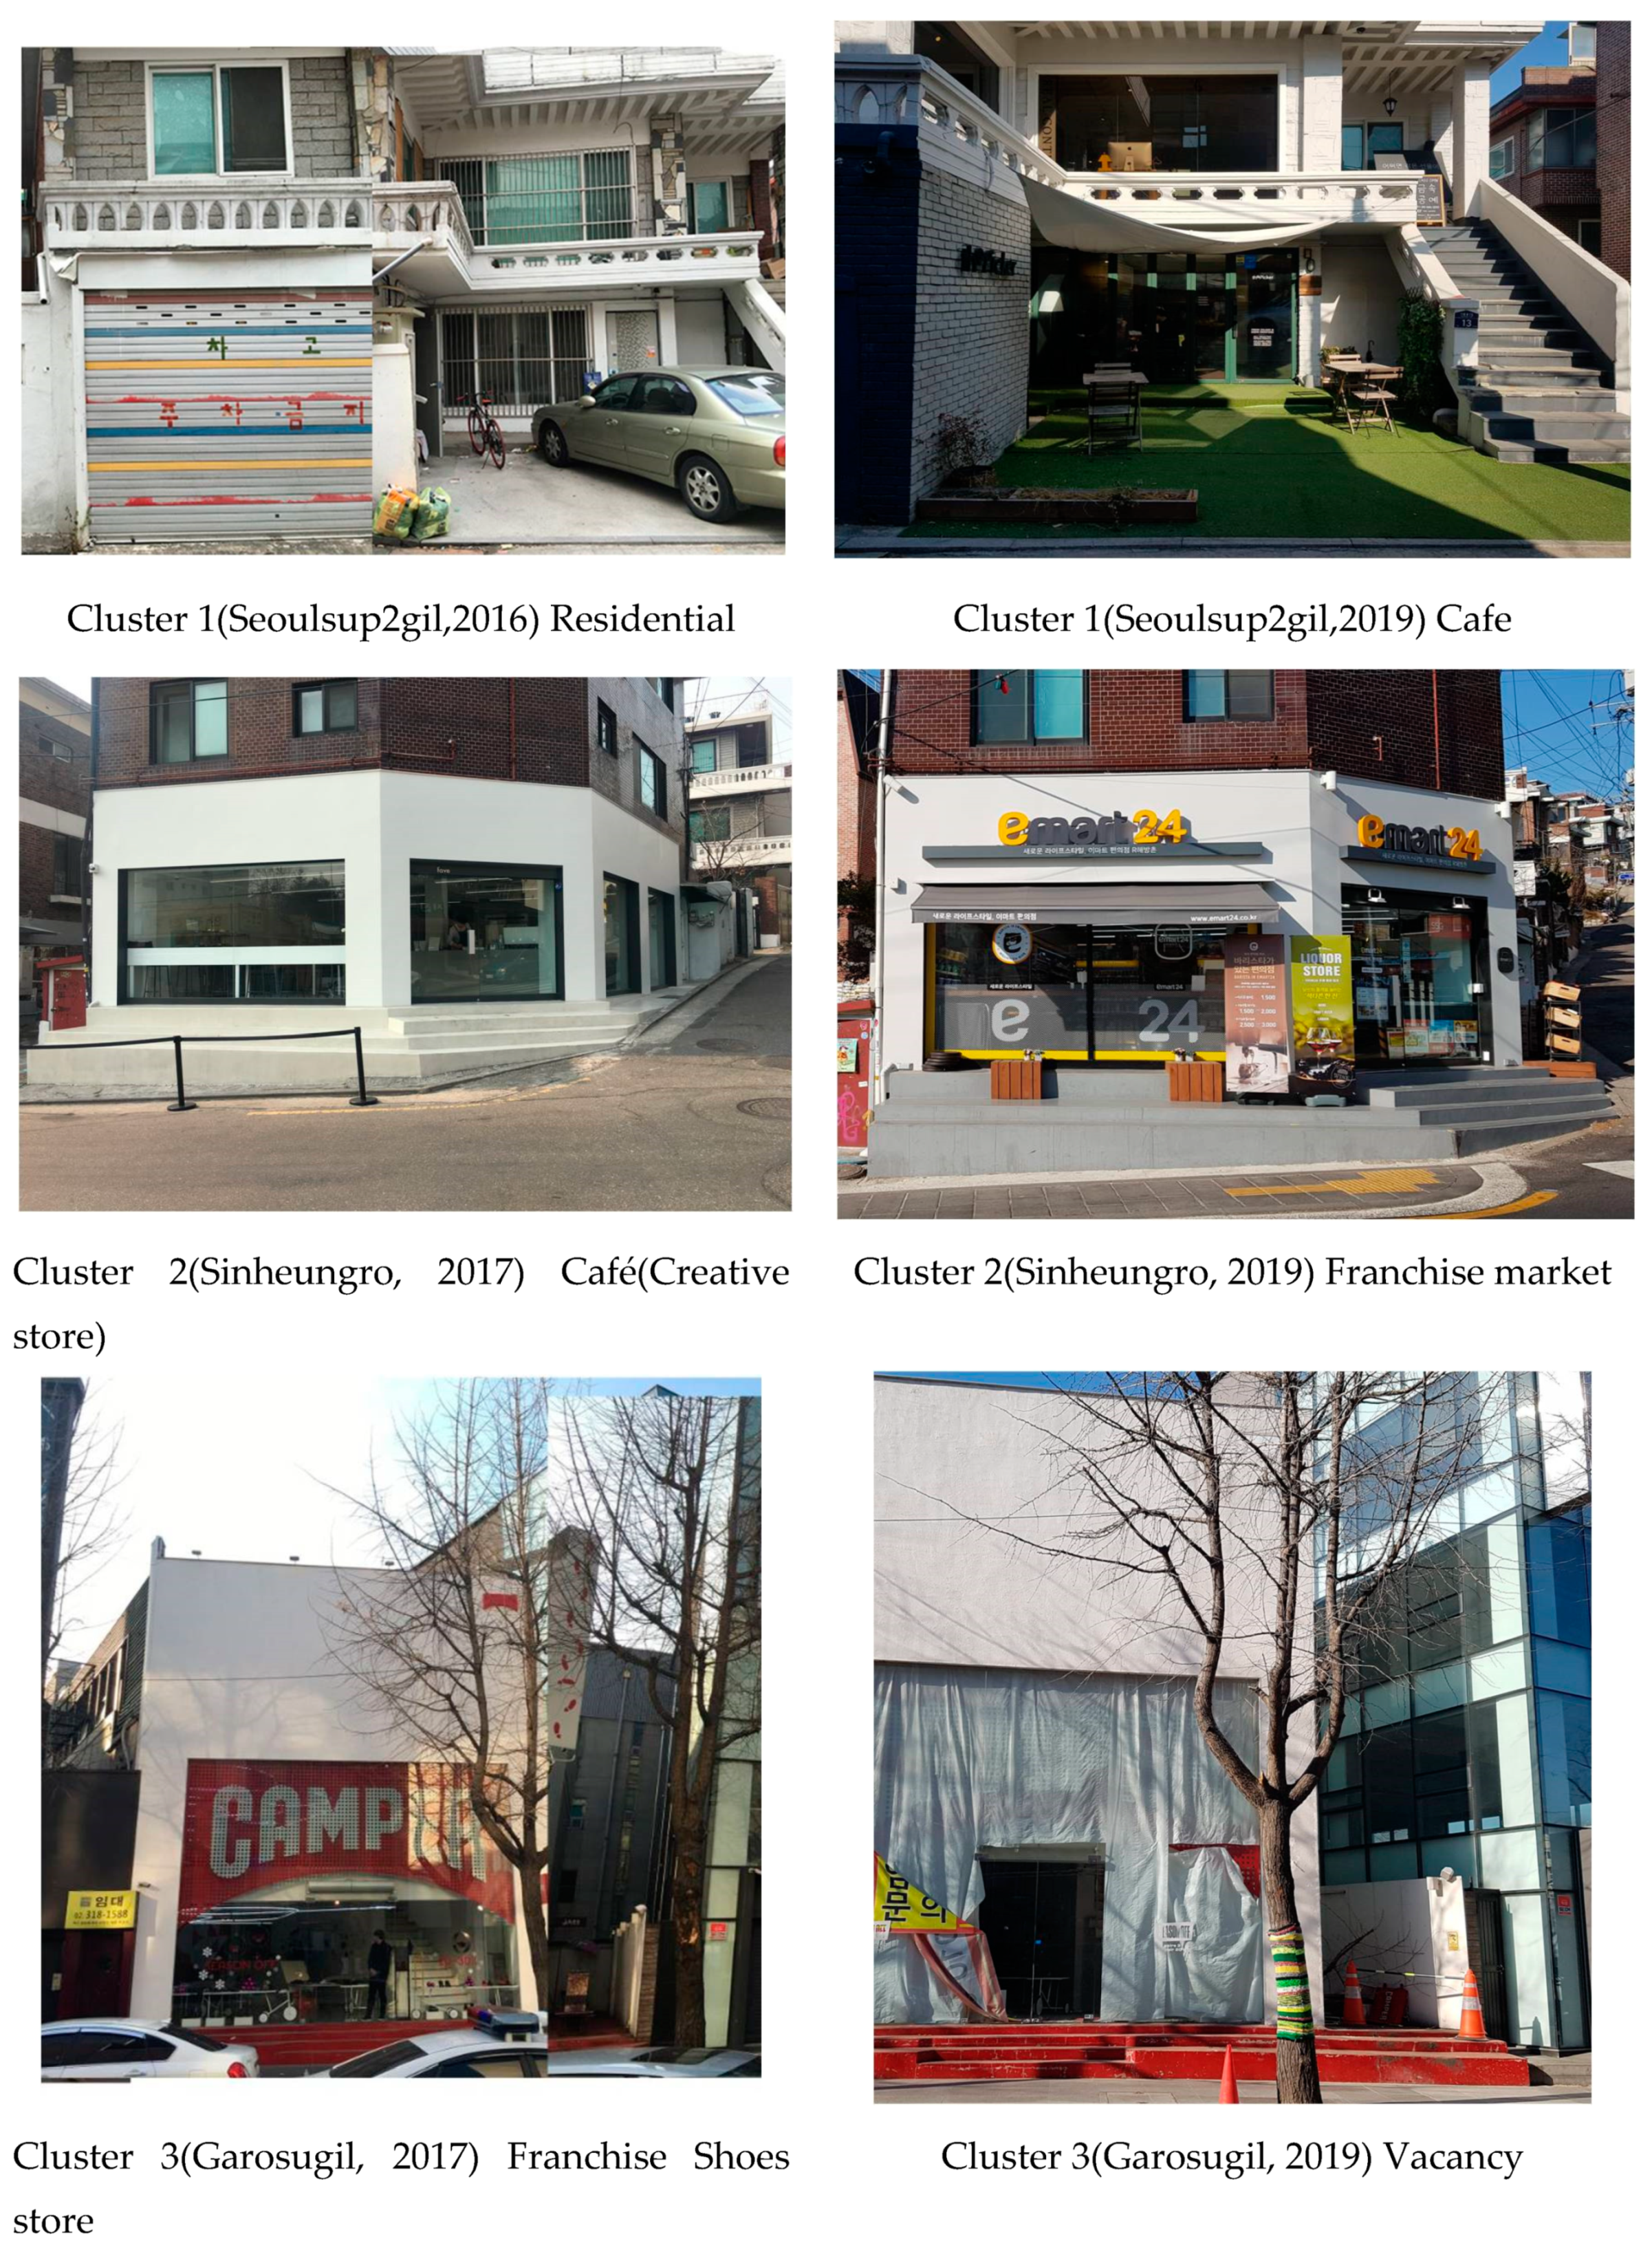
| Streets | D G | B F H J K I E | A C |
| Types of use (2015) | Residential (46.85%) Cafes (5.59%) Korean food and hair salons (3.5%) | Housing (8.88%) Cafes, Real estate advisories and brokerages (5.92%) Shirt and blouse retail (5.76%) | Shirts and blouse retail (27.78%) Cosmetics (11.54%) Cafes (8.12%) |
| Types of use (2019) | Residential (28.57%) Cafes (12.24%) Western-style establishments (5.42%) | Cafes (8.26%) Residential (6.94%) Western-style establishments (6.61%) | Shirts and blouse retail (22.78%) Cosmetics (12.17%) Rental free (11.3%) |
Publisher’s Note: MDPI stays neutral with regard to jurisdictional claims in published maps and institutional affiliations. |
© 2020 by the authors. Licensee MDPI, Basel, Switzerland. This article is an open access article distributed under the terms and conditions of the Creative Commons Attribution (CC BY) license (http://creativecommons.org/licenses/by/4.0/).
Share and Cite
Ryu, H.; Kim, D.; Park, J. Characteristics Analysis of Commercial Gentrification in Seoul Focusing on the Vitalization of Streets in Residential Areas. Sustainability 2020, 12, 8877. https://doi.org/10.3390/su12218877
Ryu H, Kim D, Park J. Characteristics Analysis of Commercial Gentrification in Seoul Focusing on the Vitalization of Streets in Residential Areas. Sustainability. 2020; 12(21):8877. https://doi.org/10.3390/su12218877
Chicago/Turabian StyleRyu, Hwayeon, Donghyun Kim, and Jina Park. 2020. "Characteristics Analysis of Commercial Gentrification in Seoul Focusing on the Vitalization of Streets in Residential Areas" Sustainability 12, no. 21: 8877. https://doi.org/10.3390/su12218877
APA StyleRyu, H., Kim, D., & Park, J. (2020). Characteristics Analysis of Commercial Gentrification in Seoul Focusing on the Vitalization of Streets in Residential Areas. Sustainability, 12(21), 8877. https://doi.org/10.3390/su12218877