Article

Understanding N2O Emissions in African Ecosystems: Assessments from a Semi-Arid Savanna Grassland in Senegal and Sub-Tropical Agricultural Fields in Kenya

1
Laboratoire d’Aérologie, Université de Toulouse, CNRS, UPS, CEDEX 6, 31013 Toulouse, France
2
Centre d’Etudes Spatiales de la BIOsphère, Université de Toulouse, CNRS, UPS, CNES, IRD, CEDEX 6, 31013 Toulouse, France
3
Centre de Recherche Zootechnique, Institut Sénégalais de Recherche Agricole, BP 3120 Yoff, Dakar, Senegal
4
Geosciences Environnement Toulouse, Université de Toulouse, CNRS, UPS, CNES, IRD, CEDEX 6, 31013 Toulouse, France
5
Mazingira Centre, International Livestock Research Institute, 30709 Nairobi, Kenya
6
Agroscope, Research Division Agroecology and Environment, Reckenholzstrasse 191, 8046 Zurich, Switzerland
7
Department of Physical Geography and Ecosystem Sciences, Lund University, Box 117, 221 00 Lund, Sweden
8
Department of Geosciences and Natural Resource Management, University of Copenhagen, DK-1165 Copenhagen, Denmark
*
Authors to whom correspondence should be addressed.
Sustainability 2020, 12(21), 8875; https://doi.org/10.3390/su12218875
Submission received: 28 July 2020 / Revised: 24 September 2020 / Accepted: 14 October 2020 / Published: 26 October 2020
(This article belongs to the Special Issue Nitrogen: Too Much of a Vital Resource)

Abstract

:
This study is based on the analysis of field-measured nitrous oxide (N2O) emissions from a Sahelian semi-arid grassland site in Senegal (Dahra), tropical humid agricultural plots in Kenya (Mbita region) and simulations using a 1D model designed for semi arid ecosystems in Dahra. This study aims at improving present knowledge and inventories of N2O emissions from the African continent. N2O emissions were larger at the agricultural sites in the Mbita region (range: 0.0 ± 0.0 to 42.1 ± 10.7 ngN m−2 s−1) than at the Dahra site (range: 0.3 ± 0 to 7.4 ± 6.5 ngN m−2 s−1). Soil water and nitrate (NO3) contents appeared to be the most important drivers of N2O emissions in Dahra at the seasonal scale in both regions. The seasonal pattern of modelled N2O emissions is well represented, though the model performed better during the rainy season than between the rainy and dry seasons. This study highlighted that the water-filled pore space threshold recognised as a trigger for N2O emissions should be reconsidered for semi-arid ecosystems. Based on both measurements and simulated results, an annual N2O budget was estimated for African savanna/grassland and agricultural land ranging between 0.17–0.26 and 1.15–1.20 TgN per year, respectively.

1. Introduction

Nitrous oxide (N2O) is a powerful and long-lived greenhouse gas (GHG) with a high global warming potential [1,2], and it contributes to stratospheric ozone (O3) depletion [3]. Atmospheric N2O concentrations have increased since around 1960 mainly due to intensive use of synthetic nitrogen (N) fertilisers, thus leading to enhanced N2O emissions from soils [4,5]. The formation of N2O in soils is due to multiple biological and physical–chemical processes such as nitrification, denitrification, nitrifier-denitrification, chemo-denitrification, chemical decomposition of hydroxylamine and co-denitrification with nitric oxide (NO) [2]. Nitrification and denitrification are considered the major processes of N2O production in soils [6,7]. Nitrification occurs in aerobic conditions and leads to the oxidation of ammonium (NH4+) into nitrate (NO3), with N2O as a by-product of this reaction, while denitrification is an anaerobic process that reduces NO3 and can lead to N2O production in function of the environmental conditions, with N2 being the final product if denitrification is complete. The most important factors that modulate N2O production magnitude in soils are soil water content, NH4+, NO3, organic matter, oxygen availability, temperature and pH [8,9,10]. These key drivers are influenced by anthropogenic actions such as agricultural management [11], e.g., crop species, tillage [12], quantity and form of N input [13], soil compaction [14] and irrigation [15]. Climate characteristics, meteorological variability (temperature, rainfall, drought) and atmospheric N deposition modulate the intensity at which the key drivers affect N2O production and associated N2O emissions.
The study of N2O emission processes and key drivers has primarily been focused on temperate areas. In contrast, N2O emissions in Sub-Saharan Africa (SSA) remain relatively poorly understood, with only a limited number of studies, the need for further investigations are needed as this region has considerable impact on the global GHG budget [11,16,17,18]. Restrictions leading to the scarcity of in-field observations are partly related to the difficulty of implementing measurement field campaigns in remote locations with little infrastructure. This is particularly the case for the savanna ecosystem, which represents more than 40% of the total area in Africa [19,20]. Soil water content of savannas in semi-arid climates is considered to be too low to trigger denitrification and N2O emissions. However, Zaady et al. (2013) suggested that denitrification can occur at lower water content in dry ecosystems, where microbial activity can be very strong following rainfall events and large enough to deplete O2 concentrations in soil and allow denitrification activity to increase [21]. Their study also showed that the potential of denitrification increases when a site’s average annual rainfall decreases, indicating that denitrification can be an important component even in arid areas with low Water-Filled Pore Space (WFPS). This feature could be a derivative of the ‘Birch’ effect corresponding to a sudden pulse-like event of rapidly increasing N2O emissions from soils under seasonally dry climates in response to rewetting after a long dry season [22]. This N2O pulse is induced by a quick mineralisation of C and N of dead organic matter (microbes, animals, plants) that has accumulated during the dry season after rewetting and results in a pulse in microbial activity, causing emissions, exceeding the ones from a permanently moist soil [23], of mineralised N available for nitrifiers and denitrifiers.
Farming systems in SSA are 80% composed of smallholder farms (farm size <10 ha) with low N application as organic and/or synthetic fertiliser [24,25] and thus completely different from the highly intensified larger agricultural production system found in the temperate zones in developing countries. In some countries such as Burkina Faso, farmers receive support from governments or aid organisations for the use of mineral N fertiliser in order to boost crop production [26]. N2O emissions from the African agricultural sector are considered to represent approximately 6% of the global anthropogenic N2O emissions [27]. However, agricultural activity in Africa has quickly developed over the last two decades, involving an increasing use of synthetic N, while remaining low compared to other regions of the world [26]. Projections for the period 2000–2050 based on the four Millennium Ecosystem Assessment (MEA) scenarios coupled with the spatially explicit Integrated Model to Assess the Global Environment (IMAGE) [28] predict that an increase in N use and land-use change (conversion of forest/grassland into agricultural field) is expected to cause a significant rise in N2O emissions from the African agricultural sector by 2050 compared to 2010, corresponding to an increase of 0.5 to 0.8 TgN yr−1 [27,29]. This increase in soil N availability can therefore lead to substantially higher N2O emissions than those in low-N farming systems [5]. In addition, a recent study predicted an increase in N2O emissions from agriculture in SSA if currently existing yield gaps are being closed and that it might result in a doubling of the current anthropogenic N2O emissions [30]. Moreover, the current acceleration of savannas’ conversion to cropland may increase N2O emissions from these lands in the future [11,31].
N2O emission reduction is considered as a way to mitigate climate change, in particular in the agricultural sector [32], but assessing the weight of N2O emissions from African crops in the global N2O emission burden is very difficult. Kim et al. (2015) made a synthesis of available data on GHG emissions (CO2, CH4 and N2O) from natural ecosystems and agricultural lands in SSA and reported considerable research gaps for the continent, an observation shared by Pelster et al. (2017) and Leitner et al. (2020) [25,29,30].
This study aims at improving the understanding of N2O emissions for two typical ecosystems found in SSA: a grassland located in Senegal characterised by a semi-arid climate (Dahra) and an agricultural area in the Lake Victoria basin in Kenya with an equatorial climate (Mbita). The objectives of this paper are to quantify and compare these two SSA ecosystems in terms of N2O emissions by assessing the impacts of (i) hydro-meteorological conditions at seasonal and daily scales and (ii) land-use intensity. Field measurements were conducted to estimate the N2O emissions in both regions. Moreover, a modelling approach was applied to simulate N2O emissions at the Dahra site with the Sahelian Transpiration Evaporation and Productivity (STEP)—GENeral DEComposition (GENDEC) model [33,34], in which the denitrification module of the DeNitrification-DeComposition (DNDC) model [35] was adapted (named STEP-GENDEC-N2O) to propose an annual budget of N2O emissions from soils to the atmosphere for the Dahra site. This model was not applied to the Mbita region as it is developed only for Sahelian conditions and because crops and vegetation species present in the plots in Mbita are not included in the model settings. Moreover, as there are eight different plots in the Mbita region with only two daily N2O emissions measurements available for each of them, it would have been impossible to validate the model for each plot configuration.

2. Materials and Methods

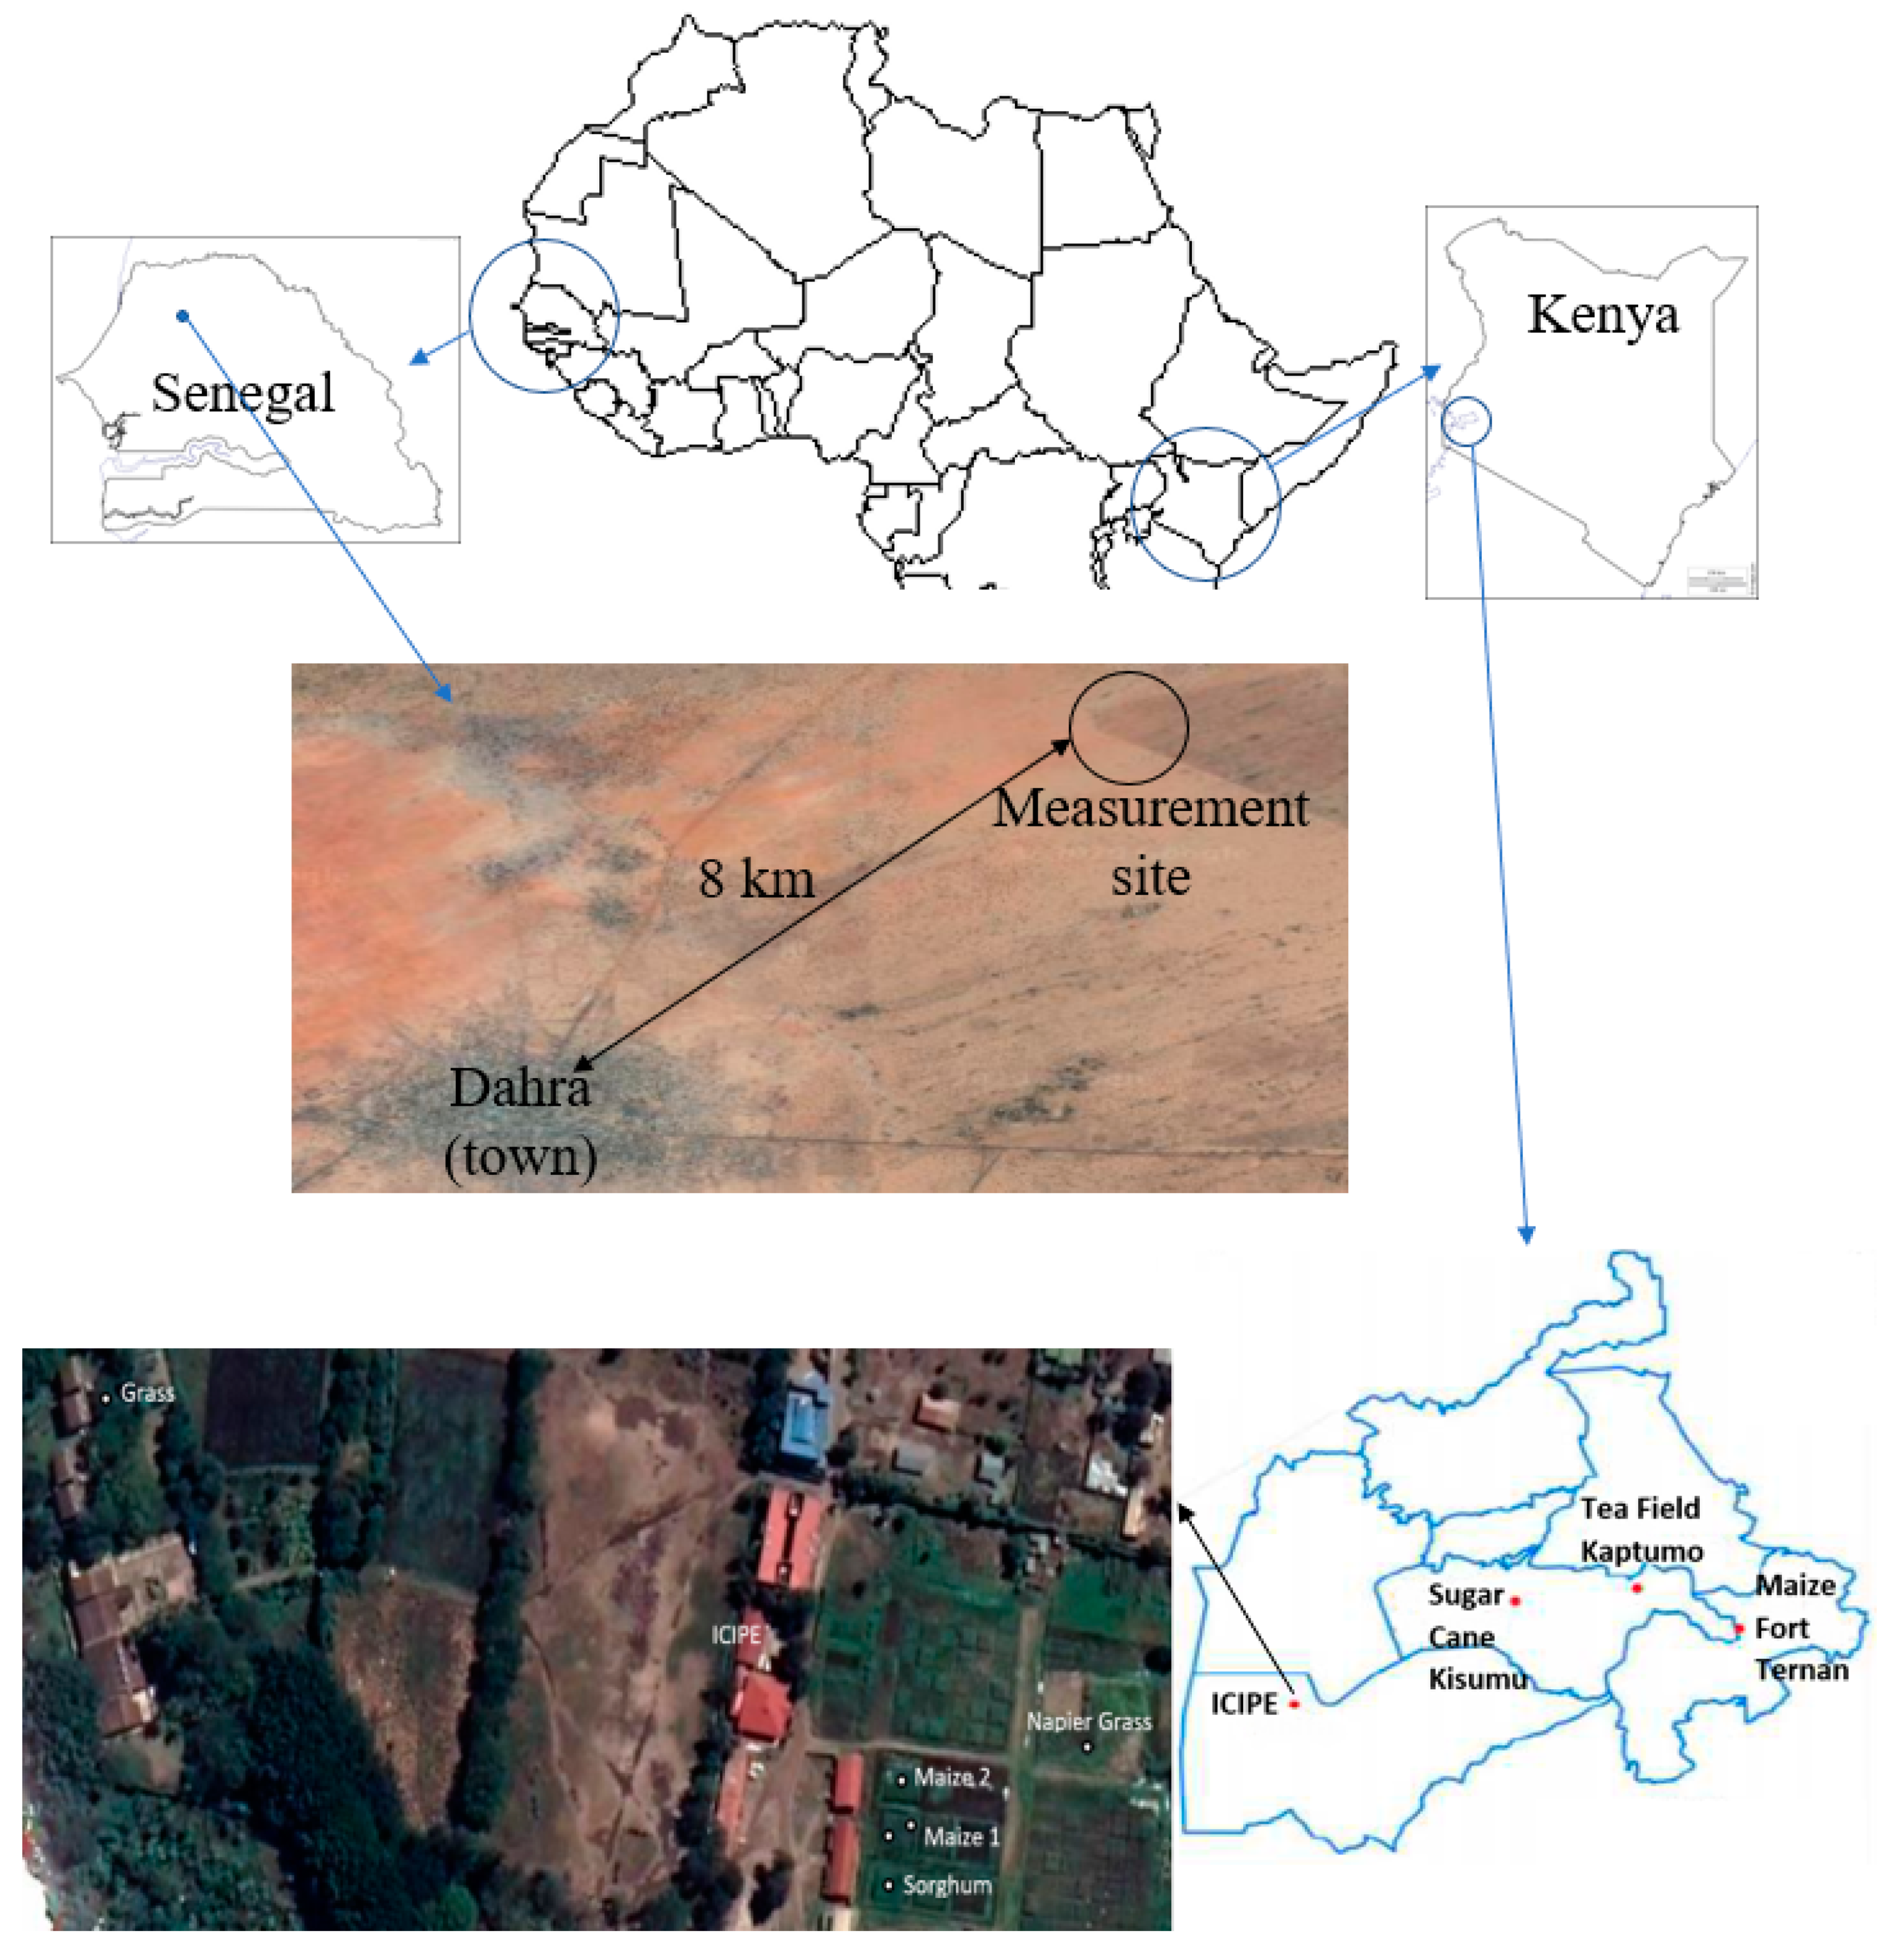
2.1. Sites and Field Campaigns Description

2.1.1. Dahra Rangeland Station

The Dahra field station has been in operation since 2002 and is managed by the University of Copenhagen. It is part of the Centre de Recherches Zootechniques (CRZ) and is located in Senegal (Ferlo) in West Africa (15°24′10″ N, 15°25′56″ W, elevation 40 m). This site is a semi-arid savanna used as a grazed rangeland. The soils are mainly sandy with low N and C content and neutral pH (Table 1). The region is influenced by the West African Monsoon (cool, wet, southwesterly wind) during the rainy season and the Harmattan (hot, dry, northeasterly wind) during the dry season. The rainy season occurs between July and October. Annual average rainfall is 416 mm as calculated from historical data collected between 1951 and 2013 (Table 1) and was 356 mm in 2013 and 412 mm in 2017. Tree cover is around 3% of the surface, with the most abundant species being the Balanites aegyptiaca, Accacia tortilis and Acacia Senegal [36]. The herbaceous vegetation is dominated by annual C4 grasses (e.g., Dactyloctenium aegyptum, Aristida adscensionis, Cenchrus biflorus and Eragrostis tremula) [36]. Livestock is mainly composed of cattle, sheep and goats. Grazing is permanent and occurs year-round [37]. The site was previously described in Tagesson et al. (2015b) and Delon et al. (2017, 2019) [33,38,39].
The 2017 field campaign was part of the French national program called Cycle de l’Azote entre la Surface et l’Atmosphère en afriQUE (CASAQUE—Nitrogen cycle between surface and atmosphere in Africa), and results of the 2013 field campaigns were already published in Delon et al. (2017) [39]. Three field campaigns were carried out to quantify N2O emissions. The campaigns lasted eight days in July 2013 (11–18 July 2013), ten days in November 2013 (29 October–7 November) and eight days in September 2017 (21–27 September 2017).

2.1.2. Mbita Cropland Region

The Mbita region is composed of eight plots with different vegetation, soil characteristics and fertilisation input. Five out of these eight plots are experimental plots located within the International Centre of Insect Physiology and Ecology (ICIPE) close to the Victoria Lake in Kenya and will be referred to as ICIPE from here onwards. Each of the five plots has a size of ~12 × 12 m2 and receives 100 kg N ha−1 yr−1 of either di-ammonium phosphate or calcium ammonium nitrate fertiliser during the two rainy seasons. Crops are regularly watered by overhead irrigation sprinklers. These plots are annually cultivated with maize (2 plots, referred to as Maize 1 and Maize 2), sorghum (1 plot, referred to as Sorghum), napier grass (1 plot, referred to as Napier Grass) and permanent grassland (1 plot, referred to as Grassland). The grassland plot has been a permanent non-cultivated grassland since 2010. The three other plots are cultivated fields located around the city of Kisumu: one with maize in Fort Ternan (referred to as Maize Fort Ternan, with no fertilisation), a 20 years tea plantation in Kaptumo (referred to as Tea Field Kaptumo) with NPK fertilisation of 50 kg N ha−1 yr−1 and a sugar cane plot in Kisumu (referred to as Sugar Cane Kisumu) with no fertilisation (Figure 1). These crops are representative of the main country cultivated crops since they represent 54% of the total cultivated areas [40].
Two field campaigns were carried out to quantify daily N2O emissions. The first one lasted nine days in January 2018 (17–25 January 2018) during the dry season and the second one ten days in November 2018 (29 October–07 November 2018) during the rainy season for the purpose of the CASAQUE program. The measurement plots in the Mbita region were located in a region of mixed crops and grassland. All sites in the Mbita region are characterised by an equatorial climate with two distinct rainy seasons throughout the year: one long rainy season from March to May and a shorter one from November to December (five months in total), often referred as long and short rain seasons. The average rainfall and temperature are 1100 mm and 24 °C in ICIPE from 1986 to 2018 (Table 1). In 2018, ICIPE experienced a rainfall of 1070 mm and an average temperature of 20 °C. All four locations (ICIPE, Fort Ternan, Kaptumo and Kisumu) have clay soils with high N and C content (Table 1). Soils in ICIPE, Fort Ternan and Kisumu have a relative neutral pH whereas the soil in Kaptumo has a low (acid) pH (Table 1).

2.2. Field Data

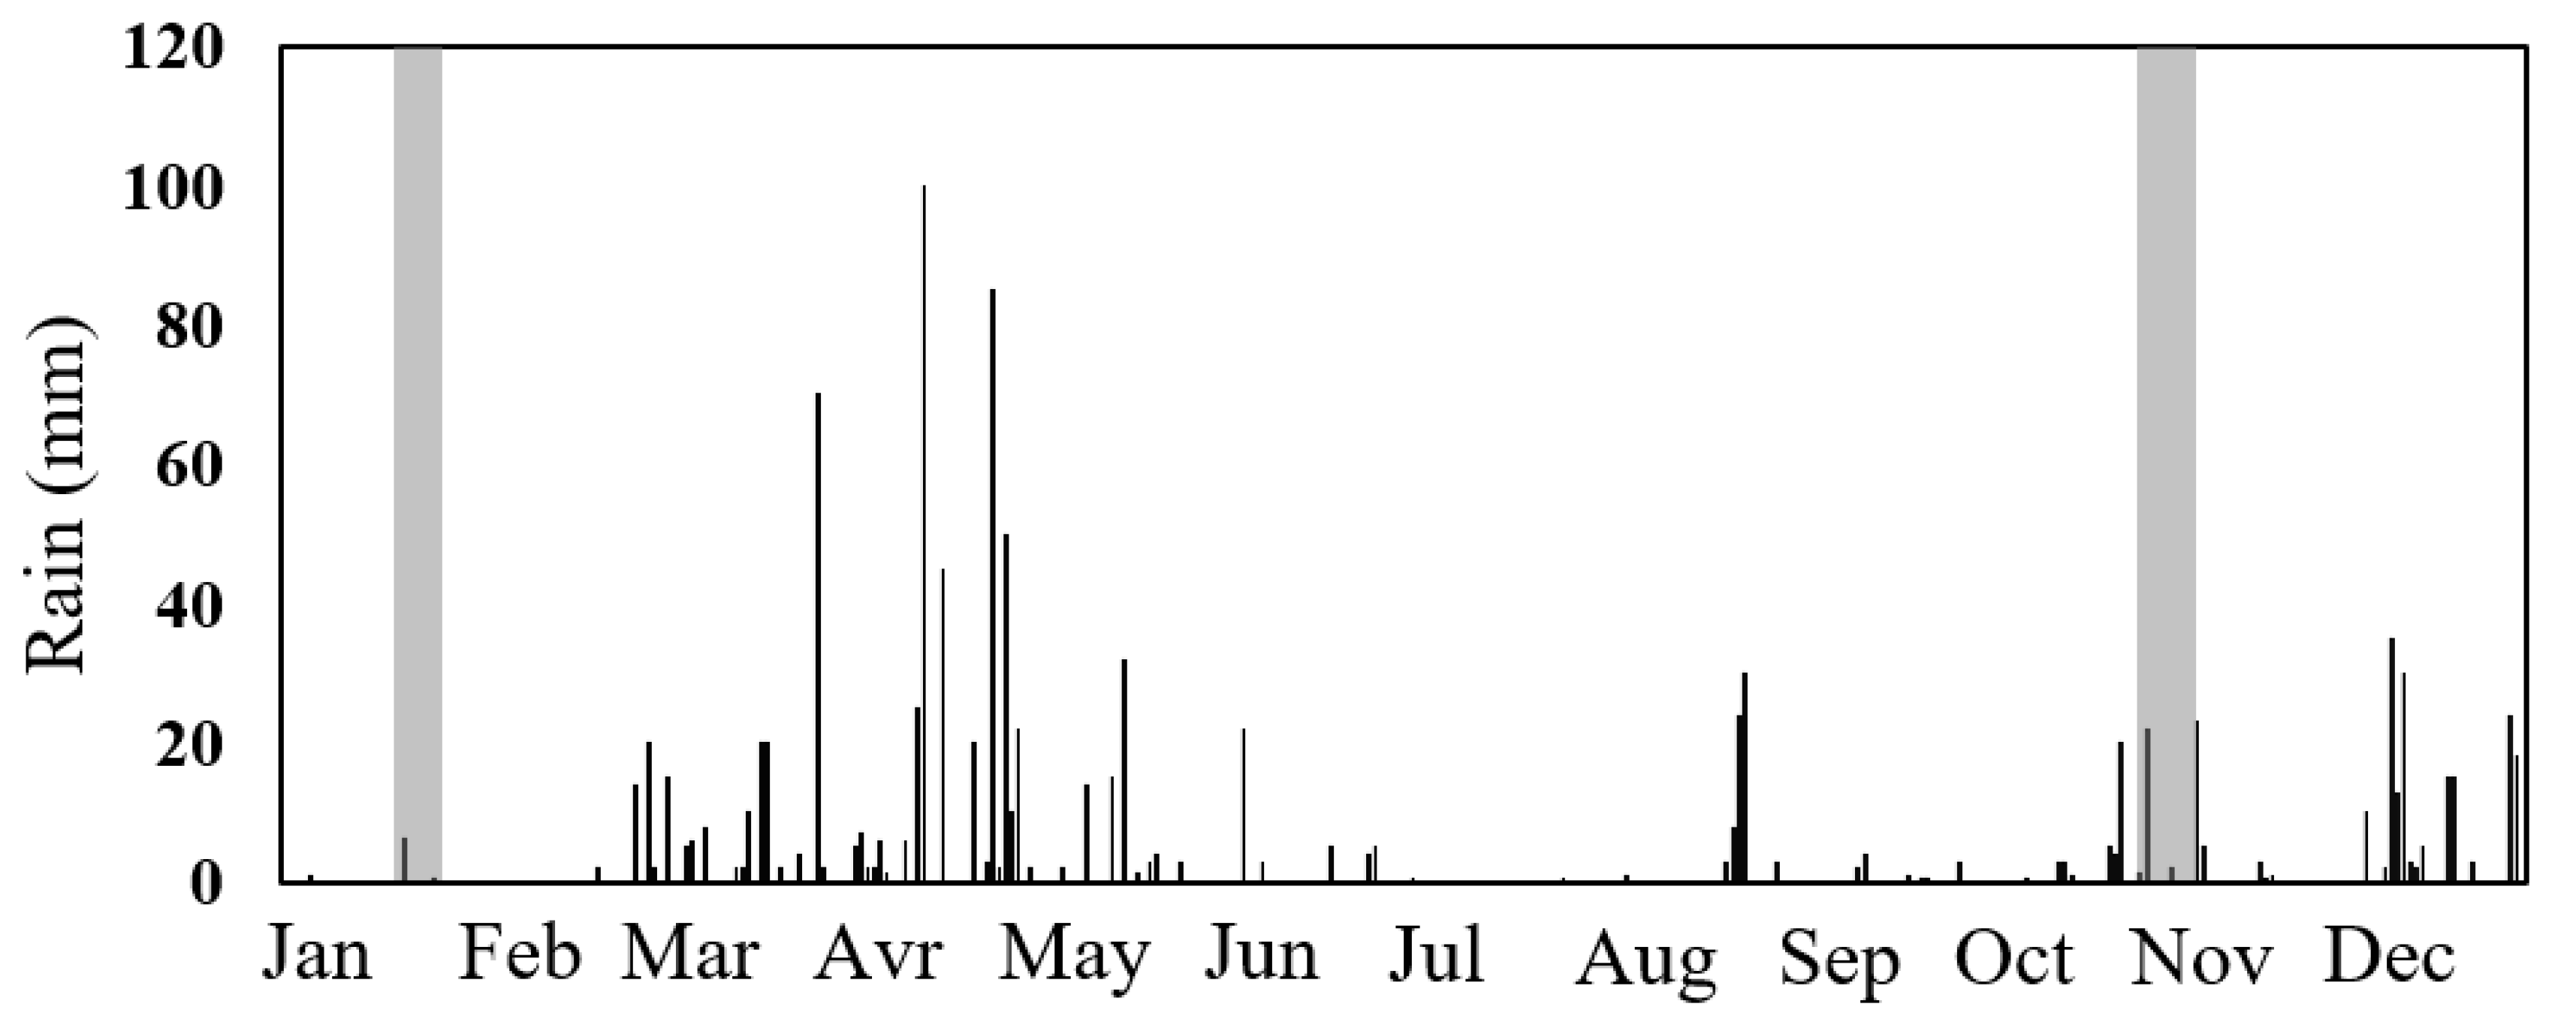
2.2.1. Hydro-Meteorological Data

In Dahra, the available hydro-meteorological variables used for this study are rainfall (mm), air and soil temperature (°C) and soil water content (SWC) (%) at 0.05, 0.10 and 0.30 m depth. These variables were collected every 30 s and averaged and saved every 15 min (or sum for rainfall). All details on sensors and measured variables are given in Tagesson et al. (2015b) and Delon et al. (2019) [33,38]. Due to technical issues in 2017, rainfall was measured by a manual rain gauge with direct reading. This rain gauge was installed in the frame of the International Network to study Deposition and Atmospheric chemistry in Africa (INDAAF) (https://indaaf.obs-mip.fr/). The gauge is set up one meter above the soil surface according to the World Meteorological Organization (WMO) recommendations. It is graded from 0 to 150 mm, with a minimum resolution of 0.25 mm. Reading of the manual gauge was done every day at 8:00 a.m. by a local partner.
In the Mbita region, soil temperatures were not measured during the field campaigns due to probe unavailability. SWC was measured manually with a thetaprobe ML3 (Delta-T Devices Ltd., 1% precision) at an hourly time step during the day. Rainfall was measured using the same protocol as in Dahra during 2017, with a manual rain gauge read daily by a local collaborator.
For the purpose of the study, WFPS was calculated as follows and used in the modelling process of N2O emissions at the Dahra site:
W F P S = S W C · D a D a D b ,
with Da the soil actual density (Da = 2.6 g cm−3) and Db the soil bulk density, calculated from the dry weight of soil samples collected in situ (see Section 2.2.3 for details) with a cylinder of known volume (290 cm3) and dried at 40 °C for 24 h. Db = dry soil mass/total volume was 1.50 ± 0.06 g cm−3 for Sahelian soils. The use of WFPS values instead of SWC includes the concept of soil porosity together with soil humidity so it is a way to indicate how soil pores are saturated or not and to compare more objectively denitrification thresholds between ecosystems.
For both regions, all hydro-meteorological variables were averaged to daily values for the purpose of this study.

2.2.2. N2O Chamber Emission Measurements

In both regions, N2O emissions were measured using a stainless-steel chamber with a base of 0.20 m × 0.40 m and a height of 0.15 m following the static chamber method (non-flow through non-steady state). The chamber was placed on a frame that was inserted 10 cm deep in the soil and sealed by a slot filled with water to keep the chamber airtight. Emission measurements were carried out at least three times a day: in the morning (10:00–12:00 a.m.), around noon (12:00 a.m–02:00 p.m) and in the late afternoon (04:00 p.m–06:00 p.m.). For the field campaigns at Dahra in 2013, samples of the chamber headspace gas were removed with a syringe through a rubber septum at times 0, 15, 30 and 45 min after placing the chamber on the frame. Air samples (in duplicate) were injected from the syringe into 10 mL glass vials that contained 6M NaCl solution capped with high-density butyl stoppers and aluminium seals. When injected, the air sample removed almost all the solution from the vials (a small quantity was kept inside), and the vials were kept upside down to ensure airtightness. For the field campaign in Dahra 2017 and the field campaigns in Mbita 2018, air samples from the chamber were collected with a syringe through a rubber septum at times 0, 20, 40 and 60 min after placing the chamber on the frame. Samples (in duplicates) were transferred into 12 mL pre-evacuated glass vials (Exetainer, Labco, UK).
Samples from the campaigns in Dahra were analysed by gas chromatography 2–3 weeks after the field campaign at Laboratoire d’Aérologie, (Toulouse, France) while samples from Mbita sites were analysed at the Mazingira Centre (International Livestock Research Institute, Nairobi, Kenya) the week after the field campaign following the analytical protocol described in Zhu et al. (2019) [41]. Analyses from both laboratories were carried out following the same protocol with N2O partial pressures determined by Gas Chromatography (GC) with an SRI 8610C gas chromatograph (SRI, Torrance, CA, USA) equipped with an electron capture detector.
For every campaign, N2O emission calculations were defined from the slope of the linear regression of gas samples concentration over time. The calculation was accepted if the coefficient of determination R² estimated from the linear regression was above 0.80 for the 2017 campaign in Dahra and the 2018 campaigns in Mbita. For the data already published from the 2013 campaigns in Dahra, the quality criteria are described in Delon et al. (2017) [39]. Details about the calculation method are given in Assouma et al. (2017) [37].

2.2.3. Soil Characteristics (Texture, pH, N and C Content)

At each sampling location of N2O emission measurements, samples of soil were collected from 5–10 cm depth to assess biogeochemical characteristics. Samples from Dahra 2017 and Mbita 2018 were collected for determination of texture, ammonium (NH4+) and nitrate (NO3) concentrations, C/N ratio, total C, total N and pH. Samples were frozen immediately after collection and kept frozen during transportation to France. Samples from Mbita 2018 were further analysed by GALYS Laboratory (http://www.galys-laboratoire.fr/, NF EN ISO/CEI 17025: 2005). Soil texture was determined according to norm NF X 31–107 without decarbonation. Organic carbon and total nitrogen were determined as defined in norm NF ISO 10694. Total soil carbon content was transformed into CO2, which was then measured by conductibility. Soil mineral and organic nitrogen content were measured following norm NF ISO 13878: the samples were heated at 1000 °C with O2, and the products of combustion or decomposition were reduced in N2. N2 was then measured by thermal conductibility (katharometer). Determination of pH was undertaken following the norm NF ISO 10390 with soil samples stirred with water (ratio 1/5) (Table 1). Samples from Dahra 2013 were also analysed at GALYS Laboratory following the same protocol [39].
Samples from the Dahra 2017 field campaign were analysed by the Laboratoire des Moyens Analytiques (US IMAGO—LAMA certified ISO9001:2015), Institut pour la Recherche et le Dévelopement (IRD) in Dakar (http://www.imago.ird.fr/moyens-analytiques/dakar.) Organic carbon was determined using the method of Walkey and Black (1934). pH was determined with soil samples stirred with water (1/2.5 w/v). Total carbon and nitrogen contents were determined by the Dumas method [40] on 0.2 mm ground, 100 mg aliquots according to ISO 10694:1995 for carbon and ISO 13878:1998 for nitrogen using a CHN elemental analyser (Thermo Finnigan Flash EA1112, Milan, Italy). Mineral and organic nitrogen contents were extracted with a KCl 1M solution in a ratio 1/5 (w/v), then dosed by colorimetric method (Table 1).
Additionally, data on soil NO3 availability in July 2012 were taken from Delon et al. (2017). A summary of information on laboratories involved in soil and N2O analysis is reported in Table A1.

2.3. Statistical Methods

The model performances and the relationship between N2O emissions and key drivers were evaluated using the determination coefficient (R²) as the square of the Pearson correlation coefficient and the Root Mean Squared Error (RMSE) as the differences between modelled and measured values.
The uncertainty of the annual N2O budgets estimated with STEP-GENDEC-N2O was calculated based on the standard deviation of the error between observed and simulated values over the whole period as follows:
σ a n n u a l = 365 · σ e r r o r 2 ,
where σannual is the annual N2O budget uncertainty and σerror is the standard deviation of the error between observed and simulated values. σerror was multiplied by 365 to apply this uncertainty for a whole year, and as few observed data were available, a unique uncertainty was defined for all years.

2.4. N2O Emission Modelling

2.4.1. STEP-GENDEC Model

A modelling approach to simulate N2O emissions from the Dahra site was conducted using the STEP-GENDEC coupled model. STEP is an ecosystem process model developed for Sahelian herbaceous savannas [33,34,42] and was only applied to the Sahelian site of Dahra. This model aims at estimating the temporal variation of the main variables and processes associated with vegetation functioning in Sahelian savannas at the local or regional scale [43]. STEP was coupled with GENDEC, which simulates organic matter decomposition, interactions between litter (C and N transfer), decomposer microorganisms’ activities, microbial dynamics and C and N pools [44]. The coupled model was forced with standard meteorological data from site measurements (precipitation, global radiation, air temperature, relative humidity and wind speed). N in the model is split between different pools representing dead organic matter, living microbial biomass and soil N content [42]. Soil temperature is simulated by the model from air temperature [45] and SWC is calculated following the tipping bucket approach [46]. More details on equations and initial parameters specific to the Dahra site are available in Delon et al. (2019) [33].

2.4.2. N2O Emission Module in STEP-GENDEC

A module of N2O production and emission by nitrification and denitrification was coupled to STEP-GENDEC from DNDC’s equations adapted from Yuexin Liu (1996) and Li et al. (2000) to create the STEP-GENDEC-N2O model [9,35]. The entire module and adapted equations are available in Appendix D. As STEP-GENDEC simulates soil NH4+ content (mgN kgsoil−1), NO3 content (mgN kgsoil−1) is therefore deduced from NH4+ content (see Appendix D). N2O production in the module depends on soil NO3 content, SWC, soil temperature, pH, clay content, total soil carbon and total soil microbial carbon mass. A standard microbial C:N ratio of 10 was chosen for the site based on measurements (Table A2). This value is consistent with values reported in studies on various ecosystems, soils and climates, reporting C:N ratios ranging from 4.5 to 16.5, depending on the season [47,48].
The DNDC model was developed and tested on sites located in temperate climate conditions, where processes of N2O production and emissions are under different conditions than in semi-arid climates. Therefore, an adaptation of the module and its parameters was necessary. The model STEP-GENDEC-N2O was applied with the default settings of Yuexin Liu (1996) except for (1) the WFPS threshold and (2) the initial conversion (CON, conversions of NO3 to NO2, NO2 to N2O and N2O to N2) and synthesis (SYN, synthesis of NO3, NO2, N2O and N2 by denitrifiers), which were set accordingly [35] (Appendix D). N2O emissions at the Dahra site were simulated with the STEP-GENDEC-N2O model at a daily time step from 2012 to 2017. The model was first initialised by running the year 2012 five times to reach a C and N pool stabilisation.

3. Results

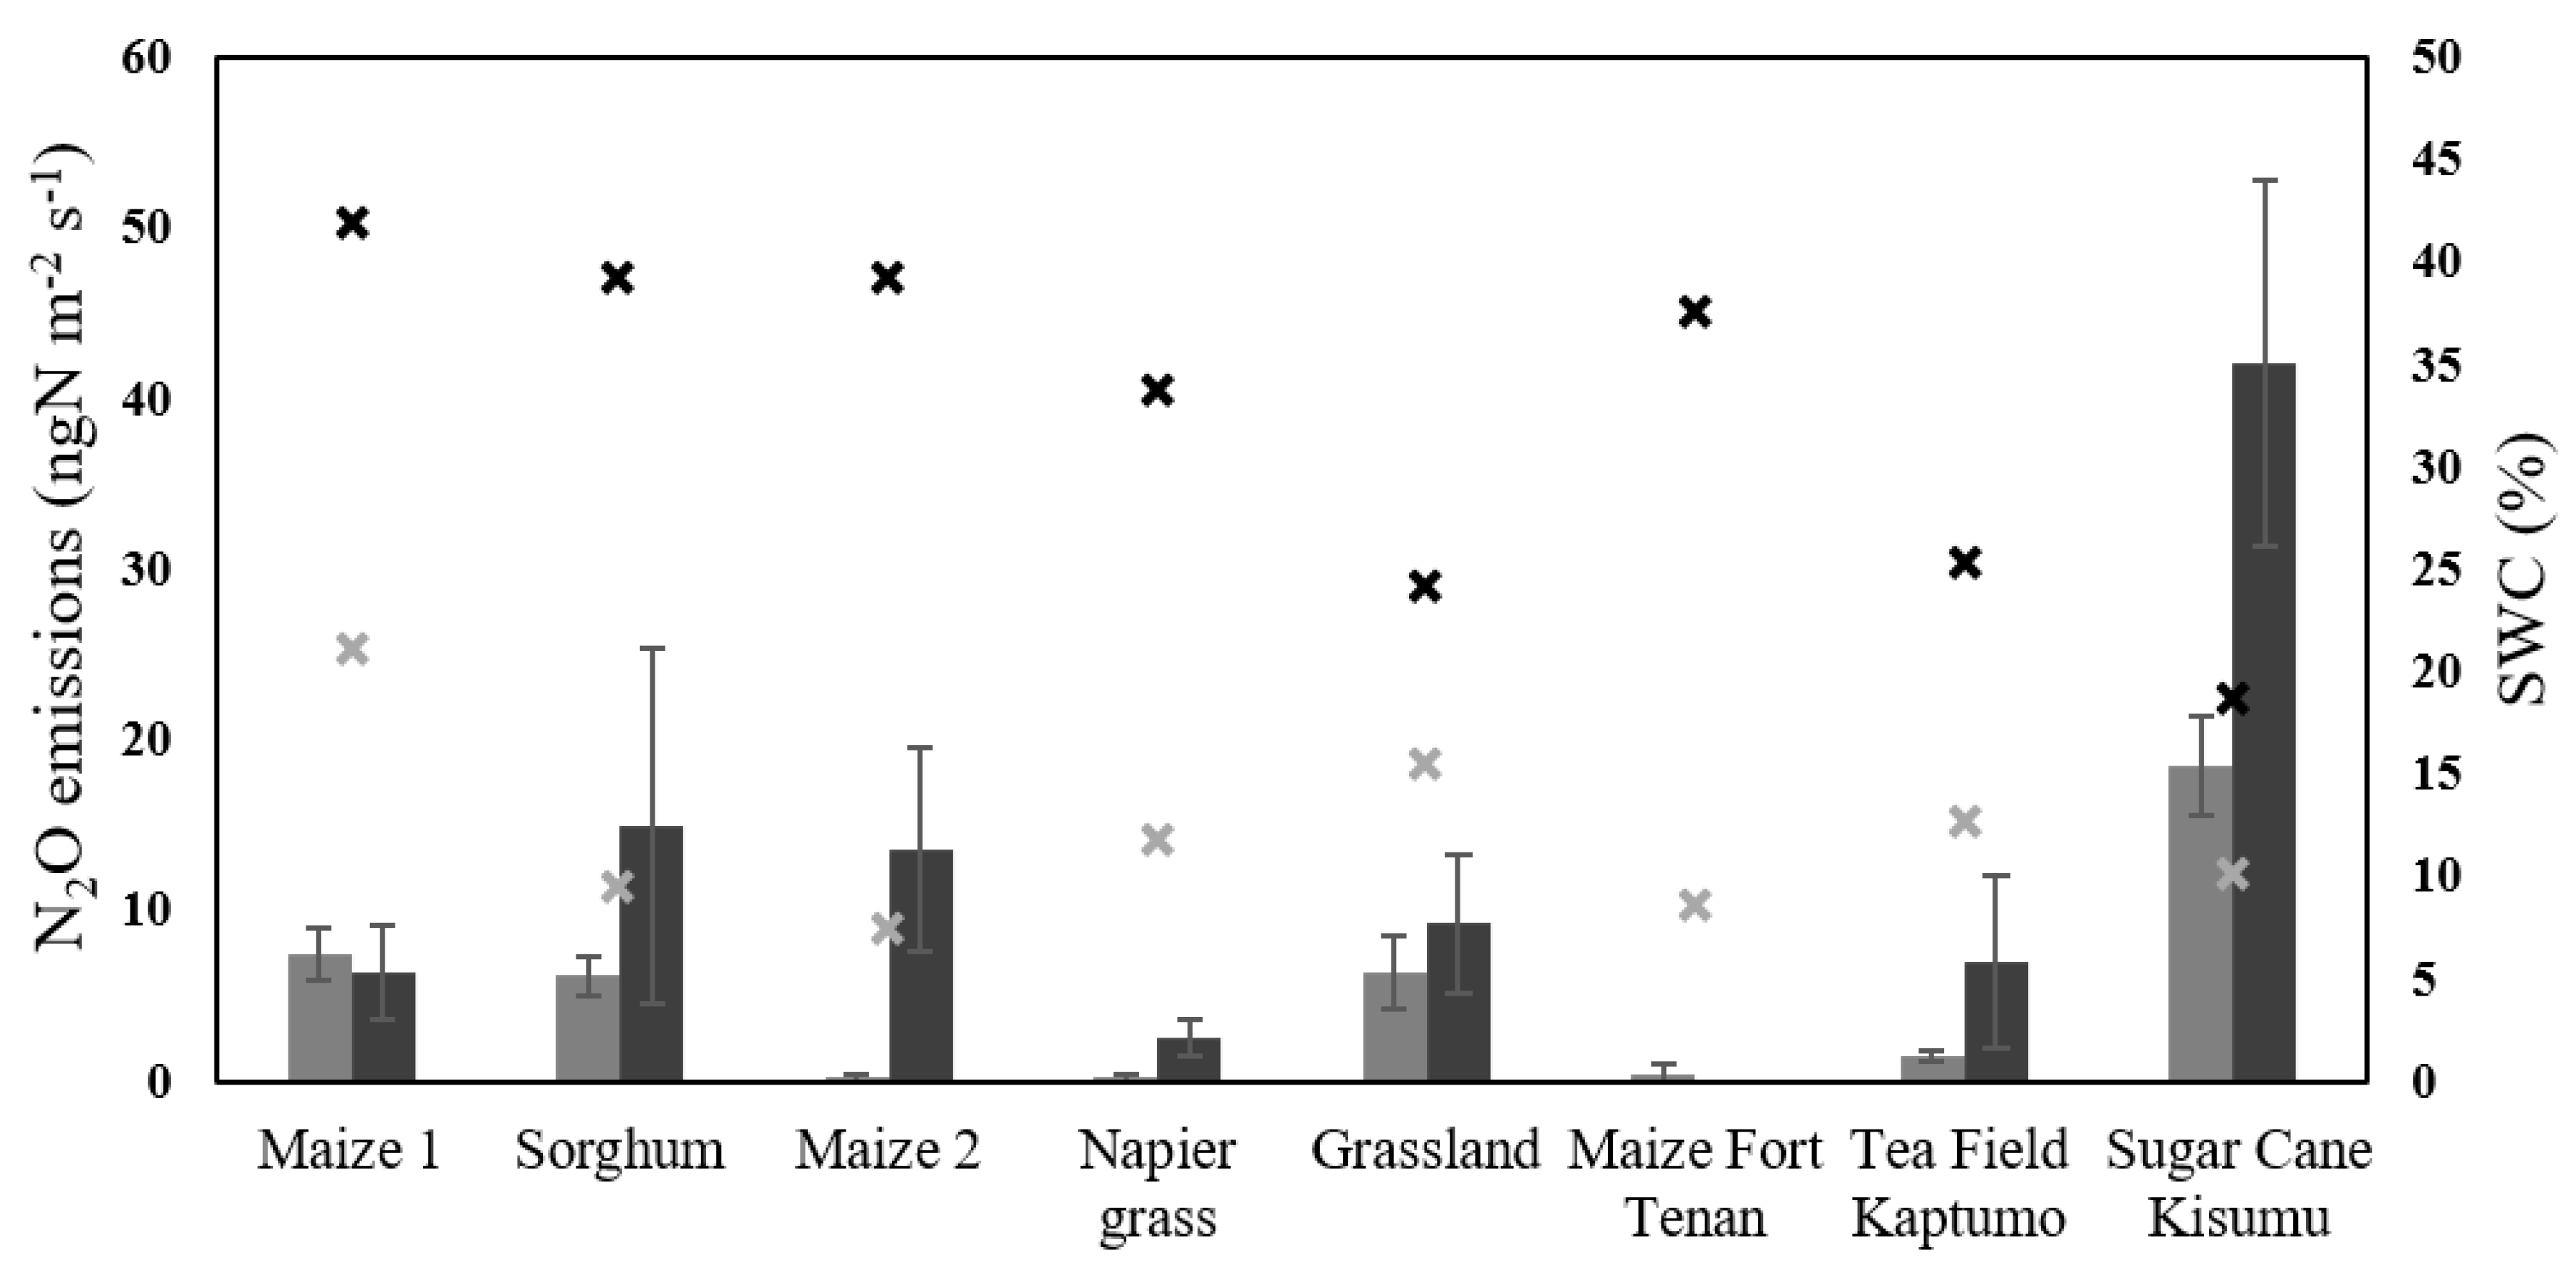
3.1. Mbita Region Measurements

Results from the Mbita region are presented by plot type (instead of time series) as a different plot was monitored each day during the campaigns. There were no rain events the week before the January campaign, whereas 30 mm of rain were recorded during the week prior to the November campaign (Figure 2). During the Mbita campaigns, N2O emissions varied from 0.1 ± 0.3 and 7.4 ± 2.0 and from 0.0 ± 0.0 and 14.0 ± 6.0 ngN m−2 s−1 during dry and rainy season, respectively, except at the Sugar Cane Kisumu field, where the highest N2O emissions were measured with 19.0 ± 3.0 and 42.0 ± 11.0 ngN m−2 s−1, respectively, for the dry and rainy season (Figure 3). This plot shows maximum clay content and minimum sand content of 42% and 20%, respectively, compared to the other sites in the Mbita region, which were characterised by soil clay and sand content ranging from 30 to 38% and from 41 to 46%, respectively. The lowest N2O emissions were measured at the Maize Fort Ternan plot with 0.4 ± 0.7 and 0.0 ± 0.0 ngN m−2 s−1 in January and November, respectively. SWC varied from 9 to 25% and from 19 to 44% (Figure 3) during dry and rainy seasons, respectively, and was systematically higher in November (rainy season) than in January (dry season) for all plots (Figure 3). N2O emissions were on average larger in November than in January with 11.3 ± 5.9 and 5.1 ± 1.5 ngN m−2 s−1, respectively.
The Mbita soil NH4+ and NO3 contents between 0 and 20 cm were generally higher in November than in January (Table A2). Among the different plots, soil NH4+ content varied from 1.5 ± 0.2 mgN kgsoil−1 (Sorghum) to 4.8 ± 0.5 mgN kgsoil−1 (Tea Field Kaptumo) during the January campaign, with an average of 2.9 ± 1.2 mgN kgsoil−1 for all plots, and from 1.6 mgN kgsoil−1 (Tea Field Kaptumo) to 11.3 mgN kgsoil−1 (Maize Fort Ternan) during the November campaign, with an average of 5.9 mgN kgsoil−1 for all plots. Soil NO3 content ranged from 0.2 ± 0.04 mgN kgsoil−1 (Napier Grass) to 3.7 ± 1.7 mgN kgsoil−1 (Maize Fort Ternan) during the January campaign, with an average of 1.5 ± 0.7 mgN kgsoil−1, and from 1.0 mgN kgsoil−1 (Napier Grass) to 17.4 mgN kgsoil−1 (Grassland) during the November campaign, with an average of 4.7 ± 5.3 mgN kgsoil−1 for all plots. No correlation or trend was found between N2O emissions and soil NH4+ content. Furthermore, no significant relationships were found at the daily scale, neither between N2O emissions and SWC nor between N2O emissions and soil NO3 content (R² = 0.00 and 0.04, respectively).

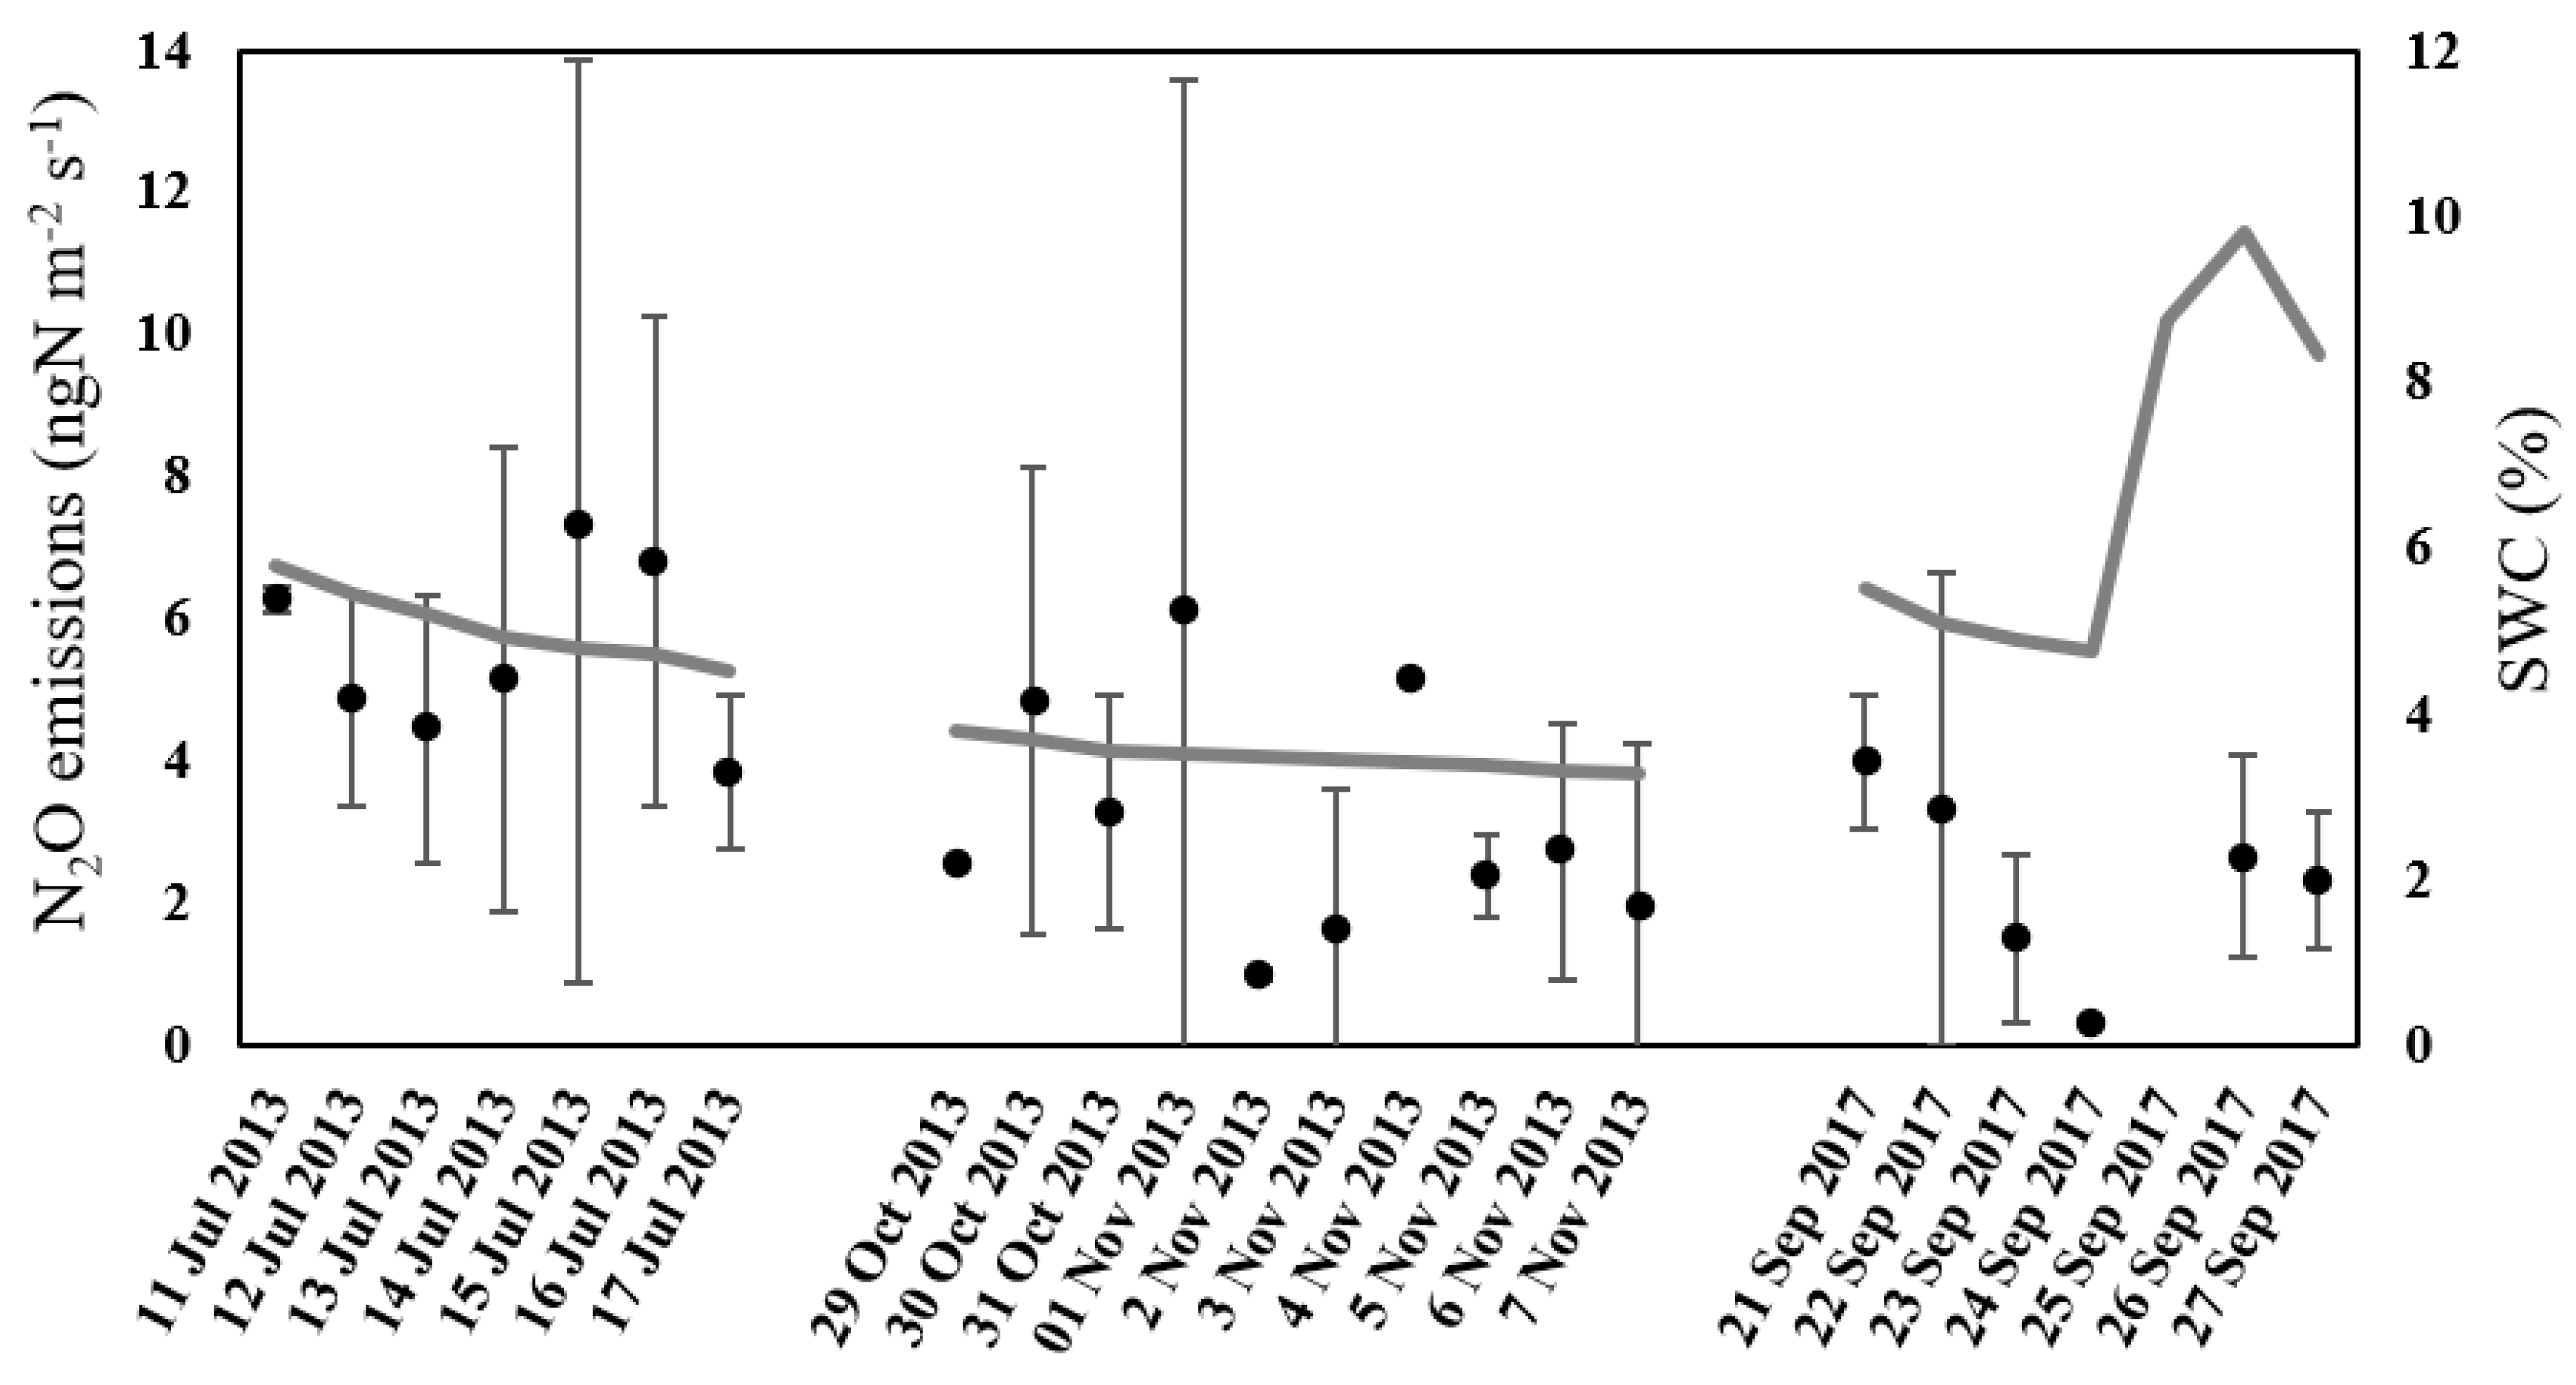
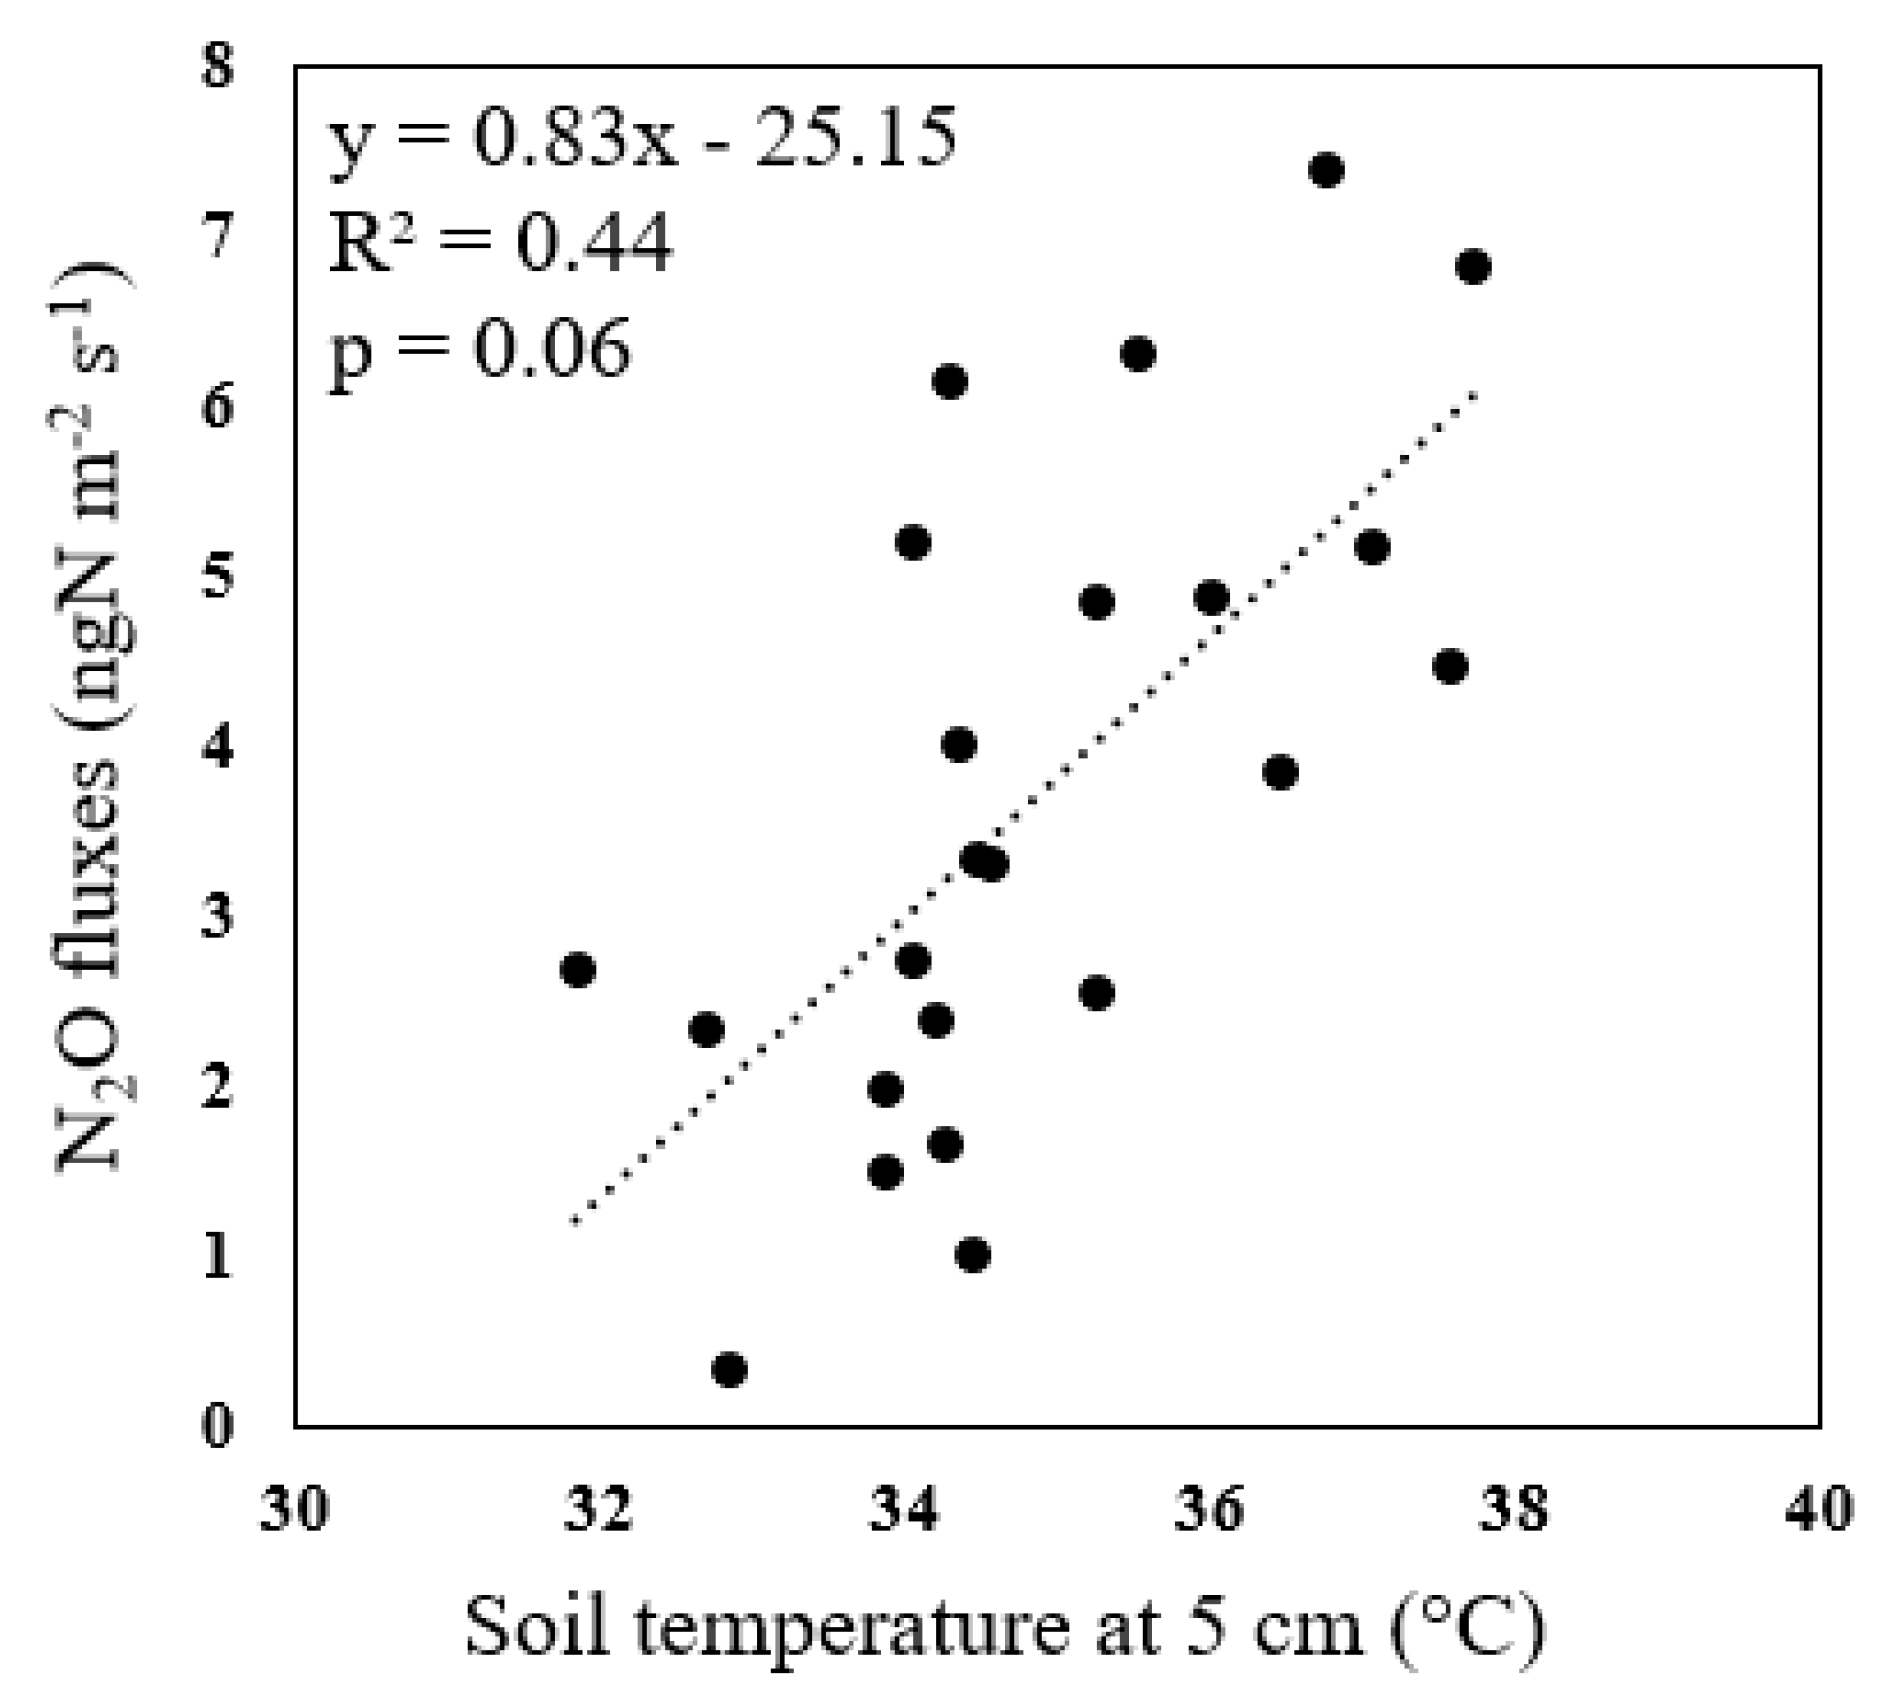
3.2. Dahra Site Measurements

Cumulative rainfalls of 24, 0.3 and 12 mm were observed during the weeks preceding the campaigns of July 2013, October 2013 and September 2017, respectively, in Dahra. SWC was low throughout all the campaigns, ranging from 3.3 to 9.8%, the lowest values measured during November 2013 and the highest values measured during September 2017 (Figure 4). N2O emissions in Dahra ranged from 0.3 ± 0.0 to 7.4 ± 6.5 ngN m−2 s−1, with September 2017 showing the lowest emissions and the highest SWC (Figure 4). Soil NH4+ and NO3 contents were also low compared to Mbita soils (Table A2).
A linear relationship between soil temperature at 5 cm depth and N2O emissions was established, with a R² of 0.44 and a p-value of 0.06, showing that N2O emissions increased with soil temperature in Dahra (Figure 5) when data from all Dahra campaigns were combined. However, no significant relation was found between SWC at 5 cm depth and N2O emissions (R² = 0.00) on a daily scale. Not enough data of soil NO3 and NH4+ content (n = 7 and 8, respectively) were available to fit a relationship with N2O emissions.

3.3. Modelling N2O Emissions at the Dahra Site

Modifications of some initial parameters to adapt the denitrification module of DNDC to the semi-arid conditions of the Dahra site were necessary as the default settings did not correctly reproduce the observed N2O emissions. (1) The WFPS threshold in DNDC from which denitrification can operate is fixed at 40%, a value never reached in Dahra. A set of different WFPS thresholds from 0 to 40% was tested to find the most appropriate value, and a 9% threshold value was kept for the simulations as it gave the lowest RMSE and highest R2. (2) After these tests, the influence of the CON and SYN variables (see Appendix D) were decreased to fit the simulation results with observed N2O emissions. CON and SYN represent processes acting on denitrification co-products; therefore, the reduction applied to these values in the case of the present study will decrease the amplitude of conversion and synthesis processes and allow the adaptation of the parameterisation to semi-arid climate conditions.

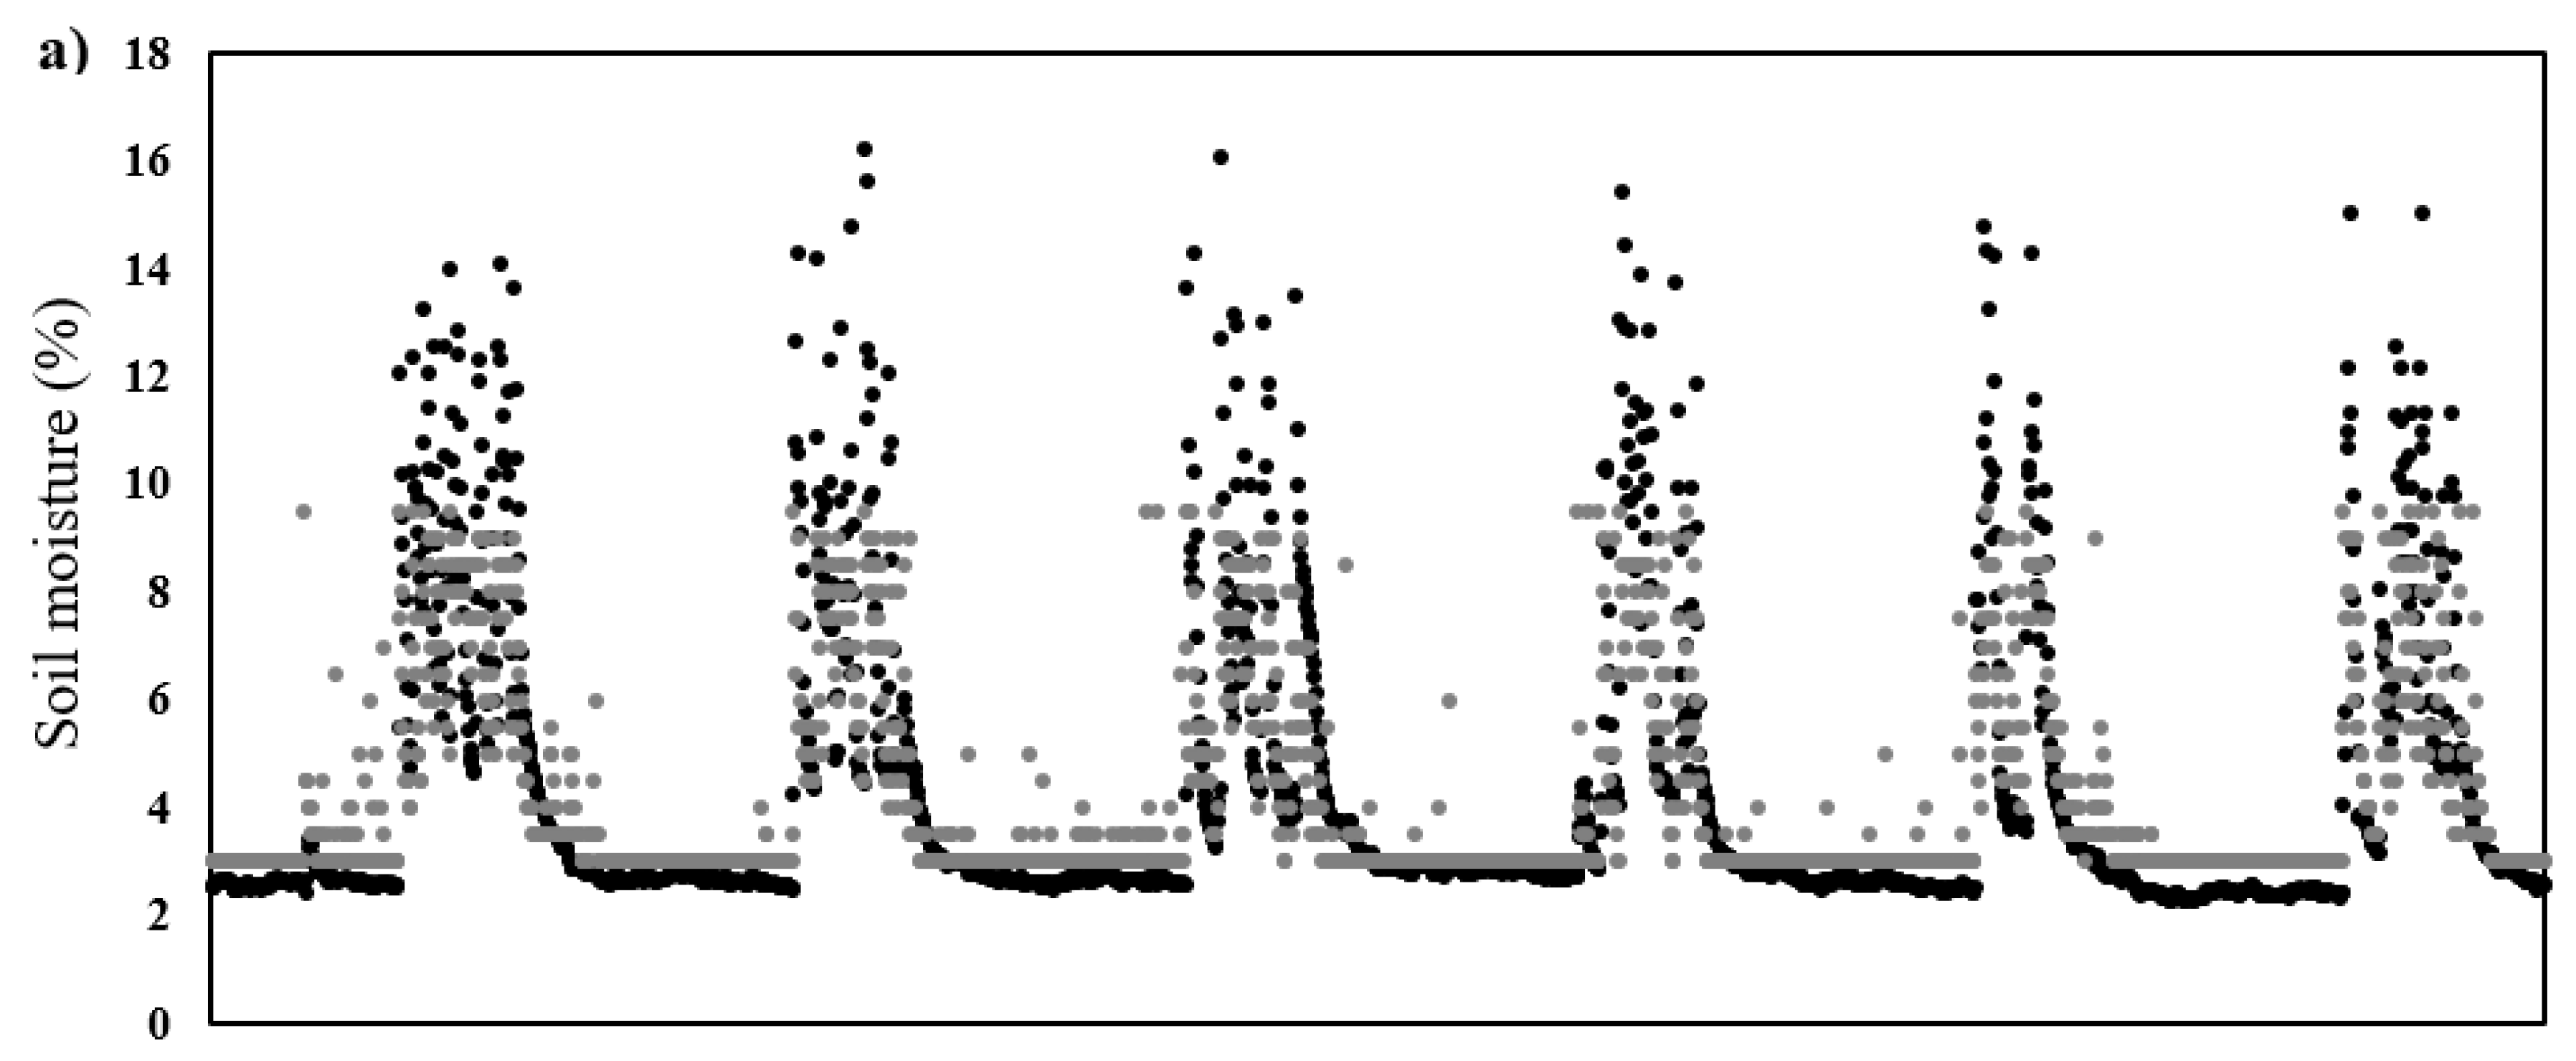
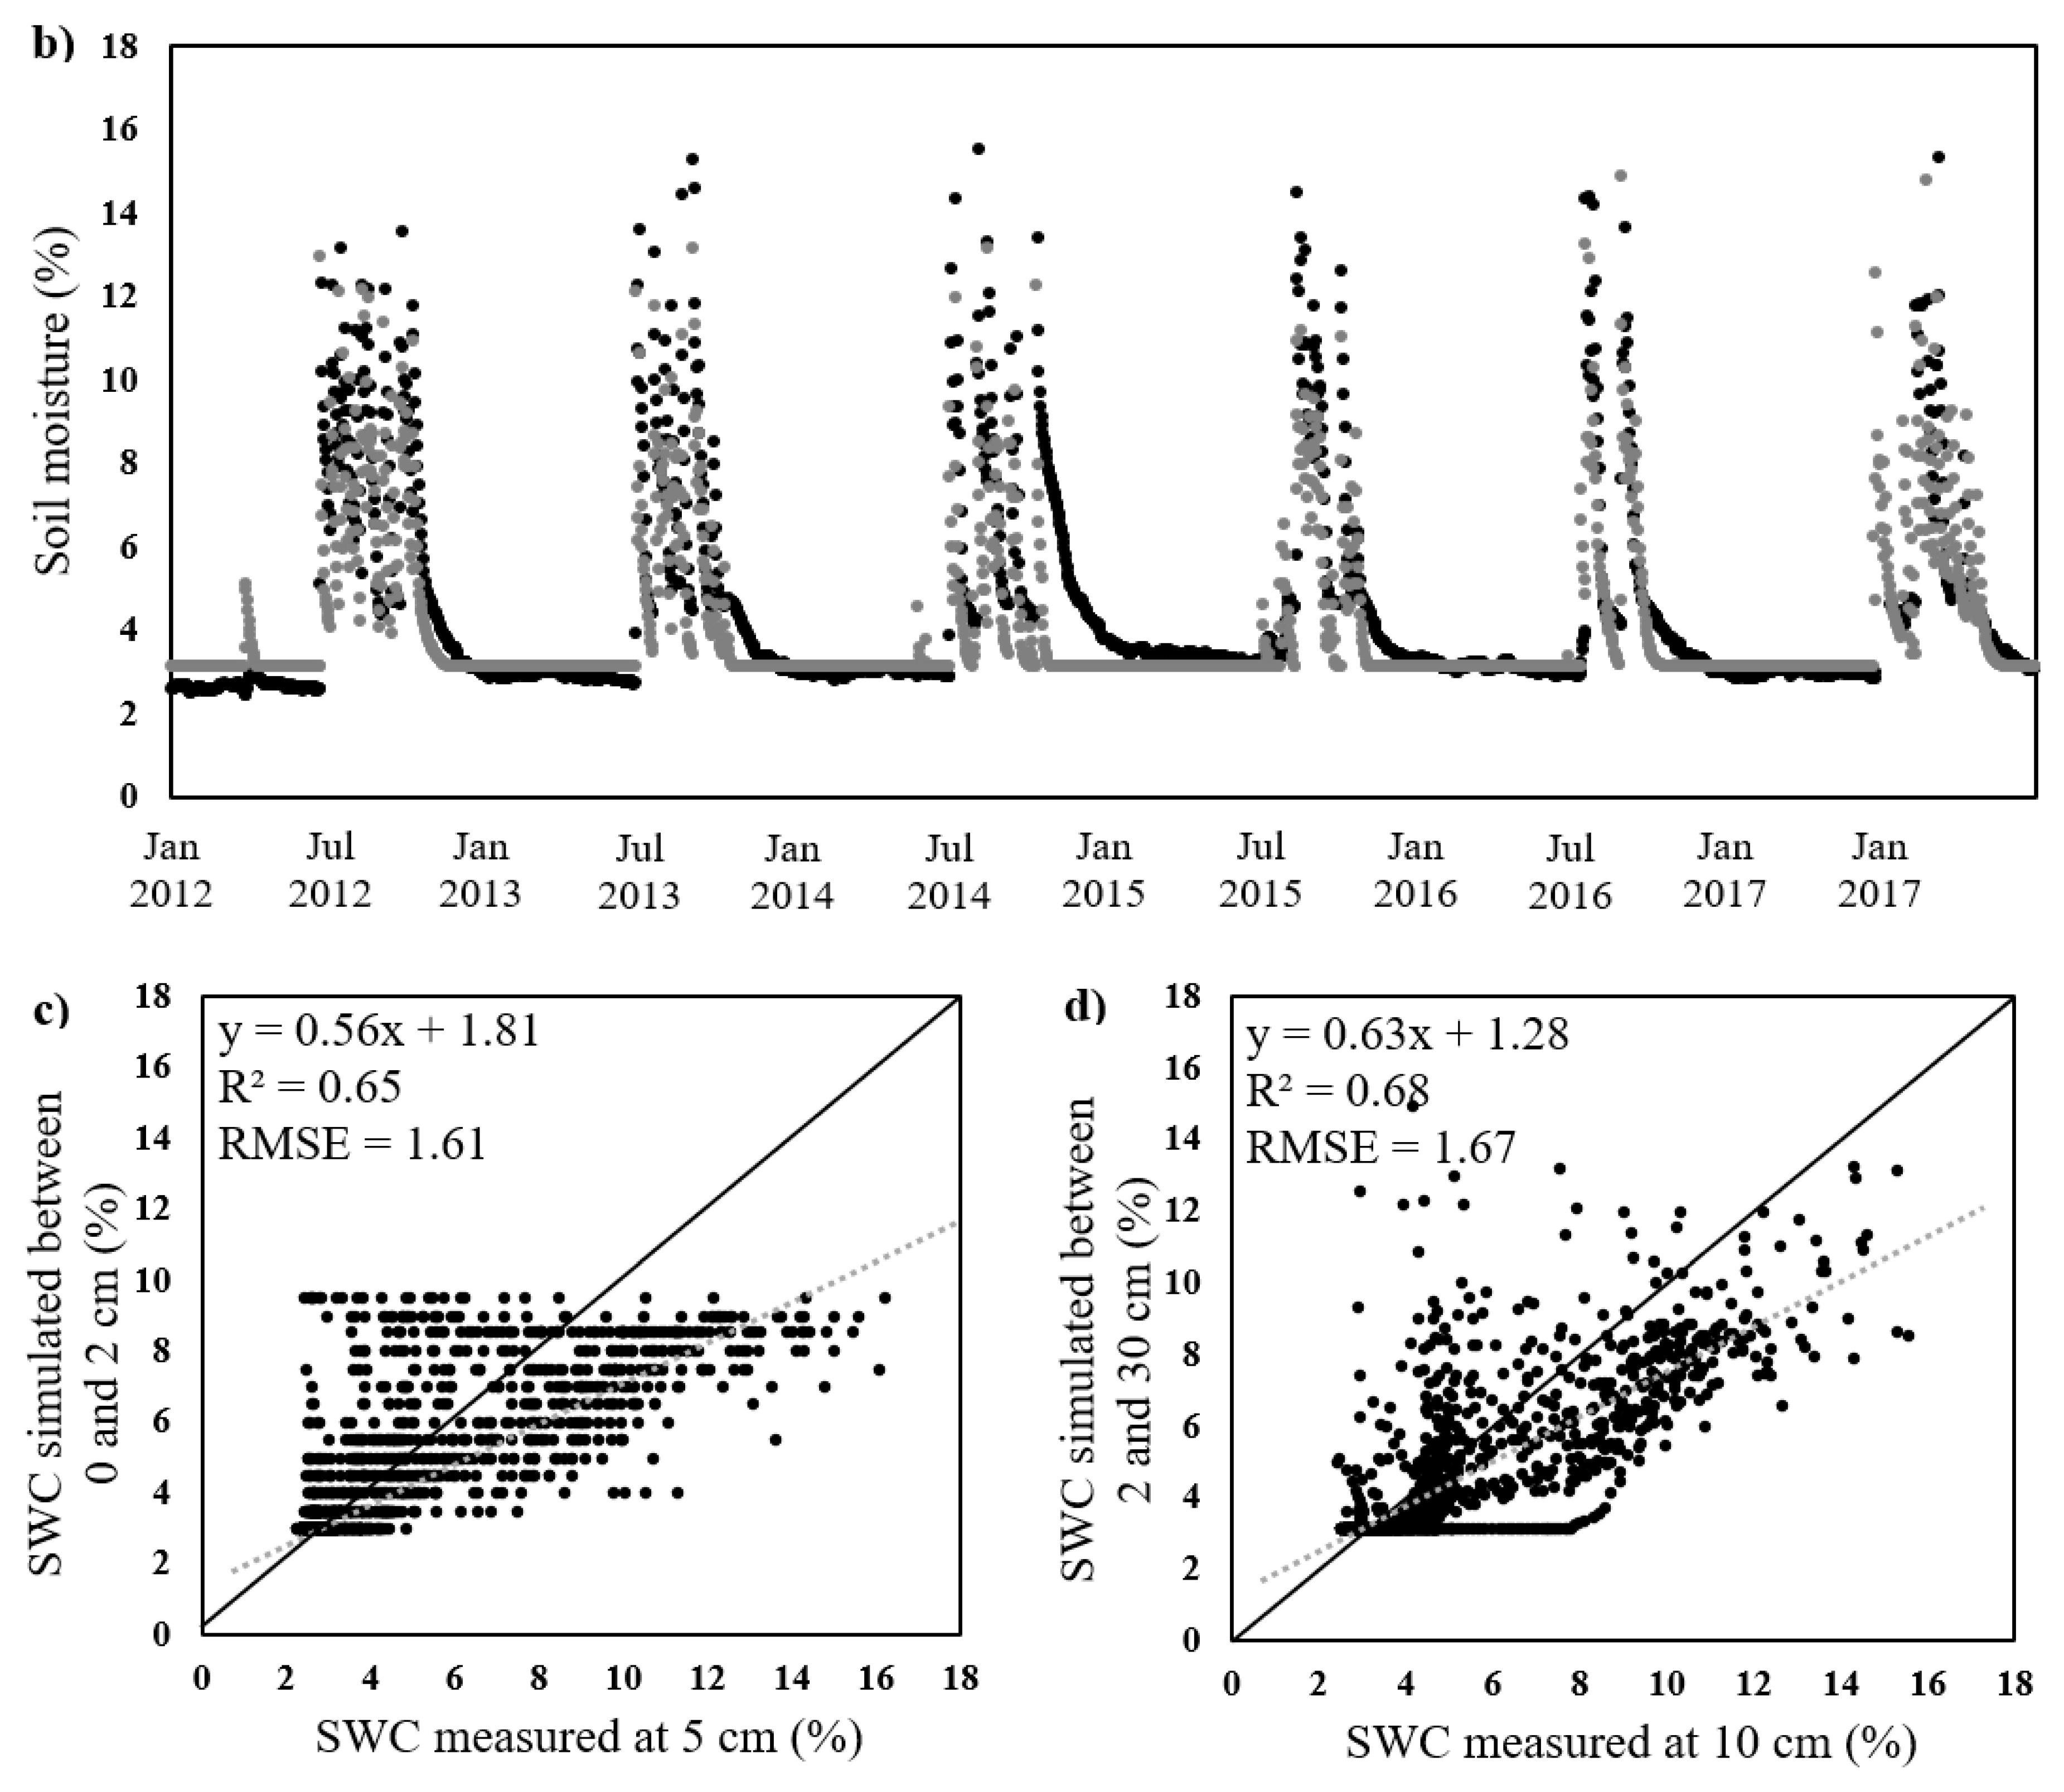
3.3.1. Soil Water Content Modelling
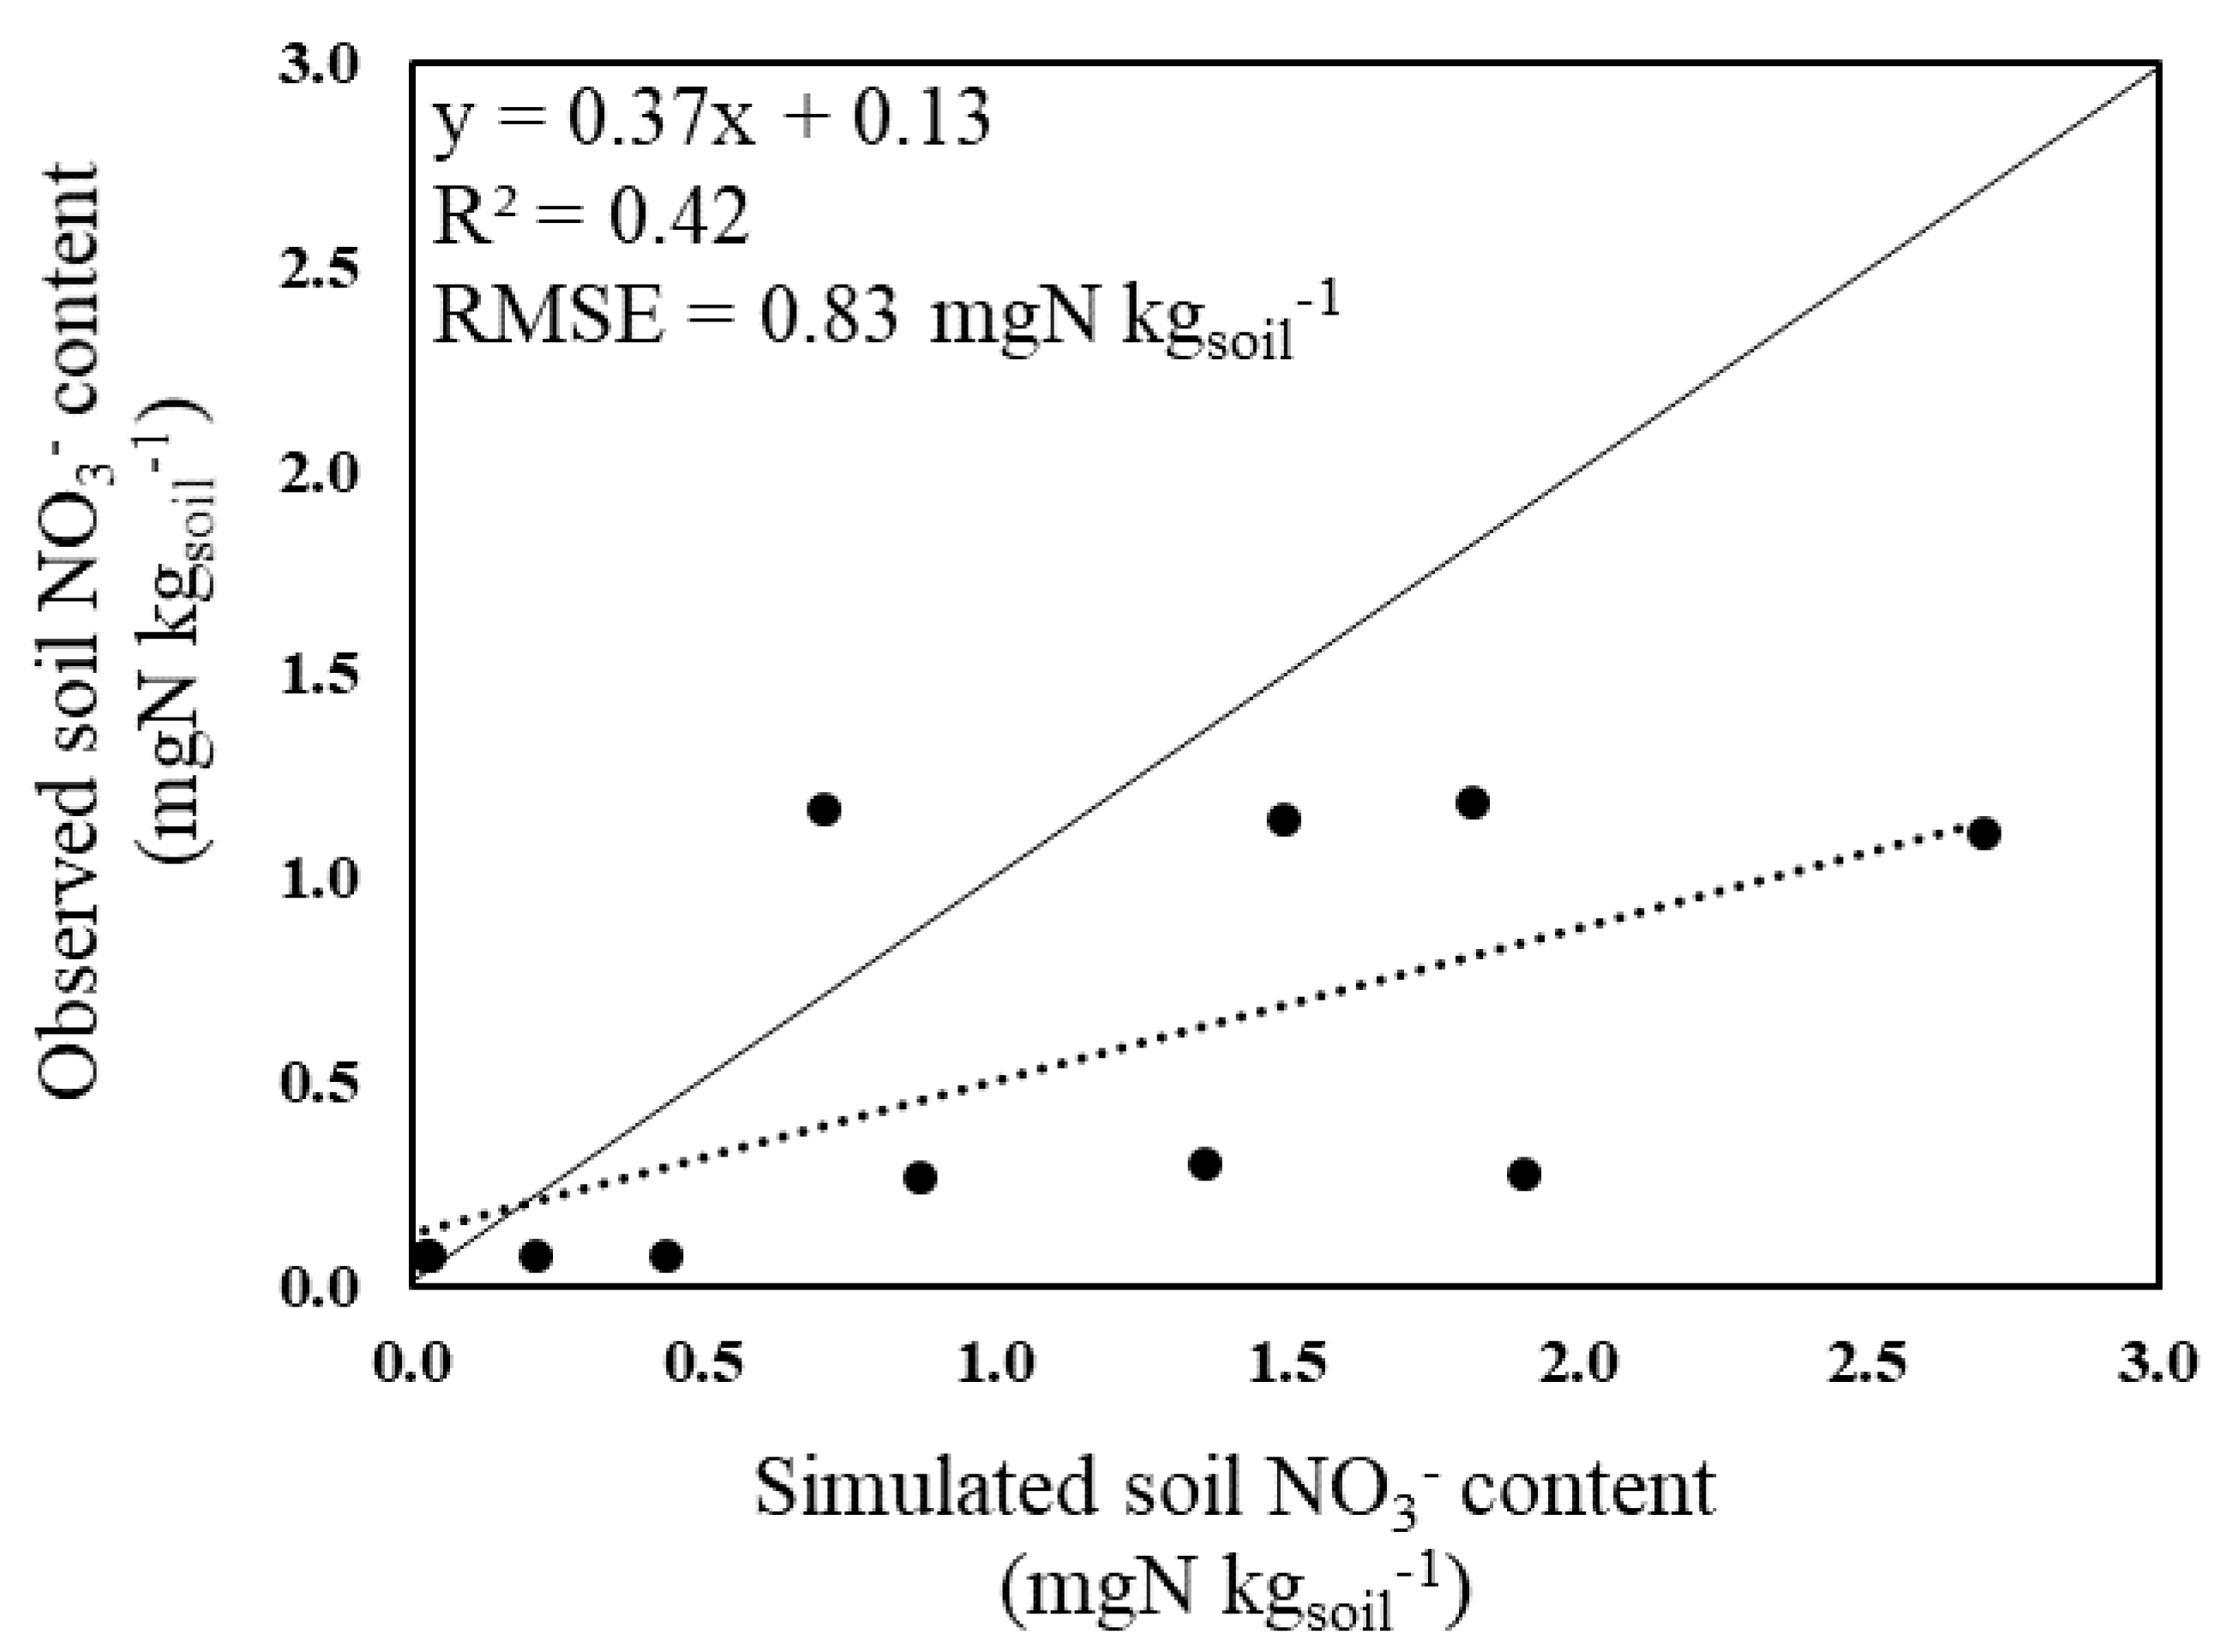
Before simulating the N2O emissions from Dahra site, a validation of soil water content estimation was undertaken. Strong relationships were found between SWC measured at 5 cm depth and simulated in the 0–2 cm layer (Figure 6a,c) and between SWC measured at 10 cm depth and simulated in the 2–30 cm layer (Figure 6b,d) with R² values of 0.65 and 0.67 and RMSEs of 1.61 and 1.67%, respectively. Differences between simulated and measured SWC at 5 cm depth are mainly due to the difference between the depths where SWC was estimated: layers 0–2 cm/2–30 cm in the simulation, depths 5/10 cm in the measurements. Indeed, measurement depths and model layers are different because modifying the partition of soil layers in the hydrological module would have impacted the SWC validation. At both depths, SWC temporal dynamics and ranges are comparable between measurements and simulations. The thresholds observed in the simulations (Figure 6a,b) are explained by the way STEP calculates SWC. Indeed, the model follows the tipping-bucket approach: when the field capacity is reached into a layer, the water in excess is transferred to the next layer and SWC is limited to the field capacity value [33].

3.3.2. NO3 Content

With only ten values available for comparison, the linear regression between observed and simulated soil NO3 content shows an R² of 0.42 and a RMSE of 0.83 mgN kgsoil−1, with simulations generally overestimating the observations by a factor of about 2.5 (Figure 7).

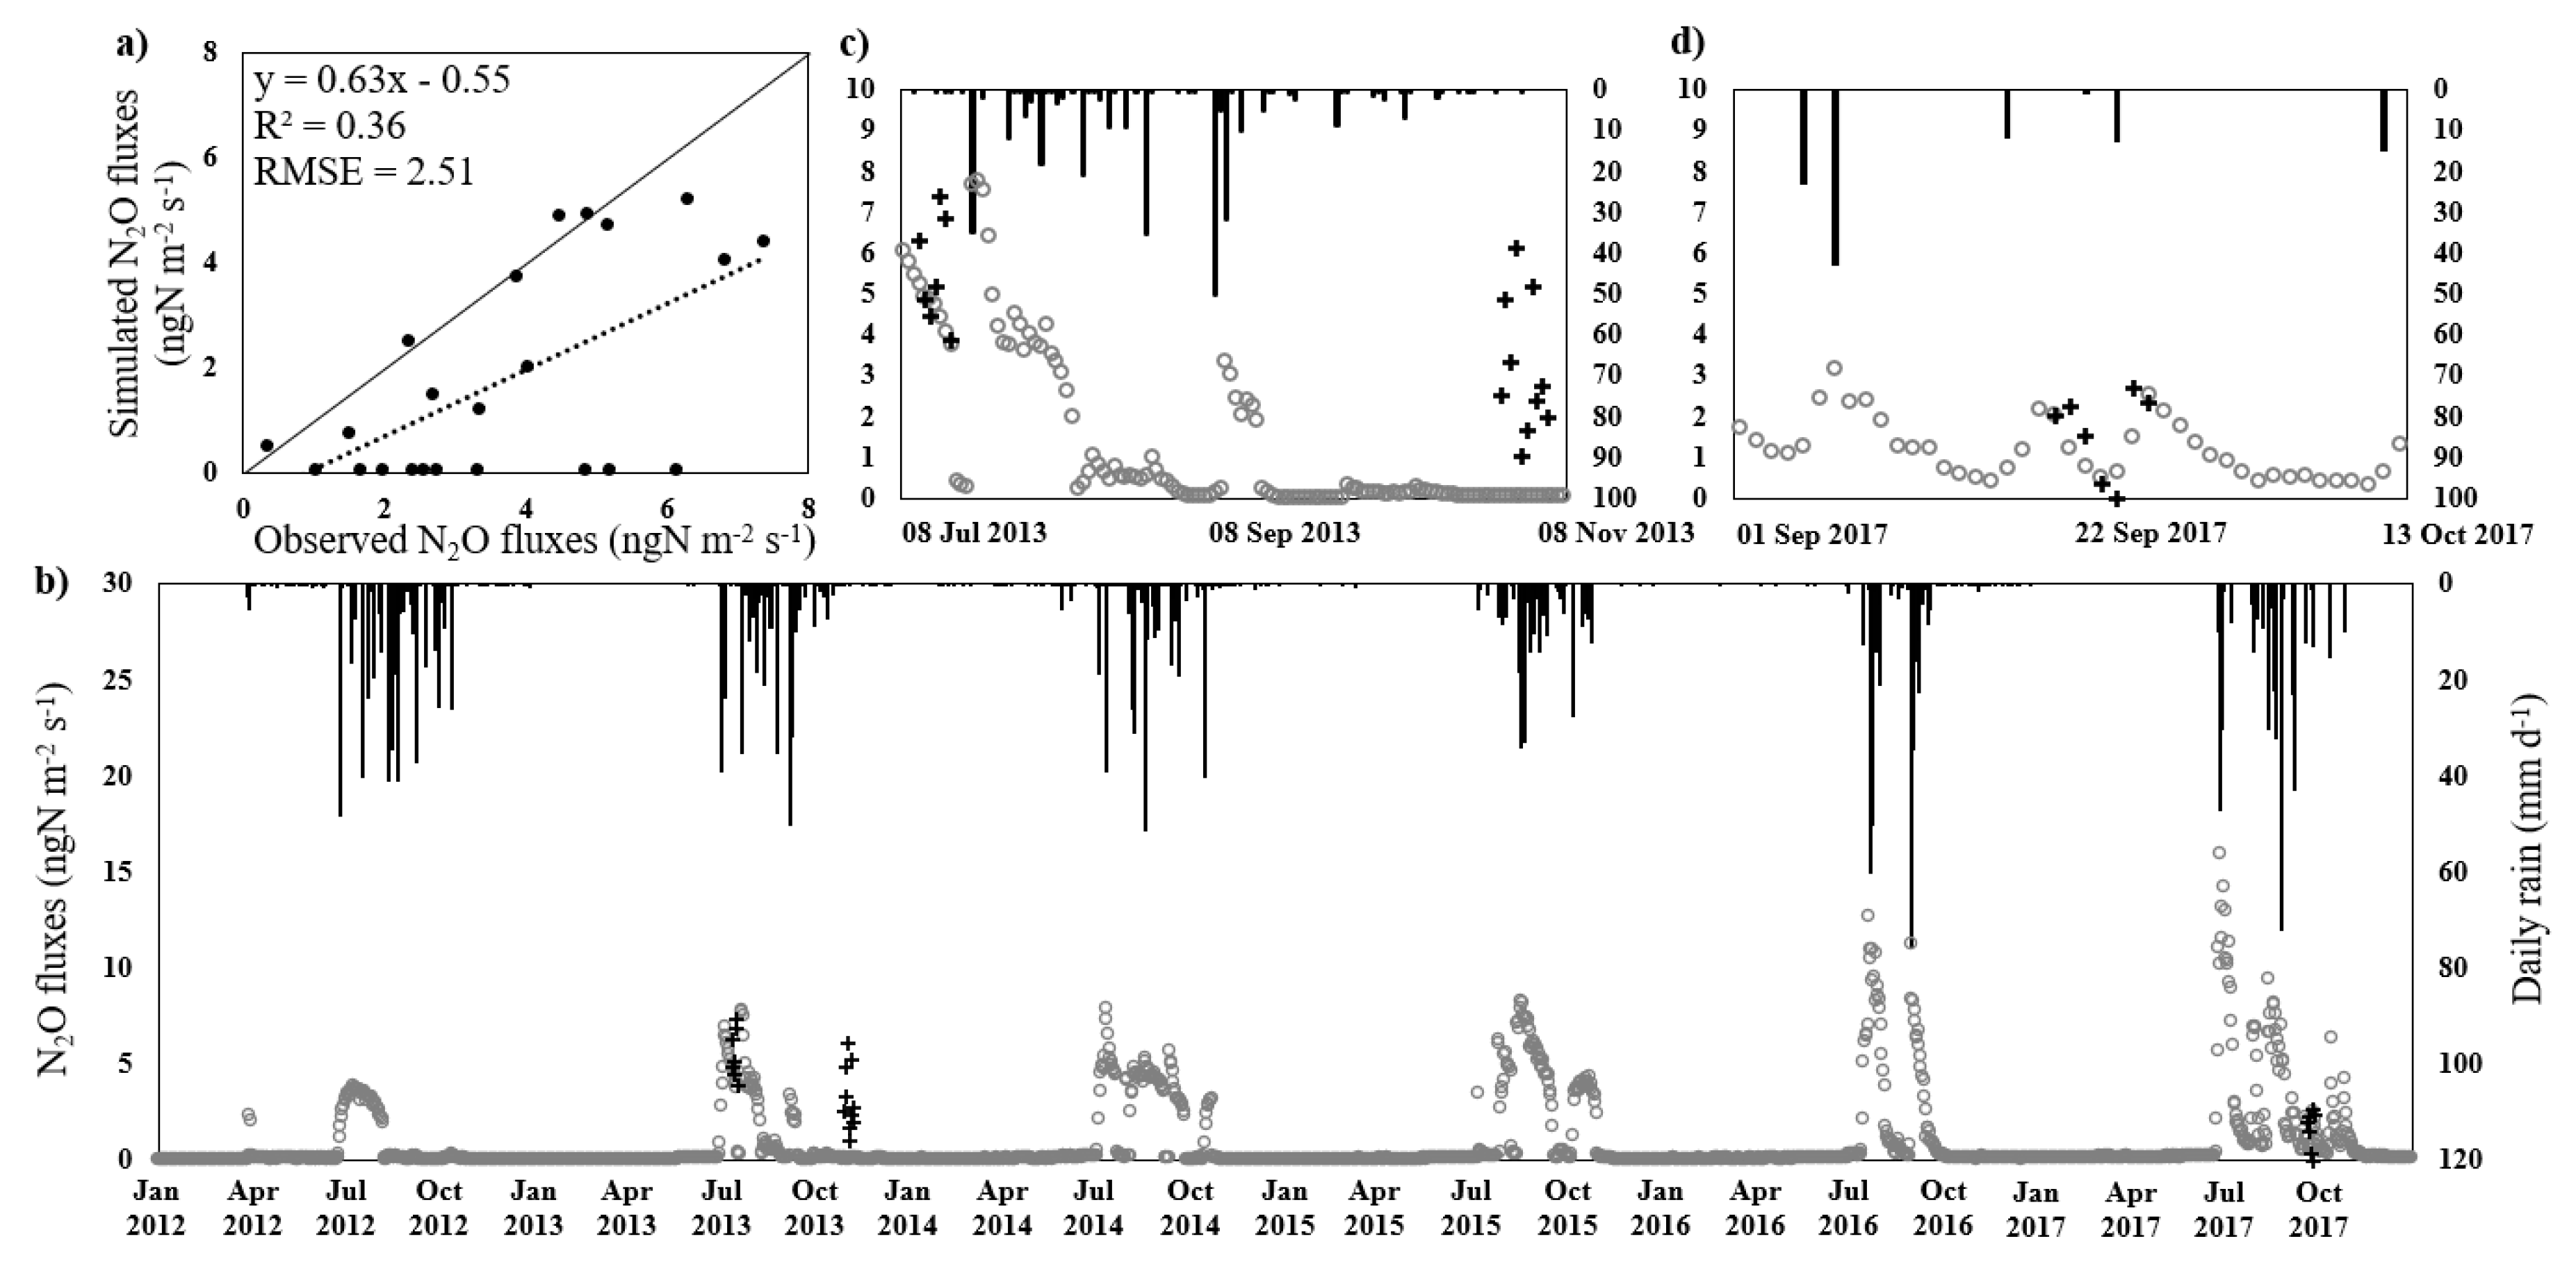
3.3.3. Simulated N2O Emissions

Simulated N2O emission dynamic followed the observed data dynamic in July 2013 and September 2017, but not in November 2013, when the simulated emissions were close to 0 and the observed emissions varied from 1.0 to 5.2 ngN m−2 s−1. N2O emissions simulated by STEP-GENDEC-N2O from 2012 to 2017 varied from 0.05 to 15.9 ngN m−2 s−1 and showed a comparable range of values as in the observations (Figure 8). In general, the relationship between the simulation and the observations is weak, with an R² of 0.36 and RMSE of 2.5 ngN m−2 s−1, mostly caused by the differences found in November 2013; if the results from this campaign were removed from the dataset, the R² would rise significantly to 0.68 (p-value = 0.006). The low N2O emissions simulated during November 2013 is due to simulated WFPS under 9%, which does not allow denitrification to happen. Simulated N2O emissions follow a clear seasonal pattern, with the most notable N2O emissions reported during the rainy season and the lowest during the dry season. The rise of simulated N2O emissions during the rainy season is due to WFPS values above the 9% threshold required to trigger denitrification combined with a rise of soil NO3 content, which results from an increasing soil biological activity, microbial growth and an increase of organic matter decomposition.
Based on STEP-GENDEC-N2O simulation, N2O emissions occurring during the rainy season (between 1 July and 31 October) represent between 81 and 97% of the total annual N2O budget depending on the year (Table 2) with a mean value of 0.27 and 0.03 kgN ha−1 yr−1 for the rainy and dry season, respectively. An annual N2O budget uncertainty of 0.04 kgN ha−1 year−1 was calculated for the simulation estimations based on the methodology described in Section 2.3.

3.4. Annual N2O Budget Calculation in MBITA and Dahra

Savannas/grasslands ecosystems in Africa would emit 0.2 ± 0.03 TgN of N2O per year based on the mean annual N2O budget of 0.3 ± 0.04 kgN ha−1 yr−1 (Table 2) simulated by STEP-GENDEC-N2O if the Dahra site is considered representative of these ecosystems, which cover a surface of 640 Mha in Africa [11].
An annual N2O budget of the Mbita region may be extrapolated from our measurements if the Mbita sites are considered representative of Kenya’s agricultural plots (the type of crops cultivated on the experimental plots in the Mbita region represent more than 50% of the crops cultivated in Kenya). To do so, the average value measured in November (11.3 ± 4.7 ngN m−2 s−1) was applied to the rainy seasons (5 months, 153 days), whereas the one measured in January (5.1 ± 1.2 ngN m−2 s−1) was applied to the dry seasons (7 months, 212 days). This resulted in a rough N2O annual budget estimate of 2.4 ± 0.9 kgN ha−1 yr−1. As there is no information on the land use type in the region, it was impossible to refine this estimation by weighting the calculation according to the area covered by each crop.
Based on this calculation, African agricultural lands would therefore emit 1.2 ± 0.4 TgN of N2O per year, considering that the Mbita region is representative of croplands in Africa, which cover a surface of 480 Mha [11].

4. Discussion

4.1. Magnitude of N2O Emissions and Comparison to Other Studies

N2O emissions observed in the Mbita region present the same trend as those reported from agricultural plots in Kenya and Tanzania by Rosenstock et al. (2016), who measured lower emissions during the dry season [49], from 0 to 8 ngN m−2 s−1, compared to the rainy season, with emissions ranging from 0 to 45 ngN m−2 s−1. They are also comparable to those obtained by Wachiye et al. (2020), who measured N2O emissions ranging from 0 to 21 ngN m−2 s−1 from a cropland site in Kenya [19], but without any clear amplitude differences between seasons. Our observations differ from emissions measured by Pelster et al. (2017) from smallholders’ farms in Kenya near Mbita, as their measurements varied between 0 to 11 ngN m−2 s−1 throughout the years 2013–2014 without any special seasonal trend, except for one plot, which showed a peak at 27 ngN m−2 s−1 during the rainy season [25].
N2O emissions observed and simulated in the Dahra site are of the same order of magnitude as those measured from a Zimbabwean savanna site by Rees et al. (2006) [50], from multiple Burkinabe savanna sites by Brümmer et al. (2008) and from multiple semi-arid sites in the USA, South Africa, Canada and Spain by Meixner and Yang (2006,) ranging from 3 to 9 ngN m−2 s−1, from 0 to 11 ngN m−2 s−1 and from 0 to 10 ngN m−2 s−1 respectively [26,51]. The two first studies showed an emission maximum at the beginning of the rainy season, which is consistent with our simulation results, with peaks reaching maximum 15 ngN m−2 s−1, whereas no N2O emission peak was observed from measurements after a rain event, probably due to a too-short campaign duration as rainfall impact on N2O emission may be delayed [52,53]. Low N2O emissions at Dahra compared to Mbita sites can be explained by contrasting climate and soil properties: Dahra has a mean annual rainfall three times lower than Mbita and lower soil N, C, clay, NH4+ and NO3 content (Table 1).

4.2. Key Drivers of N2O Emissions

SWC seems to be an important key driver affecting N2O emissions at the seasonal scale according to this study, despite the fact that SWC shows no correlation at a daily time-scale in both regions. Indeed, emissions during the rainy season were larger than those measured during the dry season (Figure 3), especially in Mbita. However, this observation cannot be strictly applied to September 2017 campaign at Dahra, where the average measured SWC was the largest but the average N2O emissions were the lowest (Figure 4). The absence of correlation between SWC and N2O emissions at a daily time-scale was also reported by Aronson et al. (2019) for a semi-arid coastal grassland in California (R² < 0.05) [54]. Low correlation between SWC and daily N2O emissions was found as well by Huang et al. (2014) (R² < 0.25) in their study of a maize field in Nolensville (USA) [55]. On the other hand, Werner et al. (2007) and Pihlatie et al. (2005) found a good correlation (R² = 0.66 and 0.64, respectively) between N2O emissions and WFPS at their sites located in Kakamega Rainforest (Kenya) and Sorø (Denmark), respectively [56,57].
No correlation was found between N2O emissions and soil NO3 content at a daily time-scale, but this variable could explain the surprisingly low N2O emissions observed in September 2017 at the Dahra site. Despite having the highest SWC values measured during this campaign, it also showed the lowest soil NO3 content for all campaigns from both regions (Table A2). Therefore, even if SWC could be favourable to N2O formation, the concentration of NO3 seems to be too low to initiate N2O production and associated emissions. In Mbita, the largest NO3 contents in the rainy season led to the largest N2O emissions. These results are in accordance with the review by Butterbach-Bahl et al. (2013), who highlighted the important role of soil NO3 content on N2O emissions at the global scale [2].
N2O emissions increase with soil temperature at Dahra (Figure 5), indicating that this parameter could also play an important role in N2O emissions from savanna ecosystems but with low reliability (0.05 < p ≤ 0.1). In Mbita, no conclusion can be drawn from the measurements, as soil temperature was not measured in January 2018. However, soil temperature is not likely to explain N2O emissions in Mbita, as it does not vary much during the year, as shown by a climatological study of soil temperature, with an average of 29.3 ± 2.5 °C at 10 cm soil depth (Bakayoko, pers. com.). No convergence on the role of temperature on N2O emissions is found in the literature because the role of temperature on denitrification and nitrification processes is difficult to assess and gives contradictory results depending on the study [19,58,59,60].
In the Mbita region, the highest N2O emissions were measured in the Sugar Cane Kisumu field during both campaigns despite the fact that this plot had no fertilisation input. This could be due to it having the highest and lowest values of clay and sand, respectively, measured on this plot. This observation is consistent with the studies of Bouwman et al. (2002) and Rochette et al. (2018), who found that a soil with a fine texture like clay soil, which favours soil anaerobic condition, emits more N2O than soils with medium and coarse texture [61,62]. This result shows that basing the estimation of N2O emissions only on N input as is the case for the IPCC Tier 1 calculation method can lead to significant uncertainties [63].
The poor correlations found between N2O emissions and the key drivers at a daily time-scale can be explained by the non-linear relationships between N2O emissions and their key drivers as reported in several studies [2,64], especially in climates with distinct dry and rainy seasons characterised by pronounced changes in SWC.

4.3. N2O Emissions from Semi-Arid Sites

At the Dahra site, N2O emissions occur and can be larger than those measured in the Mbita region, even with the very low SWC in Dahra (Table A2). Observed and simulated WFPS in Dahra reached a maximum value of 30%, which is, in theory, considered to be too low to trigger denitrification or to be the minimum WFPS from which denitrification may begin to appear [51]. The STEP-GENDEC-N2O simulation results are thus consistent with the ‘Birch’ effect [22] leading to peaks of N2O emissions at the beginning of the rainy season. Pelster et al., (2017) also measured N2O emissions ranging from 0 to 27 ngN m−2 s−1 from their study sites, even though WFPS never exceeded 40% [25]. Indeed, some studies showed that N2O emissions from natural and agricultural tropical ecosystems in SSA have an important seasonal trend with a peak of emission at the beginning of the rainy season and just after the dry season that could be due to the ‘Birch’ effect [22,26,65]. In this transition period, Pelster et al. (2017) and Brümmer et al. (2008) measured maximum peaks of 27 and 42 ngN m2 s1, in Kenya and Burkina Faso, respectively [25,26].
The N2O emissions measured at the Dahra site under WFPS being far under the generally recognised theoretical denitrification threshold could also be explained by variations in denitrifiers community, which can change with climate, soil and vegetation type [66,67]. As highlighted by Butterbach-Bahl et al. (2013) [2], denitrification can be classified as a microbiologically ‘broad process’, which can be conducted by a wide array of microbes.

4.4. DNDC Denitrification Module Adaptation to Semi-Arid Conditions

WFPS threshold was set to 9% in the model (Section 4.1) to allow N2O emissions in semi-arid conditions, contrary to the original 40% set by Yuexin Liu (1996) [35]. Even if this threshold appears insufficient to trigger a denitrification process, it seems that another kind of N2O production and emission processes are taking place in such dry ecosystems and support this modification. Zheng et al. (2019) also measured N2O emissions ranging from 0 to 14 ngN m−2 s−1 at two Tanzanian croplands, even though the WFPS was always below 40% [4]. As shown in Section 4.2., the pulse effect of N2O emissions after rainfall and the increase of denitrification potential with the climate aridity [21,22] support the modifications of the code to be able to simulate N2O emissions for semi-arid regions. The modifications of the amplitude of the conversion and synthesis factors (Section 2.4.2) are further supported by the occurrence of denitrification for different conditions than usually encountered in more humid areas.

4.5. Annual Cycle of N2O Emissions from Simulated Results

STEP-GENDEC-N2O simulations at the Dahra site performed better in July 2013 and September 2017 compared to November 2013, where the model simulated almost no emissions during this period in contrast to observations (Figure 8). This poor performance of the model during the transition between the rainy and the dry seasons has already been highlighted by Delon et al. (2019), who showed that STEP-GENDEC-NOFlux underestimated the CO2 and NO emissions during November 2013 due to a too-steep decrease in simulated SWC [33], annihilating the possibility for microbial processes to participate in respiration and nitrification in the soil. However, this transition period is short in time, and low SWC during the dry season is well represented by the model the rest of the time. Our results, in accordance with those reported by Delon et al. (2019) [33], show that N2O production and emissions in semi-arid ecosystems do not react as in temperate ecosystems. Despite the November 2013 specificity, the simulation is of the same order of magnitude as in situ measurements with N2O emissions ranging from 0.1 to 5.2 and from 0.3 ± 0.0 to 7.4 ± 6.5 ngN m−2 s−1, respectively, for the campaigns’ period. On average, the mean N2O emissions in 2012–2017 from the model are 0.1 ± 0.7 and 2.3 ± 2.7 ngN m−2 s−1 in dry and rainy seasons, respectively. As far as the authors know, modelling studies of N2O emissions in African soils, and more specifically for semi-arid soils, are not available in the literature, and this study is the first attempt to simulate an annual cycle of N2O emissions for a site in the Sahelian region.

4.6. Regional Scale N2O Budget Estimation

The N2O annual budgets reported here must be used with caution as these calculations involve large uncertainties caused by the low number of measurements and the difficulty of the STEP-GENDEC-N2O model to represent correct emissions at the transition between rainy and dry seasons at the Dahra site. Furthermore, the measurements used in this study consider low or non-fertilised plots representative of smallholder farms and are not necessarily representative of larger croplands that can also be found in the Lake Victoria catchment. These budgets may therefore be underestimated. However, the N2O annual budgets simulated by STEP-GENDEC-N2O at Dahra are in the same range as previous estimates of N2O emissions in Sahelian regions reported by Brümmer et al. (2009) that ranged from 0.2 to 0.7 kgN ha−1 yr−1 (Table A3) [68]. As presented in the results section, the N2O budget in the Dahra site is 0.3 ± 0.04 kgN ha−1 yr−1, considered here as representative of savanna/grassland ecosystem, and the N2O budget in the Mbita region is 2.4 ± 0.9 kgN ha−1 yr−1, considered here as representative of cropland in Africa. However, in the Mbita region, missing data from the long rainy season period causes large uncertainties on the N2O budget estimation, as the rainfall magnitude is more than three times higher during this period compared to the short rainy season (Figure 2). Therefore, if the positive effect of SWC on N2O emissions identified in this study is also relevant for the long rainy season, the annual N2O budget suggested in this study could be underestimated. These values are still of the same order of magnitude as those estimated by Kim et al. (2016), who calculated N2O annual budget from savanna/grassland ecosystem and cropland in Africa of 0.4 ± 0.1 and 2.5 ± 0.9 kgN ha−1 yr−1, respectively (Table A3) [13]. Their estimations are based on the compilation of multiple studies on the continent. In their study, savanna/grassland ecosystems proved to produce the lowest emissions when compared to the other ecosystem types forest/plantation/woodland and agroforestry, with N2O annual budgets of 2.7 ± 1.0 and 3.0 ± 1.4 kgN ha−1 yr−1, respectively.
Based on Kim et al.’s (2016) results [11], African agricultural and savanna/grassland would emit 1.2 ± 0.4 and 0.3 ± 0.1 TgN of N2O per year, while the present study estimated a budget of 1.2 ± 0.4 and 0.2 ± 0.03 TgN of N2O per year for these ecosystems, respectively. Relative to these estimates, even if African croplands represent a much-reduced area, they would emit between 4 and 6 times more N2O than savanna/grassland ecosystems. The results presented here are below those simulated by the projection method for the period 2000–2050 reported by Bouwman et al. (2013), where N2O emissions from African agricultural soils reach 0.5 and 0.8 TgN yr−1 in 2010 and 2050 (Table A3), respectively [27,28,29]. Therefore, the results of the present study (1.2 ± 0.4 TgN yr−1) are above those projected for 2050. Moreover, according to EDGAR (Emissions Database for Global Atmospheric Research) estimations of direct N2O emissions from managed soil in Africa for the year 2015 [69] based on the IPCC Tier 1 methodology [63], N2O emissions from the agricultural sector in Africa were 0.5 TgN in 2015. This estimation is more than two times less than the one calculated in this study and is equivalent to the IMAGE simulation for 2010. Two options may be suggested: (1) the budget calculated here and by Kim et al. (2016) may not be representative of the whole continent but [11], in the case of this study, more of the agricultural lands in the equatorial bent, or (2) the two modelling approaches underestimate N2O emissions. Nonetheless, the EDGAR and IMAGE simulations of N2O emissions from agricultural soils in Africa remain approximately twice those from savannah/grassland ecosystems calculated in this study and by Kim et al. (2016) [11], which meets the same tendency as our results.

5. Conclusions

This paper provides new in situ measurements and modelling results from two contrasting ecosystems and contributes to expanding on the currently insufficient database on N2O emissions for the African continent. Experimental results are reported for cropland N2O emissions in Kenya and grassland N2O emissions in Senegal, along with simulated N2O emissions from savanna ecosystems. Measurements and simulations showed that N2O emissions present a seasonal variation and highlighted the importance of the rainy season on emission amplitude in both regions. Indeed, SWC proved to be an important driver at the seasonal scale, with larger emissions during the rainy season for the Mbita-region sites and at the beginning of the rainy season for the Dahra site. No direct correlation on a day-to-day scale was found in either region, due to the highly non-linear characteristic of N2O emissions and temporal lags between emissions and underlying production processes in the soil. The use of modelling proved to be a useful tool to deepen our understanding of N2O emission processes at the Dahra site, highlighting the pulse effect at the beginning of the rainy season. The results presented in this study confirm that N2O emissions from savannas are lower than those from croplands in SSA, despite their larger areas, with 0.2 ± 0.1 TgN-N2O for savannas and 1.2 ± 0.4 TgN-N2O for croplands.

Author Contributions

Conceptualization, L.B. and C.D.; methodology, L.B., C.D., D.S., C.G.-L., F.G. and L.M.; software, L.B.; validation, L.B., C.D., D.S., C.G.-L., F.G., L.M., T.T. (Torbern Tagesson), R.F. and O.N.; formal analysis, L.B., S.A. and S.G.; investigation, L.B., C.D., D.S., C.G.-L., F.G. and O.N.; data curation, C.D.; writing—original draft preparation, L.B. and C.D.; writing—review and editing, O.N., C.G.-L., D.S., F.G., T.T. (Tiphaine Tallec), L.M., T.T. (Torbern Tagesson) and R.S.; supervision, C.D.; project administration, C.D.; funding acquisition, C.D., D.S., C.G.-L. and F.G. All authors have read and agreed to the published version of the manuscript.

Funding

This research was funded by the LEFE-EC2CO INSU CNRS program. TT was additionally funded by the SNSB (Dnr 95/16), and TT, RF and the Dahra field site were funded by DFF (grant ID: DFF–6111-00258). LM acknowledges the financial support of the CGIAR Fund Council, Australia (ACIAR), Irish Aid, European Union, International Fund for Agricultural Development (IFAD), the Netherlands, New Zealand, UK, USAID and Thailand for funding to the CGIAR Research Program on Livestock.

Acknowledgments

The authors thank Francis Mcodimba and Peter Nyongesa for their logistical help and welcome at ICIPE (Mbita, Kenya); Silas Okumu for his work in the field at ICIPE, Mbita (Kenya); and technicians at CRZ, Dahra (Senegal), for their logistical help.

Conflicts of Interest

The authors declare no conflict of interest.

Appendix A. Laboratories Involved in Analysis of Samples

Table A1. Names of laboratories involved in samples analysis of each measurement campaigns.
Field CampaignSoil AnalysisGC N2O MeasurementsRef.
Dahra 2013GALYS labLaboratoire d’AerologieDelon et al. (2017)
Dahra 2017LAMA DakarLaboratoire d’AerologieThis study
Mbita January and November 2018GALYS labILRIThis study

Appendix B. N2O Emissions and Key Drivers from the Mbita Region and the DAHRA Site

Table A2. Average N2O emissions, SWC, soil NH4+ and NO3 content between 0 and 20 cm and soil C/N ratio from all campaigns in the Mbita region (by plots) and Dahra (by campaign). No meas. means no measurement available. (a) indicates that only one measurement was available. Jan = January; Jul = July; Sep = September; Oct = October; Nov = November.
SitesFN2O
(ngN m−2 s−1)
SWC
(%)
[NH4+]
(mgN kgsoil−1)
[NO3]
(mgN kgsoil−1)
C/N
Maize 1 Jan7.4 ± 2254.8 ± 0.52.8 ± 0.3No meas.
Maize 1 Nov6.3 ± 3425.2 (a)1.9 (a)9.5 ± 0.1
Sorghum Jan6.2 ± 1111.5 ± 0.21.2 ± 0.7No meas.
Sorghum Nov15 ± 10395.2 (a)2.7 (a)8.4 ± 0.4
Maize 2 Jan0.1 ± 0.392.9 ± 1.40.8 ± 0.2No meas.
Maize 2 Nov14.0 ± 6.0397.0 (a)3.0 (a)10.6 ± 0.6
Napier grass Jan0.1 ± 0.3142.4 ± 0.50.2 ± 0.04No meas.
Napier grass Nov2.6 ± 1.0344.8 (a)1.0 (a)10.7 ±0.1
Grassland Jan6.4 ± 2.0182.4 ± 0.90.9 ± 0.3No meas.
Grassland Nov9.3 ± 4.0249.6 (a)17.4 (a)9.8 ± 0.6
Maize Fort Ternan Jan0.4 ± 0.7102.2 ± 0.43.7 ± 1.7No meas.
Maize Fort Ternan Nov0.0 ± 0.03811.2 (a)2.9 (a)11.8 ± 0.9
Tea Field Kaptumo Jan1.5 ± 0.3154.3 ± 1.50.6 ± 0.4No meas.
Tea Field Kaptumo Nov6.9 ± 5251.6 (a)3.1 (a)13 ± 0
Sugar Cane Kisumu Jan19.0 ± 3.0123.4 ± 1.12.1 ± 1.8No meas.
Sugar Cane Kisumu Nov42.0 ± 11.0192.3 (a)5.4 (a)9.1 ± 0.1
Dahra Jul 20135.5 ± 3.05No meas.No meas.12.7 ± 0.2
Dahra Nov 20133.2 ± 3.041.2 ± 0.51.4 ± 0.511.3 ± 1.2
Dahra Sep 20172.4 ± 1.571.8 ± 1.30.17 ± 0.28 ± 0

Appendix C. N2O Budget Estimations in Africa Reported in this Study

Table A3. Summary of annual N2O budget estimations in Africa reported in this study at the plot and regional scales.
Spatial ScaleLand Use TypeAnnual N2O Budget at the Plot and Regional ScalesReferencesNumber of MeasurementsLocation or Region
Plot
Savanna0.3 ± 0.04 kgN ha−1This studySimulationSenegal
Savanna/ grassland0.4 ± 0.1 kgN ha−1Kim et al. (2016)6Zimbabwe
Savanna0.52 to 0.67 kgN ha−1Brûmmer et al. (2009)79 to 152Burkina Faso
Agriculture2.4 ± 0.9 kgN ha−1This study16Kenya
Agriculture2.5 ± 0.9 kgN ha−1Kim et al. (2016)83Zimbabwe
Agriculture0.19 to 0.20 kgN ha−1Brümmer et al. (2009)79 to 152Burkina Faso
Region
Savanna0.2 ± 0.03 TgNThis studySimulationAfrica
Savanna/ grassland0.3 ± 0.1 TgNKim et al. (2016)6Africa
Agriculture1.2 ± 0.4 TgNThis study16Africa
Agriculture0.5 to 0.8 TgNBouwman et al. (2013)SimulationAfrica
Agriculture0.5 TgNEDGARSimulationAfrica

Appendix D. DNDC Denitrification Module Adapted in STEP-GENDEC

Table A4. Names, definition and unit of variables used in the denitrification module of STEP-GENDEC-N2O.
VariablesDefinitionUnit
C d e n i t Total carbon pool of denitrifierskgN ha−1 d−1
C O N i Conversion coefficient of NO3 to NO2 (1), NO2 to N2O (2) and N2O to N2 (3)kgN ha−1 d−1
C R Residue carbon contentkgC m−3
C S C Soluble carbon pool available to microbeskgC ha−1 d−1
D R B Decomposition rate of residue to microbial biomasskgC m−3
E N 2 O N2O emissions to the atmospherekgN ha−1 d−1
f p H ( i ) Reduction factor of CONi due to pH, see Table A6.unitless
f M Moisture reduction factor of residue decompositionunitless
f N 2 O Fraction of N2O released in the atmosphereunitless
f T d e n i t Temperature reduction factor of denitrificationunitless
f T n i t Temperature reduction factor of nitrificationunitless
f W n i t Moisture reduction factor of nitrificationunitless
G d e n i t Denitrifiers growth rateunitless
G i Relative growth rate of denitrifier iunitless
K A Kinetic factor of NO3 production via nitrificationunitless
N 2 O d e n i t N2O production via denitrificationkgN ha−1 d−1
N 2 O n i t N2O emissions to the atmosphere produced by nitrificationkgN ha−1 d−1
N H 4 + Soil NH4+ contentkgN ha−1 d−1
N O 2 Soil NO2 contentkgN ha−1 d−1
N O 3 Soil NO3 contentkgN ha−1 d−1
P d e n i t _ n e w New-formed microbial biomass of the denitrifiers poolkgC ha−1 d−1
p H s o i l Soil pH in the 2–30 cm soil layerunitless
S N O 3 Source of nitrate from nitrificationkgN ha−1 d−1
S M Soil moisture in the 2–30 cm soil layer%
S Y N i Synthesis of NO3 (1), NO2 (2) and N2O by denitrifierskgN ha−1 d−1
T s o i l Soil temperature in the 2–30 cm soil layer°C
W F P S Soil Water Filled-Pore Space%
Table A5. Names, definition, value and unit of parameters used in the denitrification module of STEP-GENDEC-N2O.
ParametersDefinitionValueUnit
c l a y Soil clay content3%
D R F Decomposition rate factor0.01unitless
f B / C O 2 Ratio between formed biomass and produced CO2 in residue decomposition0.67unitless
f C N N availability reduction factor0.92unitless
G i , M Relative growth rate of denitrifier i in maintenancesee Table A6unitless
M i Maintenance coefficient of isee Table A6unitless
R C N B C/N ratio of microbial biomass10kgC/kgN
S D R R Specific decomposition rate of residue0.020unitless
i 1 2 half-saturation value of element isee Table A6kgN ha−1 d−1
Y i maximum growth yield of isee Table A6unitless
Table A6. Values of G i , M , i 1 2 , M i and Y i in function of element i and of f p H ( i ) in function of pH and element i .
G i , M i 1 2 M i Y i f p H ( i )
N O 3 0.670.0830.090.401 7.14 · p H s o i l 3.8 22.8
N O 2 0.670.0830.0350.4281
N 2 O 0.340.0830.0790.151 7.22 · p H s o i l 3.8 22.8
  • NO3 Production via Nitrification:
    d ( N O 3 ) d t = S N O 3 N O 3 N O 3 + N H 4 + · D R B R C N B
    where N O 3 is the soil nitrate content (kgN ha−1 d−1), S N O 3 is the source of NO3 from nitrification (kgN ha−1 d−1), N H 4 + si the soil ammonium content (kgN ha−1 d−1), D R B is the decomposition rate of residue to microbial biomass (kgC m3) and R C N B is the C/N ratio of microbial biomass.
  • S N O 3 calculation:
    S N O 3 = K A · f M · N H 4 + 2
    where K A is kinetic factor of NO3 production via nitrification (unitless), described as:
    K A = 0.0105 · T s o i l + 0.00095 · T s o i l 2 ,   0 T s o i l 10 K A = 0.32 · T s o i l 0.12 ,   10 T s o i l 35 K A = 0.1 · T s o i l + 4.5 ,   35 T s o i l 45
    where T s o i l is the soil temperature (°C) and f M is the moisture reduction factor of residue decomposition (%), described as:
    f M = 1.111 · W F P S ,   0 W F P S 0.9 f M = 10 · ( 1 W F P S ) ,   0.9 W F P S 1
    where W F P S = 0.001 · S M 0.28 · D a D a D b (in %) and Da = 2.6 g cm−3 and Db = 1.5 g cm−3 are the actual and bulk density, respectively.
  • D R B calculation:
    D R B = f T n i t · f W n i t · S D R R · f B / C O 2 · C R
    where f T n i t is the temperature reduction factor of nitrification (unitless), described as:
    f T n i t = 0.06 · T s o i l ,   0 T s o i l 30 f T n i t = 1.8 ,   30 T s o i l 40 f T n i t = 1.8 0.04 · ( T s o i l 40 ) ,   T s o i l 40
    and the moisture reduction factor of nitrification (unitless) is described as:
    f W n i t = 0.1 · W F P S , W F P S 0.1 f W n i t = 0.02 + 1.96 · ( W F P S 0.1 ) ,   0.1 W F P S 0.6 f W n i t = 1 2.5 · ( W F P S 0.6 ) ,   0.6 W F P S 0.8 f W n i t = 0.5 0.5 · ( W F P S 0.8 ) ,   W F P S 0.8
  • Denitrification:
    Denitrification takes place if WFPS > 9%. In this case, N2O production and emission are calculated as follows:
    d ( N O 3 ) d t = C O N N O 3 S Y N N O 3 d ( N O 2 ) d t = C O N N O 3 C O N N O 2 S Y N N O 2 d ( N 2 O ) d t = C O N N O 2 C O N N 2 O S Y N N 2 O
    where C O N i is the conversion coefficient of NO3 to NO2 (1), NO2 to N2O (2) and N2O to N2 (3) and S Y N i is the synthesis of NO3 (1), NO2 (2) and N2O by denitrifiers, described as follows:
    C O N i = 1 5 · ( G i Y i + M i · i N O 3 + N O 2 + N 2 O ) · f p H ( i ) · f T d e n i t · C d e n i t S Y N i = 1 5 P d e n i t _ n e w R C N · i N O 3 + N O 2 + N 2 O
    where G i = G i , M · C S C i 1 2 + C S C · i i 1 2 + i is the relative growth rate of denitrifier i (unitless), Y i is the maximum growth yield of i (unitless), M i is the maintenance coefficient of i, f p H ( i ) is the reduction factor of C O N i due to pH (unitless), C d e n i t is the total carbon pool of denitrifiers (kgC ha−1 d−1), f T d e n i t = 2 T s o i l 45 10 is the temperature reduction factor of denitrification (unitless), P d e n i t _ n e w = G d e n i t · C d e n i t is the new-formed microbial biomass of the denitrifiers pool (kgC ha−1 d−1) and G d e n i t = G i is the denitrifiers growth rate (unitless).
    The N2O producef by this process of denitrification is then called N 2 O d e n i t .
  • N2O Emission Calculation:
    The N2O emission is then calculated as follows:
    E N 2 O = f N 2 O · ( N 2 O d e n i t + N 2 O n i t ) f N 2 O = ( 0.0006 + 0.0013 · 2 · c l a y 0.63 ) + ( 0.013 + 0.005 · 2 · c l a y 0.63 ) · ( 1 W F P S )
    where E N 2 O is the N2O emission to the atmosphere (kgN ha−1 d−1), f N 2 O is the fraction of N2O released in the atmosphere (unitless), N 2 O d e n i t is the N2O produced via denitrification and N 2 O n i t is the N2O produced via nitrification.

References

  1. Stocker, T.F.; Qin, D.; Plattner, G.-K.; Tignor, M.M.B.; Allen, S.K.; Boschung, J.; Nauels, A.; Xia, Y.; Bex, V.; Midgley, P.M. (Eds.) Climate Change 2013: The Physical Science Basis. Contribution of Working Group I to the Fifth Assessment Report of IPCC the Intergovernmental Panel on Climate Change; Cambridge University Press: Cambridge, UK, 2014. [Google Scholar] [CrossRef] [Green Version]
  2. Butterbach-Bahl, K.; Baggs, E.M.; Dannenmann, M.; Kiese, R.; Zechmeister-Boltenstern, S. Nitrous oxide emissions from soils: How well do we understand the processes and their controls? Phil. Trans. R. Soc. B 2013, 368, 20130122. [Google Scholar] [CrossRef] [PubMed]
  3. Ravishankara, A.R.; Daniel, J.S.; Portmann, R.W. Nitrous Oxide (N2O): The dominant ozone-depleting substance emitted in the 21st century. Science 2009, 326, 123–125. [Google Scholar] [CrossRef] [Green Version]
  4. Zheng, J.; Qu, Y.; Kilasara, M.M.; Mmari, W.N.; Funakawa, S. Soil-atmosphere exchange of nitrous oxide in two Tanzanian croplands: Effects of nitrogen and stover management. Agric. For. Meteorol. 2019, 275, 24–36. [Google Scholar] [CrossRef]
  5. Davidson, E.A. The contribution of manure and fertilizer nitrogen to atmospheric nitrous oxide since 1860. Nat. Geosci. 2009, 2, 659–662. [Google Scholar] [CrossRef]
  6. Robertson, G.P.; Tiedje, J.M. Nitrous oxide sources in aerobic soils: Nitrification, denitrification and other biological processes. Soil Biol. Biochem. 1987, 19, 187–193. [Google Scholar] [CrossRef]
  7. Bouwman, A.F. Direct emission of nitrous oxide from agricultural soils. Nutr. Cycl. Agroecosyst. 1996, 46, 53–70. [Google Scholar] [CrossRef]
  8. Hénault, C.; Bizouard, F.; Laville, P.; Gabrielle, B.; Nicoullaud, B.; Germon, J.C.; Cellier, P. Predicting in situ soil N2O emission using NOE algorithm and soil database. Glob. Chang. Biol. 2005, 11, 115–127. [Google Scholar] [CrossRef]
  9. Li, C.; Aber, J.; Stange, F.; Butterbach-Bahl, K.; Papen, H. A process-oriented model of N2O and NO emissions from forest soils: 1. Model development. J. Geophys. Res. 2000, 105, 4369–4384. [Google Scholar] [CrossRef]
  10. Parsons, W.F.J.; Mitre, M.E.; Keller, M.; Reiners, W.A. Nitrate limitation of N2O production and denitrification from tropical pasture and rain forest soils. Biogeochemistry 1993, 22, 179–193. [Google Scholar] [CrossRef]
  11. Kim, D.-G.; Thomas, A.D.; Pelster, D.; Rosenstock, T.S.; Sanz-Cobena, A. Greenhouse gas emissions from natural ecosystems and agricultural lands in sub-Saharan Africa: Synthesis of available data and suggestions for further research. Biogeosciences 2016, 13, 4789–4809. [Google Scholar] [CrossRef] [Green Version]
  12. Sheehy, J.; Six, J.; Alakukku, L.; Regina, K. Fluxes of nitrous oxide in tilled and no-tilled boreal arable soils. Agric. Ecosyst. Environ. 2013, 164, 190–199. [Google Scholar] [CrossRef]
  13. Hickman, J.E.; Tully, K.L.; Groffman, P.M.; Diru, W.; Palm, C.A. A potential tipping point in tropical agriculture: Avoiding rapid increases in nitrous oxide fluxes from agricultural intensification in Kenya. J. Geophys. Res. Biogeosci. 2015, 120, 938–951. [Google Scholar] [CrossRef]
  14. Ball, B.C.; Scott, A.; Parker, J.P. Field N2O, CO2 and CH4 fluxes in relation to tillage, compaction and soil quality in Scotland. Soil Tillage Res. 1999, 53, 29–39. [Google Scholar] [CrossRef]
  15. Franco-Luesma, S.; Álvaro-Fuentes, J.; Plaza-Bonilla, D.; Arrúe, J.L.; Cantero-Martínez, C.; Cavero, J. Influence of irrigation time and frequency on greenhouse gas emissions in a solid-set sprinkler-irrigated maize under Mediterranean conditions. Agric. Water Manag. 2019, 221, 303–311. [Google Scholar] [CrossRef]
  16. Thompson, R.L.; Chevallier, F.; Crotwell, A.M.; Dutton, G.; Langenfelds, R.L.; Prinn, R.G.; Weiss, R.F.; Tohjima, Y.; Nakazawa, T.; Krummel, P.B.; et al. Nitrous oxide emissions 1999 to 2009 from a global atmospheric inversion. Atmos. Chem. Phys. 2014, 14, 1801–1817. [Google Scholar] [CrossRef] [Green Version]
  17. Valentini, R.; Arneth, A.; Bombelli, A.; Castaldi, S.; Gatti, R.C.; Chevallier, F.; Ciais, P.; Grieco, E.; Hartmann, J.; Henry, M.; et al. A full greenhouse gases budget of Africa: Synthesis, uncertainties, and vulnerabilities. Biogeosciences 2014, 11, 381–407. [Google Scholar] [CrossRef] [Green Version]
  18. Butterbach-Bahl, K.; Gettel, G.; Kiese, R.; Fuchs, K.; Werner, C.; Rahimi, J.; Barthel, M.; Merbold, L. Livestock enclosures in drylands of Sub-Saharan Africa are overlooked hotspots of N2O emissions. Nat. Commun. 2020, 11. [Google Scholar] [CrossRef]
  19. Wachiye, S.; Merbold, L.; Vesala, T.; Rinne, J.; Räsänen, M.; Leitner, S.; Pellikka, P. Soil greenhouse gas emissions under different land-use types in savanna ecosystems of Kenya. Biogeosciences 2020, 17, 2149–2167. [Google Scholar] [CrossRef] [Green Version]
  20. Scholes, M.C.; Martin, R.; Scholes, R.J.; Parsons, D.; Winstead, E. NO and N2O emissions from savanna soils following the first simulated rains of the season. Nutr. Cycl. Agroecosyst. 1997, 48, 115–122. [Google Scholar] [CrossRef]
  21. Zaady, E.; Groffman, P.M.; Standing, D.; Shachak, M. High N2O emissions in dry ecosystems. Eur. J. Soil Biol. 2013, 59, 1–7. [Google Scholar] [CrossRef]
  22. Jarvis, P.; Rey, A.; Petsikos, C.; Wingate, L.; Rayment, M.; Pereira, J.; Banza, J.; David, J.; Miglietta, F.; Borghetti, M.; et al. Drying and wetting of Mediterranean soils stimulates decomposition and carbon dioxide emission: The “Birch effect”. Tree Physiol. 2007, 27, 929–940. [Google Scholar] [CrossRef] [PubMed] [Green Version]
  23. Borken, W.; Matzner, E. Reappraisal of drying and wetting effects on C and N mineralization and fluxes in soils. Glob. Change Biol. 2009, 15, 808–824. [Google Scholar] [CrossRef]
  24. Altieri, M.A.; Koohafkan, P. Enduring Farms: Climate Change, Smallholders and Traditional Farming Communities; Third World Network (TWN): Penang, Malaysia, 2008; ISBN 978-983-2729-55-6. [Google Scholar]
  25. Pelster, D.; Rufino, M.; Rosenstock, T.; Mango, J.; Saiz, G.; Diaz-Pines, E.; Baldi, G.; Butterbach-Bahl, K. Smallholder farms in eastern African tropical highlands have low soil greenhouse gas fluxes. Biogeosciences 2017, 14, 187–202. [Google Scholar] [CrossRef] [Green Version]
  26. Brümmer, C.; Brüggemann, N.; Butterbach-Bahl, K.; Falk, U.; Szarzynski, J.; Vielhauer, K.; Wassmann, R.; Papen, H. Soil-atmosphere exchange of N2O and NO in near-natural savanna and agricultural land in Burkina Faso (W. Africa). Ecosystems 2008, 11, 582–600. [Google Scholar] [CrossRef]
  27. Hickman, J.E.; Havlikova, M.; Kroeze, C.; Palm, C.A. Current and future nitrous oxide emissions from African agriculture. Curr. Opin. Environ. Sustain. 2011, 3, 370–378. [Google Scholar] [CrossRef]
  28. Bouwman, A.F.; Beusen, A.H.W.; Griffioen, J.; Groenigen, J.W.V.; Hefting, M.M.; Oenema, O.; Puijenbroek, P.J.T.M.V.; Seitzinger, S.; Slomp, C.P.; Stehfest, E. Global trends and uncertainties in terrestrial denitrification and N2O emissions. Philos. Trans. R. Soc. B Biol. Sci. 2013, 368, 20130112. [Google Scholar] [CrossRef] [Green Version]
  29. Kim, D.-G.; Kirschbaum, M.U.F. The effect of land-use change on the net exchange rates of greenhouse gases: A compilation of estimates. Agric. Ecosyst. Environ. 2015, 208, 114–126. [Google Scholar] [CrossRef]
  30. Leitner, S.; Pelster, D.E.; Werner, C.; Merbold, L.; Baggs, E.M.; Mapanda, F.; Butterbach-Bahl, K. Closing maize yield gaps in sub-Saharan Africa will boost soil N2O emissions. Curr. Opin. Environ. Sustain. 2020, 47, 95–105. [Google Scholar] [CrossRef]
  31. Gütlein, A.; Gerschlauer, F.; Kikoti, I.; Kiese, R. Impacts of climate and land use on N2O and CH4 fluxes from tropical ecosystems in the Mt. Kilimanjaro region, Tanzania. Glob. Chang. Biol. 2018, 24, 1239–1255. [Google Scholar] [CrossRef]
  32. Shukla, P.R.; Skea, J.; Buendia, E.C.; Masson-Delmotte, V.; Pörtner, H.-O.; Roberts, D.C.; Zhai, P.; Slade, R.; Connors, S.; van Diemen, R.; et al. (Eds.) Climate Change and Land: An IPCC Special Report on Climate Change, Desertification, Land Degradation, Sustainable Land Management, Food Security, and Greenhouse Gas Fluxes in Terrestrial Ecosystems; Intergovernmental Panel on Climate Change (IPCC): Geneva, Switzerland, 2019; in press. [Google Scholar]
  33. Delon, C.; Galy-Lacaux, C.; Serça, D.; Personne, E.; Mougin, E.; Adon, M.; Dantec, V.L.; Loubet, B.; Fensholt, R.; Tagesson, T. Modelling land—Atmosphere daily exchanges of NO, NH3, and CO2 in a semi-arid grazed ecosystem in Senegal. Biogeosciences 2019, 16, 2049–2077. [Google Scholar] [CrossRef] [Green Version]
  34. Mougin, E.; Seena, D.L.; Rambal, S.; Gaston, A.; Hiernaux, P. A regional Sahelian grassland model to be coupled with multispectral satellite data. I: Model description and validation. Remote Sens. Environ. 1995, 52, 181–193. [Google Scholar] [CrossRef]
  35. Liu, Y. Modeling the Emissions of Nitrous Oxide (N2O) and Methane (CH4) from the Terrestrial Biosphere to the Atmosphere. Ph.D. Thesis, Massachusetts Institute of Technology, Cambridge, MA, USA, August 1996. [Google Scholar]
  36. Tagesson, T.; Fensholt, R.; Cropley, F.; Guiro, I.; Horion, S.; Ehammer, A.; Ardö, J. Dynamics in carbon exchange fluxes for a grazed semi-arid savanna ecosystem in West Africa. Agric. Ecosyst. Environ. 2015, 205, 15–24. [Google Scholar] [CrossRef] [Green Version]
  37. Assouma, M.H.; Serça, D.; Guérin, F.; Blanfort, V.; Lecomte, P.; Touré, I.; Ickowicz, A.; Manlay, R.J.; Bernoux, M.; Vayssières, J. Livestock induces strong spatial heterogeneity of soil CO2, N2O and CH4 emissions within a semi-arid sylvo-pastoral landscape in West Africa. J. Arid Land 2017, 9, 210–221. [Google Scholar] [CrossRef]
  38. Tagesson, T.; Fensholt, R.; Guiro, I.; Rasmussen, M.O.; Huber, S.; Mbow, C.; Garcia, M.; Horion, S.; Sandholt, I.; Holm-Rasmussen, B.; et al. Ecosystem properties of semiarid savanna grassland in West Africa and its relationship with environmental variability. Glob. Change Biol. 2015, 21, 250–264. [Google Scholar] [CrossRef] [PubMed] [Green Version]
  39. Delon, C.; Galy-Lacaux, C.; Serça, D.; Loubet, B.; Camara, N.; Gardrat, E.; Saneh, I.; Fensholt, R.; Tagesson, T.; Le Dantec, V.; et al. Soil and vegetation-atmosphere exchange of NO, NH3, and N2O from field measurements in a semi arid grazed ecosystem in Senegal. Atmos. Environ. 2017, 156, 36–51. [Google Scholar] [CrossRef] [Green Version]
  40. Oseko, E.; Dienya, T. Fertilizer Consumption and Fertilizer Use by Crop (FUBC) in Kenya; Africafertilizer.Org: Blantyre, Malawi, 2015; 47p. [Google Scholar]
  41. Zhu, Y.; Merbold, L.; Leitner, S.; Xia, L.; Pelster, D.E.; Diaz-Pines, E.; Abwanda, S.; Mutuo, P.M.; Butterbach-Bahl, K. Influence of soil properties on N2O and CO2 emissions from excreta deposited on tropical pastures in Kenya. Soil Biol. Biochem. 2020, 140, 107636. [Google Scholar] [CrossRef]
  42. Delon, C.; Mougin, E.; Serça, D.; Grippa, M.; Hiernaux, P.; Diawara, M.; Galy-Lacaux, C.; Kergoat, L. Modelling the effect of soil moisture and organic matter degradation on biogenic NO emissions from soils in Sahel rangeland (Mali). Biogeosciences 2015, 12, 3253–3272. [Google Scholar] [CrossRef] [Green Version]
  43. Pierre, C.; Kergoat, L.; Bergametti, G.; Mougin, É.; Baron, C.; Toure, A.A.; Rajot, J.-L.; Hiernaux, P.; Marticorena, B.; Delon, C. Modeling vegetation and wind erosion from a millet field and from a rangeland: Two Sahelian case studies. Aeolian Res. 2015, 19, 97–111. [Google Scholar] [CrossRef] [Green Version]
  44. Moorhead, D.L.; Reynolds, J.F. A general model of litter decomposition in the northern Chihuahuan Desert. Ecol. Model. 1991, 56, 197–219. [Google Scholar] [CrossRef]
  45. Parton, W.J. Predicting soil temperatures in a shortgrass steppe. Soil Sci. 1984, 138, 93–101. [Google Scholar] [CrossRef]
  46. Manabe, S. Climate and the ocean circulation. The atmospheric circulation and the hydrology of the earth’s surface. Mon. Wea. Rev. 1969, 97, 739–774. [Google Scholar] [CrossRef]
  47. Mazzarino, M.J.; Szott, L.; Jimenez, M. Dynamics of soil total C and N, microbial biomass, and water-soluble C in tropical agroecosystems. Soil Biology and Biochemistry 1993, 25, 205–214. [Google Scholar] [CrossRef]
  48. Sharma, P.; Rai, S.C.; Sharma, R.; Sharma, E. Effects of land-use change on soil microbial C, N and P in a Himalayan watershed. Pedobiologia 2004, 48, 83–92. [Google Scholar] [CrossRef]
  49. Rosenstock, T.S.; Mpanda, M.; Pelster, D.E.; Butterbach-Bahl, K.; Rufino, M.C.; Thiong’o, M.; Mutuo, P.; Abwanda, S.; Rioux, J.; Kimaro, A.A.; et al. Greenhouse gas fluxes from agricultural soils of Kenya and Tanzania. J. Geophys. Res. Biogeosciences 2016, 121, 1568–1580. [Google Scholar] [CrossRef] [Green Version]
  50. Rees, R.M.; Wuta, M.; Furley, P.A.; Li, C. Nitrous oxide fluxes from savanna (miombo) woodlands in Zimbabwe. J. Biogeogr. 2006, 33, 424–437. [Google Scholar] [CrossRef]
  51. Meixner, F.X.; Yang, W.X. Biogenic emissions of nitric oxide and nitrous oxide from arid and semi-arid land. In Dryland Ecohydrology; D’Odorico, P., Porporato, A., Eds.; Springer: Dordrecht, The Netherlands, 2006; pp. 233–255. ISBN 978-1-4020-4260-7. [Google Scholar]
  52. Chen, Z.; Ding, W.; Xu, Y.; Müller, C.; Yu, H.; Fan, J. Increased N2O emissions during soil drying after waterlogging and spring thaw in a record wet year. Soil Biol. Biochem. 2016, 101, 152–164. [Google Scholar] [CrossRef]
  53. He, W.; Yang, J.Y.; Drury, C.F.; Smith, W.N.; Grant, B.B.; He, P.; Qian, B.; Zhou, W.; Hoogenboom, G. Estimating the impacts of climate change on crop yields and N2O emissions for conventional and no-tillage in Southwestern Ontario, Canada. Agric. Syst. 2018, 159, 187–198. [Google Scholar] [CrossRef]
  54. Aronson, E.L.; Goulden, M.L.; Allison, S.D. Greenhouse gas fluxes under drought and nitrogen addition in a Southern California grassland. Soil Biol. Biochem. 2019, 131, 19–27. [Google Scholar] [CrossRef] [Green Version]
  55. Huang, H.; Wang, J.; Hui, D.; Miller, D.R.; Bhattarai, S.; Dennis, S.; Smart, D.; Sammis, T.; Reddy, K.C. Nitrous oxide emissions from a commercial cornfield (Zea mays) measured using the eddy covariance technique. Atmos. Chem. Phys. 2014, 14, 12839–12854. [Google Scholar] [CrossRef] [Green Version]
  56. Werner, C.; Kiese, R.; Butterbach-Bahl, K. Soil-atmosphere exchange of N2O, CH4, and CO2 and controlling environmental factors for tropical rain forest sites in western Kenya. J. Geophys. Res. Atmos. 2007, 112. [Google Scholar] [CrossRef] [Green Version]
  57. Pihlatie, M.; Rinne, J.; Ambus, P.; Pilegaard, K.; Dorsey, J.R.; Rannik, U.; Markkanen, T.; Launiainen, S.; Vesala, T. Nitrous oxide emissions from a beech forest floor measured by eddy covariance and soil enclosure techniques. Biogeosciences Discuss. 2005, 2, 377–387. [Google Scholar] [CrossRef] [Green Version]
  58. Qin, S.; Wang, Y.; Hu, C.; Oenema, O.; Li, X.; Zhang, Y.; Dong, W. Yield-scaled N2O emissions in a winter wheat–summer corn double-cropping system. Atmos. Environ. 2012, 55, 240–244. [Google Scholar] [CrossRef]
  59. Bai, E.; Li, S.; Xu, W.; Li, W.; Dai, W.; Jiang, P. A meta-analysis of experimental warming effects on terrestrial nitrogen pools and dynamics. New Phytol. 2013, 199, 441–451. [Google Scholar] [CrossRef] [PubMed]
  60. Zhang, Y.; Wang, J.; Dai, S.; Sun, Y.; Chen, J.; Cai, Z.; Zhang, J.; Müller, C. Temperature effects on N2O production pathways in temperate forest soils. Sci. Total Environ. 2019, 691, 1127–1136. [Google Scholar] [CrossRef]
  61. Bouwman, A.F.; Boumans, L.J.M.; Batjes, N.H. Modeling global annual N2O and NO emissions from fertilized fields. Glob. Biogeochem. Cycles 2002, 16, 1080. [Google Scholar] [CrossRef]
  62. Rochette, P.; Liang, C.; Pelster, D.; Bergeron, O.; Lemke, R.; Kroebel, R.; MacDonald, D.; Yan, W.; Flemming, C. Soil nitrous oxide emissions from agricultural soils in Canada: Exploring relationships with soil, crop and climatic variables. Agric. Ecosyst. Environ. 2018, 254, 69–81. [Google Scholar] [CrossRef]
  63. Eggleston, S.; Buendia, L.; Miwa, K.; Ngara, T.; Tanabe, K. (Eds.) IPCC Guidelines for National Greenhouse Gas Inventories; Institute for Global Environmental Strategies: Hayama, Japan, 2006; Volume 5. [Google Scholar]
  64. Bigaignon, L.; Fieuzal, R.; Delon, C.; Tallec, T. Combination of two methodologies, artificial neural network and linear interpolation, to gap-fill daily nitrous oxide flux measurements. Agric. For. Meteorol. 2020, 291, 108037. [Google Scholar] [CrossRef]
  65. Davidson, E.A.; Matson, P.A.; Vitousek, P.M.; Riley, R.; Dunkin, K.; Garcia-Mendez, G.; Maass, J.M. Processes regulating soil emissions of no and N2O in a seasonally dry tropical forest. Ecology 1993, 74, 130–139. [Google Scholar] [CrossRef]
  66. Meng, H.; Wu, R.; Wang, Y.-F.; Gu, J.-D. A comparison of denitrifying bacterial community structures and abundance in acidic soils between natural forest and re-vegetated forest of Nanling Nature Reserve in southern China. J. Environ. Manag. 2017, 198, 41–49. [Google Scholar] [CrossRef]
  67. Li, H.; Zhang, Y.; Wang, T.; Feng, S.; Ren, Q.; Cui, Z.; Cao, C. Responses of soil denitrifying bacterial communities carrying nirS, nirK, and nosZ genes to revegetation of moving sand dunes. Ecol. Indic. 2019, 107, 105541. [Google Scholar] [CrossRef]
  68. Brümmer, C.; Papen, H.; Wassmann, R.; Brüggemann, N. Termite mounds as hot spots of nitrous oxide emissions in South-Sudanian savanna of Burkina Faso (West Africa). Geophys. Res. Lett. 2009, 36. [Google Scholar] [CrossRef]
  69. Crippa, M.; Oreggioni, G.; Guizzardi, D.; Muntean, M.; Schaaf, E.; Lo Vullo, E.; Solazzo, E.; Monforti-Ferrario, F.; Olivier, J.G.J.; Vignati, E.; et al. Fossil CO2 and GHG Emissions of all World Countries: 2019 Report; Publication Office of the European Union: Luxembourg, 2019; ISBN 978-92-76-11100-9. [Google Scholar]
Figure 1. Plots location in Dahra (Senegal) and around and in the Mbita region (Kenya). The borders, define with dark and blue lines, refer to African countries and Kenyan districts’ boundaries, respectively.
Sustainability 12 08875 g001
Figure 2. Rain (black lines, in mm) and field campaign periods (grey strip) in the Mbita region in 2018.
Sustainability 12 08875 g002
Figure 3. Average daily N2O emissions (bars) and soil water content (SWC) (crosses) in the Mbita region during the January (grey) and November (dark) campaigns. Error bars represent the standard deviations of the measurement averages.
Sustainability 12 08875 g003
Figure 4. N2O emissions (dot) and SWC at 5 cm (line) measured in Dahra during the three campaigns. Error bars represent the standard deviations of the measurements and may not appear in the plot if the value is too low.
Sustainability 12 08875 g004
Figure 5. N2O emissions vs. soil temperature 5 cm depth in Dahra (2013 and 2017 campaigns).
Sustainability 12 08875 g005
Figure 6. SWC measured at 5 cm depth (black) and simulated in the 0–2 cm layer (grey) (a), measured at 10 cm (black) and simulated in the 2–30 cm layer (grey) (b) and scatter plot of SWC measured and simulated in Dahra at 5 and 10 cm depth (c and d, respectively) with the linear regression (dotted line).
Sustainability 12 08875 g006aSustainability 12 08875 g006b
Figure 7. Observed soil NO3 content vs. NO3 content simulated by STEP-GENDEC-N2O in Dahra between 2012 and 2017 with the linear regression (dotted line).
Sustainability 12 08875 g007
Figure 8. Scatter plot (a) and time series (b) of observed N2O emissions (black crosses) and those simulated with STEP-GENDEC-N2O (grey dot) and daily rain (histogram) from 2012 to 2017 at the Dahra site (linear regression in dotted line in upper left). Upper panels focus on the July and November 2013 (c) and September 2017 (d) field campaigns.
Sustainability 12 08875 g008
Table 1. Main characteristics of the Dahra site and the Mbita region. Values of N, C, sand, clay contents and pH are averaged values with standard deviation in parenthesis. (a) In International Centre of Insect Physiology and Ecology (ICIPE), mean annual rain is for the period 1986–2018, mean annual temperature is provided for the period 1986–2013 (Bakayoko et al., 2020) and the soil characteristics of the five sites were averaged. (b) In Fort Ternan, Kaptumo and Kisumu, mean annual rain and temperature is provided for the period 1982–2012 (climate-data.org). (c) In Dahra, mean annual rain and temperature is given for the period 1951–2013 (Delon et al., 2019). KEN and SEN mean Kenya and Senegal respectively.
Site NameLocationMean Annual T
(°C)
Mean Annual Rain
(mm)
Total N
(g kgsoil−1)
Total C
(g kgsoil−1)
pHSand Content (%)Clay Content (%)
ICIPE (a)
(KEN)
0°25′46″ S
34°12′27″ E
2411001.4
(±0.4)
13.6
(±2.9)
7.8
(±0.4)
46
(±8)
38
(±6)
Fort
Ternan (b)
(KEN)
0°12′19″ S
35°20′43″ E
2114002.1
(±0.2)
27.6
(± 2.4)
7.34
(±0.1)
41
(±2)
30
(±2)
Kaptumo (b)
(KEN)
0°5′20″ N
35°5′4″ E
2013203.4
(±0.7)
40.7
(±11)
5.5
(±0.2)
44
(±9)
34
(±5)
Kisumu (b)
(KEN)
0°7′27″ S
34°46′23″ E
2313212
(±0.1)
18.6
(±0.6)
6.3
(±0.1)
20
(±1)
42
(±3)
Dahra (c)
(SEN)
15°24′10″ N
15°25′56″ W
294160.4
(±0.1)
4.3
(±1.2)
6.6
(±0.4)
88
(±2)
6
(±1)
Table 2. Annual N2O budget, rain, mean (NO3) and contribution of N2O emission (as simulated by STEP-GENDEC-N2O) during the rainy season to the annual budget from 2012 to 2017 at the Dahra site.
YearAnnual N2O Budget
(kgN ha−1)
Annual Rain (mm)Mean [NO3] (mgN kgsoil−1)% of N2O Emission during the Rainy Season
20120.25150.284
20130.23560.395
20140.33340.996
20150.42711.197
20160.33680.495
20170.54120.481
Mean0.3 ± 0.043760.691
Publisher’s Note: MDPI stays neutral with regard to jurisdictional claims in published maps and institutional affiliations.

