Article

Exploring Fruit and Vegetable Waste in Homeless Shelters that Receive Surplus Donation from a Wholesale Market in Chile

by
Carolina Fredes
,
Francisco García
,
María Ignacia Pérez
and
Rodrigo Fernández-Verdejo
*
Departamento de Ciencias de la Salud, Carrera de Nutrición y Dietética, Facultad de Medicina, Pontificia Universidad Católica de Chile, Santiago 7820436, Chile
*
Author to whom correspondence should be addressed.
Sustainability 2020, 12(21), 8835; https://doi.org/10.3390/su12218835
Submission received: 16 September 2020 / Revised: 21 October 2020 / Accepted: 22 October 2020 / Published: 24 October 2020
(This article belongs to the Section Sustainable Management)

Abstract

:
Redistribution of food surplus helps to prevent waste production and feed hungry people. But this has not been tested in the context of a wholesale market that redistributes fruit and vegetable surplus to homeless shelters. We aimed to compare the amount of fruit and vegetable waste between shelters that received or did not receive a surplus donation in Chile. We also explored possible causes that explained the waste. Five homeless shelters that received donations (HS+DON) and five that did not (HS) were included. For three days, fruit and vegetable waste was disposed into containers for direct quantification. The amount of waste was compared between groups using the Mann–Whitney U test, both in winter and spring. A questionnaire was applied to identify causes of waste. For vegetables, we found no difference in the median (25th percentile–75th percentile) waste of HS+DON vs. HS (winter: 152 (83–262) vs. 104 (63–163) g per person/day, p-value = 0.22; spring: 114 (61–229) vs. 63 (50–132) g per person/day, p-value = 0.41). HS had no fruit waste, thus, fruit waste was higher in HS+DON in both seasons (winter: 74 (16–134); spring: 13 (6–40) g per person/day). The main reasons explaining waste were excessive donation, looking badly, and smelling moldy. In conclusion, redistribution of fruit and vegetable surplus helped to reduce waste at the wholesale market and to feed homeless shelters’ beneficiaries with nutritious food. But efforts are still required to avoid excessive donation of surplus soon-to-be spoiled. We propose a tailored donation plan to reduce waste to the unavoidable one.

1. Introduction

Globally, about 1.3 billion-tons of food for human consumption are lost or wasted each year [1]. These data have raised awareness of the issue that food loss and waste (FLW) represents [2]. FLW entails a misuse of resources—e.g., water, land, energy, fertilizer—that results in the emission of methane and CO2 to the environment due to the natural decomposition of food [3]. Paradoxically, despite the fact that high amounts of food suitable for human consumption are lost or wasted, more than 820 million people worldwide are undernourished [4]. This food insecurity often results from a problem of food access rather than food supply [5]. Therefore, FLW represents an ethical issue worth studying to better understand its origin and reasons, as well as the responsible execution of strategies for its prevention [6,7].
Food is lost or wasted at any level of the food supply chain, from primary agricultural production to household consumption [1,8,9]. Moreover, FLW occurs in all food categories [1]. Strategies to manage FLW should therefore involve public and private actors throughout the supply chain to diminish the environmental, economic, and social impacts [6,10]. Indeed, several countries have adopted public policies to manage FLW [6,11]. But the development of green business models faces the challenge of delivering and capturing values within the triple bottom-line (i.e., environmental, economic, and social results) to reach economically sustainable goals [12,13]. In this context, social enterprises should solve contradictory pressures associated with sustainable practices; for example, reduction of CO2 emission, efficiency in resource use, and mitigation of food waste [14].
The development of waste hierarchies that provide environment-friendly actions has been proposed worldwide as a strategy to manage waste—from the most preferred to the least preferred actions [5]. In Europe, waste hierarchies have been applied to food waste, recommending “prevention” followed by “donation” as the most preferred actions [15]. In the USA, a waste hierarchy specific to food exists; this Food Recovery Hierarchy recommends “source reduction” followed by “feed hungry people” as the most preferred actions [16]. In this perspective towards a circular economy, it is important to ensure that any new model of management for source reduction or feeding hungry people is sustainable [11]. Therefore, food recovery must not only involve environment-friendly actions, but it must also consider social and economic issues. Thus, Teigiserova et al. [11] proposes that food surplus should only consider the food fit for human consumption, because people are inclined to eat leftovers but not “waste.” Therefore, an effective management of food surplus is essential for food recovery initiatives [5,6,11].
Herein, we focused on a donation model based on redistribution of food surplus by a wholesale market in Santiago, Chile. To the best of our knowledge, there is no data on the food wasted by homeless shelters that receive donations of fruit and vegetable surplus. We thus explored fruit and vegetable waste in homeless shelters that receive surplus donation from a wholesale market to determine the effectiveness of this strategy for reducing waste and feeding hungry people. This is important because acquiring quantitative and qualitative data will allow us to understand whether the donation of fruit and vegetable surplus to homeless shelters is effective in reducing waste. Our research questions were:
  • Do homeless shelters that receive donation of fruit and vegetable surplus produce a similar amount of waste than homeless shelters that did not receive such a donation?
  • Are the reasons that explain waste similar between homeless shelters that receive a donation of fruit and vegetable surplus and homeless shelters that did not receive such a donation?
Therefore, the main aim of this study was to compare the amount of fruit and vegetable waste between homeless shelters that received or did not receive donations of food surplus. We also estimated the financial and nutritional loss that such a waste represents and explored possible causes that explain the waste. Our findings support that the redistribution of fruit and vegetable surplus is an effective strategy to reduce waste. Based on the better understanding of this process, we have proposed the development of donation plans tailored for each homeless shelter to help reduce waste to the unavoidable one in the future.

2. Literature Review

2.1. Fruit and Vegetable Surplus and Waste

Food surplus represents a material suitable for consumption that is redistributed to humans [17]. The surplus often results from overproduction at the primary (agricultural) production level, as well as at the distribution and consumption levels [5,18]. Redistribution of food surplus from wholesale markets to food banks, soup kitchens, and shelters thus appears as an attractive strategy to reduce food waste at the distribution level [19,20,21]. Food surplus becomes waste after leaving the food supply chain [5,10,22]. A timely redistribution of food surplus can thus help to prevent waste production and feed hungry people, two of the most preferred actions in the Food Recovery Hierarchy [16]. Then, if beneficiaries manage the donation well, this would translate into less wastage. Different types of food surplus could be considered to accomplish these purposes.
Of note, recovery and redistribution of highly perishable foods is more costly and complex than acquiring, storing, and distributing dried and staple foods [23]. It also requires specialized knowledge and infrastructure to maintain the rigorous safety standards. Redistribution of highly perishable fruits and vegetables is, however, essential for enhancing food-aid quality. Indeed, food baskets with fruits and vegetables have been associated with healthier diets among beneficiaries in Israel [24]. Therefore, the effectiveness of the redistribution of fruit and vegetable surplus is a challenge that deserves to be tested empirically.
Fleshy fruits and vegetables are highly perishable commodities due to their elevated water activity and moisture [25]. They have short shelf-lives due to their limited postharvest life [26]. But consumers are usually unaware of this, because fruits and vegetables sold at wholesale markets lack information about expiration dates. Moreover, fruits and vegetables are relatively cheap commodities, and therefore, consumers may care less about letting them spoil [22]. Fruits and vegetables also have an inedible fraction that is always discarded, which depends on the type of fruits and vegetables and on cultural preferences [5,22]. This fraction is used to calculate the unavoidable fruit or vegetable waste intensity [22]. For example, De Laurentiis et al. [22] have estimated an unavoidable fruit waste intensity of 17%, and an unavoidable vegetable waste intensity of 16% among EU households [22]. All these reasons explain why fruits and vegetables are highly lost and wasted along the food supply chain worldwide [1].
Indeed, avoidable fruit and vegetable waste has been estimated in 43% of food wastage in a typical household in the UK in 2008 [27]. And successive studies have shown that fruit and vegetable waste represent between 30% (Dutch households) and 70% (Japanese households) of the total food wastage [28,29,30,31]. Note, however, that the results among studies are not directly comparable, because of their different quantification methods.

2.2. Methodologies to Quantify Fruit and Vegetable Waste in Households

Four types of methodologies have previously been applied to quantify food waste at households. The first is based on either mass balance or extrapolation of existing waste databases. Using these methodologies, fruit and vegetable waste has been estimated in 84 g per person/day in Spain [32], and in 90–110 g per person/day in households from the EU [22]. The second type of methodologies includes self-reporting methods, questionnaires, food waste diaries, and interviews. This way, fruit and vegetable waste has been estimated in 202 g per person/day in Greek households [33], and in 63–82 g per person/day in Western Europe [29]. The third type of methodologies involves composition analysis of mixed commercial or municipal residual waste streams. Fruit and vegetable waste was estimated in 173 g per person/day using this methodology at the household level in Israel [28]. The fourth type of methodologies involves direct quantification of waste. Fruit and vegetable waste has been estimated in 21 g per person/day in Pakistan using direct quantification [34].
Of note, direct quantification of food waste is more accurate than self-reporting methods [17,35,36,37,38]. Indeed, self-reports may lead to underestimation of food waste. Previous studies showed that food waste at households in the Czech Republic and Italy was three times lower using self-reports than using direct quantification [36] or waste sorting analysis [39]. In a Swiss population, food waste was ten times lower using a self-reported survey than using extrapolations from a national waste compositional analysis report [40]. Importantly, Elimelech [41] noted that drivers affecting self-reported vs. measured food wastage were not necessarily the same. Direct weighing, counting, or assessing volume has thus been highly recommended for food waste prevention initiatives at households [17].

2.3. Reasons to Explain Fruit and Vegetable Waste in Households

In developed countries, wasteful behavior has been shown to influence the proportion of avoidable and unavoidable waste at households [22]. This behavior depends on cultural and economic factors, and also on consumption patterns [22]. Nevertheless, information about the reasons that explain fruit and vegetable waste among emerging countries is scarce [42].
Purchase planning has been related to the amount of food wasted in Czech households [43]. Lack of meal planning, excessive purchase, and incorrect purchase significantly contributed to food wasted in South African households [44]. In Italy, some consumers overbuy and others overcook, thus partially explaining food waste [45]. Furthermore, low preference for suboptimal products (e.g., unusual appearance) has been reported as a reason for wasting [1]. Evidence on perception of suboptimal food is, however, divergent. While some people reject food that does not look perfectly, other people accept such food because of environmental consciousness [46]. A similar divergence has been observed among households. A study in Uruguay showed that people recalled wasting leftovers, fruits, and vegetables, with suboptimality as the main reason [42]. In Italy, certain consumers reported “do not look or smell good” as a reason for wasting [45]. Based on the current literature, the reasons that explain waste can be ascribed to issues in the purchase, cooking, consumption, or storage of food. This reasons have been compiled in some surveys for qualitative research [34,35,47].

3. Materials and Methods

3.1. Design

Ten homeless shelters were included, all located in the Santiago Metropolitan Region, Chile. Five shelters received donations of fruit and vegetable surplus from a wholesale market (HS+DON), and five did not (HS). Table 1 shows the general characteristics of the homeless shelters. Fruit and vegetable waste produced by each homeless shelter was quantified through direct weighing [17,34] in August (winter season) and November (spring season). The financial and nutritional loss of the waste was then calculated using reference values. Finally, a structured face-to-face survey was conducted to the kitchen personnel to explore the reasons that explained the waste. The results were analyzed separately in winter and spring, because these seasons are characterized by clear differences in the availability of fruits and vegetables in Chile due to seasonality.

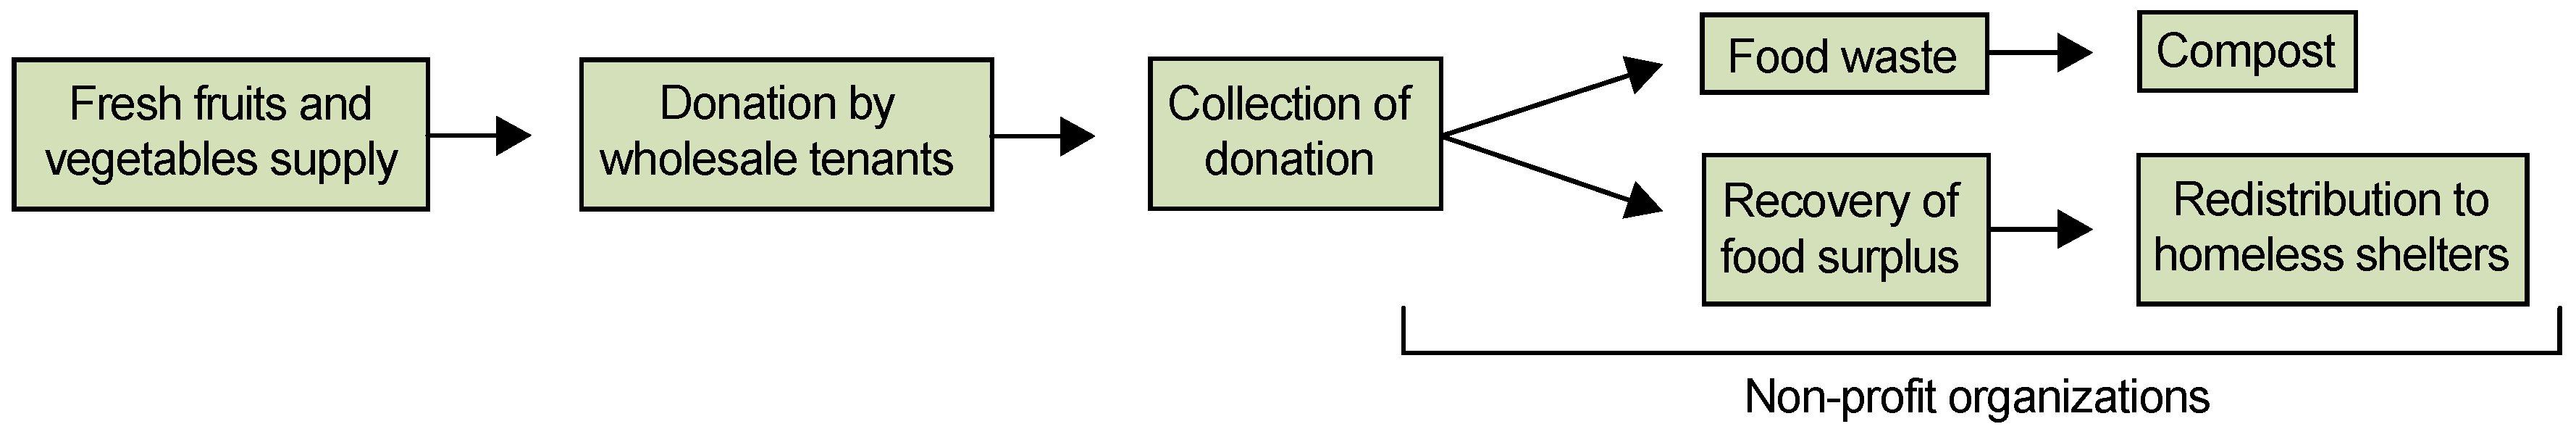
3.2. Fruit and Vegetable Surplus

Fruit and vegetable surplus was obtained from the main wholesale market in Santiago, Santiago Metropolitan Region, Chile. Since 2016, this market has applied a model of management of food surplus that includes recovery and redistribution to 40 organizations that assist vulnerable people (Figure 1).
According to the management models on food recovery—i.e., front-line, logistical, and hybrid [48], the wholesale market acts as hybrid. Wholesale market has a direct relationship with donors and beneficiaries to address the needs of waste management and people nutrition. Market tenants thus donate fresh fruits and vegetables which are collected in a specific area of the market. Then, wholesale market staff and volunteers from non-profit organizations distinguish food surplus from food waste. Note that the organoleptic quality and the maturity stage of fruit and vegetable surplus can vary due to the criteria of the wholesale market staff and the volunteers. Finally, boxes with food surplus are redistributed to HS+DON. At HS+DON, kitchen personnel and/or the Technical Director receive the donation. Residents could also help in this task. For the current study, the quantification of waste began at this moment, and thus included the fruits and vegetables wasted while cleaning the donation.

3.3. Homeless Shelters

To obtain fruits and vegetables, homeless shelters in Chile either purchase or receive donations from wholesale markets or other sources. For the present study, a non-profit organization put us in contact with nine HS+DON within the Santiago Metropolitan Region. Five HS+DON agreed to participate. The non-profit organization also put us in contact with five HS, which all agreed to participate. The Technical Director of each homeless shelter provided a record of the fruits and vegetables purchased or received through donation. Before any measurement, all procedures were explained to each Technical Director, who signed a written informed consent. The Ethical Board at the Pontificia Universidad Católica de Chile approved the protocol for the present study (ID190820004).

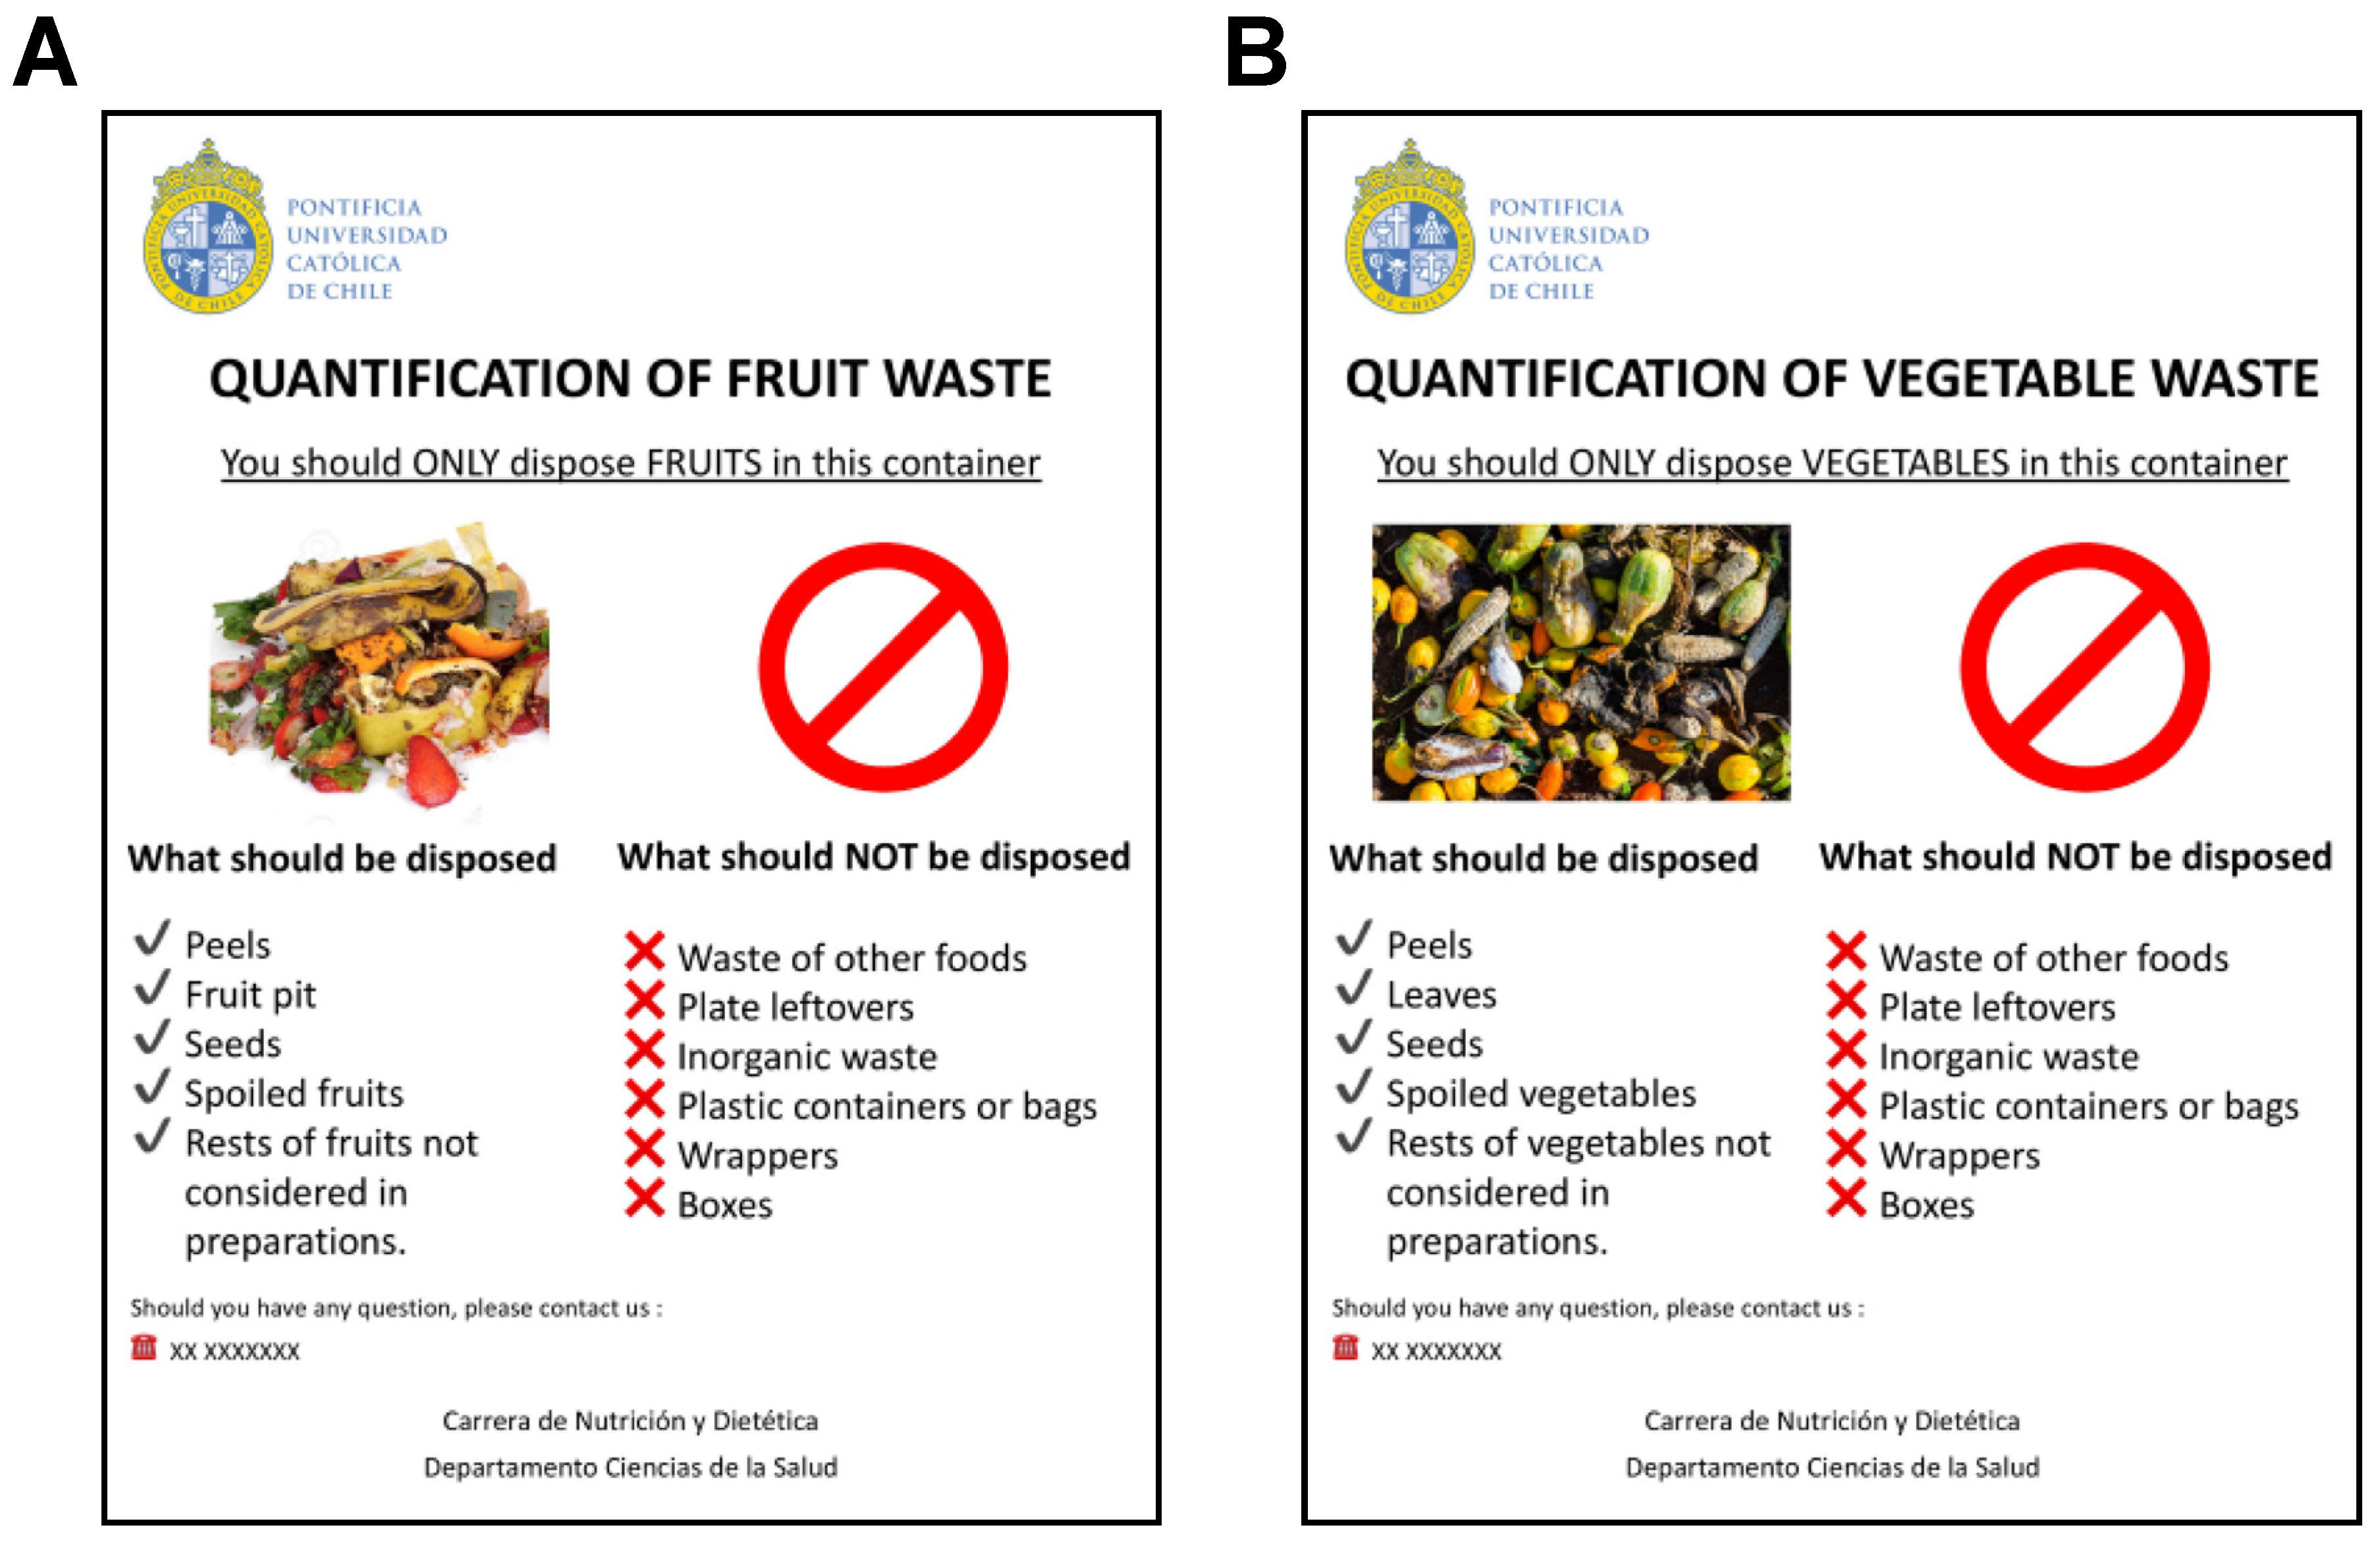
3.4. Direct Quantification of Fruit and Vegetable Waste

Waste was considered as any edible and inedible part of fruits and vegetables that resulted after cleaning, handling, and preparation of meals. A methodology of direct weighing was used to quantify fruit and vegetable waste [17,34], including the following elements described by Elimelech et al. [28]: (i) capture food waste at the point at which it enters the waste stream; (ii) collect waste samples at the doorstep; (iii) use the individual households as a sampling unit; and (iv) collect and sort waste daily. Note that, in our study, the sampling units were the homeless shelters, and we collected the waste accumulated after three consecutive days of production.
In HS+DON, the measurement began on Saturday, which corresponded to the day of reception of donation. In HS, the measurement began on Monday, which corresponded to the day of fruit and vegetable purchase. During these days, the homeless shelters are thus supplied with fruits and vegetables, and kitchen staff clean and arrange the pantry and refrigerators. Two plastic containers were delivered to each homeless shelter to collect waste; one container to dispose fruit waste and the other to dispose vegetable waste. All research procedures were explained to the kitchen personnel the day when plastic containers were delivered. Briefly, written informed consent was read, emphasizing that food waste is commonly produced at kitchens (to minimize desirability bias). Infographics about what should and should not be disposed into the containers were also explained and displayed in each kitchen (Figure 2). Note that plate leftovers were not considered in the measurement.
Containers were recovered after three days, and the accumulated waste was revised and weighed on an electronic scale on site (seca 813, SECA, Hamburg, Germany; capacity 200 kg, graduation 100 g). The amount of fruit and vegetable waste was expressed in grams per person/day. The calculation was based on the number of beneficiaries consuming meals on the specific period of measurement. Total waste was considered as the sum of fruit and vegetable waste. Since it was not possible to weight separately each fruit and vegetable type, only a qualitative analysis of the types of fruits and vegetables was performed. Then, the unavoidable fruit or vegetable waste intensity (in %) was estimated assuming the inedible fraction of each fruit and vegetable following the equation proposed by De Laurentiis et al. [22].
The measurement was first conducted in August (i.e., winter season), and then repeated in November (i.e., spring season). These seasons were selected due to the differences in fruit and vegetable seasonality, and thus their availability and price in the market in Santiago, Chile.

3.5. Financial Value and Nutritional Content of Waste

Each fruit and vegetable (purchased or donated) was qualitatively identified, and its price was obtained for each measurement period using a price database for wholesale markets products [49]. Then, we averaged the price of all the fruits identified in the winter season, obtaining 0.0008 USD/g of fruit; the average price in the spring season was 0.0006 USD/g of fruit. For those vegetables priced as USD/unit, we converted the price to USD/g (artichoke, broccoli, cabbage, carrot, cauliflower, chard, celery, cucumber, garlic, lettuce, onion, spinach, pepper, and zucchini). Thus, for the vegetables identified, the average price in winter was 0.0007 USD/g and in spring was 0.0005 USD/g. These average prices were used to compute the financial value of fruit and vegetable waste, expressed as per person/day.
Similarly, we estimated the nutritional content of each fruit and vegetable qualitatively identified using the FoodData Central database [25]. We then computed the average content of specific nutrients (i.e., energy, carbohydrate, dietary fiber, vitamin C, and potassium) per gram of fruits and per gram of vegetables. These average values were used to compute the nutritional content of fruit and vegetable waste, expressed as per person/day.

3.6. Reasons to Explain Fruit and Vegetable Waste

A structured face-to-face survey was applied to one or two members of the kitchen personnel at each homeless shelter in both measurement periods. Each survey was applied the day when the containers were recovered, after waste was revised and weighed. The survey was an adaptation of previous surveys [34,35,47] to make it specific to fruit and vegetable waste. It included nine possible reasons to explain the waste generated for each fruit and vegetable category. Nine categories of fruits or vegetables were considered, according to their availability in the Chilean market [49]. Fruits were split into citrus (grapefruit, lemon, mandarine, and orange), pomaces (apple, quince, and pear) and banana; vegetables were split into leafy (arugula, cabbage, chard, chicory, lettuce, and spinach), fruit (cucumber, pepper, tomato, and zucchini), stem (celery), inflorescence (artichoke, broccoli, and cauliflower), bulb (garlic and onion), and root-and-tuber (carrot, radish, and sweet potato). For each category, kitchen personnel responded whether or not they recognized each of the possible reasons leading to waste. Respondents could abstain if they were unsure. They could also add comments if necessary. Data were expressed as a percentage of homeless shelters that recognized each reason for each fruit and vegetable category.

3.7. Analyses

Data for continuous variables were expressed as median (25th percentile–75th percentile) throughout the manuscript. Differences in the amount of total, fruit, and vegetable waste between types of homeless shelters (HS vs. HS+DON) were tested with the Independent-Samples Mann–Whitney U test. Data for categorical variables (i.e., responses to the survey) were expressed as percentages. Associations between type of homeless shelters (HS, HS+DON) and the response to each reason in the survey (no, yes) were tested with the Pearson Chi-Square test. All analyses were conducted in winter and spring separately. ®IBM ®SPSS Statistics v.26 was used for analyses. A p-value < 0.05 was considered statistically significant.

4. Results

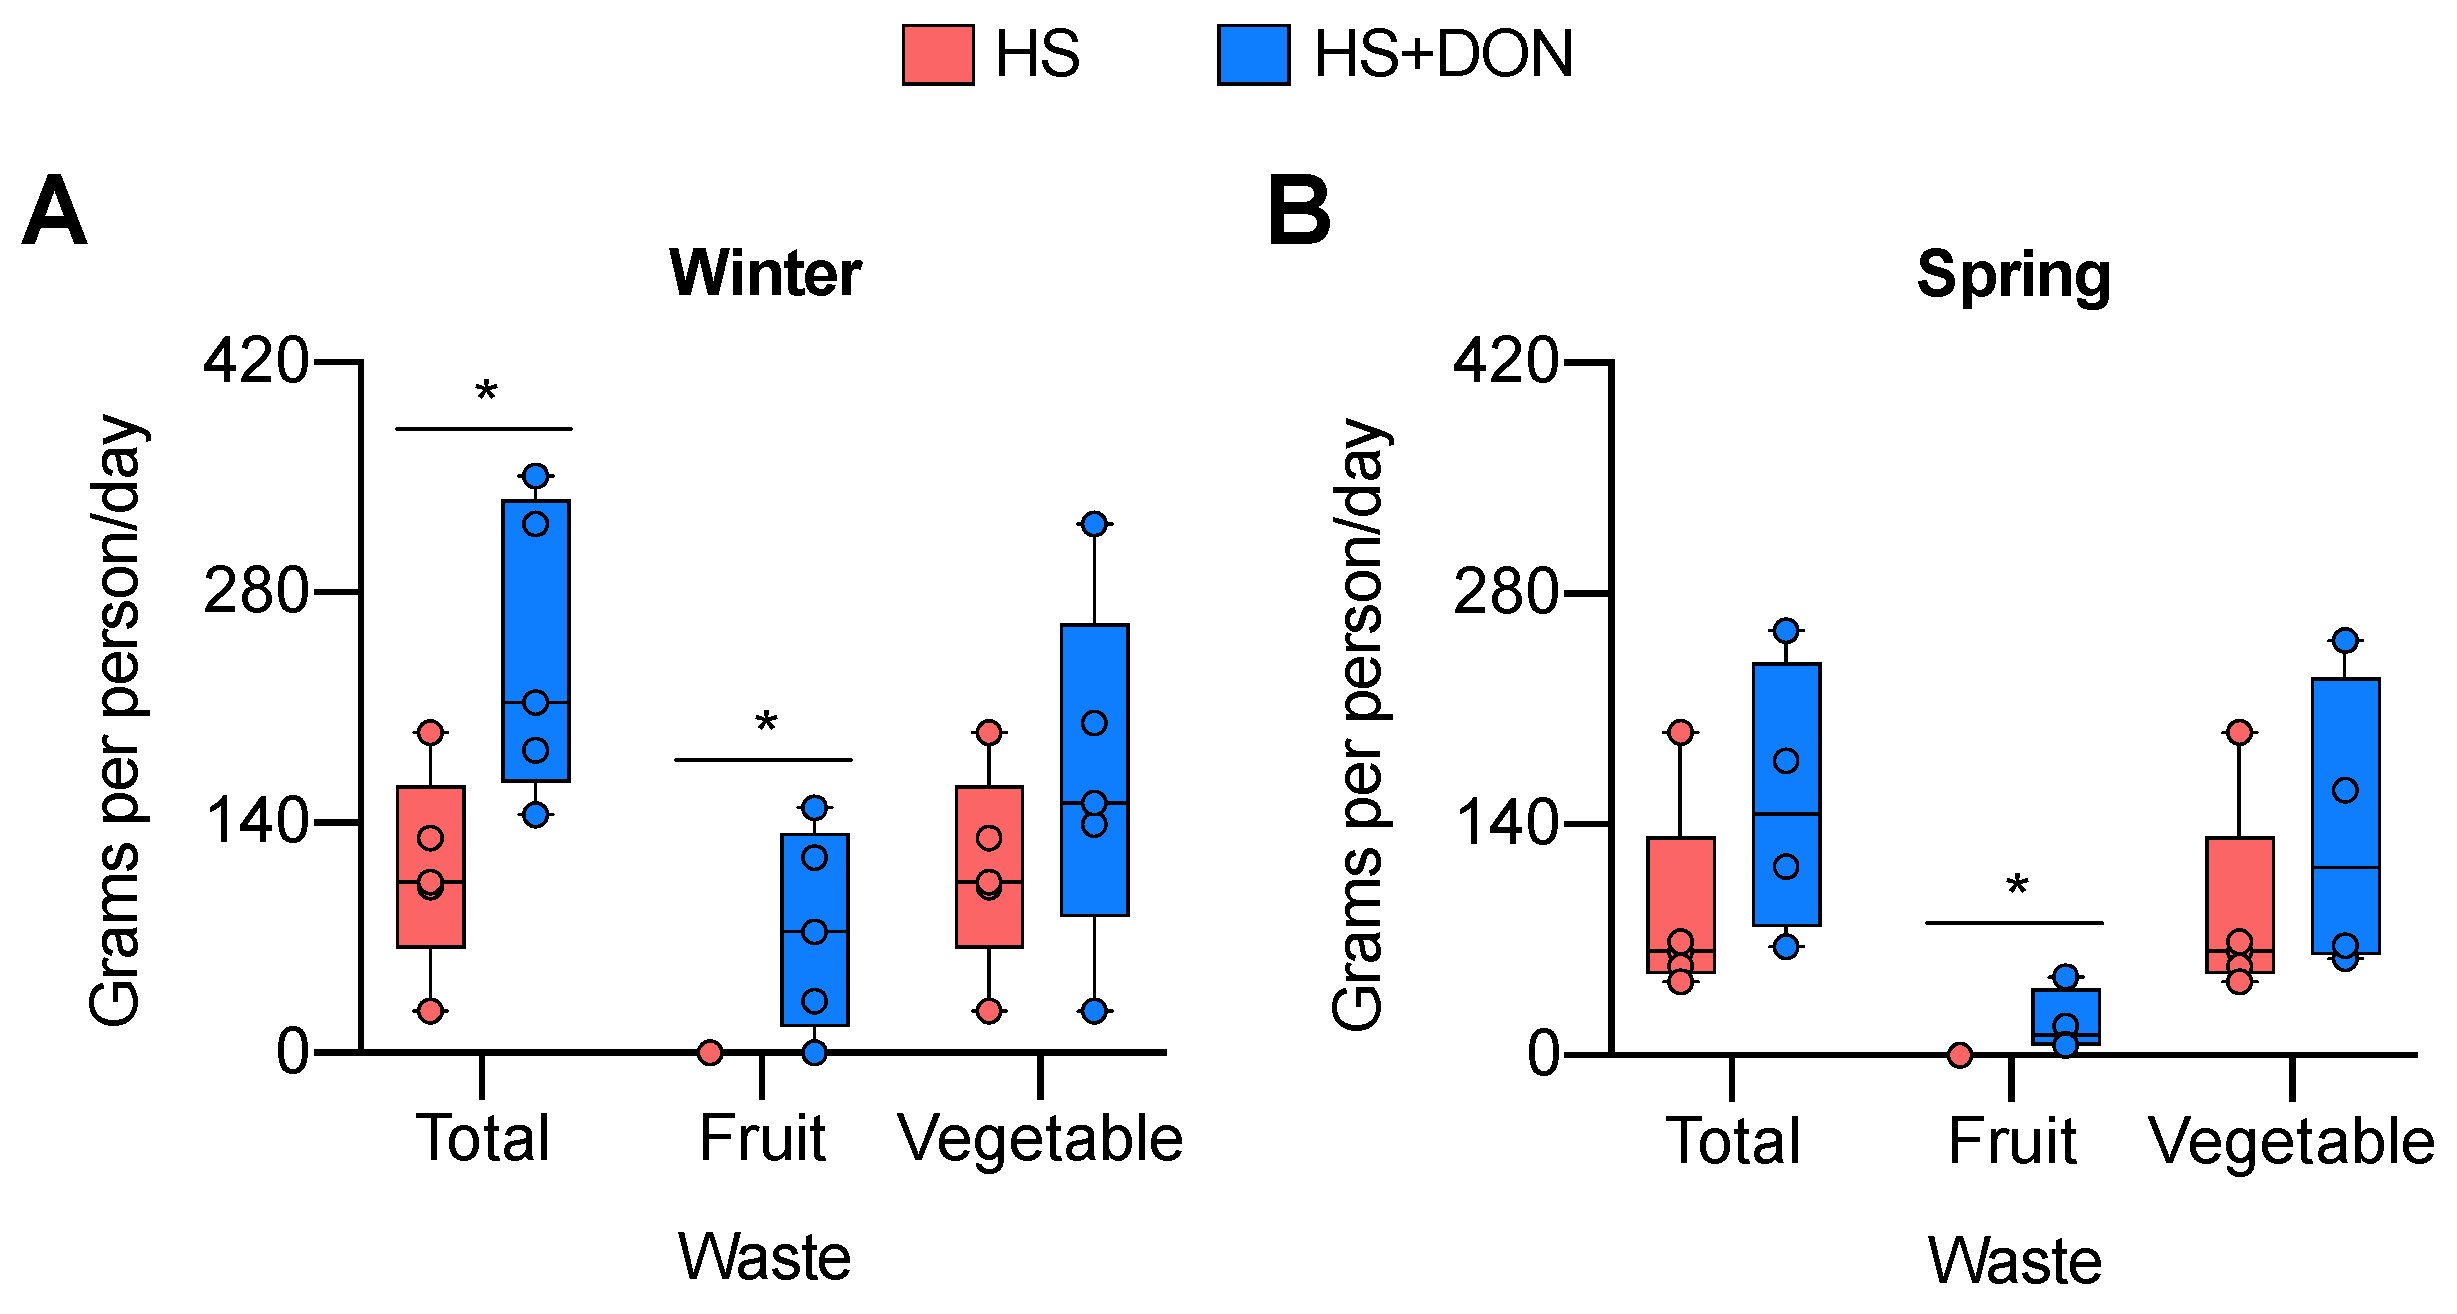
4.1. Fruit and Vegetable Waste at Homeless Shelters
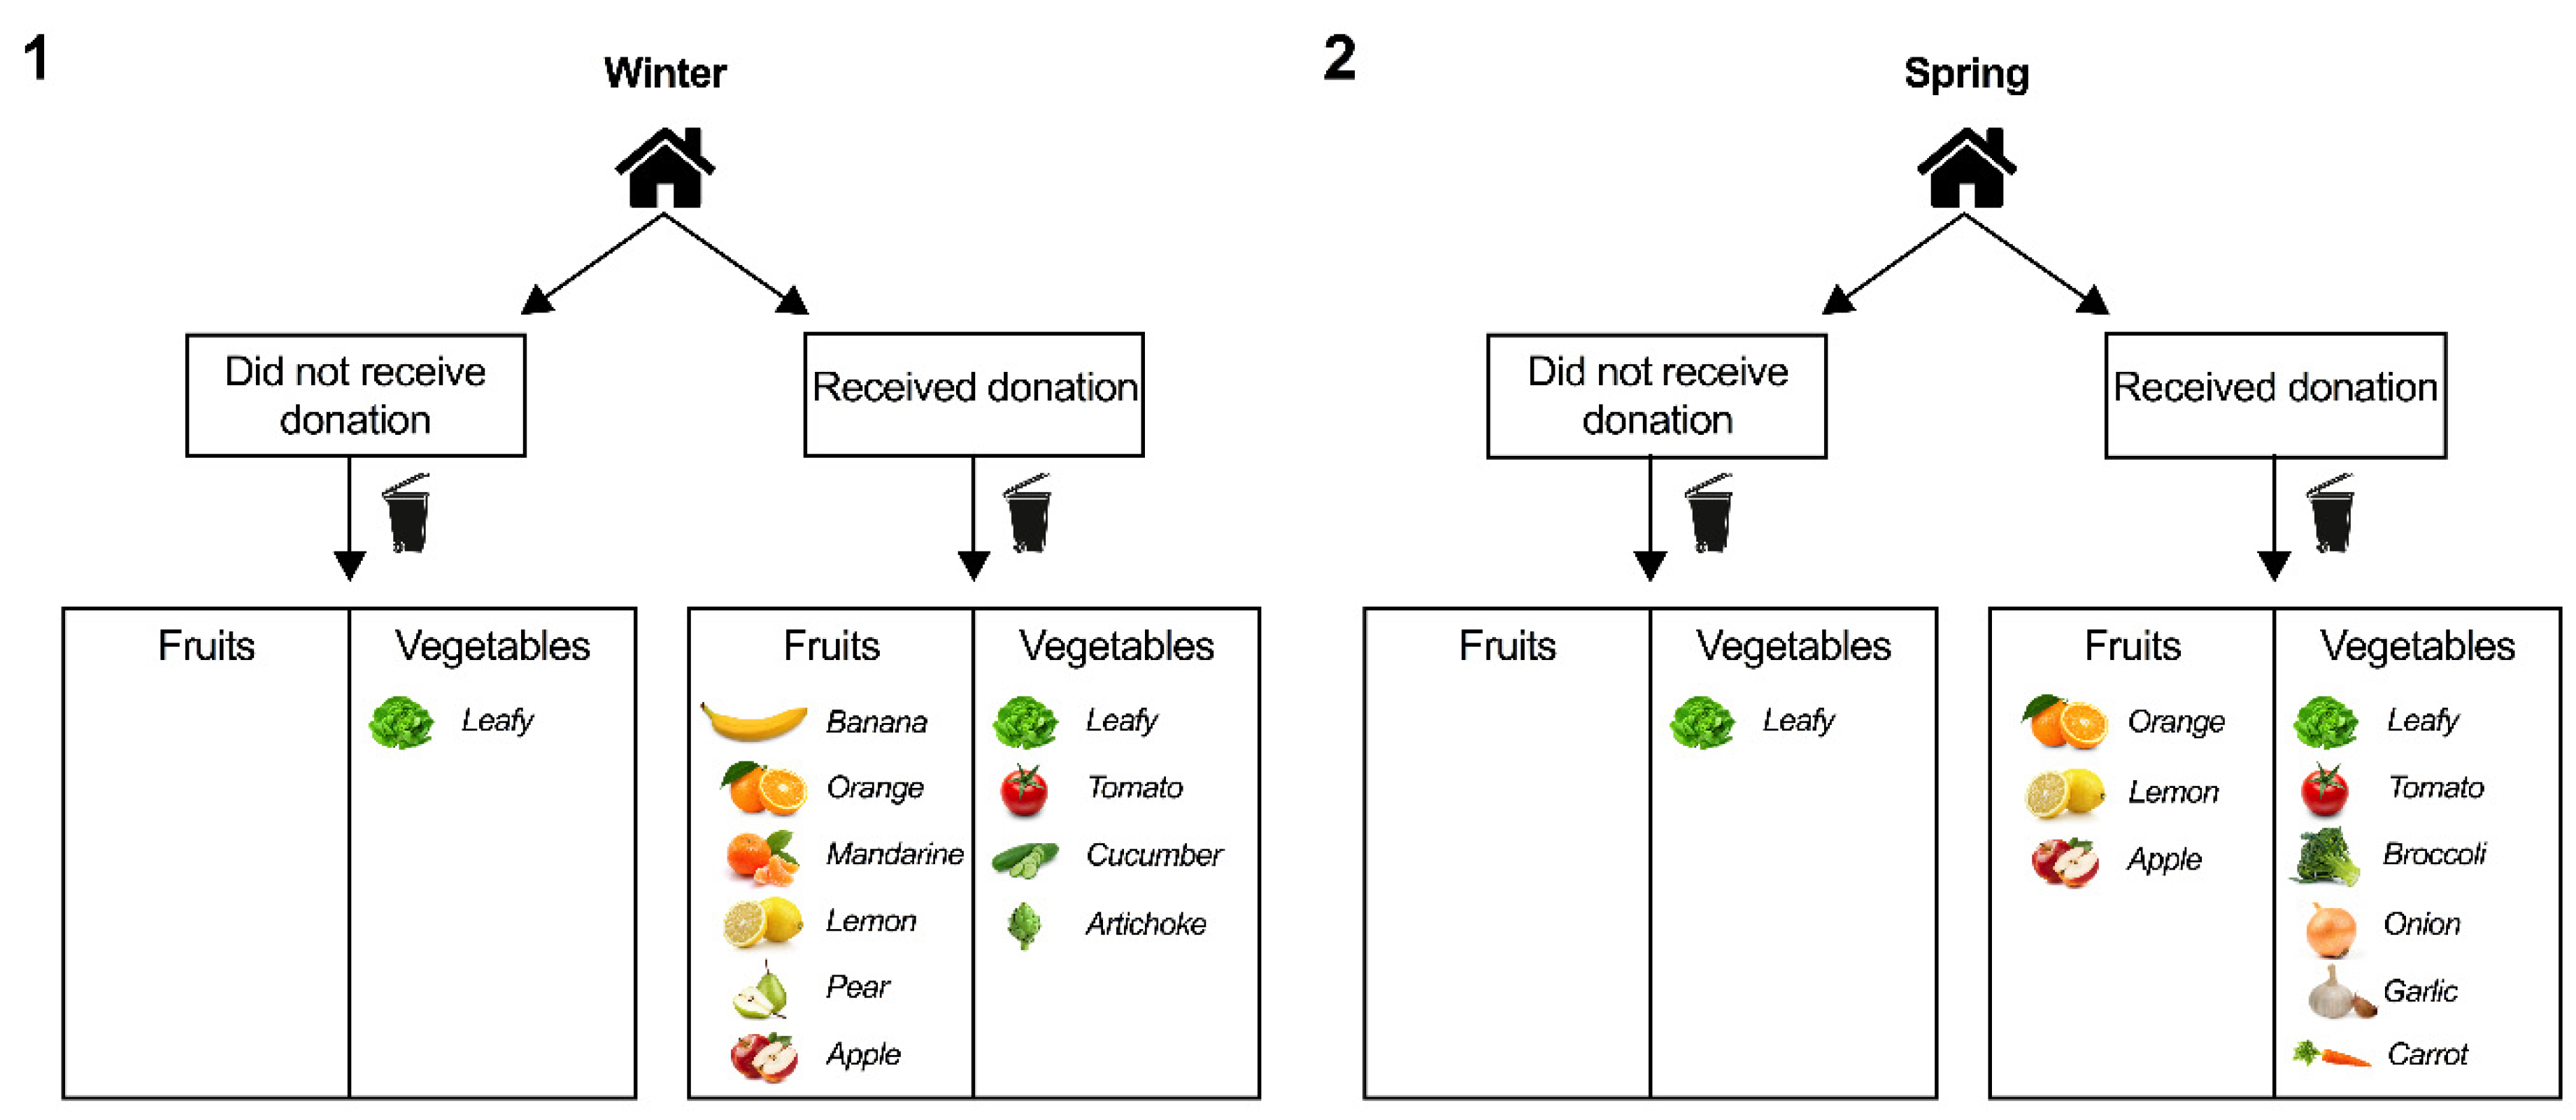
4.1.1. Winter

Considering all homeless shelters, total waste was 165 (103–241) g per person/day, ranging from 26 to 351 g per person/day. Vegetable waste was higher than fruit waste in nine out of ten homeless shelters. HS+DON had a higher total waste than HS (Figure 3A). The difference was explained by the null fruit waste among HS; note that HS barely purchased fruit during winter. Moreover, they purchased mainly banana and mandarine, whose peel was probably wasted as plates leftovers and were thus not considered in our calculations. On the other hand, HS+DON wasted a larger variety of fruits, including apple, banana, mandarine, lemon, orange, and pear (Appendix A). The difference in the amount and type of fruits between homeless shelters was a confounding factor for total waste; this is because total waste was equivalent to vegetable waste in the HS.
As for vegetable waste, we found no difference between HS and HS+DON (Figure 3A). Leafy vegetables were wasted by both types of homeless shelters. HS+DON wasted other types of vegetables as well (Appendix A).

4.1.2. Spring

Considering all homeless shelters, total waste was 69 (59–188) g per person/day, ranging from 45 to 258 g per person/day. Vegetable waste was higher than fruit waste in all homeless shelters. No differences between HS and HS+DON were observed for total or vegetable waste (Figure 3B). Fruit waste was higher in HS+DON; but this again was explained by the null fruit waste in HS. Even so, this difference in fruit waste was not large enough to manifest into significant differences in total waste. Indeed, in HS+DON, fruit waste in spring was only one sixth of the fruit waste in winter (13 (6–40) vs. 74 (16–134) g per person/day, respectively; Figure 2A and Figure 2B). The fewer types of fruits wasted in spring than winter may explain the difference in fruit waste between seasons (Appendix A). Once again, the null fruit waste at HS could be explained by a limited purchase.
As for vegetable waste, leafy vegetables were wasted by both types of homeless shelters. But HS+DON wasted other types of vegetables as well (Appendix A).

4.2. Financial Value and Nutritional Content of Waste

4.2.1. Winter

Considering all homeless shelters, the financial value of fruit and vegetable waste was 0.13 (0.07–0.18) USD per person/day, ranging from 0.02 to 0.27 USD per person/day. This financial value was higher in HS+DON than HS (Table 2).
The estimated nutritional content of fruit and vegetable waste represents the loss of nutrients. We observed a higher loss of most nutrients in the HS+DON compared to HS. This is because HS+DON had a higher amount of total waste than HS in winter (Figure 3A).

4.2.2. Spring

Considering all homeless shelters, the financial value of fruit and vegetable waste was 0.03 (0.02–0.09) USD per person/day, ranging from 0.02 to 0.13 USD per person/day. This financial value was similar between HS and HS+DON (Table 2). The range of financial value was lower in spring than winter due to the low amount of total food waste and low prices of fruits and vegetables in spring.
Regarding the nutritional content of waste, we only found a trend (p-value < 0.10) towards a higher content of kilocalories and carbohydrates in HS+DON compared to HS. This result was expected considering that homeless shelters had a similar amount of total waste in spring (Figure 3B).

4.3. Reasons to Explain Waste

Our survey summarized deficiencies in the purchase, cooking, consumption, and storage of food within nine reasons to explain the waste generated. We found that less than 40% of homeless shelters recognized as reasons “low acceptance,” “low freezing or refrigeration capacity,” and “large inedible portion.” Indeed, kitchen personnel commented that: “we try to find different recipes for fruit and vegetables,” “residents, in general, have high acceptance for all of fruits and vegetables,” and “we do not associate problems of acceptance in any fruit or vegetable.” Consistent with low freezing or refrigeration capacity not being recognized as a reason for waste, we observed that all homeless shelters had sufficient frozen or refrigeration capacity. This is important, as an adequate refrigeration storage enhances fruits and vegetables shelf-life by reducing their respiratory rate in the postharvest life [26]. Note that, following the methodology described by De Laurentiis et al. [22], we estimated the unavoidable fruit waste intensity in 27% in winter, and 20% in spring; the unavoidable vegetable waste intensity was 20% in winter, and 21% in spring. Although these estimations reached at least 20%, “large inedible portion” was barely reported as a reason to explain waste.

4.3.1. Winter

Al least 60% of homeless shelters recognized “excessive donation” and “look badly” as reasons for explaining all categories of fruit waste (Table 3). For banana waste, “look badly” and “too perishable” were reported by all HS+DON. Banana is a tropical climacteric fruit with a quick rise in respiratory rate and ethylene production during maturity [26]. Surplus of banana is thus difficult to handle. “Smell moldy” was also frequently reported for citrus (80%) and pomace (60%) categories.
The reason “excess of purchase or donation” for fruit vegetables was more frequent in HS+DON than HS (Table 3). This agrees with the observation that tomato and cucumber appeared as waste only in HS+DON (Appendix A). HS+DON also reported more frequently the reason “too perishable” for leafy and fruit vegetables. This suggests that HS+DON received donation of vegetable surplus at the end of the postharvest stage, and vegetables were thus quickly spoiled.

4.3.2. Spring

Compared to winter, “excess of purchase or donation” was less frequent for all fruits (> 55% in winter vs. < 55% in spring). All HS+DON recognized “look badly” as a reason for pomace waste, which may be explained by an excessive donation (50%) (Table 3).
HS+DON trended (p-value < 0.10) to recognize “excess of purchase or donation” for bulb vegetables more frequently. This agrees with the onion waste observed into the containers (Appendix A). HS+DON also recognized more frequently “look badly” to explain the waste of the vegetables leafy (p-value < 0.10), bulbs and root-and-tubers. HS+DON also trended (p-value < 0.10) to recognize more frequently “too perishable” for leafy and fruit vegetables.

5. Discussion

Redistribution of food surplus is a strategy recommended to reduce waste and feed hungry people. Our current study explored the effectiveness of this strategy in the context of redistribution of fruit and vegetable surplus from a wholesale market to homeless shelters. The redistribution served to diminish the waste at the wholesale market because, if not sold, those fruits and vegetables had been wasted. The strategy thus allowed to reduce waste at the distribution level. At the homeless shelters, we found that shelters that received the donation (HS+DON) produced higher total (fruits plus vegetables) waste than shelters that did not receive a donation (HS). But notably, this difference was not explained by an inadequate handling of the donation. Instead, it was mostly explained because of HS had a limited purchase of fruits and vegetables. This suggests that the redistribution of fruit and vegetable surplus to homeless shelters improves the access to nutritious food to vulnerable people. Nevertheless, our analysis about the causes that explain waste suggests that attention need to be paid to the quantity and quality of donation in the future.

5.1. Production of Fruit and Vegetable Waste

There are no previous data on waste production in homeless shelters. Therefore, we compared our results to those previously obtained in households. In agreement with our findings, a previous study reported lower fruit waste than vegetable waste in EU households, explained by a lower purchase of fruits than vegetables (52 vs. 71 kg per person/year, respectively) [22]. Considering all homeless shelters, we found a fruit and vegetable waste of 165 (103–241) g per person/day in winter and of 69 (59–188) g per person/day in spring. These values are higher than the 21 g per person/day reported in Pakistan using direct quantification [34]. The cost—i.e., the proportion of household income spent—of fruits and vegetables could partially explain the difference. This cost is higher in low-income countries (e.g., Pakistan) than in upper-middle income countries (e.g., Chile). Consequently, there is less consumption of fruits and vegetables in low-income countries, and thus less waste [50]. A higher food purchase, consumption, and waste is thus expected in Chile compared to Pakistan.
In our study, direct quantification allowed us to distinguish fruit and vegetable waste and to weigh those wastes separately. We were also able to discriminate the avoidable waste from the unavoidable waste using a qualitative analysis. This unavoidable waste included leaves, peels, apple core, fruit pit, and seeds, which constitute the inedible proportion of fruits and vegetables (i.e., unavoidable waste intensity, expressed as percentage) [5]. Silvennoinen et al. [51] considers the inedible parts of vegetables as an integral part of kitchen waste. Thus, fruits and vegetables at homeless shelters’ kitchens will produce unavoidable food waste, independently of the efficacy in the management of the donation. We found unavoidable fruit and vegetable waste intensity values of at least 20% in our homeless shelters. These results were higher than those estimated among EU households (17% for fruits and 16% for vegetables) [22]. The difference may be explained by the different types of fruits and vegetables included in the calculations, as this depends on the availability in each country.

5.2. Economical Cost and Nutritional Content of Waste

Previous reports have shown that citizens from Western Europe throw away 108–140 euros/year in fruit and vegetable waste (i.e., about 0.40 USD/day) [29]; while 60 euros per person/year has been estimated in Spanish households (i.e., about 0.19 USD/day) [32]. These values are higher than the values observed in our homeless shelters, which may be explained by the different income among countries. But note that, for HS+DON, fruits and vegetables do not carry a direct cost; instead, there are indirect costs associated with the transport, storage, and handling of the donation. If part of the donation ends up as waste, this represents an economic loss. Directors of homeless shelters should thus promote strategies to reduce this indirect economic loss by minimizing waste production. Homeless shelters should also be aware that throwing away food has environmental and social impacts. In this context, our estimation of the economic and nutritional loss of waste in homeless shelters is necessary to assess future strategies aimed to reduce and manage food waste [17,32].
Fruits and vegetables are good sources of dietary fiber, vitamin C, and potassium. It is recommended to consume two servings of fruits and three servings of vegetables per day [52]. This represents an average daily intake of 147 kcal, 35 g of carbohydrates, 8 g of dietary fiber, 110 mg of vitamin C, and 882 mg of potassium (calculated using USDA [25]). Considering all homeless shelters in winter, we found a loss (per person/day) of 52 (25–76) kcal, 11.4 (5.4–17.8) g of carbohydrates, 3.3 (2.0–4.8) g of dietary fiber, 45.9 (24.2–62.1) mg of vitamin C, and 383.6 (258.8–559.4) mg of potassium. In spring, we found a loss (per person/day) of 19 (14–49) kcal, 4.1 (3.1–10.7) g of carbohydrates, 1.3 (1.1–3.7) g of dietary fiber, 16.2 (13.8–45.1) mg of vitamin C, and 172.6 (147.5–464.6) mg of potassium. These losses represent about 39% and 15% of the daily recommendations in winter and spring, respectively.

5.3. Reasons that Explain Waste

Our current results agree with previous findings of reasons that explain waste in other contexts: “excessive purchase or donation” was the main reason to explain fruit and vegetable waste [43,44,45]. Furthermore, our findings agree with previous evidence in suboptimal products [1,42,45,46]. “Look badly” was frequently reported as a reason to explain waste for fruits in winter and for vegetables in spring. As for citrus and pomace in winter, “look badly” and “smell moldy” were reported. It is worth noting, however, that the fact that food “do not look or smell good” may denote spoilage and decomposition. This was specifically reported for banana, tomato, cucumber, and onion in HS+DON. The actual reason for wasting would thus be beyond aesthetics.

5.4. A Tailored Donation Plan for Fruit and Vegetable Surplus: A Practical Contribution

Food waste prevention or source reduction has been described as the most preferred practice in the Food Waste Hierarchy [5,6,11]. Thus, better donation plans to redistribute food surplus to even more organizations can further reduce food waste at the distribution level. In the current study, “excessive donation” was a major reason to explain waste. We thus propose that a donation plan tailored for each homeless shelter would reduce waste to the unavoidable one. To determine the appropriate amount of donation, we considered the recommended consumption of fruits and vegetables (i.e., two serving of fruits and three servings of vegetables per person/day [52]) and their unavoidable waste. The unavoidable waste intensity for fruits and vegetables was calculated using the equation described by De Laurentiis et al. [22]. Then, we propose calculating the appropriate amount of donation (in kg) for each homeless shelter as:
Donation of fruit surplus = [F × (1 + UnFWI)] × n × d
Donation of vegetable surplus = [V × (1 + UnVWI)] × n × d
where F represents the servings of fruits per person/day (in kg); UnFWI represents the unavoidable fruit waste intensity (in %); V represents the portion of vegetables per person/day (in kg); UnVWI represents the unavoidable vegetable waste intensity (in %); n represents the number of residents; and d represents the frequency of donation (in days). The unavoidable waste expected (in kg) can be computed as:
Unavoidable fruit waste = Donation of fruit surplus × UnFWI
Unavoidable vegetable waste = Donation of vegetable surplus × UnVWI
Using these formulas, we calculated, as an example, the appropriate amount of donation (in kg) for a homeless shelter that hosts 100 residents. We considered two serving of fruits (i.e., 0.16 kg) per person/day, three servings of vegetables (i.e., 0.24 kg) per person/day, an UnFWI of 27% (winter), an UnVWI of 20% (winter), and a frequency of donation of 7 days. Thus, we estimated that the appropriate amount of donation to this homeless shelter was 142 kg of fruits plus 202 kg of vegetables per week. Considering the number of types of fruits (8 in winter, 6 in spring) and vegetables (13 in winter, 11 in spring) available as surplus at the wholesale market in Santiago, the donation could be very diverse.
The method we propose could be a valuable tool for future donation plans. Based on the appropriate donation, we calculate that the total unavoidable waste would reach 78 kg per week, which represents 111 g per person/day ([78 kg × 1000]/[7 days × 100 residents]), with the unavoidable waste for fruits being 54 g per person/day, and for vegetables 57 g per person/day. Of note, our calculations demonstrate that fruits and vegetables produce—by default—a high amount of unavoidable waste. This unavoidable waste can be home-composted [53]. Our calculations for the unavoidable waste thus estimate the potential mass of food waste that can be home-composted by homeless shelters. This information is useful for initiatives that aim to encourage composting practices and/or organic-waste recycling programs (e.g., green bin) by homeless shelters, in agreement with initiatives proposed for households [54]. Indeed, previous evidence has shown that households with access to green bins dispose less food waste than households without such an access [41,55]. Future studies should determine the impact on food waste of this tailored donation plan.

6. Limitations

Our study has certain limitations. First, its small sample size. As an exploratory study, we did not have preliminary data to conduct a sample size calculation. The small sample size may have decreased the possibility of detecting differences between homeless shelters; however, the direct quantification allowed us to get accurate measurements of the waste. Second, the inclusion of a convenience sample, which makes our findings not representative of all homeless shelters in Chile. Nevertheless, our findings are a base for the design of future studies aimed to analyze the effectiveness of fruit and vegetable donations in homeless shelters. Third, the qualitative nature of the determination of the categories of fruits and vegetables wasted. We were thus unable to calculate the percentage of each category within the total waste, which would have allowed us to conduct more in-depth analyses. Note, however, that the qualitative analysis agreed with the results of the survey, highlighting the impact of certain fruits (e.g., banana) and vegetables (e.g., tomato, cucumber and onion) on waste. Fourth, the short measurement period. The European standard (SWA—Tool), and the US standard (ASTM D5231-92) recommend at least one week of measurement. We analyzed only three days of waste production, because we deemed this period as appropriate to ensure a safe management of waste at the homeless shelter (i.e., to avoid bad odors and the presence of rodents). Fifth, the lack of measurement of the inputs (purchase or donation). Future research must consider the measurements of both inputs and outputs to better assess the effectiveness of the donation. This would allow to determine whether the differences in the output (i.e., waste production) between shelters are explained by differences in the input. Finally, a possible social desirability bias of the kitchen personnel. It is possible that the kitchen personnel engaged in an extra effort to reduce waste during measurement period.

7. Conclusions and Future Perspectives

We have shown, for the first time, that a donation model based on redistribution of fruit and vegetable surplus is effective in Chile; this model avoided the vegetable waste that had been produced if the vegetable surplus had not been donated from the wholesale market. It also helped to provide nutritious food to vulnerable people. Nevertheless, the reasons for wasting among the homeless shelter that received the donation suggest that attention should be paid to the quantity and quality of donation. Homeless shelters should receive an amount of fruit and vegetable surplus tailored to their needs. Herein we have proposed a formula that can be used for that purpose. This strategy should be evaluated in future studies to minimize waste. Additionally, the donation should be in an appropriate post-harvest stage, thus avoiding any surplus soon-to-be spoiled. This information is valuable to policymakers to better regulate the quantity and quality of donation of fresh fruits and vegetables. A better management of these aspects could thereby reduce the waste to the unavoidable one.

Author Contributions

C.F.: conceptualization, project administration, supervision, writing—original draft. F.G. and M.I.P.: investigation, data curation. R.F.-V.: methodology, formal analysis, writing—review and editing. All authors have read and agreed to the published version of the manuscript.

Funding

This work was supported by the Fondo de Desarrollo Docente (FONDEDOC #1082-605-41, 2019 to María José Rojas, Pontificia Universidad Católica de Chile).

Acknowledgments

We thank Beatriz Reutter (FAO para América Latina y el Caribe) for her valuable feedback on the manuscript.

Conflicts of Interest

The authors declare no conflict of interest.

Appendix A

Figure A1. Qualitative analysis of fruits and vegetables wasted by homeless shelters in (1) winter and (2) spring.
Sustainability 12 08835 g0a1

References

  1. Gustavsson, J.; Cederberg, C.; Sonesson, U.; Otterdijk, V.; Meybeck, A. Global Food Losses and Food Waste; Food and Agriculture Organization of the United Nations (FAO): Rome, Italy, 2011. [Google Scholar]
  2. FAO. The State of Food and Agriculture 2019. Moving Forward on Food Loss and Waste Reduction; Food and Agriculture Organization of the United Nations (FAO): Rome, Italy, 2019. [Google Scholar]
  3. Adhikari, B.K.; Barrington, S.; Martinez, J. Predicted Growth of World Urban Food Waste and Methane Production. Waste Manag. Res. 2006, 24, 421–433. [Google Scholar] [CrossRef] [PubMed]
  4. FAO; IFAD; UNICEF; WFP; WHO. The State of Food Security and Nutrition in the World 2019. Safeguarding against Economic Slowdowns and Downturns; Food and Agriculture Organization of the United Nations (FAO): Rome, Italy, 2019. [Google Scholar]
  5. Papargyropoulou, E.; Lozano, R.; Steinberger, J.K.; Wright, N.; Bin Ujang, Z. The Food Waste Hierarchy as a Framework for the Management of Food Surplus and Food Waste. J. Clean. Prod. 2014, 76, 106–115. [Google Scholar] [CrossRef]
  6. Adamashvili, N.; Chiara, F.; Fiore, M. Food Loss and Waste, a Global Responsibility?! Econ. Agro-Aliment. 2020, 21, 825–846. [Google Scholar] [CrossRef]
  7. Roe, B.E.; Qi, D.; Bender, K.E. Some Issues in the Ethics of Food Waste. Physiol. Behav. 2020, 219, 112860. [Google Scholar] [CrossRef]
  8. Smil, V. Improving Efficiency and Reducing Waste in Our Food System. Environ. Sci. 2004, 1, 17–26. [Google Scholar] [CrossRef] [Green Version]
  9. Hodges, R.J.; Buzby, J.C.; Bennett, B. Postharvest Losses and Waste in Developed and Less Developed Countries: Opportunities to Improve Resource Use. J. Agric. Sci. 2011, 149, 37–45. [Google Scholar] [CrossRef] [Green Version]
  10. Garrone, P.; Melacini, M.; Perego, A.; Sert, S. Reducing Food Waste in Food Manufacturing Companies. J. Clean. Prod. 2016, 137, 1076–1085. [Google Scholar] [CrossRef]
  11. Teigiserova, D.A.; Hamelin, L.; Thomsen, M. Towards Transparent Valorization of Food Surplus, Waste and Loss: Clarifying Definitions, Food Waste Hierarchy, and Role in the Circular Economy. Sci. Total Environ. 2020, 706, 136033. [Google Scholar] [CrossRef]
  12. Nosratabadi, S.; Mosavi, A.; Shamshirband, S.; Kazimieras Zavadskas, E.; Rakotonirainy, A.; Chau, K.W. Sustainable Business Models: A Review. Sustainability 2019, 11, 1663. [Google Scholar] [CrossRef] [Green Version]
  13. Rauter, R.; Jonker, J.; Baumgartner, R.J. Going One’s Own Way: Drivers in Developing Business Models for Sustainability. J. Clean. Prod. 2017, 140, 144–154. [Google Scholar] [CrossRef]
  14. Pellegrini, G.; Annosi, M.C.; Contò, F.; Fiore, M. What Are the Conflicting Tensions in an Italian Cooperative and How Do Members Manage Them? Business Goals’, Integrated Management, and Reduction of Waste within a Fruit and Vegetables Supply Chain. Sustainability 2020, 12, 3050. [Google Scholar] [CrossRef] [Green Version]
  15. Storup, K.; Mattfolk, K.; Voinea, D.; Jakobsen, B.; Bain, M.; Reverté Casas, M.; Oliveira, P. Combating Food Waste: An Opportunity for the EU to Improve the Resource-Efficiency of the Food Supply Chain; European Court of Auditors, European Union: Luxembourg, 2016. [Google Scholar] [CrossRef]
  16. United States Environmental Protection Agency. Food Recovery Hierarchy. Available online: https://www.epa.gov/sustainable-management-food/food-recovery-hierarchy (accessed on 6 January 2020).
  17. CEC. Technical Report: Quantifying Food Loss and Waste and Its Impacts; Commission for Environmental Cooperation: Montreal, QC, Canada, 2019. [Google Scholar]
  18. Garrone, P.; Melacini, M.; Perego, A. Opening the Black Box of Food Waste Reduction. Food Policy 2014, 46, 129–139. [Google Scholar] [CrossRef]
  19. Chen, C.R.; Chen, R.J. Using Two Government Food Waste Recognition Programs to Understand Current Reducing Food Loss and Waste Activities in the U.S. Sustainability 2018, 10, 2760. [Google Scholar] [CrossRef] [Green Version]
  20. Otten, J.; Getts, K.; Diedrich, S.; Benson, C. Commercial and Anti-Hunger Sector Views on Local Government Strategies for Helping to Manage Food Waste. J. Agric. Food Syst. Community Dev. 2018, 8, 55–72. [Google Scholar] [CrossRef]
  21. Eguillor, P.; Acuña, D. Pérdida y Desperdicio de Alimentos En El Sector Agrícola: Avances y Desafíos; Oficina de Estudios y Políticas Agrarias—Odepa, Ministerio de Agricultura: Santiago, Chile, 2019.
  22. De Laurentiis, V.; Corrado, S.; Sala, S. Quantifying Household Waste of Fresh Fruit and Vegetables in the EU. Waste Manag. 2018, 77, 238–251. [Google Scholar] [CrossRef] [PubMed]
  23. Philip, D.; Hod-Ovadia, S.; Troen, A.M. A Technical and Policy Case Study of Large-Scale Rescue and Redistribution of Perishable Foods by the “Leket Israel” Food Bank. Food Nutr. Bull. 2017, 38, 226–239. [Google Scholar] [CrossRef] [PubMed]
  24. Efrati Philip, D.; Baransi, G.; Shahar, D.R.; Troen, A.M. Food-Aid Quality Correlates Positively With Diet Quality of Food Pantry Users in the Leket Israel Food Bank Collaborative. Front. Nutr. 2018, 5, 1–13. [Google Scholar] [CrossRef] [PubMed]
  25. USDA. FoodData Central. Available online: https://fdc.nal.usda.gov/ (accessed on 9 January 2020).
  26. Taiz, L.; Zeiger, E. Plant Physiology; The Benjamin/Cummings Publishing Company, Inc: San Francisco, CA, USA, 1991. [Google Scholar]
  27. Ventour, L. The Food We Waste; Waste & Resources Action Programme: Banbury, UK, 2008; Volume 2. [Google Scholar]
  28. Elimelech, E.; Ayalon, O.; Ert, E. What Gets Measured Gets Managed: A New Method of Measuring Household Food Waste. Waste Manag. 2018, 76, 68–81. [Google Scholar] [CrossRef] [PubMed]
  29. Blanke, M. Challenges of Reducing Fresh Produce Waste in Europe—From Farm to Fork. Agriculture 2015, 5, 389–399. [Google Scholar] [CrossRef] [Green Version]
  30. Zan, F.; Dai, J.; Hong, Y.; Wong, M.; Jiang, F.; Chen, G. The Characteristics of Household Food Waste in Hong Kong and Their Implications for Sewage Quality and Energy Recovery. Waste Manag. 2018, 74, 63–73. [Google Scholar] [CrossRef]
  31. Van Dooren, C.; Janmaat, O.; Snoek, J.; Schrijnen, M. Measuring Food Waste in Dutch Households: A Synthesis of Three Studies. Waste Manag. 2019, 94, 153–164. [Google Scholar] [CrossRef] [PubMed]
  32. Garcia-Herrero, I.; Hoehn, D.; Margallo, M.; Laso, J.; Bala, A.; Batlle-Bayer, L.; Fullana, P.; Vazquez-Rowe, I.; Gonzalez, M.J.; Durá, M.J.; et al. On the Estimation of Potential Food Waste Reduction to Support Sustainable Production and Consumption Policies. Food Policy 2018, 80, 24–38. [Google Scholar] [CrossRef]
  33. Manios, Y.; Harizani, K.; Markakis, G.; Galani, P.; Manios, T. Relating Fruit and Vegetable Consumption in Households with Residue Generation and Utilization in the City of Heraklion, Crete, Greece. Int. J. Sustain. Dev. World Ecol. 2005, 12, 353–360. [Google Scholar] [CrossRef]
  34. Khalid, S.; Naseer, A.; Shahid, M.; Shah, G.M.; Ullah, M.I.; Waqar, A.; Abbas, T.; Imran, M.; Rehman, F. Assessment of Nutritional Loss with Food Waste and Factors Governing This Waste at Household Level in Pakistan. J. Clean. Prod. 2019, 206, 1015–1024. [Google Scholar] [CrossRef]
  35. Jörissen, J.; Priefer, C.; Bräutigam, K.R. Food Waste Generation at Household Level: Results of a Survey among Employees of Two European Research Centers in Italy and Germany. Sustainability 2015, 7, 2695–2715. [Google Scholar] [CrossRef] [Green Version]
  36. Simunek, J.; Derflerova-Brazdova, Z.; Vitu, K. Food Wasting: A Study among Central European Four-Member Families. Int. Food Res. J. 2015, 22, 2679–2683. [Google Scholar]
  37. Elimelech, E.; Ert, E.; Ayalon, O. Bridging the Gap between Self-Assessments and Measured Household Food Waste: A Hybrid Valuation Approach. Waste Manag. 2019, 95, 259–270. [Google Scholar] [CrossRef]
  38. Hoj, S.B. Metrics and Measurement Methods for the Monitoring and Evaluation of Household Food Waste Prevention Interventions. Master’s Thesis, University of South Australia, Adelaide, Australia, 2011. [Google Scholar]
  39. Claudia, G.; Simone, P.; Matteo, B.; Luca, F. Are Questionnaires a Reliable Method to Measure Food Waste? A Pilot Study on Italian Households. Br. Food J. 2018, 120, 2885–2897. [Google Scholar] [CrossRef]
  40. Delley, M.; Brunner, T.A. Household Food Waste Quantification: Comparison of Two Methods. Br. Food J. 2018, 120, 1504–1515. [Google Scholar] [CrossRef]
  41. Elimelech, E.; Ert, E.; Ayalon, O. Exploring the Drivers behind Self-Reported and Measured Food Wastage. Sustainability 2019, 11, 5677. [Google Scholar] [CrossRef] [Green Version]
  42. Aschemann-Witzel, J.; Giménez, A.; Ares, G. Household Food Waste in an Emerging Country and the Reasons Why: Consumer’s Own Accounts and How It Differs for Target Groups. Resour. Conserv. Recycl. 2019, 145, 332–338. [Google Scholar] [CrossRef]
  43. Prasilova, M.; Varvazovska, P.; Pachtova, A. Foodstuffs Wastage in Czech Households. In Proceedings of the Adved 2017: 3rd International Conference on Advances in Education and Social Science, Istanbul, Turkey, 9–11 October 2017; pp. 432–437. [Google Scholar]
  44. Cronje, N.; van der Merwe, I.; Muller, I.-M. Household Food Waste: A Case Study in Kimberly, South Africa. J. Consum. Sci. 2018, 46, 1–9. [Google Scholar]
  45. Gaiani, S.; Caldeira, S.; Adorno, V.; Segrè, A.; Vittuari, M. Food Wasters: Profiling Consumers’ Attitude to Waste Food in Italy. Waste Manag. 2018, 72, 17–24. [Google Scholar] [CrossRef] [PubMed]
  46. Stangherlin, I.d.C.; Ribeiro, J.L.D.; Barcellos, M. Consumer Behaviour towards Suboptimal Food Products: A Strategy for Food Waste Reduction. Br. Food J. 2019, 121, 2396–2412. [Google Scholar] [CrossRef]
  47. Ramukhwatho, F.R.; du Plessis, R.; Oelofse, S. Household Food Wastage in a Developing Country: A Case Study of Mamelodi Township in South Africa. In Proceedings of the 20th WasteCon Conference, Cape Town, South Africa, 6–10 October 2014; pp. 468–475. [Google Scholar]
  48. Baglioni, S.; De Pieri, B.; Tallarico, T. Surplus Food Recovery and Food Aid: The Pivotal Role of Non-Profit Organisations. Insights from Italy and Germany. Volunt. Int. J. Volunt. Nonprofit Organ. 2017, 28, 2032–2052. [Google Scholar] [CrossRef] [Green Version]
  49. ODEPA. Mayoristas Frutas y Verduras. Available online: https://www.odepa.gob.cl/precios/mayoristas-frutas-y-hortalizas (accessed on 16 January 2020).
  50. Miller, V.; Yusuf, S.; Chow, C.K.; Dehghan, M.; Corsi, D.J.; Lock, K.; Popkin, B.; Rangarajan, S.; Khatib, R.; Lear, S.A.; et al. Availability, Affordability, and Consumption of Fruits and Vegetables in 18 Countries across Income Levels: Findings from the Prospective Urban Rural Epidemiology (PURE) Study. Lancet Glob. Health 2016, 4, e695–e703. [Google Scholar] [CrossRef] [Green Version]
  51. Silvennoinen, K.; Nisonen, S.; Pietiläinen, O. Food Waste Case Study and Monitoring Developing in Finnish Food Services. Waste Manag. 2019, 97, 97–104. [Google Scholar] [CrossRef]
  52. WHO; FAO. Diet, Nutrition, and the Prevention of Chronic Diseases (Report of a Joint WHO and FAO Expert Consulation); WHO: Geneva, Switzerland, 2003; Volume 916. [Google Scholar]
  53. Edjabou, M.E.; Petersen, C.; Scheutz, C.; Astrup, T.F. Food Waste from Danish Households: Generation and Composition. Waste Manag. 2016, 52, 256–268. [Google Scholar] [CrossRef] [Green Version]
  54. Hanc, A.; Novak, P.; Dvorak, M.; Habart, J.; Svehla, P. Composition and Parameters of Household Bio-Waste in Four Seasons. Waste Manag. 2011, 31, 1450–1460. [Google Scholar] [CrossRef]
  55. Van Der Werf, P.; Seabrook, J.A.; Gilliland, J.A. The Quantity of Food Waste in the Garbage Stream of Southern Ontario, Canada Households. PLoS ONE 2018, 13, e0198470. [Google Scholar] [CrossRef]
Figure 1. Model of management of food surplus recovery and redistribution in this study.
Sustainability 12 08835 g001
Figure 2. Infographics displayed in the homeless shelters to guide kitchens’ personnel about (A) fruit disposal and (B) vegetable disposal.
Sustainability 12 08835 g002
Figure 3. Total, fruit, and vegetable waste produced by homeless shelters in (A) winter and (B) spring. Boxes represent the 25th and 75th percentiles, with a horizontal line denoting the median; whiskers denote the minimum and maximum values. * p-value < 0.05 between groups. HS, homeless shelters that did not receive donation; HS+DON, homeless shelters that received donation.
Sustainability 12 08835 g003
Table 1. General characteristics of homeless shelters.
IDReceived Fruit and Vegetable Surplus DonationBeneficiaries (n)Meals (n per Beneficiary/day)Distance from the Wholesale Market (km)
1Yes43445
2Yes100435
3Yes45436
4Yes30437
5Yes120412
6No89413
7No100410
8No126414
9No54410
10No120414
Table 2. Financial value and nutritional content of waste.
HS (n = 5)HS+DON (n = 5)
Winter
Financial value, USD0.08 (0.05–0.12)0.16 (0.13–0.25) *
Energy, kcal26 (16–40)75 (64–106) **
Carbohydrate, g5.5 (3.3–8.6)17.8 (14.8–24.8) **
Dietary fiber, g2.1 (1.3–3.2)4.3 (3.4–6.8) *
Vitamin C, mg25 (15–38)58 (46–87) *
Potassium, mg261 (159–409)479 (356–789) #
Spring $
Financial value, USD0.03 (0.02–0.06)0.08 (0.04–0.12)
Energy, kcal16 (12–33)46 (25–61) #
Carbohydrate, g3.3 (2.6–7.0)10.7 (5.7–13.4) #
Dietary fiber, g1.2 (1.0–2.6)3.0 (1.6–4.7)
Vitamin C, mg15 (12–31)38 (20–57)
Potassium, mg158 (125–333)344 (183–592)
Values were calculated as per person/day. Data represent median (25th percentile–75th percentile). HS, homeless shelters that did not receive donation; HS+DON, homeless shelters that received donation. # p-value < 0.10, * p-value < 0.05, ** p-value < 0.01 vs. HS. $ n = 4 for HS+DON.
Table 3. Reasons to explain waste in homeless shelters.
Excess of Purchase or DonationNot Received According to Meal PlanningFew Ways to Prepare MealsSmell MoldyLooked BadlyToo Perishable
Fruit waste
Citrus
HS+DON (%)60–25%60–25%0–0%80–0%80–50%40–25%
Pomace
HS+DON (%)80–50%20–25%20–0%60–50%60–100%60–0%
Banana
HS+DON (%)60–25%20–25%0–0%40–0%100–25%100–25%
Vegetable waste
Leafy
HS (%)20–0%0–0%0–0%20–20%100–40%0–20%
HS+DON (%)40–25%20–25%20–0%40–50%80–100% #80 *–75% #
Fruits
HS (%)20–0%0–0%0–0%80–0%20–40%0–20%
HS+DON (%)100 *–25%20–25%0–0%40–0%80 #–50%60 *–75% #
Stems
HS (%)0–0%0–0%40–0%0–0%80–40%20–20%
HS+DON (%)20–0%20–25%40–0%0–0%20 #–75%0–0%
Inflorescences
HS (%)20–0%0–0%0–0%20–40%60–40%0–40%
HS+DON (%)0–0%0–25%20–0%0–0%0 *–75%0–0%
Bulbs
HS (%)20–0%0–0%0–0%100–40%80–20%0–0%
HS+DON (%)40–50%#0–25%0–0%20 *–75%20 #–100% *20–0%
Root and tubers
HS (%)0–0%0–0%0–0%40–20%60–20%0–0%
HS+DON (%)20–25%0–25%0–0%20–25%20–100% *20–0%
Values represent the percentage of homeless shelters in which each reason for explaining waste was recognized (winter %–spring %). HS, homeless shelters that did not receive donation (n = 5); HS+DON, homeless shelters that received donation (n = 5). # p-value < 0.10, * p-value < 0.05 vs. HS.
Publisher’s Note: MDPI stays neutral with regard to jurisdictional claims in published maps and institutional affiliations.

