Article

Financing the (Environmental) Quality of Cities with Energy Efficiency Investments

Department of Architecture and Design, Politecnico di Torino, 10125 Turin, Italy
Sustainability 2020, 12(21), 8809; https://doi.org/10.3390/su12218809
Submission received: 30 June 2020 / Revised: 19 October 2020 / Accepted: 20 October 2020 / Published: 23 October 2020

Abstract

:
The purpose of the paper is to study the financing models in order to drive the large amount of financial resources, already allocated for energy efficiency, to improve the quality of cities. These resources are being deployed worldwide by both public and private financial institutions. Energy efficiency is usually managed at the scale of the buildings, i.e., consumption reduction (heating, lighting, etc.). The study methodology is to review energy-efficiency finance (EEF) models, and assess them using multiple case studies. At the same time, the ownership of cities’ spaces is studied across public-private space management, as an effective methodology to bridge the gap between public and investor finance. The comparative analysis of the case studies suggests a paradigm shift in the definition of energy efficiency, not just in terms of the buildings, but instead also the local urban environment with its feedbacks on the quality of urban living. The practical implications are innovative EEF models, such as those being reviewed, which may be: (1) analytical, to assess the environment at the scale of blocks or neighbourhoods; (2) financial, to fund the specific scale; (3) relating to policy, to support and encourage. In recent years, support for urban regeneration is becoming particularly relevant, given the budget constraints of most public administrations and the conjunctural shortening of private partnerships.

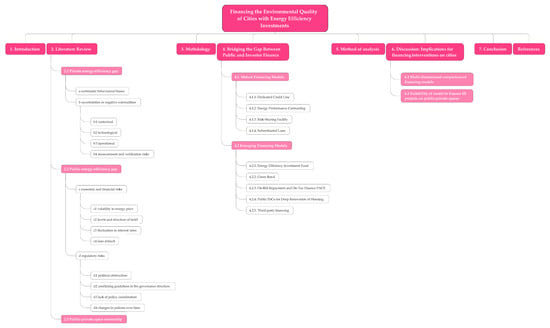
Graphical Abstract

1. Introduction

Is energy-efficiency finance (EEF) a means to fund the retrofit of both buildings and open space? The aim of the paper is to review and analyse the use of EEF to improve the quality of cities.
In Europe and the US, over 60% of the building stock dates from after the Second World War and before the oil crises in the 1970s, when the earliest energy codes were introduced. Therefore, a major portion of the built environment has never been subject to improvement since its original construction, and presents poor thermal conditions. “Energy consumption has dramatically increased in buildings over the past decade due to population growth, more time spent indoors, increased demand for building functions and indoor environmental quality, and global climate change. Building energy use currently accounts for over 40% of total primary energy consumption in the U.S. and E.U.” [1].
The issues of energy efficiency (EE) and quality of urban living are global and pressing issues.
A promising operational definition of “energy efficiency” is using less energy to provide the same or an improved service [2]. EE technologies provide means to address global warming, fossil fuel depletion, and energy security, and to lower energy bills and operating costs.
EE of buildings is widely addressed and supported by both public and private financial institutions, while there is a lack of tools and methodologies to advance EE measures for open spaces, namely for the interaction between the built fabrics, open spaces, and human anthropic activities.
Recent studies [3,4] have further raised concern about global warming, and have simulated an increase of temperature in Europe. This trend boosts the urban heat island effect, where the metropolitan areas are significantly hotter than the surrounding rural regions, affecting the quality of life in cities and raising the energy demands for cooling, over longer periods and even higher in the future [5,6]. Cities are already hotter than surrounding areas, and global warming is raising not only mean urban temperatures, but also the frequency, extent, and intensity of heat waves. People living and working within urban areas can suffer from heat stress and other heat-related illnesses, and face increased respiratory symptoms and disease. Buildings within heat islands require more energy cooling, increasing emissions of greenhouse gases as well as conventional pollutants.
In this paper, EEF is studied to bridge the gap between public and investor finance for deployment at a larger scale. EEF has been developed in the European Union and USA since the energy crises of the 1970s. The purpose of the paper is to advance EEF for open and public spaces, as well as buildings, and to comprehend the extent to which they can fund renovation at a whole-city level.
Innovative EEF aims to go beyond the mere bridging of public and private resources; firstly most public administrations and agencies struggle to create or strengthen sector markets to reduce the energy demand, and secondly, “quality of life in a city is not merely confined to the socioeconomic well-being but rather to its combination with a lower environmental burden” [7]. In the current economic downturn of reduced economy capacity, of conjunctural shortening of private partnerships, and of stress on public budgets, the financing of urban regeneration through EE is becoming a particularly attractive option to increase economic activity and even to create net revenue.
The United Nations Environment Programme Finance Initiative, the European Commission Directorate-General for Energy, and the US President’s Climate Action Plan set an agenda for positive environmental actions and allocate important financial resources to achieve them, e.g., the European Fund for Strategic Investments allocate €315 billion, US Clean-Energy $90 billion and, to a certain extent, the American Recovery and Reinvestment Act $831 billion. Another example is the forthcoming European Green Deal. These programmes offer attractive and low-cost options to reduce pollutant emissions, and to cut energy bills and dependency on imports of fossil fuels.
The paper contributes to the EEF field of studies, reviewing financial vehicles and their suitability for funding the regeneration both of buildings and of open spaces mutually. Contextually, the paper surveys the relevant literature on the barriers to the deployment on a large scale of EE technologies by individuals, firms, or public administrations at a degree that might be justified, even on a merely financial basis. “A comprehensive study of finance mechanisms for domestic retrofit (and urban retrofit NdA) is largely absent from the academic literature (…) The role of different types of financing and their impact on projects remains somewhat of a ‘black box’ in the energy studies field more generally.” [8].
A further relevant contribution to EEF studies is addressing the difference and the coexistence of public and private space within the city, which informs the concept of a European city especially. The definition of the boundaries between private and “nonprivate” space is grounded in literature, and is evaluated for the EEF models being considered.
The study is based on the assessment of financing models in case studies. The methodology is explanatory, using multiple case study approach, further to Yin’s Chapter 2 Designing Case Studies Identifying Your Case(s) and Establishing the Logic of Your Case Study [9]. Examining contemporary phenomena in their real-world context is an appropriate research method, especially when the boundaries between the phenomenon and context are not clearly apparent.
The paper is organised in the following sections: Section 1 introduction on energy-efficiency finance to fund the retrofit of both buildings and open space, Section 2 pertinent literature, Section 3 methodological commentary, Section 4 review of mature and emerging financing models with analysis of case-projects or programs having implemented the model, Section 5 method of analysis of financing models by private and public energy-efficiency gaps, Section 6 discussion of the case studies scored according to the indicators, Section 7 conclusions about the feasibility of EEF models for managers and policymakers with the limitations for EE projects and programs.

2. Literature Review

Despite the cost effectiveness of EE interventions on buildings and on open space, the pace of adoption stays relatively low. Scholars have defined this phenomenon as an “energy-efficiency gap exists between actual and optimal energy use.” [10,11,12,13].
The gap indicates the span between the amount of investments that, on one side, are technically feasible and costly effective and, on the other, the amount of investments actually occurring. That is, a potential for retrofitting exists with current technologies and costs, but the private and public stakeholders do not profit from it because of barriers. Since the seminal research on barriers in the 90s, a body of knowledge has evolved on the barriers to investments in EE.
The paper distinguishes between two closely related notions of the energy-efficiency gap based on whether they are defined relative to private or social optima.
More broadly, the term “social energy-efficiency gap” is used to encompass energy-efficiency decisions where technologies that would be socially efficient are not adopted.
The private energy-efficiency gap is nested within the scope of the social energy-efficiency gap (Table 1). The paper views the broader social energy-efficiency gap as the appropriate lens through which to evaluate the potential net benefits of government policy, and, therefore, uses the broader definition to define the scope of this review. Hence, the paper follows the convention from previous literature of using the phrase “energy-efficiency gap” to refer to deviations from private, public, or social optimality.
To address the barriers to the retrofit both of buildings and of open spaces, the potential causes for the EE gap are grouped into two main categories:
  • private gap,
  • public gap.
The utter diversity of space typologies is represented through the discontinuous transition between public and private spaces. Smaller cities tend to offer a less diverse range of spaces, while larger cities and metropolises in the higher complex social and economic tissues tend to match everyone’s demands for space.
The definition of the boundaries between private and “nonprivate” space is reviewed in Section 2.3.
The aim is to address the means to grow and care for places in cities, and to span public–private space design and management as an effective methodology to bridge the gap between public and investor finance, shifting from “public spaces”, sometimes neglected, to “buzz” bridged public and private places [14].

2.1. Private Energy-Efficiency Gap

Gerarden et al. [15] define the private energy-efficiency gap as “the apparent reality that some energy-efficiency technologies that would pay off for adopters are, nevertheless, not adopted.” Further to this definition, potential departures from the private optimality become apparent.
According to previous researches, private gaps are due primarily to (a) systematic behavioural biases and to (b) uncertainties or negative externalities of EE and Renewable Energies (RE) projects.
Behavioural biases have been studied by psychology and economics studies. Most cited publications are Van Raaij and Verhallen [16], who recognise five leading behavioural patterns in household energy use-conservers, average users, spenders, cool dwellers, and warm dwellers, for recognising energy bills differing from mean consumptions. Lee and Malkawi [17] developed an agent-based model simulating individual patterns in household energy consumption to forecast demands at a larger scale. Haldi et al. [18] implemented a model to forecast residents’ behavioural patterns in aims and effects of energy uses.
Further influential studies have been Haas et al. [19], Hens et al. [20], Torregrossa [21], and Webber et al. [22].
Haas et al. [19], from the results of an analysis of the retrofit of Austrian single or multifamily homes, assess the rebound-effect in a range from 15 to 30%.
Hens et al. [20] compare direct rebound, the straight cost-benefit relation, between homes, one noninsulated, the other well insulated. Their tests have proven that the benefits of direct rebound are much larger in noninsulated than in well insulated homes, and have been evaluated with a rebound curve function.
Webber et al. [22] have assessed the domestic energy use before and after the retrofitting of 51,000 homes in UK. Their results provide evidence that impacts of retrofit measures have been diminished by performance gaps and rebound effects of 30% or lower. They have appraised a reverse effect on residents’ income: in lower income areas the losses were estimated to be nearly 50%, while in middle and upper income areas the losses were 30% or lower.
EE and RE projects involve uncertainties, negative externalities, and risks. The dimensions of the private gap of EE projects, after Mills et al. [23] and Dunphy et al. [24], affect the (b1) contextual, (b2) technological, (b3) operational, and (b4) measurement and verification risks.
The contextual risks are due to the lack of information about the technical status of the building or of the open space, and/or the insufficient definition of specifications and requirements for the EE technologies or projects.
Retrofit measures are achieved by the installation of hardware. The operational risks are affected by the installation, the performance, and the lifetime. Installation is prone to defects, due to incomplete or poor design, to unskilled workmanship, and to inappropriate or improper materials or components [25]. Performance and lifetime of innovative EE technologies may not be assessed at full-extent, their future maintenance requirements can be costly or uncertain [26]. Further operational risks are due to degradation of energy savings over time because of unappropriated maintenance, and of residents’ “takeback” [19].
EE projects require experts to appraise the physical performance of technologies, in the given built environmental context, and to assess the investment on both the sides of energy demand and of energy supply [23]. To the appraisal of the investment contributes the assessment of the risk, which is sensitive to the nature of both the context and the investors. For private investors, the sensitivity of returns on volatility of energy price is relevant to ascertaining the price for value of the EE project. For public investors, the sensitivity of returns to society are in the form of economic, environmental, health, and other social benefits from reduced energy consumption. For open spaces, Figure 1 outlines various economic costs and values. A number of analysis methods have been developed [27,28,29,30,31,32], to assess uncertainty in EE public investments. Several studies address investment in public spaces [33,34,35,36,37], especially large areas, as parks and recreational trails. Analysis methods for smaller spaces and co-owned spaces have been less deeply developed. [38,39,40,41,42,43,44].

2.2. Public Energy-Efficiency Gap

Scholars have observed a low pace of adoption of EE and RE technology, and have studied the effects of the private energy-efficiency gap (Section 2.1). To fill private gaps and to promote wider EE and RE adoption, government interventions have been studied in the range of policies, legislation, fiscal measures, and financial interventions.
Given the range of public policies, measures, and interventions, factors potentially affecting the departures from the optimal adoption of EE investments should be appraised. For the sake of the present study on financing the renewal of urban areas by means of EE investments, in literature public gaps are due primarily to (c) economic and financial risks, (d) regulatory risks.
Economic and financial risks pertain to (c1) volatility in energy price, (c2) levels and structure of tariff, (c3) fluctuation in interest rates, and (c4) loan default. These risks do not depend on the EE project, thus, they are not controllable within it, i.e., they are extrinsic in nature [23]. Conversely, most of EE extrinsic risks are, to some extent, in the influence of policies, measures, or interventions by public administrations.
Volatility in energy price has negative impact on EE projects. According to standard neoclassical theory, the externalities, like imperfect information or market failures, preclude investors to make rational decisions [44]. Due to the mid-long return of most EE investments in buildings and open spaces, uncertainty about energy price influences savings, and affects the life cycle cost of the project. Thompson [45] and Stevens et al. [46] advocate long-term fixing of energy price to hedge high volatility. In recent times, for speculative and investment purposes, funds have increased interest in energy commodities, i.e., oil and natural gas. Due to the commoditization of energy markets, Cochran et al. [47] argue of the “volatility-generating processes and, in particular, the extent to which these processes are influenced by equity market volatility.” In the aftermath of the economic crisis, the European Commission has strengthened the financial regulation on energy trade, with the aim of steadying the financial markets and constraining the volatility in energy price.
Levels and structure of tariffs on electricity and natural gas contribute to the EE gap, because of divergence of prices from marginal cost [48]. According to Gerarden et al. [15], the “dynamics of electricity markets can cause prices to be below marginal cost, particularly during peak periods. The marginal cost of electricity generation varies over time, and many pricing schemes do not reflect this variation, leading to inefficient utilization decisions.” Energy production and delivery have impacts on the environment. Muller and Mendelsohn [49], and Graff Zivin et al. [50] suggest that these impacts are only partly reflected in the structure of the tariffs, because of incomplete quantitative estimation of the environmental externalities. The accounting of environmental externalities into the tariffs is regulated by the government, anyway their pricing estimation is not apparent, and in certain cases can be already regulated by other policies. Thus, altogether the effect on tariffs may lead to distortions and gaps for EE projects.
Fluctuation in interest rates impacts on the life cycle cost of EE projects. These fluctuations can produce uncertainty regarding the investment capital. For hedging these fluctuations, EE loans can be provided at below-market rates. Golove and Eto [51] and Ruderman et al. [52] ascribe the gap, between market interest rates and the EE ones, to immaturity or lack of competitiveness within EE markets.
Loan default is a further source of risks in EE projects. Kaza et al. [53] have found that in U.S. EE residential mortgages have lower default and prepayment rates. An and Pivo [54] have studied mortgage in green certified buildings: “A hazard model shows green buildings carry 34% less default risk, all else equal. A matched-sample analysis gives similar results. The study attributes the effect to a loan-to-value channel, where risk is lowered by a green price premium. The benefit comes at least partly from the level of green achievement, not only the label itself. Loans on buildings that were green at loan origination have slightly better terms than loans on non-green buildings. That difference is growing over time, but the effect is economically small compared to default risk”. For the French market, Giraudet [55] has confirmed previous authors’ findings: borrowers default less, when borrowing to save energy.
Regulatory risks are attributable to (d1) political obstruction, (d2) conflicting guidelines in the governance structure, (d3) lack of policy coordination, and (d4) changes in policies over time [46,56].
Political obstruction “represents situations where actions—or lack thereof—by government leaders and key policymakers impede efforts to put on the agenda, elaborate, or successfully implement energy efficiency measures, even despite the absence of particular reluctance from industry or consumer groups.” [57].
Conflicting guidelines in the governance structure of decisions in public administration implies a certain degree of overlapping either at level of competencies, e.g., between different ministries or agencies, especially because of the horizontal nature EE policies, and geographically, because of local autonomies that some countries attribute to regions, provinces, and municipalities.
Lack of policy coordination between governance institutions, e.g., the ones considered above, occurs since each can pursue a domain, competence, or interest specific-objectives, and can operate independently, and as such raising inefficiencies or gaps.
Stevens et al. [46] highlighted the uncertain nature of changes in government policies over time, and analysed the gap produced by the upward adjustment in energy rating protocols.
Blumberga et al. [57] applied system dynamics modelling to assess the impact of different policy measures for promoting building renovation at national level.

2.3. Public–Private Space Ownership

The ownership of cities’ spaces has mirrored the increasing complexity of dwelling, social relationships, and business activities, as well as the structuring of the real estate, the finance, and the public policies [58,59]. So, the dichotomy between public and private spaces has been superseded by a range of property and management of spaces: “how difficult it is to categorize a given space as public or private. Even when we start with just two of the three criteria, a complex continuum emerges with plazas at one extreme and private homes at the other.” [60].
The definitions of ‘private space’ and ‘public space’ both encompass a wide body of knowledge, beyond the scope of the present paper. Rather, it is functional, in the context of funding urban retrofit with EEF, to focus our definitions on emerging rights of spaces, namely to ones deriving from the changing boundaries between private and “nonprivate” spaces.
Table 1 summarises the range of property and management of spaces according to Kohn [60], Nissen [61], Carmona [14], and Lippert and Steckle [62]. The Table illustrates the range of ownership of spaces, emerging uses, and consumptions that call for innovative property rights. The private rights of use over public spaces are promising for the renovation by EE funding with relevant social implication.

3. Methodology

The research is managed with an explanatory multiple-case study methodology [63]. This research methodology is adopted to investigate the financing models (Section 4) applied in the context, i.e., in programs or projects that have applied them to a significant extent and/or with relevant achievements. The case study is distinctive to the research, but shares methodologies with all modes of science, namely with: “(a) how to define the ‘case’ being studied, (b) how to determine the relevant data to be collected, or (c) what to do with the data, once collected.” [9].
By studying empirical cases, further to the studies on and achievements of “energy-efficiency gap” (Section 2) the paper aspires to discuss the barriers and advantages of finance in cases of EE neighbourhood or urban projects. Applied to EEF, the case study methodology has been already proposed and tested by De Marco et al. [64], Lam et al. [65], and Novikova et al. [66]. These scholars have accomplished explanatory case studies on EEF to assess the success and failure factors of core features in real projects and programs. Their research is also useful to understand and address strengths and limitations of case study methodology. Finance and urban studies rarely rely on the experimental method [67]. Case study research is commonly employed in various disciplines and practices, e.g., architectural and urban [68].
“Case study is an empirical method that (a) investigates a contemporary phenomenon (the “case”) in depth and within its real-world context, especially when (b) the boundaries between phenomenon and context may not be clearly evident. In other words, you would want to do a case study because you want to understand a real-world case and assume that such an understanding is likely to involve important contextual conditions pertinent to your case” (Yin, 2017).
As one consequence, the expectations in multiple-case study methodology are explicatory, conversely, they are not demonstrative, and neither can they provide proof or evidence of EEF by statistical analysis and generalisation.

4. Bridging the Gap between Public and Investor Finance

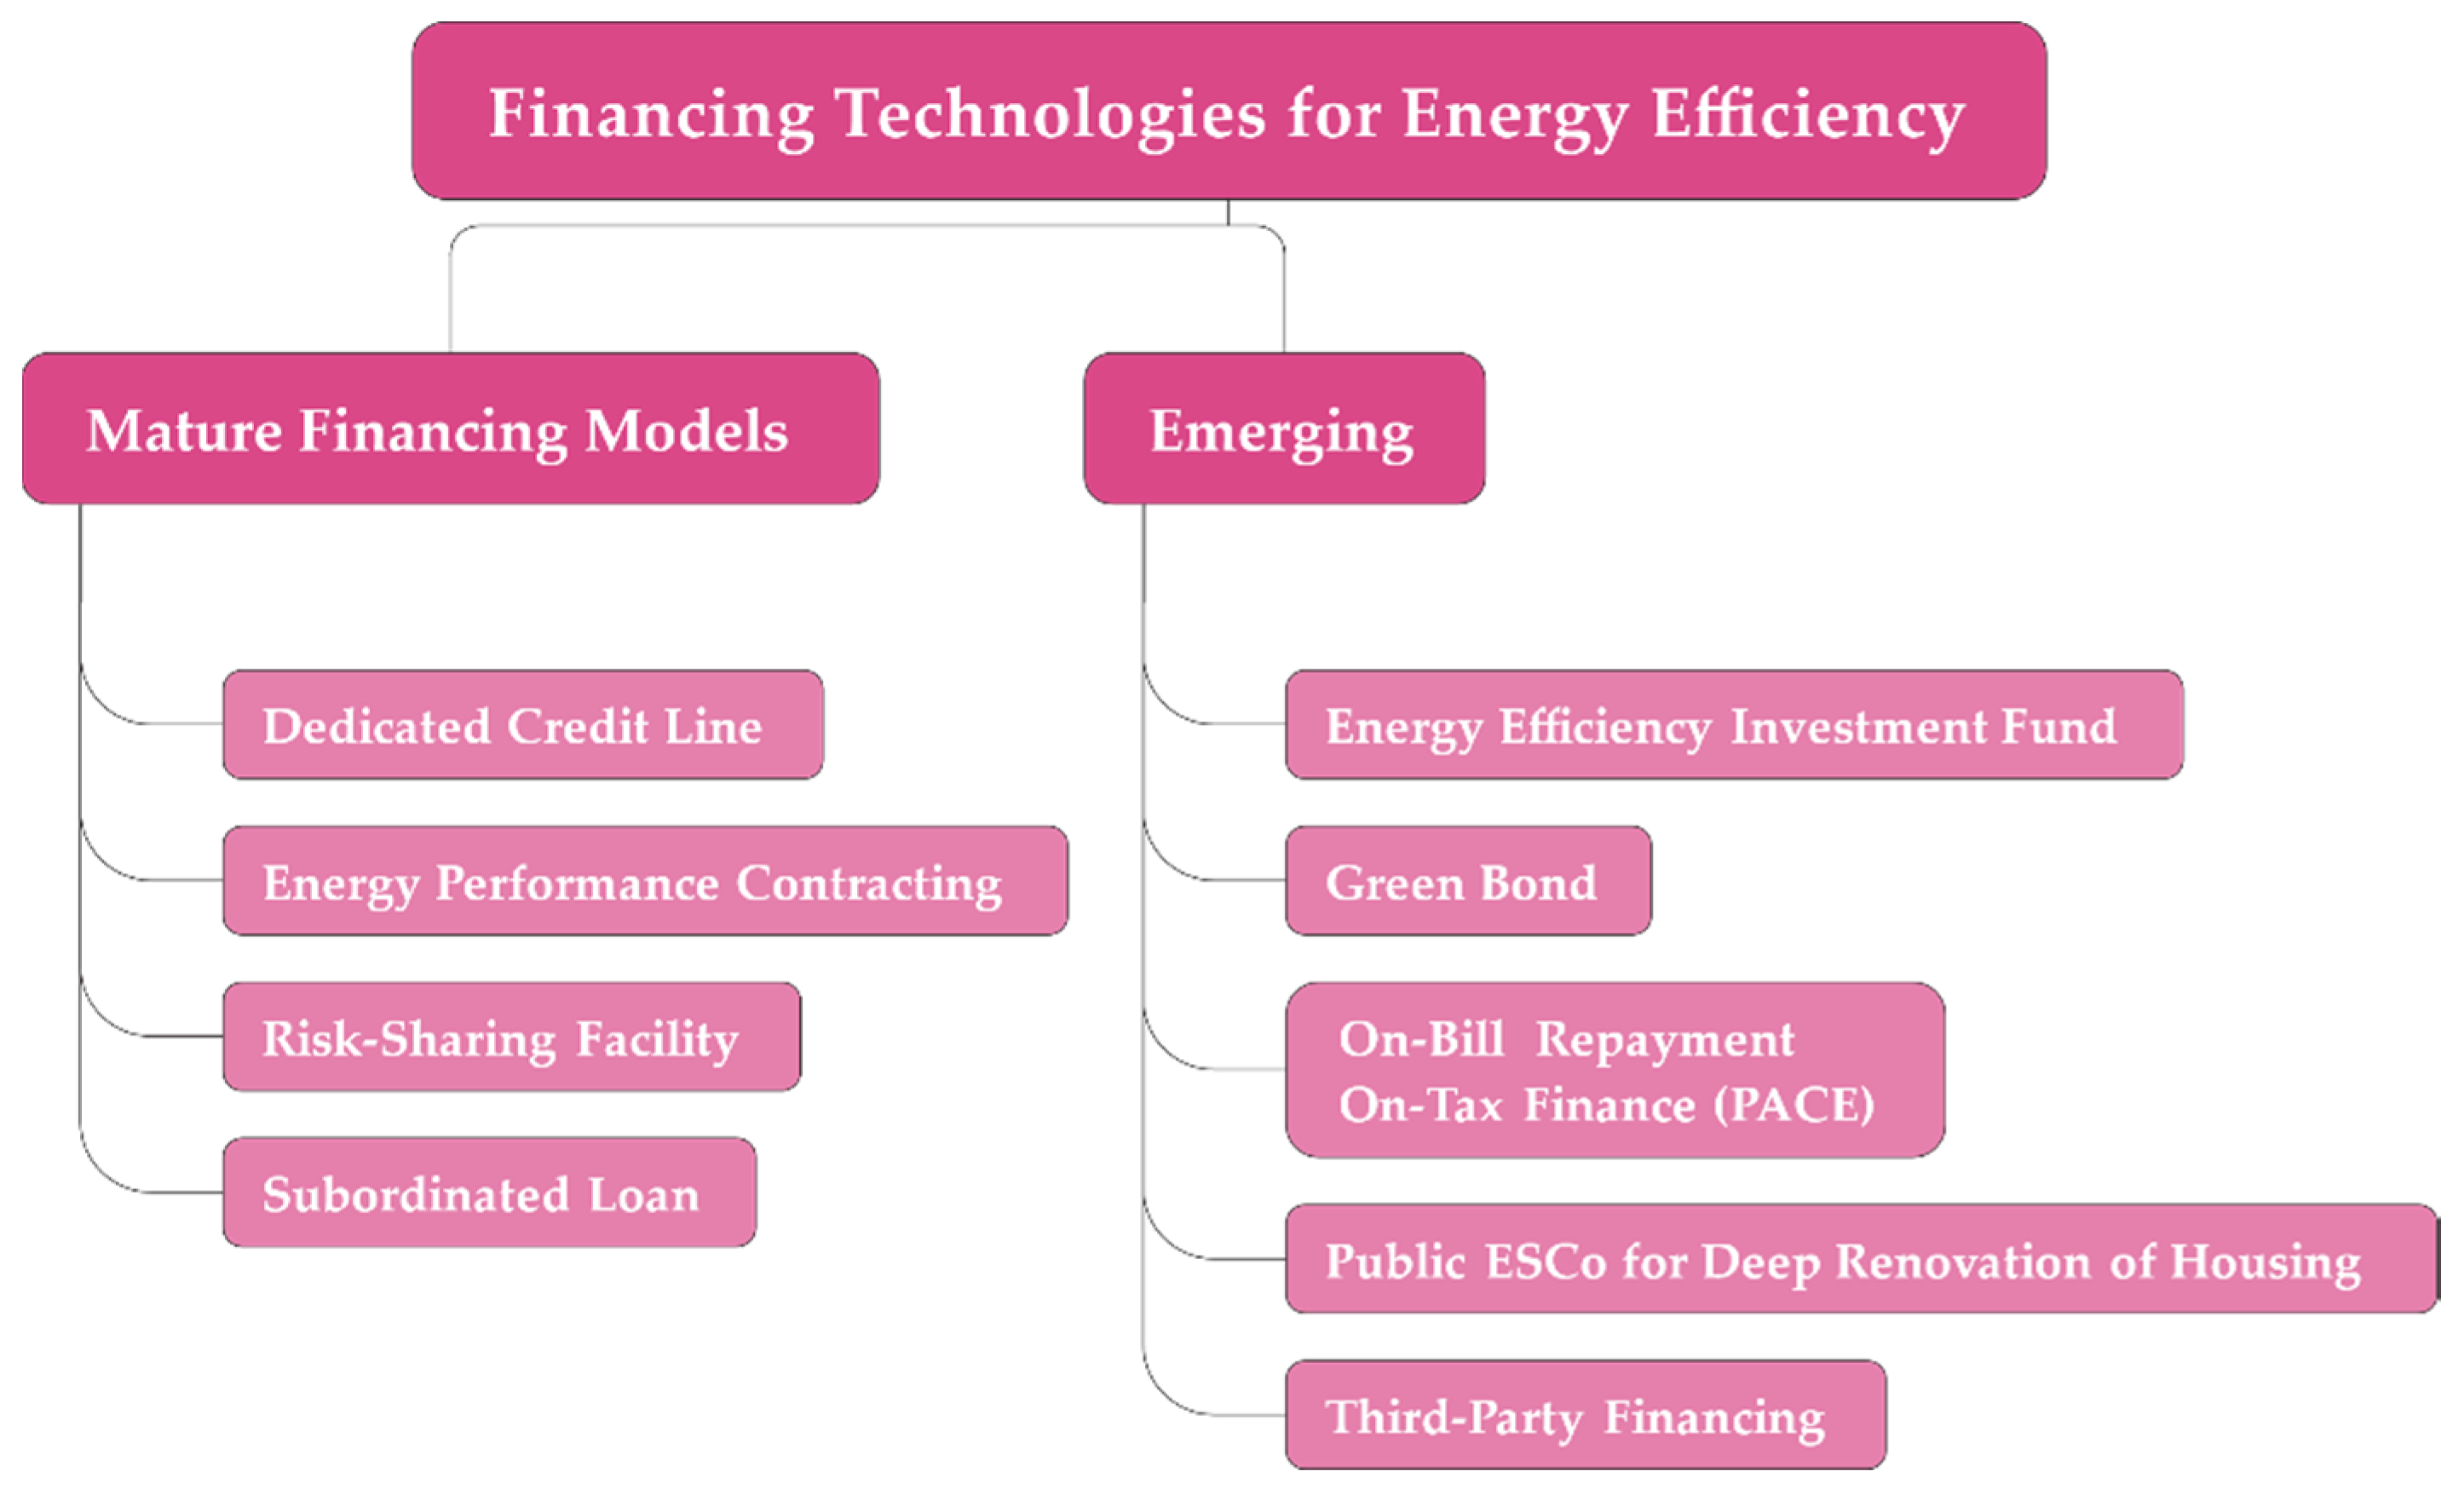
To finance the retrofitting of the building stock, several tools are being developed to fund the investments in EE and RE with the savings on the energy bills. Financial tools have been on the market from the time of the two oil crises in the 1970s, and consist of Covered Bond, Dedicated Credit Line, Direct and Equity Investments, Energy Performance Contracting, Leasing, Risk-Sharing Facility, and Subordinated Loan. Innovative financing models include Citizens Financing, Energy Efficiency Investment Fund, Energy Services Agreement, Factoring Fund for Energy Performance Contract, Green Bond, On-Bill Repayment, On-Tax Finance (PACE), Public ESCo (Energy Service Company) for Deep Renovation of Housing, and Public ESCos for Deep Renovation of Public Buildings (Figure 2) [69].
The schemes assume that net cost of investing in retrofitting the building stock is not only low, but also negative, and can produce profitable returns to the investors. For each financing model, a synopsis of the benefits and gaps summarises the assessments in the literature and in unpublished reports.

4.1. Mature Financing Models

In the first place, mature financial instruments relate to the extent to which the scheme has been used for EEF investments. Besides, the appropriateness of an instrument is somewhat characterised by financial institutions’ (1) liquidity with respect to EE market, (2) expertise in and understanding of EE projects, and (3) maturity to assess risks in EE projects.

4.1.1. Dedicated Credit Line

A public financial institution provides a credit line to private partners, e.g., local banks, ESCos, or developers. Usually they are provided at low interest rates and/or are co-financed, to increase the total amount of the fund available. The agreement between the public and private partners fits local conditions, and reduces delivering time and transaction costs (see Table 2).
“Traditional schemes refer to any loan and soft loan schemes which are attached to conventional repayment methods: that is, a lump sum of money is lent which is then periodically repaid through instalments that cover interest and principal over a fixed period of time. Repayments can also take the form of energy performance contract bills, property tax and utility bill.” [70].
Case study: Germany KfW, government-owned development bank, provides credit lines for EE funding in renovation and construction with long-term and low-interest loans.
Case study: France, with the Éco-prêt à taux zero, the zero-rate loans are funded by the government through a tax credit scheme delivered with partner banks.

4.1.2. Energy Performance Contracting

Energy Performance Contracting (EPC) is a contractual arrangement between the beneficiary and the provider (usually an ESCo) of an EE improvement intervention, where investments in that measure are paid for in relation to a contractually agreed level of EE improvement. As the guarantor of the savings, the provider remains involved in measuring and verifying the savings throughout the contract term and the debt repayment period. EPC can be connected to conventional loan vehicles as repayment mean (see Table 3).
Case study: The Energy Saving Partnership in Berlin is one of the most successful EPC initiatives in Europe. In 1992, it was established as a partnership between the Berlin Energy Agency and the Berlin’s Senate Department for Urban Development. The partnership acts as an intermediary: it offers to public estate owners (1) technical support on a comprehensive set of measures, e.g., refurbishment, heating, illumination, automatic control, energy management, (2) financial assistance with regard to the EPC tendering procedure, and (3) pooling together several public buildings (e.g., schools, nurseries, universities, prisons, offices, and so on), to achieve critical mass, to reduce the transaction costs, and to include less profitable buildings in the tender. The ESCos undertake the upfront investment into the set of measures, and recover the investments through the ‘guaranteed’ cost savings over the lifetime of the contract, usually 12–15 years. The Partnership has estimated the energy savings at, on average, 26% [71]. Since 1992, 26 energy partnerships have been tendered, operated by 16 different accredited ESCos, with 100 subcontractors in the EE works.

4.1.3. Risk-Sharing Facility

To circumvent the perception of risk in EE investments, the risk-sharing model in the form of loan guarantees or risk incentives partially assumes the customer credit risk. Removing part of the uncertainty, it can increase the leverage of private finance, and can involve new actors in financing investments. The risk-sharing facility comprises a public partner that will guarantee all or some part of the risk, a local financial institution that provides loans and energy efficiency project developers in need of project finance [72] (see Table 4).
Case study: The Commercialising Energy Efficiency Finance (CEEF) Programme was launched by the Global Environment Facility and the International Finance Corporation with the participation of 14 banks, 41 project developers, and ESCos from Czech Republic, Estonia, Hungary, Latvia, Lithuania, and Slovakia. The Programme financed over 700 renovation projects, mainly large multifamily residential buildings built during the USSR era.
Case study: The Risk Sharing Facility of the European Investment Bank delivers a guarantee scheme with a bilateral loss-sharing arrangement with partner financial institutions, for reimbursing financial institutions up to the 50% of losses incurred on a portfolio of EE loans.

4.1.4. Subordinated Loan

Subordination refers to the order or priority of pay back: subordinated loans are repaid from project returns once all the operating costs and the senior debts have been refunded. Because the loan repayment is subordinated to the senior equities, it is provided on a ‘first loss’ basis, therefore, it mostly may be available from finance companies, insurance companies, debt funds, or to institutional investors by high-yield bonds (see Table 5).
Case study: The European Local Energy Assistance (ELENA) and the European Energy Efficiency Fund (EEEF) are joint initiative by the European Investment Bank and the European Commission. They reduce the risks for investors by covering part of the risk on payment defaults by guarantees, and are combined with dedicated credit lines (Section 4.1.1). They provide grants for technical assistance and for EE project implementation costs.
Case study: Subordinated loan has been applied by the Agence de l’Environnement et de la Maîtrise de l’Énergie (ADEME) to fund projects on building retrofit.

4.2. Emerging Financing Models

So far, combined financial and policy efforts have been insufficiently effective at raising the rate of refurbishment of the building stock. The quest for innovative financing models for EE interventions has gained momentum. Mature financing instruments have proved their limitations, particularly in dealing with the large investment demand to institutional investors and with the complexity and small size of most residential projects. Furthermore, innovative schemes are expected to foster larger involvement of private capitals in EE measures.
Deep renovations in the residential sector have proven quite unattractive to private banks, because of their medium to long repayment period, the specific and complex know-how they require in their assessment, and the administrative costs for banks, due to their size and amount.
The paper considers some emerging financing schemes, expected to improve over mature ones, being more appealing to both capital investors and real estate owners.

4.2.1. Energy Efficiency Investment Fund

Dedicated energy efficiency funds are one of the models that are implemented through investment instruments. They mainly provide medium- and long-term loans at low interest rates, because they are aimed at the renovation of buildings, and are granted mainly to third-party investors or building/home owners. They are attractive to Socially Responsible Investing (SRI) and to financiers committed in gaining exposure to energy efficiency market. For SRI Halcoussis and Lowenberg (2019) [73] state “Portfolios based on environmental, social and governance criteria typically allocate their investments based not exclusively on traditional metrics such as market value, revenue or dividends, but also on how a company performs in terms of environmental, social and governance (ESG) policies”. EE Funds assure the critical financial mass, absence of which creates obstacles to energy efficiency investments, particularly in residential and commercial buildings due to complexity, spread, and small size of the projects (see Table 6).
Case study: The German National Action Plan on Energy Efficiency (NAPE) [74] foresees an innovative approach to integrate EEF and interventions for entire neighbourhoods.

4.2.2. Green Bond

Green bonds and citizens financing are emerging financial instruments with specific potential in specific buildings sectors: The market for green bonds more than tripled in 2014 to $35 billion and has provided some of the world’s leading bond issuers the opportunity to mainly refinance their green commercial real estate. The more precise the definition of “green commercial real estate” is and the greater the number of issuers, the stronger the knock-on impact will be on energy efficiency investing in the commercial and potentially public buildings sectors. Citizens financing has a high profile (in Germany particularly) for renewable energy or high-profile development projects and is being adapted for energy efficiency investments in multifamily homes and schools, yet needs time to gain critical mass (see Table 7).
Case study: Michelsen et al. [75] currently do not consider them an option for buildings. Economidou et al. [70] consider Property Assessed Clean Energy (Section 4.2.3) as “specific bonds offered by municipal governments to investors. The governments use the funds raised by these bonds to loan money towards energy renovations in residential or commercial buildings.”

4.2.3. On-Bill Repayment and On-Tax Finance (PACE)

On-tax finance has been introduced in the U.S. to allow municipal authorities or financial institutions to get paid back the loan to retrofit a building through the local taxes paid by the owner or tenant (see Table 8).
Case study: The Property-Assessed Clean Energy (PACE) is different model of on-tax-finances, and applied in 26 US States. Owners can apply to PACE: it covers 100% of the EE project costs that are financed within up to 20 years by an assessment added to the property’s tax bill.
On-bill repayment allows owners and tenants to access loans for energy efficiency investments without up-front costs. The improvement measures are typically financed by the utility company or a third-party institution, where the refunding automatically charged on the electricity bills for the property.
Case study: On-bill repayments were a major part of the ‘Green Deal’ in United Kingdom. Green Deal started operations in 2013, to finance EE measures in buildings through a loan. The refunding was automatically charged on the electricity bills for the property. It was dismissed in 2015, because it was not subscribed on a large scale [76,77].

4.2.4. Public ESCo for Deep Renovation of Housing

Financing deep renovation of buildings raises long payback periods, usually 15 or 20 years, which cannot easily be met by a private financial institution, due to liquidity, profitability, and risk. Consequently, public ESCos are established, as a means to provide consultancy, engineering, and financing to the owners (see Table 9).
Case study: Energies POSIT’IF is a public–private company, established in 2013 by the Ile-de-France Region with Caisse des Dépôts et Consignations and Caisse d’Epargne, to foster the deep renovation of residential and public buildings through integrated technical coordination of interventions with financing directly provided.

4.2.5. Third-Party Financing

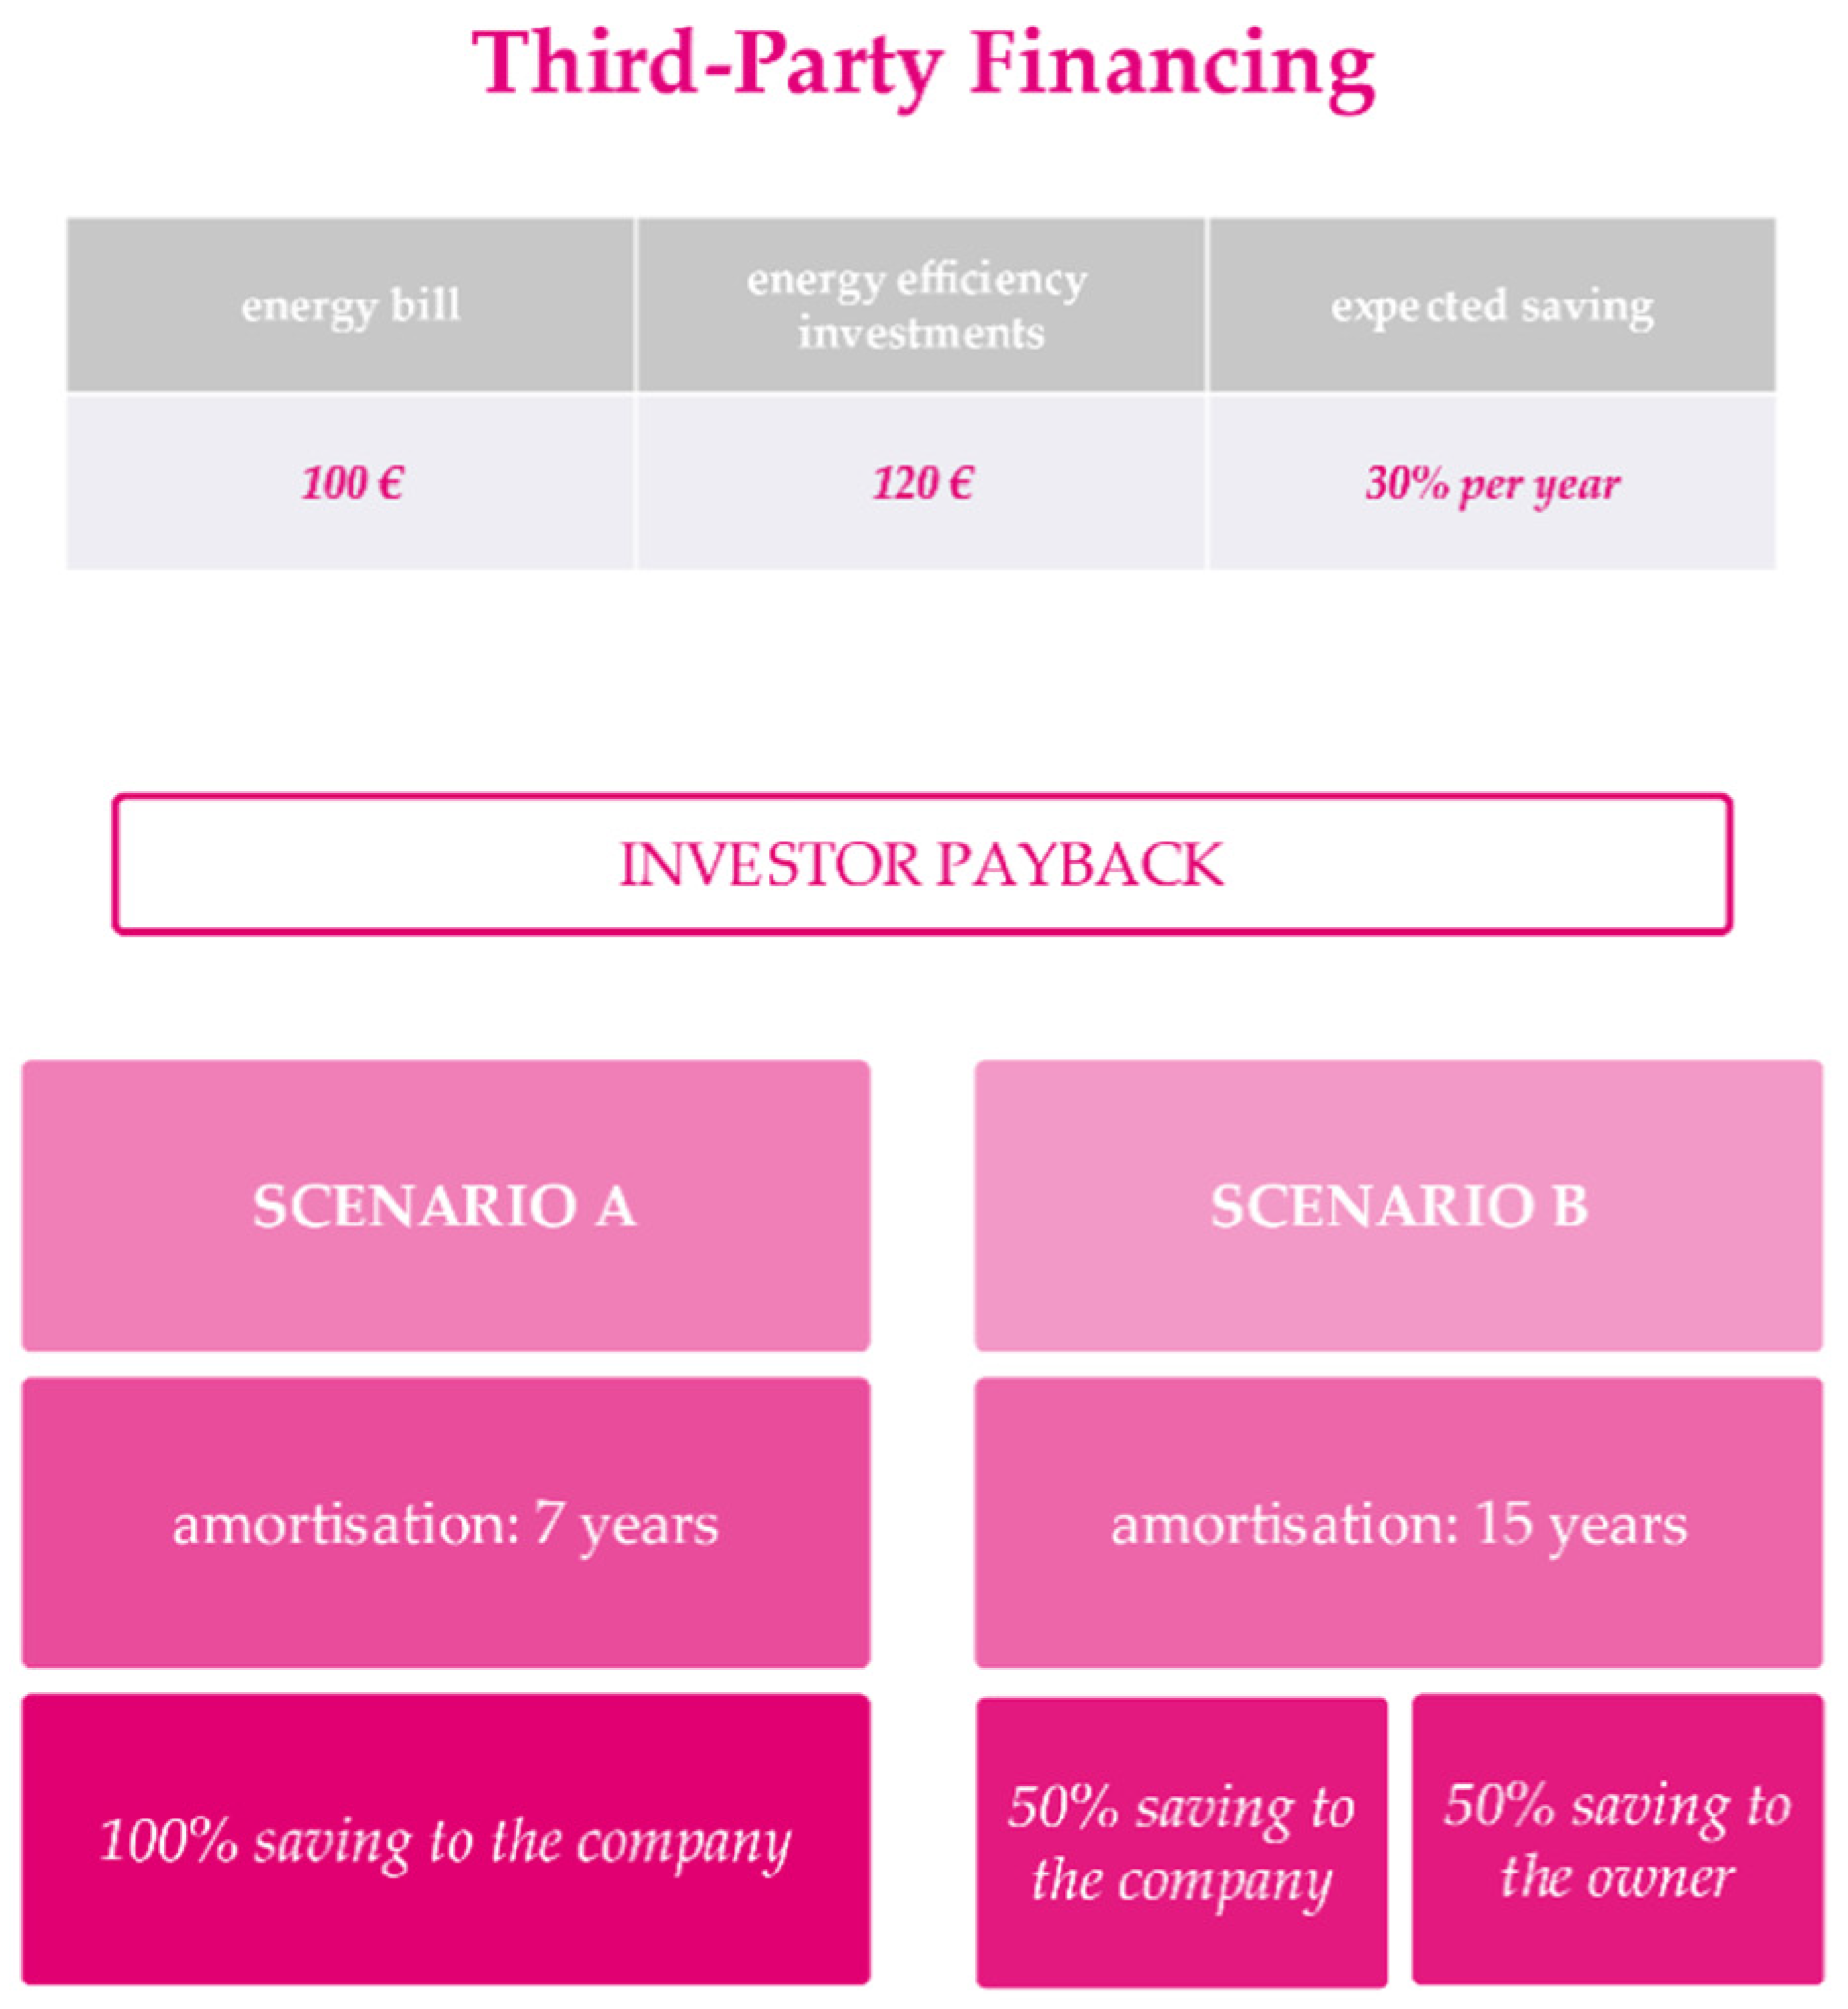
Third-party financing provides up-front capital for the interventions. There are two leading models, depending on which party borrows the money and takes the risk of the intervention: the building owner or the ESCo [78,79]. In the first model, the building owner gets the debt financing from a financial institution, and takes the risk of not achieving the energy savings. In certain arrangements, the owner’s risk may be backed by an energy savings guarantee agreement with the ESCo. In the second one, an ESCo borrow the financial sources for EE interventions, and claims the future energy savings. Either the ESCo or the financial bank takes on the risk of not achieving the expected savings (see Figure 3 and Table 10).
Case study: The City of Berlin in 1994 developed an energy plan with the aim of promoting rationalisation of energy use, of improving energy-efficiency, and of extending the adoption of renewables. The EE project was estimated to cut the energy consumption by 25%, with an investment of about 0.5 billion euros. Because of financial restrictions, a public-private partnership was implemented, by means of energy performance contracting (Section 4.1.2) and of project financing from third-parties.
Case study: Mayor of London’s Energy Efficiency Fund (MEEF) was established in 2018, and provides finance, with a range of funding options, through a consortium of funders. The consortium includes financial institutions, to provide third-party financing. The Fund invests with rates as low as 1.50% for up to 20 years, and is made available to subsidise on a project’s business case.

5. Method of Analysis

The studies on private and public energy-efficiency gaps (Section 2.1 and Section 2.2) define sound methodologies for assessing the mature and emerging financing models that have been considered in Section 4.1 and Section 4.2.
To ease the practical comparison between the different financing models, the benefits and gaps, highlighted for each one, have been translated into seven criteria.
The methodology for defining the criteria builds on EE indicator analysis, developed by the European research project ODYSSEE-MURE [80,81].
The ODYSSEE-MURE project has defined a set of indicators to examine and compare EE benefits. Their methodology for the selection of the indicators grounds on “a trade-off between comprehensiveness and practicality in view of data availability and the complexity of modelling. Thus, we have chosen the indicators in such a way that they can shed adequate light on as many of the aspects as possible without, however, requiring great efforts in terms of data collection and very elaborate methods and/or modelling.” [81].
Table 11 lists the proposed indicators for assessing the financing models, structured according to the analysis of energy-efficiency gaps into four main categories, namely (a) systematic behavioural biases, (b) uncertainties or negative externalities, c) economic and financial risks, and (d) regulatory risks.
The case studies, considered in 4. Bridging the Gap between Public and Investor Finance, have been scored according to the indicators at Table 11. The analysis has been performed in five phases.
(a)
The author has analysed existing databases to identify case studies matching the financing models and the intervention on public–private spaces. The databases are the MURE on energy efficiency policies [82] and the Energy Efficiency of the International Energy Agency [83].
(b)
Individual members of the Institutions’ staff, listed at Section 4, were requested to fill in an anonymous web survey. In the survey, they were asked to score each indicator in the 2nd column of Table 11, according to the predefined range in the 3rd column of Table 11.
(c)
The author has reviewed the results of the survey to check the internal validity of the scores, i.e., appropriateness in scaling, completeness in the answers, and the apparent coherence within the categories. Different experts should score the indicators in a similar way. The goal is to minimize errors and biases in case study.
(d)
In case of internal or reliability inconsistency, clarifications have been requested to the Institution at Section 4. or a third-party expert has provided an independent evaluation.

6. Discussion: Implications for Financing Interventions on Cities

6.1. Multidimensional Comparison of Financing Models

The results of the scores for the indicators at Table 11, applied to the Case studies at 4. Bridging the Gap between Public and Investor Finance, are shown in Table 12.
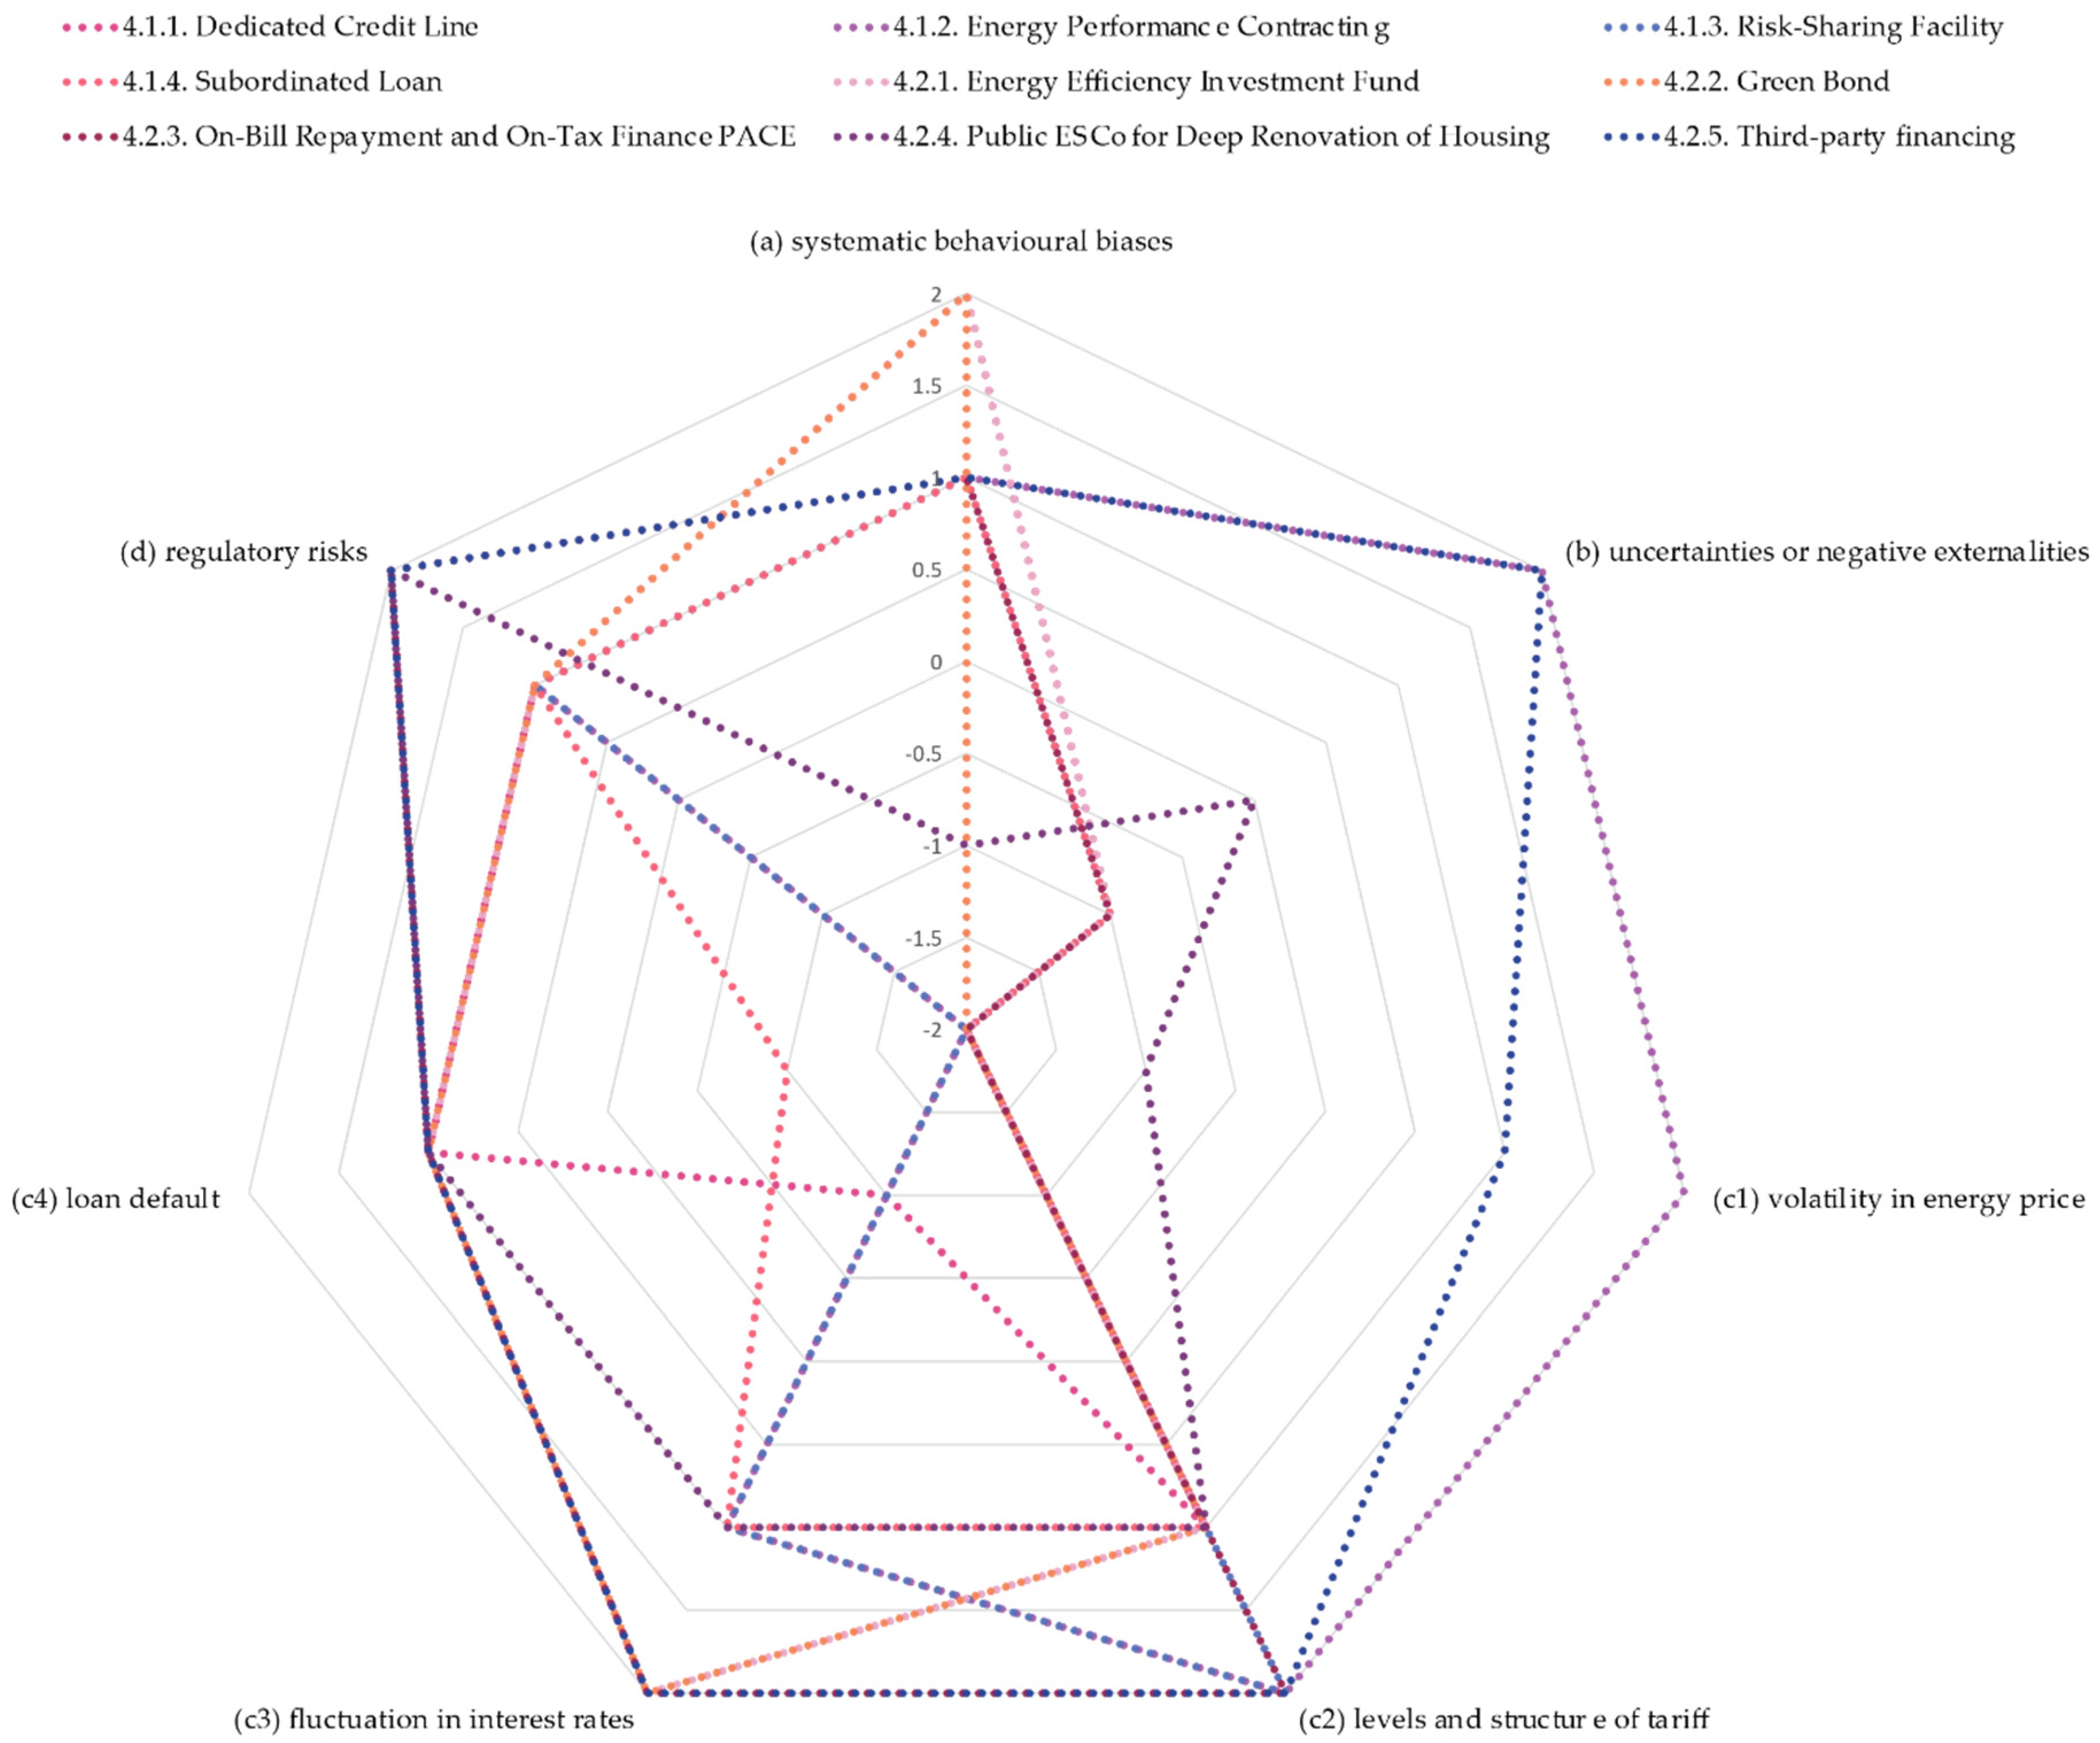
The scores have been depicted in the radar chart at Figure 4. The cases are grouped into the corresponding financing model, namely Section 4.1.1: Dedicated Credit Line, Section 4.1.2: Energy Performance Contracting, Section 4.1.3: Risk-Sharing Facility, Section 4.1.4: Subordinated Loan, Section 4.2.1: Energy Efficiency Investment Fund, Section 4.2.2: Green Bond, Section 4.2.3: On-Bill Repayment and On-Tax Finance PACE, Section 4.2.4: Public ESCo for Deep Renovation of Housing, Section 4.2.5: Third-party financing.
Each indicator is represented by one dimension, and the distance of each criterion, along that dimension from the centre point, is proportional to its score. The overall performance of the case projects in each financing model, across all the seven indicators, shapes a polygon. To ease the association of the financing models to the polygons, they are represented in different colours.
From Figure 4, the absolute benefits and gaps of each financing model can be tracked, and the relative benefits and gaps can be comparatively observed.
The economic and financial benefits and gaps are depicted at the lower side of the radar chart. Under these aspects, Section 4.1.1, Section 4.1.3 and Section 4.1.4 performs better, while Section 4.1.2, Section 4.2.3 and Section 4.2.5 especially are exposed to higher risks and volatilities. Within them, Section 4.1.2 and Section 4.2.5 involve the highest uncertainties and negative externalities among the financing models considered in the present paper.
Section 4.2.2 and Section 4.2.4 perform better than the other models for opposite reasons. Green Bonds are market-oriented models, offered by financial institutions or governments. They match the expanding investors’ demand for greener assets, despite the often high uncertainties, negative externalities, and volatility inherent in energy price. Public ESCo for Deep Renovation of Housing provide an alternative to the gaps of several financing models, especially the ones arising from deep renovations, especially due to the diverging requirements by the required long-term investments and the short-term on return of homeowners and of investors.
To this aim, governments assume the role of facilitators, stimulating both the demand from the homeowners, and the supply of long-term third-party financing (Section 4.2.5), granting low interest rate loans, guarantee funds or risk sharing facilities (Section 4.1.3).

6.2. Suitability of Model to Finance EE Projects on Public–Private Spaces

The MURE database on energy efficiency policies and the Energy Efficiency Database have been investigated for EE projects matching the set of ownerships of urban spaces at Table 1.
Clearly, in the databases the measures on the private range of spaces are the most represented, the private/public and the public instances are quantitatively less present. Because of this initial disparity, instead of normalising the number of occurrences on a scale, it has been considered more meaningful to rank the projects as just evident or unevident.
The absence of a case for a specific instance of space ownerships in the databases is not a proof of its unsuitability to the financial model, instead it represents a track to a successful use of that model.
The occurrence or not of the financing models, applied to the range of ownerships of urban spaces, has been listed in Table 13.
Just two of the investigated financing models, namely Section 4.1.1: Dedicated Credit Line and Section 4.2.2: Green Bond, appear to have been used to finance projects on public spaces. The two databases have not been expressly conceived and maintained for projects on public spaces. Further investigations for the space instances not appearing in the databases are required.
Further research on EE funding of intervention on public–private spaces is required to coordinate the piecemeal of measures. The whole of the series of pinpointed built and green interventions should be coordinated to shape a green network system of space patches, and to bridge the gap between public and investor finance effectively.
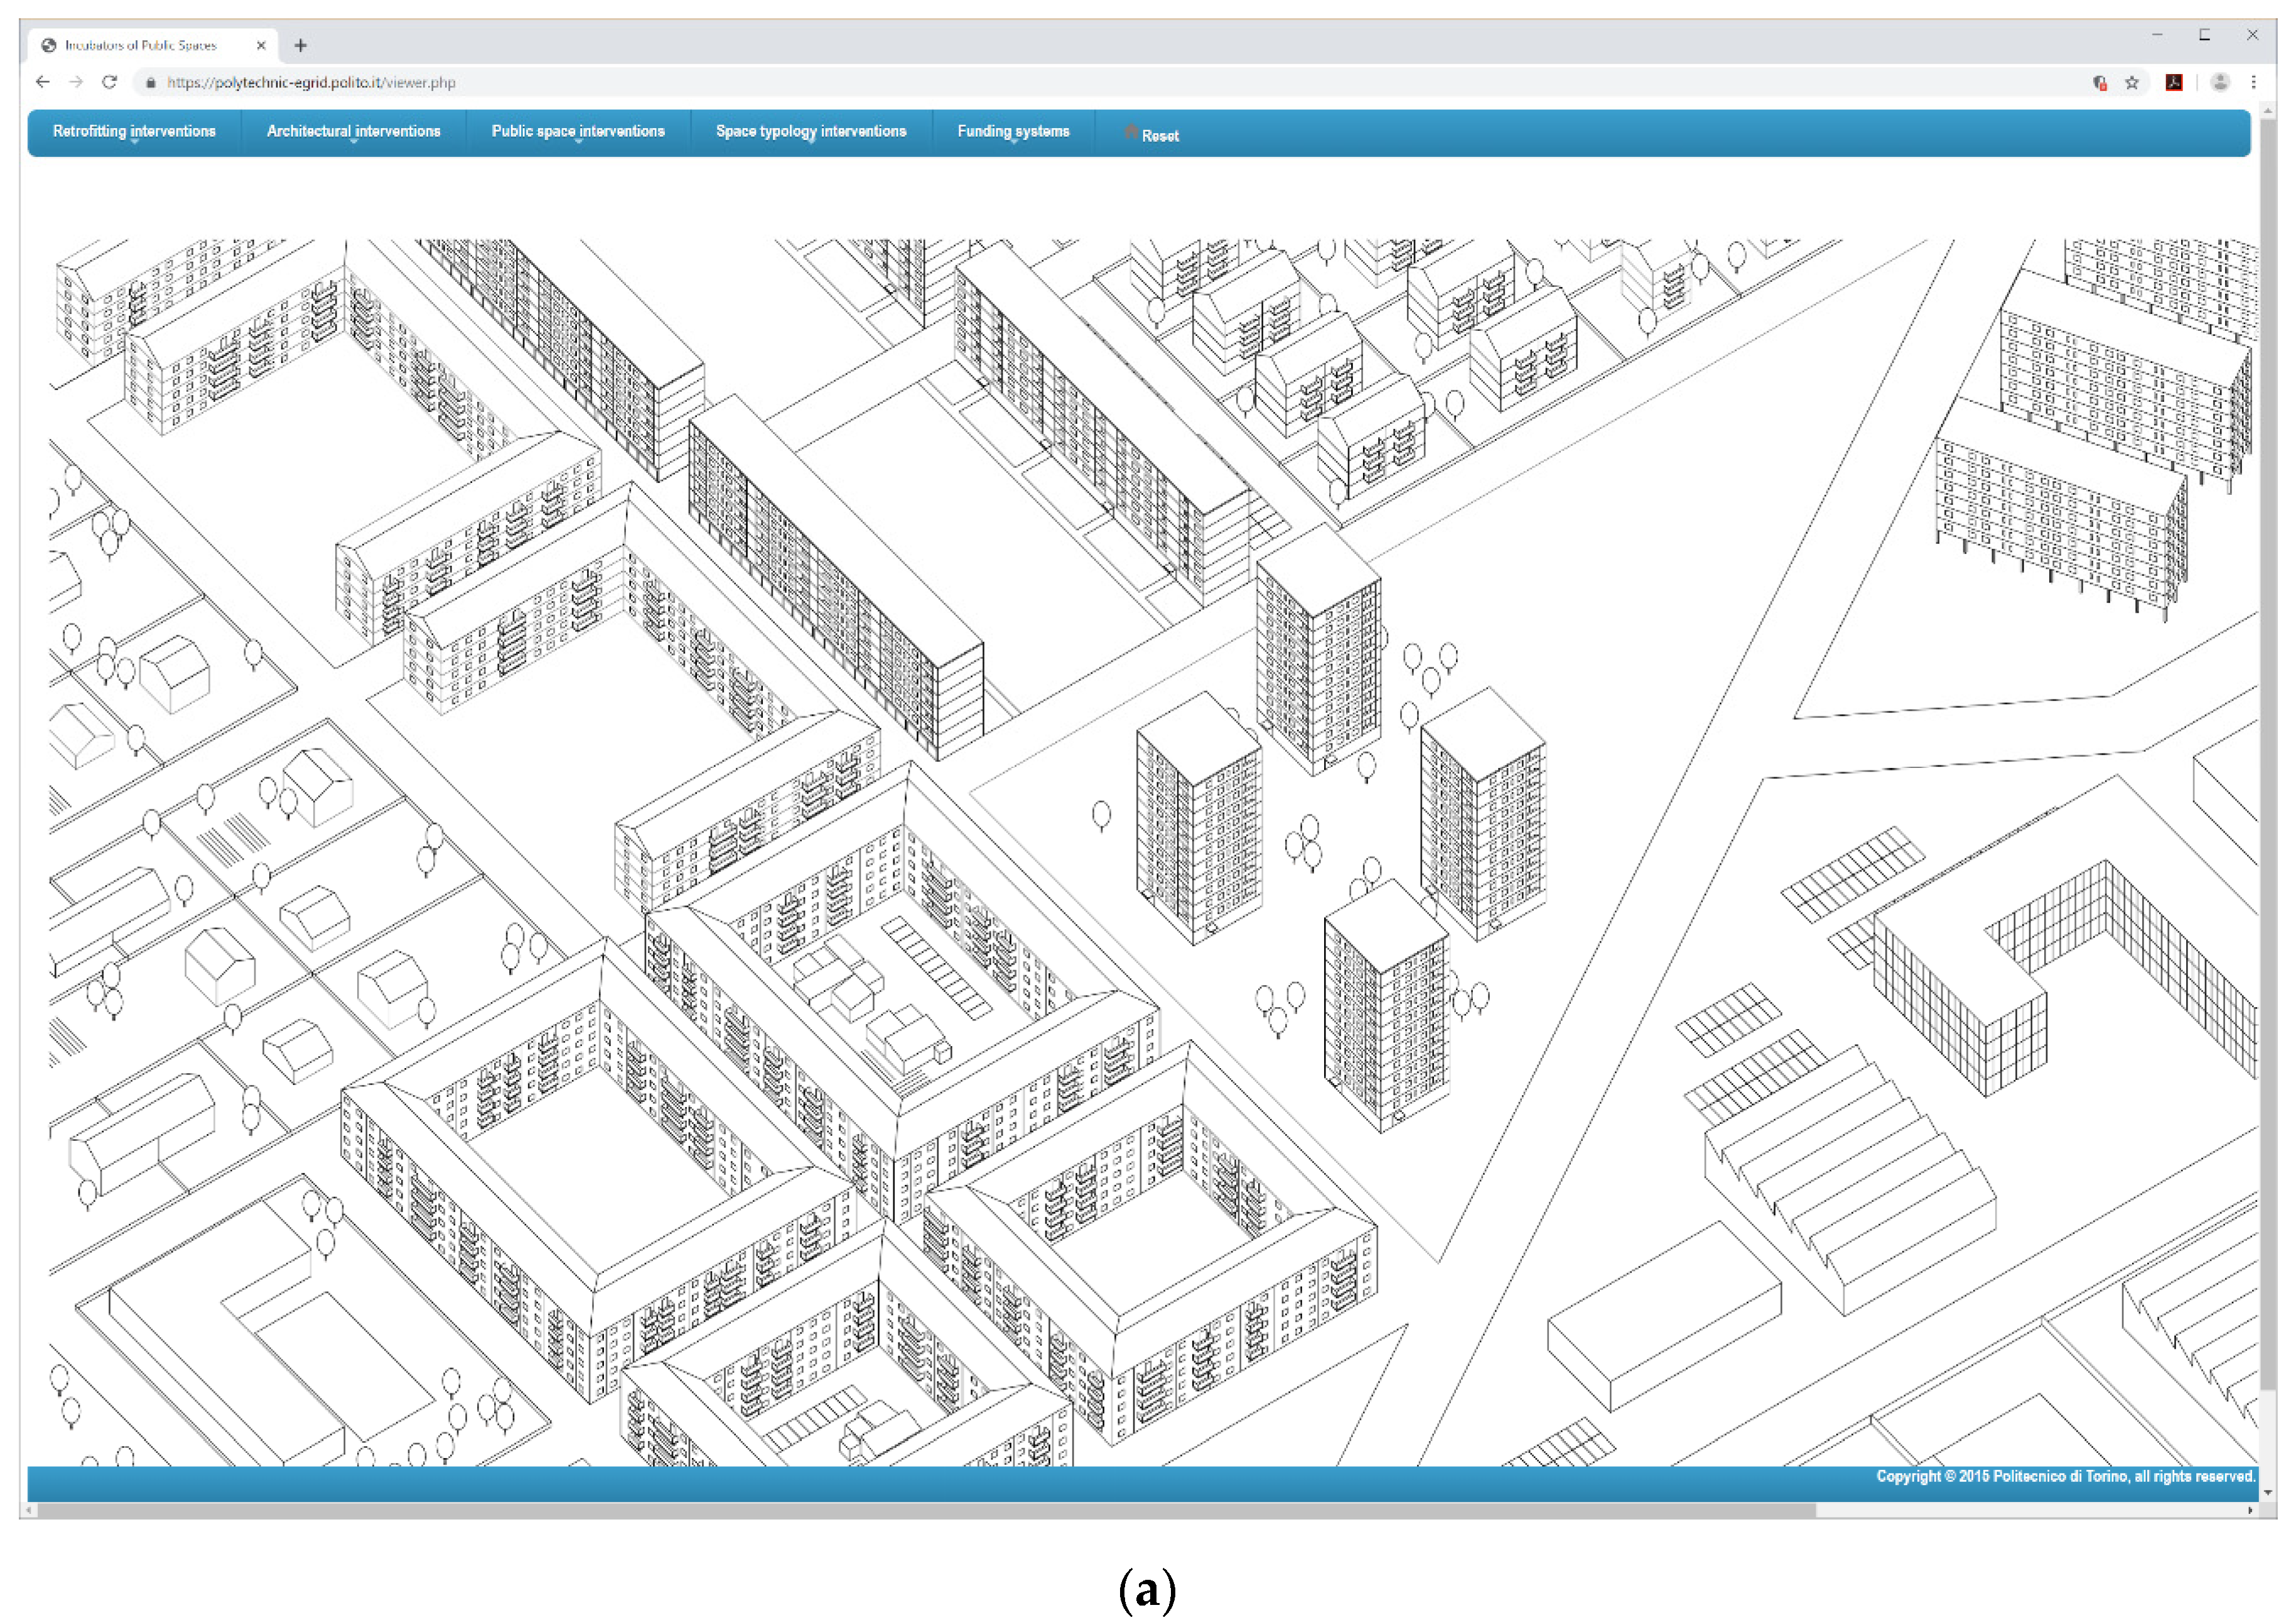
The European Research Project Incubators of public spaces [84] has addressed public-private space interventions, to recombine segments of public and private areas, built and open spaces, and new or retrofit interventions. The interlinked public-private space interventions, funded by EEF, span different scales: building, plot, block, and neighbourhood. The EE projects can densify the urban tissues, and intensify-diversify the activities: house/office/commercial extensions/insertions, upward extensions, sunspaces on top or on façade, envelope retrofit, re-cladding. They are especially able to intertwine urbanity and nature, at times reclaiming the demolition or refunctionalisation of different typologies of buildings (housing and office blocks, houses, factories), at times fostering a series of pinpointed interventions of various scales and budgets, urban hybrids of built and green. The Research Project has implemented an online, interactive visual synopsis of the possible interventions [85], grouped according to suitable EE financing models (Figure 5). Figure 5a represents main typologies of buildings across European cities, as categorised by the EU Tabula Project [86]. The Figure does not represent a portion of a real city, rather it makes apparent the patchwork of various urban tissues most recurring across Europe. Figure 5b illustrates the interaction of a user with the website: pull down menus offers EEF models suitable for the typologies of buildings and of open spaces. The user’s choice/s of EEF model/s pops up in the various urban tissues.

7. Conclusions

The study produces scientific and applied outcomes.
From a scientific perspective, it fills a gap in the EEF field of study, reviewing financing models, and assessing their suitability for funding the regeneration of cities, buildings, and open spaces. The paper identifies barriers to the deployment of EE technologies at a large scale. The paper advances a qualitative methodology for assessing EEF case projects, comparing them, and highlights the barriers to technically feasible and cost-effective investments that private and public stakeholders do not make use of. While a large body of knowledge exists on EEF of buildings, the paper advances EEF studies for public and private spaces. EE investments in open spaces goes along with the consolidated fields of studies in public spaces, especially parks and recreational trails, and in co-owned spaces, namely community interventions.
From an applicative perspective, the study deepens the increasing complexity of ownership of open spaces, emerging uses and consumptions that open the door to new financing models. For renovation by EEF, private rights of use over public spaces are especially promising.
The public–private, often multistakeholder partnership has business, policy, governance, and planning implications.
EEF can be a driver, on top of which is required a comprehensive business model quantifying the values specific to (a) EE, i.e., fossil fuel depletion, energy security, lower energy bills, and operating costs, (b) environmental externalities (Figure 1), (c) built fabric, and (d) human anthropic activities.
In addition, this matches participatory design and living lab that can contribute to making cities more liveable, and increasing ownership of open spaces, trust in decisions, and stewardship of public administrators.
The study may assist investors, stakeholders, and policymakers in gaining insights into financing models leveraging public-private collaborations at a neighbourhood or urban level. These models can involve a large number of owners and for this reason are challenging from both the scientific and applicative point of view. This goal can be achieved fostering citizens’ self-organisation in the financial support to the transformations, using the leverage of EE funding, the leading financial opportunity nowadays available [87]. Further self-organisation is through active participation; the stakeholders’ ability to orient dynamically towards shared objectives is encouraged. González-Ruiz et al. [88] have highlighted financing models based on public investment, e.g., state grants funded by taxation are no longer appropriate to address the present needs for EE projects, while innovative financing models are required.
The methodology presented in the paper is qualitative; the survey and the study gather an expert pool’s evaluation of the suitability degree for a specific financial tool against gaps recognised in the literature at Section 2.
Inherent to the methodology adopted, in the literature [89,90] it is recognised that respondents to the survey, who have been involved in the design or management of a specific measure, may have developed a positive bias towards it. To overcome this recognised drawback, the study has assigned the assessment of the measures to a pool of experts and the author has reviewed the individuals’ scores to minimize errors and biases in the study.
Main challenges to the study are raised by the lack of extensive and detailed databases of measures on both the built environment and the open spaces. While a large number of papers deals with descriptive single case studies, there is an acknowledged lack of comprehensive studies on EEF mechanisms in general [8] and specifically on open spaces.
The synergy between the EEF and the renovation of cities is a strong opportunity that matches the growing amount of climate finance. However, structural factors can undermine the effort:
  • The trend towards private ownership status to the detriment of the public one in investments.
  • Besides the barriers already considered, the ways and means to access EEF can disadvantage smaller or less proactive public administrations.
  • In leveraging private funding, local governments may struggle to get the investment levels required to finance their measures at reasonable costs.
  • Financial institutions are reluctant to invest in new domains, especially if the returns are not clearly envisaged in a business model, and the renovation of open spaces is among them.
None of the above factors is explicitly assessed in the present study, although they are relevant for public agencies to fund and to make viable retrofit projects. Future research is directed at extending the present study towards the above factors and towards further financing models especially suitable to renovation of cities.
The study considers a variety of financial models; the ones highlighted in Table 13 have proved especially viable to:
  • finance the mutual regeneration of buildings and of open spaces,
  • assist local administrations in leveraging resources,
  • manage the constraints coming from the Stability Pact for administrations affected by structural problems or distortions,
  • improve the administrations’ creditworthiness,
  • collect upfront capital for projects with long return-on-investment period.

Supplementary Materials

The following is available online at https://polytechnic-egrid.polito.it/viewer.php online interactive tool to shape retrofitting interventions improving the urban tissue (Figure 5).

Funding

This research was funded by the Joint Programming Initiative Urban Europe, grant number 414896.

Acknowledgments

I am grateful to Federica Bonavero for the Figure 4b and Figure 5a, and to Carolyn Winkless for checking the English and the list of references.

Conflicts of Interest

The author declares no conflict of interest.

References

  1. Cao, X.; Dai, X.; Liu, J. Building energy-consumption status worldwide and the state-of-the-art technologies for zero-energy buildings during the past decade. Energy Build. 2016, 128, 198–213. [Google Scholar] [CrossRef]
  2. Foxon, T.J. Energy and Economic Growth: Why We Need a New Pathway to Prosperity; Routledge: New York, NY, USA; London, UK, 2017. [Google Scholar]
  3. Intergovernmental Panel on Climate Change (IPCC). Special Report on the Impacts of Global Warming of 1.5 °C Above Pre-Industrial Levels and Related Global Greenhouse Gas Emission Pathways, in the Context of Strengthening the Global Response to the Threat of Climate Change, Sustainable Development, and Efforts to Eradicate Poverty; IPCC: Geneva, Switzerland, 2018. [Google Scholar]
  4. European Environment Agency. The European Environment State and Outlook 2020; European Environment Agency: Copenhagen, Denmark, 2020. [Google Scholar]
  5. Santamouris, M.; Synnefa, A.; Karlessi, T. Using advanced cool materials in the urban built environment to mitigate heat islands and improve thermal comfort conditions. Sol. Energy 2011, 85, 3085–3102. [Google Scholar] [CrossRef]
  6. Falasca, S.; Ciancio, V.; Salata, F.; Golasi, I.; Rosso, F.; Curci, G. High albedo materials to counteract heat waves in cities: An assessment of meteorology, buildings energy needs and pedestrian thermal comfort. Build. Environ. 2019, 163, 106242. [Google Scholar] [CrossRef]
  7. Gudipudi, R.; Lüdeke, M.K.; Rybski, D.; Kropp, J.P. Benchmarking urban eco-efficiency and urbanites’ perception. Cities 2018, 74, 109–118. [Google Scholar] [CrossRef]
  8. Brown, D.; Sorrell, S.; Kivimaa, P. Worth the risk? An evaluation of alternative finance mechanisms for residential retrofit. Energy Policy 2019, 128, 418–430. [Google Scholar] [CrossRef]
  9. Yin, R.K. Case Study Research and Applications: Design and Methods; Sage Publications: Thousand Oaks, CA, USA, 2017. [Google Scholar]
  10. Hirst, E.; Brown, M.A. Closing the efficiency gap: Barriers to the efficient use of energy. Resour. Conserv. Recycl. 1990, 3, 267–281. [Google Scholar] [CrossRef]
  11. Jaffe, A.B.; Stavins, R.N. The energy-efficiency gap: What does it mean? Energy Policy 1994, 22, 804–810. [Google Scholar] [CrossRef]
  12. Weber, L. Some reflections on barriers to the efficient use of energy. Energy Policy 1997, 25, 833–835. [Google Scholar] [CrossRef]
  13. Allcott, H.; Greenstone, M. Is there an energy efficiency gap? J. Econ. Perspect. 2012, 26, 3–28. [Google Scholar] [CrossRef]
  14. Carmona, M. Contemporary public space, part two: Classification. J. Urban Des. 2010, 15, 157–173. [Google Scholar] [CrossRef]
  15. Gerarden, T.D.; Newell, R.G.; Stavins, R.N. Assessing the energy-efficiency gap. J. Econ. Lit. 2017, 55, 1486–1525. [Google Scholar] [CrossRef] [Green Version]
  16. Van Raaij, W.F.; Verhallen, T.M.M. Patterns of residential energy behavior. J. Econ. Psychol. 1983, 4, 85–106. [Google Scholar] [CrossRef] [Green Version]
  17. Lee, Y.S.; Malkawi, A.M. Simulating multiple occupant behaviors in buildings: An agent-based modeling approach. Energy Build. 2014, 69, 407–416. [Google Scholar] [CrossRef]
  18. Haldi, F.; Calì, D.; Andersen, R.K.; Wesseling, M.; Müller, D. Modelling diversity in building occupant behaviour: A novel statistical approach. J. Build. Perform. Simul. 2017, 10, 527–544. [Google Scholar] [CrossRef]
  19. Haas, R.; Auer, H.; Biermayr, P. The impact of consumer behavior on residential energy demand for space heating. Energy Build. 1998, 27, 195–205. [Google Scholar] [CrossRef]
  20. Hens, H.; Parijs, W.; Deurinck, M. Energy consumption for heating and rebound effects. Energy Build. 2010, 42, 105–110. [Google Scholar] [CrossRef] [Green Version]
  21. Torregrossa, M. Energy-efficiency investment with special regard to the retrofitting of buildings in Europe. In Europe’s Energy Transformation in the Austerity Trap; Galgoczi, B., Ed.; European Trade Union Institute (ETUI): Brussels, Belgium, 2015. [Google Scholar]
  22. Webber, P.; Gouldson, A.; Kerr, N. The impacts of household retrofit and domestic energy efficiency schemes: A large scale, ex post evaluation. Energy Policy 2015, 84, 35–43. [Google Scholar] [CrossRef] [Green Version]
  23. Mills, E.; Kromer, S.; Weiss, G.; Mathew, P.A. From volatility to value: Analysing and managing financial and performance risk in energy savings projects. Energy Policy 2006, 34, 188–199. [Google Scholar] [CrossRef]
  24. Dunphy, N.P.; Henry, A.M.M. Characterisation of the Multi-dimensional Performance Risks Associated with Building Energy Retrofits. In Proceedings of the SCP Meets Industry Proceedings of the 15th European Roundtable on Sustainable Consumption and Production, Bregenz, Austria, 2–4 May 2012; pp. 164–170. [Google Scholar]
  25. Zou, P.X.; Wagle, D.; Alam, M. Strategies for minimizing building energy performance gaps between the design intend and the reality. Energy Build. 2019, 191, 31–41. [Google Scholar] [CrossRef]
  26. Shove, E. Gaps, barriers and conceptual chasms: Theories of technology transfer and energy in buildings. Energy Policy 1998, 26, 1105–1112. [Google Scholar] [CrossRef]
  27. Galvin, R. Thermal upgrades of existing homes in Germany: The building code, subsidies, and economic efficiency. Energy Build. 2010, 42, 834–844. [Google Scholar] [CrossRef] [Green Version]
  28. Griffiths, J. ‘Leveraging’ Private Sector Finance: How Does It Work and What Are the Risks; Bretton Woods Project: London, UK, 2012. [Google Scholar]
  29. Hoicka, C.E.; Parker, P.; Andrey, J. Residential energy efficiency retrofits: How program design affects participation and outcomes. Energy Policy 2014, 65, 594–607. [Google Scholar] [CrossRef]
  30. Wade, J.; Eyre, N. Energy Efficiency Evaluation: The Evidence for Real Energy Savings from Energy Efficiency Programmes in the Household Sector; A Report by the UKERC Technology & Policy Assessment Function; UKERC: London, UK, 2015. [Google Scholar]
  31. Caputo, P.; Pasetti, G. Boosting the energy renovation rate of the private building stock in Italy: Policies and innovative GIS-based tools. Sustain. Cities Soc. 2017, 34, 394–404. [Google Scholar] [CrossRef]
  32. Kerr, N.; Winskel, M. Household investment in home energy retrofit: A review of the evidence on effective public policy design for privately owned homes. Renew. Sustain. Energy Rev. 2020, 123, 109778. [Google Scholar] [CrossRef]
  33. CABE—Commission for Architecture and the Built Environment. Paying for Parks Eight Models for Funding Urban Green Spaces; CABE: London, UK, 2006. [Google Scholar]
  34. Erickson, D. MetroGreen: Connecting Open Space in North American Cities; Island Press: Washington, DC, USA, 2012. [Google Scholar]
  35. Kats, G. Greening Our Built World: Costs, Benefits, and Strategies; Island Press: Washington, DC, USA, 2013. [Google Scholar]
  36. Merk, O.; Saussier, S.; Staropoli, C.; Slack, E.; Kim, J.H. Financing Green Urban Infrastructure; OECD Regional Development Working Papers 2012/10; OECD Publishing: Paris, France, 2012. [Google Scholar]
  37. Łaszkiewicz, M.C.; Andersson, E. Deliverable D4.3 Report on the Potential for Integrating Monetary and Non-Monetary Valuation of Urban Ecosystem Services. GREEN SURGE FP7 European Project. 2017. Available online: https://www.researchgate.net/publication/327261445_REPORT_ON_THE_POTENTIAL_FOR_INTEGRATING_MONETARY_AND_NON-MONETARY_VALUA-TION_OF_URBAN_ECOSYSTEM_SERVICES (accessed on 30 June 2020).
  38. Hoverter, S.P. Adapting to Urban Heat: A Tool Kit for Local Governments; Georgetown Climate Center: Washington, DC, USA, 2012. [Google Scholar]
  39. Chapin, R. Pocket Neighborhoods: Creating Small-Scale Community in a Large-Scale World; Taunton Press: Newtoown, CT, USA, 2011. [Google Scholar]
  40. Colding, J.; Barthel, S. The potential of ‘Urban Green Commons’ in the resilience building of cities. Ecol. Econ. 2013, 86, 156–166. [Google Scholar] [CrossRef]
  41. Frazier, A.E.; Bagchi-Sen, S. Developing open space networks in shrinking cities. Appl. Geogr. 2015, 59, 1–9. [Google Scholar] [CrossRef]
  42. Rutt, R.L.; Gulsrud, N.M. Green justice in the city: A new agenda for urban green space research in Europe. Urban For. Urban Green. 2016, 19, 123–127. [Google Scholar] [CrossRef]
  43. Kabisch, N.; Korn, H.; Stadler, J.; Bonn, A. Nature-Based Solutions to Climate Change Adaptation in Urban Areas: Linkages between Science, Policy and Practice; Springer Nature: London, UK, 2017. [Google Scholar]
  44. Barberis, N.C. Thirty years of prospect theory in economics: A review and assessment. J. Econ. Perspect. 2013, 27, 173–196. [Google Scholar] [CrossRef] [Green Version]
  45. Thompson, P.B. Evaluating energy efficiency investments: Accounting for risk in the discounting process. Energy Policy 1997, 25, 989–996. [Google Scholar] [CrossRef]
  46. Stevens, D.; Fuerst, F.; Adan, H.; Brounen, D.; Kavarnou, D.; Singh, R. Risks and Uncertainties Associated with Residential Energy Efficiency Investments; SSRN Scholarly Paper ID 3254854; Social Science Research Network: Rochester, NY, USA, 2018. [Google Scholar]
  47. Cochran, S.J.; Mansur, I.; Odusami, B. Equity market implied volatility and energy prices: A double threshold GARCH approach. Energy Econ. 2015, 50, 264–272. [Google Scholar] [CrossRef]
  48. Joskow, P.L.; Wolfram, C.D. Dynamic pricing of electricity. Am. Econ. Rev. 2012, 102, 381–385. [Google Scholar] [CrossRef] [Green Version]
  49. Muller, N.Z.; Mendelsohn, R. Efficient pollution regulation: Getting the prices right. Am. Econ. Rev. 2009, 99, 1714–1739. [Google Scholar] [CrossRef]
  50. Graff Zivin, J.S.; Kotchen, M.J.; Mansur, E.T. Spatial and temporal heterogeneity of marginal emissions: Implications for electric cars and other electricity-shifting policies. J. Econ. Behav. Organ. 2014, 107, 248–268. [Google Scholar] [CrossRef] [Green Version]
  51. Golove, W.H.; Eto, J.H. Market Barriers to Energy Efficiency: A Critical Reappraisal of the Rationale for Public Policies to Promote Energy Efficiency; Technical Report LBL-38059; Lawrence Berkeley National Laboratory: Berkeley, CA, USA, 1996. [Google Scholar]
  52. Ruderman, H.; Levine, M.D.; McMahon, J.E. The behavior of the market for energy efficiency in residential appliances including heating and cooling equipment. Energy J. 1987, 8, 101–124. [Google Scholar] [CrossRef] [Green Version]
  53. Kaza, N.; Quercia, R.G.; Tian, C.Y. Home energy efficiency and mortgage risks. Cityscape 2014, 16, 279–298. [Google Scholar]
  54. An, X.; Pivo, G. Green buildings in commercial mortgage-backed securities: The effects of LEED and energy star certification on default risk and loan terms. Real Estate Econ. 2020, 48, 7–42. [Google Scholar] [CrossRef]
  55. Giraudet, L.G. Energy efficiency as a credence good: A review of informational barriers to energy savings in the building sector. Energy Econ. 2020, 80, 104698. [Google Scholar] [CrossRef]
  56. Langlois-Bertrand, S.; Benhaddadi, M.; Jegen, M.; Pineau, P.O. Political-institutional barriers to energy efficiency. Energy Strategy Rev. 2015, 8, 30–38. [Google Scholar] [CrossRef] [Green Version]
  57. Blumberga, A.; Cilinskis, E.; Gravelsins, A.; Svarckopfa, A.; Blumberga, D. Analysis of regulatory instruments promoting building energy efficiency. Energy Procedia 2018, 147, 258–267. [Google Scholar] [CrossRef]
  58. IEA-RETD. Business Models for Renewable Energy in the Built Environment; Routledge: New York, NY, USA, 2013. [Google Scholar]
  59. Næss-Schmidt, H.; Hansen, M.; Danielsson, C. Multiple Benefits of Investing in Energy Efficient Renovation of Buildings; Copenhagen Economics: Copenhagen, Denmark, 2012. [Google Scholar]
  60. Kohn, M. Brave New Neighborhoods: The Privatization of Public Space; Routledge: New York, NY, USA; London, UK, 2004. [Google Scholar]
  61. Nissen, S. Urban transformation from public and private space to spaces of hybrid character. Sociol. Časopis Czech Sociol. Rev. 2008, 44, 1129–1149. [Google Scholar] [CrossRef]
  62. Lippert, R.K.; Steckle, R. Conquering condos from within: Condo-isation as urban governance and knowledge. Urban Stud. 2016, 53, 132–148. [Google Scholar] [CrossRef]
  63. Yin, R.K. The case study crisis: Some answers. Adm. Sci. Q. 1981, 26, 58–65. [Google Scholar] [CrossRef] [Green Version]
  64. De Marco, A.; Mangano, G.; Michelucci, F.V.; Zenezini, G. Using the private finance initiative for energy efficiency projects at the urban scale. Int. J. Energy Sect. Manag. 2016, 10, 99–117. [Google Scholar] [CrossRef] [Green Version]
  65. Lam, P.T.; Yang, W. Factors influencing the consideration of Public-Private Partnerships (PPP) for smart city projects: Evidence from Hong Kong. Cities 2020, 99, 102606. [Google Scholar] [CrossRef]
  66. Novikova, A.; Stelmakh, K.; Klinge, A.; Juergens, I.; Hessling, M. Financing Models for Energy Efficiency in Public Buildings and Street Lighting in Germany and Neighbouring Countries. In Improving Energy Efficiency in Commercial Buildings and Smart Communities; Springer: Cham, Switzerland, 2020; pp. 165–194. [Google Scholar]
  67. Marshall, S. The kind of art urban design is. J. Urban Des. 2016, 21, 399–423. [Google Scholar] [CrossRef]
  68. Caneparo, L. An agenda for education: On the relationship between architectural design education, technology of architecture and information technology. In Design Studio Pedagogy: Horizons for the Future; Urban International Press: Gateshead, UK, 2007; pp. 345–346. [Google Scholar]
  69. EEFIG. Energy Efficiency—The First Fuel for the EU Economy: How to Drive New Finance for Energy Efficiency Investments; European Union: Brussels, Belgium, 2015. [Google Scholar]
  70. Economidou, M.; Todeschi, V.; Bertoldi, P. Accelerating Energy Renovation Investments in Buildings; Publications Office of the European Union: Luxembourg, 2019. [Google Scholar]
  71. Rydin, Y.; Guy, S.; Goodier, C.; Chmutina, K.; Devine-Wright, P.; Wiersma, B. The financial entanglements of local energy projects. Geoforum 2015, 59, 1–11. [Google Scholar] [CrossRef] [Green Version]
  72. IEA. Joint Public-Private Approaches for Energy Efficiency Finance. Policies to Scale-Up Private Sector Investment; IEA Publications: Paris, France, 2011. [Google Scholar]
  73. Halcoussis, D.; Lowenberg, A.D. The effects of the fossil fuel divestment campaign on stock returns. N. Am. J. Econ. Financ. 2019, 47, 669–674. [Google Scholar] [CrossRef]
  74. BMWi—Bundesministerium für Wirtschaft und Energie. Ein Gutes Stück Arbeit. Mehr Aus Energie Machen. Nationaler Aktionsplan Energieeffizienz; BMWi: Berlin, Germany, 2014. [Google Scholar]
  75. Michelsen, C.; Neuhoff, K.; Schopp, A. Using equity capital to unlock investment in building energy efficiency? Diw Econ. Bull. 2015, 5, 259–265. [Google Scholar]
  76. Chandler, J. Energy efficiency in the United Kingdom: The failure of the green deal. Renew. Energy L Pol’y Rev. 2015, 6, 191–195. [Google Scholar]
  77. Rosenow, J.; Eyre, N. A post mortem of the Green Deal: Austerity, energy efficiency, and failure in British energy policy. Energy Res. Soc. Sci. 2016, 21, 141–144. [Google Scholar] [CrossRef]
  78. Bertoldi, P.; Rezessy, S.; Vine, E. Energy service companies in European countries: Current status and a strategy to foster their development. Energy Policy 2006, 34, 1818–1832. [Google Scholar] [CrossRef]
  79. Bullier, A.; Milin, C. Dispositifs de financement alternatifs pour la rénovation énergétique du bâtiment. Les Cah. De Glob. Chance 2014, 35, 12–23. [Google Scholar]
  80. Eichhammer, W.; Reuter, M. Grant Agreement n. H2020 Energy/69607 ODYSSEE-MURE a Decision Support Tool for Energy Efficiency Policy Evaluation; European Commission: Brussels, Belgium, 2017. [Google Scholar]
  81. Reuter, M.; Patel, M.K.; Eichhammer, W.; Lapillonne, B.; Pollier, K. A comprehensive indicator set for measuring multiple benefits of energy efficiency. Energy Policy 2020, 139, 111284. [Google Scholar] [CrossRef]
  82. MURE Database on Energy Efficiency Policies. Available online: http://www.measures-odyssee-mure.eu/ (accessed on 30 June 2020).
  83. Energy Efficiency Database of the International Energy Agency. Available online: https://www.iea.org/policies (accessed on 30 June 2020).
  84. Incubators of Public Spaces Research Project. Available online: https://jpi-urbaneurope.eu/project/incubators/ (accessed on 30 June 2020).
  85. Incubators of Public Spaces Online Interactive Visual Synopsis of Interventions. Available online: https://polytechnic-egrid.polito.it/viewer.php (accessed on 30 June 2020).
  86. Loga, T.; Stein, B.; Diefenbach, N. TABULA building typologies in 20 European countries—Making energy-related features of residential building stocks comparable. Energy Build. 2016, 132, 4–12. [Google Scholar] [CrossRef]
  87. Cappa, F.; Rosso, F.; Giustiniano, L.; Porfiri, M. Nudging and citizen science: The effectiveness of feedback in energy-demand management. J. Environ. Manag. 2020, 269, 110759. [Google Scholar] [CrossRef]
  88. González-Ruiz, J.D.; Botero-Botero, S.; Duque-Grisales, E. Financial eco-innovation as a mechanism for fostering the development of sustainable infrastructure systems. Sustainability 2018, 10, 4463. [Google Scholar] [CrossRef] [Green Version]
  89. Coderre, F.; Mathieu, A.; St-Laurent, N. Comparison of the quality of qualitative data obtained through telephone, postal and email surveys. Int. J. Mark. Res. 2004, 46, 349–357. [Google Scholar] [CrossRef]
  90. Brough, P. (Ed.) Advanced Research Methods for Applied Psychology: Design, Analysis and Reporting; Routledge: Oxon, UK, 2018. [Google Scholar]
Figure 1. Direct and indirect economic costs and values of open and green spaces.
Sustainability 12 08809 g001
Figure 2. Mature and emerging financing models.
Sustainability 12 08809 g002
Figure 3. Third-party financing scheme.
Sustainability 12 08809 g003
Figure 4. Radar chart of the scores for the indicators, applied to the case studies.
Sustainability 12 08809 g004
Figure 5. Online interactive tool to shape retrofitting interventions improving the urban tissue, financeable with EE models [86]. (a) Represents main typologies of buildings across European cities. (b) Pull down menus offers the suitable EEF models: the user’s choices pop up in the different urban tissues. The tool is accessible at https://polytechnic-egrid.polito.it/viewer.php (see Supplementary Materials).
Sustainability 12 08809 g005aSustainability 12 08809 g005b
Table 1. The range of ownerships of urban spaces between private and public.
Space Ownership:Instances:
Private Public1privatehome
2private, co-ownedcondominium grounds, fences, landscaped and rooftop areas, parking places, corridors, and stairs
3private, with open or controlled accessshops, shopping malls, theatres, plazas at the entrance of high-rises,
4private/public, public property sale with political and administrative spin-offgated communities, where developers, inhabitants organise according to local tasks and self-defined governance
5public, commodification of quasi-public propertyunderground, railways
6public, transfer of rights of use and of maintenanceredevelopment of parks and public greens
7public, privately managed, e.g., installation of signs of private characterpedestrian areas, business improvement districts
8publiccity streets, plazas, parks
Table 2. Dedicated Credit Line Benefits and Gaps.
BenefitsGaps
Below market interest rates
Integrate aid mechanisms
Recover funds for further EE projects
Fill loan EE market gaps
Homeowners’ behavioural biases to take on or increase debt
Homeowners’ behavioural biases on borrowing from banks
Financial institutions’ biases on value of EE projects
Energy poverty unwilling to credit means
EE projects fragmentation makes credit delivery unattractive to financial institutions
Suitable for Space ownership (Table 1): 1–8.
Table 3. Energy Performance Contracting Benefits and Gaps.
BenefitsGaps
Recover funds for further EE projects
ESCos involvement ease the integration with and bundling of credits for financial institutions
Homeowners’ behavioural biases on value of EE projects
Financial institutions’ biases on value of EE projects
Gaps for ESCos due to EE market maturity
Energy poverties unwilling to save or invest on EE
Suitable for Space ownership (Table 1): 1–5.
Table 4. Risk-Sharing Facility Benefits and Gaps.
BenefitsGaps
Reduce risks on upfront capital
Reduce financial costs on EE investments
Independent from the ownership of the loan
EE projects ease of access to credit
Gap on levels and structure of energy billing
Gap on insolvency on energy bills
Gap on appraising homeowners’ credit eligibility and default
Suitable for Space ownership (Table 1): 1–3.
Table 5. Subordinated Loan Benefits and Gaps.
BenefitsGaps
Homeowners’ ease of access to credit
Reduce risks on upfront capital
Below market interest rates
Recover funds for further EE projects
EE projects bundling makes credit delivery attractive to financial institutions
Gap in levels and structure of energy billing
Gap in insolvency on energy bills
Gap in appraising homeowners’ credit eligibility and default
Suitable for Space ownership (Table 1): 1–8.
Table 6. Energy Efficiency Investment Fund Benefits and Gaps.
BenefitsGaps
EE projects bundling makes credit delivery attractive to financial institutions
Suitable to focus on specific EE projects funding
Investors willingness to environmental consciousness
Above Dedicated Credit Line interest rates
Unsuitable to large-scale uptake rates
Gaps on investors biases on EE projects
Gaps on volatility in energy price
Gaps on fluctuation in interest rates and investment return
Suitable for Space ownership (Table 1): 1–7.
Table 7. Green Bond Benefits and Gaps.
BenefitsGaps
Reduce cost on upfront capital
EE projects bundling makes credit delivery attractive to financial institutions
Suitable to focus on specific EE projects funding
Amortised over long periods of time
Return on investment over long periods of time
Gap on structure and transparency of fund-raising
Above Dedicated Credit Line interest rates
Gaps on investors biases on EE projects
Gaps on volatility in energy price
Gaps on fluctuation in interest rates and investment return
Suitable for Space ownership (Table 1): 1–8.
Table 8. On-Bill Repayment and On-Tax Finance (PACE) Benefits and Gaps.
BenefitsGaps
Reduce cost on upfront capital
Ease of repayment
Homeowners’ credit eligibility
Amortised over long periods of time
Associated to the property, not to the homeowner
Offered with technical assistance on the measures
Return on investment over long periods of time
Gap on structure and transparency of fund-raising
Above Dedicated Credit Line interest rates
Gaps in investors behavioural biases on EE projects
Gap in homeowners’ insolvency on energy bills
Gaps in volatility in energy price
Gaps in fluctuation in interest rates and investment return
Gaps in transferring the property without the loan
Gaps in regulations on house and taxation policies
Gaps on regulatory transparency
Suitable for Space ownership (Table 1): 1–4.
Table 9. Public ESCo for Deep Renovation of Housing Benefits and Gaps.
BenefitsGaps
Trig high-performance energy renovation projects, e.g., zero energy or passive
Below market interest rates
Reduce cost on upfront capital
Amortised over long periods of time
Financial offer packed with technical assistance on measures
EE projects bundling makes credit delivery attractive to financial institutions
Return on investment over long periods of time
Gaps in volatility of energy price
Gaps in fluctuation in interest rates and investment return
Gaps in regulations on house and taxation policies
Gaps on regulatory transparency
Homeowners’ behavioural biases to take or increase debit
Energy poverty unwilling to credit means
Suitable for Space ownership (Table 1): 1–8.
Table 10. Third-Party Financing Benefits and Gaps.
BenefitsGaps
Ease of implementation by financial institutions
ESCos in charge of paperwork and technical procedures, and filling the request [to the bank]
ESCos involvement ease the integration with and bundling of credits for financial institutions
Rapid evaluation and delivery of credit
ESCos projects bundling makes credit delivery attractive to financial institutions
Return on investment over long periods of time
Gaps on volatility in energy price
Gaps on fluctuation in interest rates and investment return
Gaps on trigging zero energy/passive renovations
Gaps on scaling-up projects at regional/national levels
Suitable for Space ownership (Table 1): 1–3.
Table 11. Categories, indicators, and scores of the financing models.
CategoryIndicatorScore
(a) systematic behavioural biases(a) systematic behavioural biases−2: very low
−1: low
0: neutral
1: high
2: very high
(b) uncertainties or negative externalities(b) uncertainties or negative externalities
(c) economic and financial risks(c1) volatility in energy price
(c2) levels and structure of tariff
(c3) fluctuation in interest rates
(c4) loan default
(d) regulatory risks(d) regulatory risks
Table 12. The scores of the indicators for the case studies.
Financing Model4.1.1. Dedicated Credit Line4.1.2. Energy Performance Contracting4.1.3. Risk-Sharing Facility4.1.4. Subordinated Loan4.2.1. Energy Efficiency Investment Fund4.2.2. Green Bond4.2.3. On-Bill Repayment and On-Tax Finance4.2.4. Public ESCo for Deep Renovation of Housing4.2.5. Third-Party Financing
Case studyKfWEco-loan at zero rateEnergy Saving PartnershipCEEFRisk Sharing FacilityELENA EEEFADEMENAPEPACEPACEUK Green DealEnergies POSIT’IFCity of BerlinMEEF
Suitable for Space ownership1–81–51–31–81–71–81–41–81–3
(a) systematic behavioural biases2111221−11
(b) uncertainties or negative externalities−12−1−1−1−2−102
(c1) volatility in energy price−22−2−2−2−2−2−11
(c2) levels and structure of tariff122111212
(c3) fluctuation in interest rates−111122212
(c4) loan default1−2−2−111111
(d) regulatory risks111111222
Table 13. The range of ownerships of urban spaces with highlighted the occurrences of the financing models in the databases.
4.1.1. Dedicated Credit Line4.1.2. Energy Performance Contracting4.1.3. Risk-Sharing Facility4.1.4. Subordinated Loan4.2.1. Energy Efficiency Investment Fund4.2.2. Green Bond4.2.3. On-Bill Repayment and On-Tax Finance PACE4.2.4. Public ESCo for Deep Renovation of Housing4.2.5. Third-Party Financing
1 private111111111
2 private co-owned111111111
3 private with open or controlled access011111111
4 private/public010111000
5 public commodification110000000
6 public transfer of rights100000000
7 public privately managed000001000
8 public100001000
Publisher’s Note: MDPI stays neutral with regard to jurisdictional claims in published maps and institutional affiliations.