The exponential increase in water demand has been a focus since the 1970s in the well-known report on the “Limits to growth” [1,2]. Today, freshwater availability is considered one of the nine planetary boundaries, along with biosphere integrity, climate change and ocean acidification, among others [3]. Water is essential not only to sustain life on Earth, but also for the provision of energy and food [4], in a context where four billion people are currently facing severe water stress for at least one month a year [5]. A guaranteed supply could be undermined due to the increasing population, shifting lifestyles towards more intensive water use and climate change [6].
Even though freshwater is seen as a local resource and its scarcity as a local concern, it is increasingly becoming a global resource, driven by the growing international trade in water-intensive commodities: around one fifth of the direct and indirect global water use is linked to production for export [7]. As a result, the use of water resources has become spatially disconnected from water users. For instance, for goods that will likely be consumed far from the origin of production, it is estimated that one kilogram of beef requires more than 15,000 L of water, while one kg of sugar requires 1700 L, one kg of bread 1600 L and one bottle of red wine 660 L [8].
Therefore, the idea of considering water use along supply chains has gained interest after the introduction of the ‘water footprint’ concept by Hoekstra [9]. The concept of a water footprint has been coined to address the interconnections between the direct and indirect use of freshwater by a specific consumer or producer. Indirect uses might include the quantity of water that has been used to produce goods and services, as well as the quantity of water that will be used to manage waste. In other words, the water footprint can be seen as a global indicator of the appropriation of freshwater resources, extending the traditional and restricted concept of water extraction. However, as a drawback, water footprint is not a good measurement of the severity of the local environmental impacts associated to water consumption and pollution.
The links between indefinite economic growth and natural resource overexploitation have recently been highlighted. Since Malthus in 1798, we have been facing a debate about sustainability and the finite nature of natural resources. The debate about environmental limits developed into two schools of thought. Giampietro et al. [10] describe this on-going debate as a confrontation between the “Cornucopians” and the “Prophets of Doom”. According to the Prophets of Doom, resource scarcity and biophysical limits will eventually put an end to economic growth. On the other hand, the Cornucopians argued that environmental constraints could be overcome through technological progress and human ingenuity. Economic growth means that the economic system transitioned from existing in an empty world to a full world [11]. Daly [11] argues, as well as other authors [12,13,14], for the need to reach a steady-state economy, which should maintain its size and not exceed the carrying capacity of the Earth. In the recent literature, degrowth has been proposed as another alternative to the current mainstream economics posed by the “Cornucopians” [15,16,17].
For example, recently, 11,000 scientists have signed a communication letter in which the following statement can be read: “excessive extraction of materials and overexploitation of ecosystems, driven by economic growth, must be quickly curtailed to maintain long-term sustainability of the biosphere” [18]. In the same direction, a review paper highlighted that economic growth and biodiversity loss are closely linked as a consequence of increasing resource use [19]. In the case of water, the European Environment Agency projected that continued economic growth in Europe might increase the level of public water use [20], whereas other studies have considered endless economic growth as incompatible with the provision of clean, fresh water at the global scale [21]. In fact, looking at the global scale, the mentioned patterns are found for economic growth and water use indicators. For example, Duarte et al. [22] analysed the implications of Gross Domestic Product (GDP) per capita in water withdrawal at the global scale, from 1900 to 2000. Miglietta et al. [23] assessed the impacts of Gross National Income (GNI) on the water footprint for 94 countries, from 1996 to 2005, and Sebri [24] investigated the association between the water footprint and GDP per capita over the period 1996–2005. All of them stressed the strong relationships between indicators of water use with indicators of economic activity.
Here, we have put together GDP in PPP and total water footprint for all countries of the world and we came across with the results plotted in Figure 1. As clearly shown in the left panel of Figure 1, the water footprint linearly expands with GDP (Pearson correlation coefficient, r = 0.71). Indeed, when using absolute numbers, no country has a large GDP and low water footprint. In fact, the largest economies in the world, the United States, China and India, present massive water footprints (the three points in the upper corner), while also being the major gross exporters and importers of virtual water [7]. The results given in per capita terms (right-hand side of Figure 1) provide, instead, a less clear correlation (but a correlation nonetheless) between GDP and water footprint (r = 0.41).
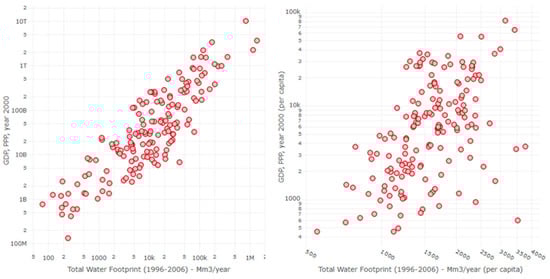
Figure 1.
Absolute (left panel) and per capita (right panel) Total Water Footprint (Mm3/year) vs. Gross Domestic Product (GDP, normalised by Purchasing Power Parity (PPP), in current international USD, for 2000); Total Water Footprint refers to the average amount of water for the period 1996–2006; we have adopted the year 2000 as the median value. Both scatterplots are presented following a logarithmic scale for clarity. Only the nations with missing data were excluded. Data sources: Mekonnen and Hoekstra (2011) and World Bank (https://data.worldbank.org/).
In view of the presented evidence, it is apparent that a larger GDP implies a higher water footprint. One of the explanations found in the literature highlights the increasing consumption of water-intensive goods, such as meat, resulting in a significant increase in water withdrawal [22]. Urbanisation has also been reported to have a negative effect on water resources since urban areas exert pressure on water resources, and turn farming areas into degraded ones [24,25]. Population and economic growth, as well as the intensification of agriculture, which is one of the main causes of land degradation [26], have been identified as some of the main drivers for this growing trend [22].
What are the strategies proposed to manage the coupling between GDP growth and the increasing use of natural resources? At least two main approaches have emerged to focus on how to break up this correlation [27]. The first approach is represented by the green growers’ community and the second is formed by the non-green growers (the latter is, however, formed by three currents of thought: (1) eco-socialists who support degrowth from a top-down perspective, i.e., the state; (2) eco-anarchists who support degrowth from a bottom-up perspective instead, i.e., conscious citizens; (3) reformists (formed by two other groups, one is closer to green growers and the other is closer to eco-socialists and eco-anarchists). In-depth similarities and differences among non-green growers can be consulted here [27].
Over the past decade, green growth clearly dominated policy agendas on the assumption that decoupling environmental pressures from GDP could allow economic growth without end. The concept of decoupling is usually related to sustainable growth by environmental economics. Growth can be sustainable, that is, environmentally sustainable, when a sufficient decoupling takes place: “Green growth means that environmental and economic objectives can be combined by decoupling environmental pressures from aggregate output at a sufficiently rapid pace” [28]. Thus, green growers’ theses highlight that GDP growth can be decoupled from environmental impacts and natural resource use by means of technology and the reinforcement of capitalism [29]. Their main goal is to pursue high economic growth while decreasing environmental impacts, with resource efficiency and renewable energies being the engines of change. Green growers state that governments, financial institutions, voters and scientists are the actors who will lead the required actions. Green growers are, therefore, aligned with mainstream economics. In summary, the idea behind this current of thought is that a sufficient increase in the prices of natural resources would lead to the substitution of natural resources by other production factors, meaning a substitution through physical capital [30].
Non-green growers criticize green growth for having wobbly scientific evidence [29,31,32,33,34,35,36]. Several mechanisms counteract the substitution of natural resources by physical capital. In this direction, Daly and Farley [37] state something obvious but forgotten in the previous discourse, that natural resources are used in the production process of physical capital [37]. This implies that the increase in the amount of physical capital is intimately linked to the increase in the use of natural resources. They say that “substitutability is trivial compared to the overwhelming complementarity that must necessarily exist between that being transformed (resource) and the agent of transformation (capital)” [38]. Following this idea, some researchers [23,24] point out that there is no evidence for an inverted U trend, as suggested by the Environmental Kuznets Curve theory. The explanation is that enhancing GDP growth and consumerism tend to offset technology efficiency gains [18,32,39]. As a consequence of this evidence, Hickel and Kallis [29] stated that “the empirical data suggest that absolute decoupling of GDP from resource use (a) may be possible in the short term in some rich nations with strong abatement policy, but only assuming theoretical efficiency gains that may be impossible to achieve in reality; (b) is not feasible on a global scale, even under best-case scenario policy conditions; and (c) is physically impossible to maintain in the long term”. Thus, insisting on decoupling economic growth from natural resource use—defying thermodynamics laws—apart from being a “legend”, is “simply” a consequence of the “ignorance of the knowledge generated” so far [34]. Other authors have pointed out that even if absolute decoupling is produced, it would not guarantee sustainability whatsoever [36]. Hence, indefinite economic growth has been said to be environmentally inconvenient and unfeasible in the long term [31,40]. In fact, the water footprint “will continue to rise indefinitely as countries pursue economic growth policies and once the higher income levels (…) are reached” [24].
Non-green growers, as also revealed in [27], state that the absolute decoupling of environmental impacts (and natural resource overexploitation) from GDP is rather unlikely, whereas the necessary changes cannot be achieved within a capitalist system. The pursued goal of non-green growers is therefore to decouple wellbeing from GDP and reduce the environmentally associated impacts, even if GDP decreases. Non-green growers point out that the main drivers of change are civil society, grassroots initiatives and scientists, who would be in charge of changing lifestyles, cultures and consciousnesses by means of grassroots action. Hence, their alignment with mainstream economics is out of the question.
Non-green growers, especially those supporting degrowth [27], propose to carry out what they call the eight Rs (reassess, reconceptualise, restructure, redistribute, relocate, reduce, reuse and recycle) [41]. Thus, the main goal is to degrow the amount of material and energy used by economies, whereas technological investments are meant to liberate time for people to enjoy immaterial leisure [19]. The education and health sectors are reoriented and focused on how to degrow the population, as well as to substitute GDP as an indicator of social success for a sort of dashboard of indicators to measure wellbeing and environmental sustainability [31,40]. Wealth redistribution, basic income schemes, a cut in working hours, environmental and consumption taxes, income caps, ethical banking, and increasing control on advertising are some of the top-down policy directions suggested [13,14]. Support for bottom-up initiatives are also on the table, such as consumer–producer cooperatives, urban (food) gardens, markets of exchange, time banks, co-housing, shared cars, community spaces, tool sharing, cooperative property and cooperative firms [14]. To summarize, non-green growth implies a simplification of life by means of low-tech use, e.g., changing cars for bicycles (when possible), dryers for clotheslines, heaters for warm clothing, or TVs for a social life [42]. However, degrowth does not necessarily mean that many other sectors must not grow (to a certain limit), such as cycling, renewable energies, sport and health, etc.; therefore, the term “post-growth” is even more accurate for this debate. We therefore add our voices to those of non-green growers (or post-growers) and scientific colleagues when arguing that developing a new paradigm is critical so that human societies can live within ecological limits [3]. The global policy agendas should modify the established economic system so that humans’ wellbeing becomes the centre of our actions, while, at the same time, global energy and material flows, including water use, are adjusted to the planetary boundaries [18,32,39]. Due to the fact that GDP growth is a “questionable societal goal” [31,40], “an organised material de-growth in the North followed by a steady state shows up as a valid framework to achieve global future human welfare and sustainability” [40]. In summary, “green growth is likely to be a misguided” goal requiring new “alternative strategies” [29]. These alternative strategies would require profound systemic changes [33,40].
Author Contributions
Conceptualization, all authors; resources, Y.H. and G.N.; data curation, Y.H. and G.N.; writing—original draft preparation, all authors; writing—review and editing, all authors; visualization, Y.H. and G.N. All authors have read and agreed to the published version of the manuscript.
Funding
This research received no external funding.
Conflicts of Interest
The authors declare no conflict of interest.
References
- Meadows, D.H.; Meadows, D.L.; Randers, J.; Behrens, W.W. The limits to growth. N. Y. 1972, 102, 27. [Google Scholar]
- Meadows, D.; Randers, J.; Meadows, D. Limits to Growth: The 30-Year Update; Chelsea Green Publishing: White River Junction, VT, USA, 2004. [Google Scholar]
- Steffen, W.; Richardson, K.; Rockström, J.; Cornell, S.E.; Fetzer, I.; Bennett, E.M.; Biggs, R.; Carpenter, S.R.; De Vries, W.; De Wit, C.A. Planetary boundaries: Guiding human development on a changing planet. Science 2015, 347, 1259855. [Google Scholar] [CrossRef] [PubMed]
- Vanham, D. Does the water footprint concept provide relevant information to address the water–food–energy–ecosystem nexus? Ecosyst. Serv. 2016, 17, 298–307. [Google Scholar] [CrossRef]
- Mekonnen, M.M.; Hoekstra, A.Y. Four billion people facing severe water scarcity. Sci. Adv. 2016, 2, e1500323. [Google Scholar] [CrossRef]
- Vanham, D.; Hoekstra, A.Y.; Wada, Y.; Bouraoui, F.; De Roo, A.; Mekonnen, M.M.; Van De Bund, W.J.; Batelaan, O.; Pavelic, P.; Bastiaanssen, W.G. Physical water scarcity metrics for monitoring progress towards SDG target 6.4: An evaluation of indicator 6.4. 2 “Level of water stress”. Sci. Total Environ. 2018, 613, 218–232. [Google Scholar] [CrossRef]
- Mekonnen, M.M.; Hoekstra, A.Y. National Water Footprint Accounts: The Green, Blue and Grey Water Footprint of Production and Consumption; Volume 1: Main Report; UNESCO-IHE Institute for Water Education: Delft, The Netherlands, 2011. [Google Scholar]
- Antonelli, M.; Greco, F. The Water Footprint of Italy; WWF Italia: Roma, Italy, 2014; Available online: https://www.wwf.it (accessed on 5 May 2020).
- Hoekstra, A.Y. Virtual Water Trade: Proceedings of the International Expert Meeting on Virtual Water Trade, Delft, The Netherlands, 12–13 December 2002, Value of Water Research Report Series No. 12; UNESCO-IHE: Delft, The Netherlands, 2003. [Google Scholar]
- Giampietro, M.; Mayumi, K.; Sorman, A.H. The Metabolic Pattern of Societies: Where Economists Fall Short; Routledge: Oxfordshire, UK, 2011; ISBN 978-1-136-61994-6. [Google Scholar]
- Daly, H.E. Economics in a Full World. Sci. Am. 2005, 293, 100–107. [Google Scholar] [CrossRef]
- Latouche, S. Degrowth Economics. Available online: https://mondediplo.com/2004/11/14latouche (accessed on 20 September 2020).
- Kallis, G. In defence of degrowth. Ecol. Econ. 2011, 70, 873–880. [Google Scholar] [CrossRef]
- Kallis, G.; Kerschner, C.; Martinez-Alier, J. The economics of degrowth. Ecol. Econ. 2012, 84, 172–180. [Google Scholar] [CrossRef]
- D’Alisa, G.; Demaria, F.; Kallis, G.; Demaria, F.; Kallis, G. Degrowth: A Vocabulary for a New Era; Routledge: Oxfordshire, UK, 2014; ISBN 978-0-203-79614-6. [Google Scholar]
- Kallis, G.; Kostakis, V.; Lange, S.; Muraca, B.; Paulson, S.; Schmelzer, M. Research on degrowth. Annu. Rev. Environ. Resour. 2018, 43, 291–316. [Google Scholar] [CrossRef]
- Kerschner, C. Economic de-growth vs. steady-state economy. J. Clean. Prod. 2010, 18, 544–551. [Google Scholar] [CrossRef]
- Ripple, W.; Wolf, C.; Newsome, T.; Barnard, P.; Moomaw, W.; Grandcolas, P. World scientists’ warning of a climate emergency. BioScience 2019, 70, 8–12. [Google Scholar] [CrossRef]
- Otero, I.; Farrell, K.N.; Pueyo, S.; Kallis, G.; Kehoe, L.; Haberl, H.; Plutzar, C.; Hobson, P.; García-Márquez, J.; Rodríguez-Labajos, B. Biodiversity policy beyond economic growth. Conserv. Lett. 2020, 13, e12713. [Google Scholar] [CrossRef] [PubMed]
- European Environment Agency (EEA). Water Resources across Europe—Confronting Water Scarcity and Drought; European Environment Agency: Copenhagen, Denmark, 2009. [Google Scholar]
- Boretti, A.; Rosa, L. Reassessing the projections of the world water development report. NPJ Clean Water 2019, 2, 1–6. [Google Scholar] [CrossRef]
- Duarte, R.; Pinilla, V.; Serrano, A. Looking backward to look forward: Water use and economic growth from a long-term perspective. Appl. Econ. 2014, 46, 212–224. [Google Scholar] [CrossRef]
- Paolo Miglietta, P.; De Leo, F.; Toma, P. Environmental Kuznets curve and the water footprint: An empirical analysis. Water Environ. J. 2017, 31, 20–30. [Google Scholar] [CrossRef]
- Sebri, M. Testing the environmental Kuznets curve hypothesis for water footprint indicator: A cross-sectional study. J. Environ. Plan. Manag. 2016, 59, 1933–1956. [Google Scholar] [CrossRef]
- Garrick, D.; De Stefano, L.; Yu, W.; Jorgensen, I.; O’Donnell, E.; Turley, L.; Aguilar-Barajas, I.; Dai, X.; de Souza Leão, R.; Punjabi, B. Rural water for thirsty cities: A systematic review of water reallocation from rural to urban regions. Environ. Res. Lett. 2019, 14, 043003. [Google Scholar] [CrossRef]
- Cherlet, M.; Hutchinson, C.; Reynolds, J.; Hill, J.; Sommer, S. WAD|World Atlas of Desertification; Publication Office of the European Union: Luxembourg, 2018. [Google Scholar]
- Wiedmann, T.; Lenzen, M.; Keyßer, L.T.; Steinberger, J.K. Scientists’ warning on affluence. Nat. Commun. 2020, 11, 3107. [Google Scholar] [CrossRef]
- Antal, M.; Van Den Bergh, J.C.J.M. Green growth and climate change: Conceptual and empirical considerations. Clim. Policy 2016, 16, 165–177. [Google Scholar] [CrossRef]
- Hickel, J.; Kallis, G. Is green growth possible? New Political Econ. 2020, 25, 469–486. [Google Scholar] [CrossRef]
- Groth, C. A New-Growth Perspective on Non-Renewable Resources. In Sustainable Resource Use and Economic Dynamics; Bretschger, L., Smulders, S., Eds.; The Economics of Non-Market Goods and Resources; Springer: Dordrecht, The Netherlands, 2007; pp. 127–163. ISBN 978-1-4020-6293-3. [Google Scholar]
- Ward, J.D.; Sutton, P.C.; Werner, A.D.; Costanza, R.; Mohr, S.H.; Simmons, C.T. Is decoupling GDP growth from environmental impact possible? PLoS ONE 2016, 11, e0164733. [Google Scholar] [CrossRef] [PubMed]
- Alfredsson, E.; Bengtsson, M.; Brown, H.S.; Isenhour, C.; Lorek, S.; Stevis, D.; Vergragt, P. Why achieving the Paris Agreement requires reduced overall consumption and production. Sustain. Sci. Pract. Policy 2018, 14, 1–5. [Google Scholar] [CrossRef]
- Jackson, T.; Victor, P.A. Unraveling the claims for (and against) green growth. Science 2019, 366, 950–951. [Google Scholar] [CrossRef] [PubMed]
- Giampietro, M.; Funtowicz, S.O. From elite folk science to the policy legend of the circular economy. Environ. Sci. Policy 2020, 109, 64–72. [Google Scholar] [CrossRef]
- Storm, S.; Schröder, E. Economic Growth and Carbon Emissions: The Road to ‘Hothouse Earth’ Is Paved with Good Intentions; Social Science Research Network: Rochester, NY, USA, 2018. [Google Scholar]
- Vadén, T.; Lähde, V.; Majava, A.; Järvensivu, P.; Toivanen, T.; Hakala, E.; Eronen, J.T. Decoupling for ecological sustainability: A categorisation and review of research literature. Environ. Sci. Policy 2020, 112, 236–244. [Google Scholar] [CrossRef]
- Daly, H.E.; Farley, J. Ecological Economics, Second Edition: Principles and Applications; Island Press: Washington, DC, USA, 2011; ISBN 978-1-59726-991-9. [Google Scholar]
- Daly, H.E. Toward some operational principles of sustainable development. Ecol. Econ. 1990, 2, 1–6. [Google Scholar] [CrossRef]
- Kubiszewski, I.; Costanza, R.; Franco, C.; Lawn, P.; Talberth, J.; Jackson, T.; Aylmer, C. Beyond GDP: Measuring and achieving global genuine progress. Ecol. Econ. 2013, 93, 57–68. [Google Scholar] [CrossRef]
- Capellán-Pérez, I.; Mediavilla, M.; de Castro, C.; Carpintero, Ó.; Miguel, L.J. More growth? An unfeasible option to overcome critical energy constraints and climate change. Sustain. Sci. 2015, 10, 397–411. [Google Scholar] [CrossRef]
- Latouche, S. Farewell to Growth; Polity Press: Cambridge, UK, 2009. [Google Scholar]
- Alexander, S.; Yacoumis, P. Degrowth, energy descent, and ‘low-tech’ living: Potential pathways for increased resilience in times of crisis. J. Clean. Prod. 2018, 197, 1840–1848. [Google Scholar] [CrossRef]
Publisher’s Note: MDPI stays neutral with regard to jurisdictional claims in published maps and institutional affiliations. |
© 2020 by the authors. Licensee MDPI, Basel, Switzerland. This article is an open access article distributed under the terms and conditions of the Creative Commons Attribution (CC BY) license (http://creativecommons.org/licenses/by/4.0/).