Article

Measurement Development for Tourism Destination Business Environment and Competitive Advantages

1
Department of Tourism Management, Pukyong National University, Busan 46718, Korea
2
College of Hospitality and Tourism Management, Sejong University, 98 Gunja-Dong, Gwangjin-Gu, Seoul 143-747, Korea
*
Author to whom correspondence should be addressed.
Sustainability 2020, 12(20), 8587; https://doi.org/10.3390/su12208587
Submission received: 29 August 2020 / Revised: 24 September 2020 / Accepted: 11 October 2020 / Published: 16 October 2020
(This article belongs to the Special Issue Strategic Planning and Management of Tourist Destinations)

Abstract

:
This study attempts to develop a measurement model of competitiveness utilized in the tourism sector, which appears to be fundamentally different in nature from traditional goods and services. Tourism destination competitiveness reflecting the generic characteristics should be considered diversified to notice the distinctive perspective between the business environment and competitive advantages. Criticism of some prior conventional literature stems from the lack of a rigorous process to find the structure and attributes of the measurement items for a destination’s business environment and competitive advantages. The available theoretical framework and measures containing the destination business environment and competitive advantages warrant further investigation. The vital dimensions of the destination business environment (i.e., dynamism, hostility, turbulence, investment, information technology, and governance) and destination competitive advantages (i.e., defensiveness, local acceptance, accessibility, reasonability, uniqueness, supportiveness, and image sustainability) were successfully identified through quantitative and empirical analysis, which could provide a significant basis for managerial and policy decisions in the tourism industry.

1. Introduction

The engine of economic growth is closely related to the sustainable business environment and competitiveness of a destination, which promotes the creation of wealth that in turn produces value to the relevant stakeholders. Simultaneously, tourism is generally regarded as an essential instrument for social and economic development [1]. The study on tourism destination competitiveness from the perspective of the business environment has gained increasing attention [2,3,4]. The ultimate goal of competitiveness is to create and maximize the real income and social benefits for the citizens, usually reflected in diverse aspects, such as the creation of new jobs, better living conditions, and the increasement of overall living standards. Zehrer et al. [5] expressed that comprehensively measuring the competitive advantages of a tourism destination has been a crucial subject.
The success of a tourist destination is influenced by its competitiveness level within the total share of the world tourism market [6,7,8,9,10]. Destination competitiveness is of considerable interest to policy makers and stakeholders, and makes them constantly invest substantial capital in tourism-related attractions with strong competition to attract tourists [11]. Meanwhile, tourism researchers also continue to pay in-depth attention to multi-faceted tourism destination competitiveness [7,8,12]. Different from the traditional goods and service business, the contemporary tourism industry with severe competition not only needs to reflect both the generic competitive characteristics of the basic framework in the studies of Porter [13] and Miles and Snow [14] but also needs to integrate the dominant viewpoint of the business environment offered by Stevenson and Jarillo [15]. Although the conception of tourism competitiveness has been extensively examined by prior scholars [5,11,16,17], the research perspective that combines the conception of competitive advantage with the business environment has not been sufficiently unearthed [2,4]. López-Sánchez and Pulido-Fernández [18] stated that destination sustainability has conclusively been considered among the crucial indicators of tourism competitiveness; it plays a significant role in the process of evaluating business management decisions, government actions, and designing tourism blueprints. As such, it is vital for tourism practitioners, business stakeholders and managers, as well as the government to determine the significant factors influencing destination sustainability and the national tourism competitiveness for appropriately matching corresponding resources and implementing management tactics and creating value for travelers [3,18]. The distinctive combination of tourism destination and business environment is essential to capture the exhaustive tourism competitiveness [2], which could lead business stakeholders and tourism operators to make ingenious and accurate decisions in the face of internal and external competition and threats.
Numerous scholars acknowledged that identifying the composite indicators in tourism destination competitiveness research plays a significant role in formulating tourism programs and decision-making, which is also a benefit for evaluating tourism performance, analyzing target market, and forecasting future blueprints [19,20,21]. The commonly utilized indicators in tourism are mostly related to destination competitive advantages, which have indicated the rankings in attractive destinations and promoted the debate regarding the appropriateness of existing formed destination competitiveness definitions and measurements [20,22,23]. Additionally, the interdependence between a destination and its tourism companies [24], and the strategic business management in tourism and hospitality industries are constantly being valued by scholars [4,25,26,27]. Nonetheless the current tourism research has not fully explored such indicators that influence the tourism destination business environment [2]. In other words, it has been recognized that a universal set of destination-specific items encompassing the tourism destination business environment and competitive advantages is relatively insufficient; thus, the research attempts integrating the business environment with competitive advantages of a tourism destination are urgently needed.
A prior study by Enright and Newton [12] investigated tourism destination competitiveness from two standpoints: the destination business environment and competitive advantages, but there is no specific theoretical or practical framework utilized to identify the structure and attributes of measurement items through employing a rigorous process. Another most recent study by Michael et al. [3] studied tourism competitiveness from a business perspective and pointed out that the consistent measurement frameworks in destination competitive advantages should be identified with changing situations in the business environment. Therefore, developing a model for destination competitiveness should not only identify the inherent pros and cons of different tourism destinations but also indicate how and why these strengths and weaknesses change under certain business circumstances, which could help to strengthen the overall destination competitiveness through seizing the opportunities and avoiding or defeating the potential threats.
Considering that the research gap and the destination business environment and competitive advantages have not been investigated comprehensively in the tourism sector, this study intends to inspect the tourism competitiveness within the perspective of the business environment and competitive advantages. Overall, the research objectives are summarized to (1) verify the significance of empathizing with the tourism destination business environment, (2) propose the available research framework containing the significant indicators that can be used for determining the business environment and competitive advantages of any given tourism destination, and (3) generate the effective measures and implications for tourism operation and business stakeholders to enhance destination competitive advantages and optimize its business environment, through developing a sound and rigorous measurement model.

2. Literature Review

2.1. Tourism Competitiveness and Its Applications

Tourism competitiveness generally represents the competence of a tourist destination to heighten its attractiveness for locals and travelers, through delivering high-quality, innovative, value-added products that tourists are concerned about and customer-oriented tourism services that are helpful to obtain domestic and global market shares and maintain its market position while competing with its competitors [28,29,30,31,32], which also contributes to the efficient and sustainable utilization of tourism supporting resources [3,33]. Tourism competitiveness is closely linked to the economic prosperity of a whole country [7,34]; it encompasses price differentials coupled with exchange rate movements and productivity levels of various components of the tourism industry [28]. A certain tourism destination may be competitive or uncompetitive in different circumstances; it is essential to identify which destinations perform more competitively [35,36].
Numerous studies have examined tourism destination competitive advantages [5,11,16,17], and several significant tourism destination competitiveness models that gained worldwide recognition were perceived as the proper approaches to evaluate tourism destination competitive advantages (e.g., [7,12,19,21,37,38]), and were also tested in differing cases (e.g., [5,17,39,40,41]). The prior works of literature with regard to competitive and comparative advantages are quite relevant to the business environment [7,12,42]. With the advancement of human society, the assessment of tourism competitiveness cannot be based only on primary consideration on tourism performance and competitive advantages, but from a more progressive insight. In particular, how to promote the sustainable tourism competitiveness through enhancing entrepreneurship ecosystem [27], constructing the positive relationships between the government and tourism development [43], and optimizing business management environment [3,4,25,26,44] has become a meaningful research issue, which leads to the suitable measures, and a conceptual framework utilized to evaluate a tourist destination competitiveness requires a critical investigation of the literature to identify the sufficient reinforcement of information on the destination business environment (DBE) and destination competitive advantages (DCA). That is, the determinants that affect the competition level of tourism destinations must be essentially related to the competitiveness of tourism-related constituent firms and based on the generic business strategy views identified by Porter [42], Miles and Snow [14], and Stevenson and Jarillo [15].

2.2. Tourism Competitiveness from the Perspective of the Business Environment

To a large extent, the tourism-related business environment significantly affects destination competitiveness from visitor amounts and travel expenditures; it has been considered to be capable of enhancing national competitiveness against other countries [3,45,46]. The business environment could be recognized as the various phenomena owing to the organization control, which embraces a series of resources and actors that influence the forms, management, and fate of firms [47]. Compared with tourist perspective, it is more convincing to analyze destination competitiveness from a business perspective, which is supportive because the various stakeholders with rich tourism business experience are the real specialists in formulating accurate decisions and assessing objective investment conditions while complying with local regulations [45,48]. The most recent research demonstrated that the sustainable destination management inputs and competitiveness are inseparable from technology innovation, business management environment, entrepreneurship, and government supports [18,25,26,27,43,44,49].
Competitiveness in the business environment has been examined by previous studies. Bourgeois [50] categorized the external environment as the general environment and task environment. The general environment includes economic, political, social, cultural, and ecological status, while the task environment incorporates customers, suppliers, competitors, and regulatory groups [51]. Porter [13,42] concentrated on industrial structure (task environment) to hinder the business environment estimation from being far-sighted and wide-ranging, and five forces of competitive pressure are roughly asserted, including competition from substitutes, entrants, and established rivals, and the bargaining power of suppliers and buyers. The recent trend in the study of sustainable tourism competitiveness was systematically discussed by Morant-Martínez et al. [27] in terms of entrepreneurship and tourism ecosystem: their study proposed that the entrepreneurship and tourism ecosystem are tightly related with five elements containing markets, policy, finance, human capital, culture, and supporting resources, which majorly incorporate the specific factors such as leadership, government, financial capital, non-government and educational institutions, labor, infrastructures, and networks.
Some literature focused on the associations between destination competition and its influencing factors related to suppliers’ viewpoints (e.g., [7,38,52]). Although the significance of these factors may vary in different tourism sectors, the customer-oriented service quality, and the cooperation willingness of tourism enterprises in some specific contexts and their cooperative ability of providing value-added services etc. have always been considered to play a vital role [3]. Considering the tourism practitioners, the indicators that require more consideration incorporate the ability and specialization of operating new technologies, availability of products and information, efficiency of services and communication, and related industry support etc. [27,40,43]. In particular cases, the substantial factors could include economic strength, the general business environment and strategies, customer demands and market potentials (e.g., China and other Asia Pacific marketplaces), global positioning, industry commitment, government support (e.g., incentive capitals, political stability, and policy-making transparency), accessibility (e.g., transportation), convenience, expenditures, leisure level, corporate community involvement, and corporate green behaviors [3,43,44,49,52]. Additionally, the empirical studies of factors affecting the price competitiveness of tourism firms also indicated the significance of technology levels, exchange rates, government policies, industry competition, and the penetration of multinational enterprises [28].

2.3. Composite Determinants of Tourism Destination Competitive Advantages

Destination competitiveness mainly relies on the comparative and competitive advantages of a destination [3]. The previous authoritative literature demonstrated that the significant elements influencing tourism destination competitiveness could be summarized as: (1) key resources and attractors containing physiography, climate, culture, entertainment, and activities/events, etc.; (2) supporting resources incorporating accessibility, infrastructure, tourism superstructure, hospitality, and policies, etc.; (3) destination management involving marketing, information, resource stewardship, finance and venture capitals, crisis/risk estimation, human resource upgrade, visitor administration, staff skills, managerial skills, service, and financial systems, etc.; (4) qualifying and amplifying inputs comprising safety, costs, location, interdependencies, image, finance, venture, and carrying capitals, etc.; (5) the global macro- and microenvironment including demographics, technology, tourism agencies, suppliers, stakeholders, residents, employees/staffs, currency flow, and financial systems, etc.; (6) sustainable drivers of tourism competitiveness embodying philosophy, international vision and positioning, market potentials, industry commitment, corporate community involvement, and green behaviors, etc. [3,4,5,7,17,27,37,43,44,49]. Nonetheless, Dwyer and Kim [21] and Heath [53] addressed that Ritchie and Crouch’s study lacks investigation in the crucial indicators of destination competitive advantages (e.g., information supervision and communication), and they further proposed additional diversified determinants that affect the firm’s business model in a tourism destination, containing socio-economic, regulatory, and competitive trends (i.e., multinational and local firm competition). Meanwhile, the products and service forms are constantly being influenced by future tourists’ demands/preferences and industrial demands [27]. However, Azzopardi and Nash [54] indicated that Dwyer and Kim ’s model [21] lacks sufficient result reliability and validity. In the research of convention destination, a destination’s competitive aspects are often compared to alternative destinations with seven elements: facilities, accessibility, service quality, affordability, location image, climate environment, and attractiveness [55,56,57]. Destination price competitiveness is also recognized as one of the significant factors influencing visitor flow; tourists’ sensitivity to prices needs more attention [3,28,58].
Owing to the theoretic and practical deficiencies of developing the comprehensive tourism destination competitiveness models, academics struggled to identify the significance and relations of diverse destination competitive determinants [3,59]. Arguably, the measurement models for destination competitiveness that have been constructed so far are not very comprehensive and suitable to all tourism destinations, especially in those small and emerging economies with inadequate resources [3,40]. Specifically, Porter’s model of competitive advantages [13,42] argued that the role of the tourism business environment cannot be ignored. Tourism destination competitiveness is determined by the incorporation of destination attractions and the business environment that affects the overall tourism performance [12,27,40,44,49]. Competitive advantages depend largely on the capacity of tourism organizations to solidify their investments in the business, to earn the investment return, and to ensure jobs for the future. Unfortunately, it has been recognized that no universal set of measurement scales exists in developing tourism-specific items based on the destination business environment and competitive advantages. Therefore, methodological approaches that capture the main measurement elements of generic business research combined with tourism literature are necessary.
In view of the above-mentioned statements, the examined factors influencing the destination business environment and competitive advantages in the original and most recent studies by scholars from different countries are shown in Table 1, which is summarized into four themes to thoroughly display a strategic and holistic competitiveness measurement for tourism destinations.

3. Methodology

3.1. Measurement Instrument

Designing a comprehensive measurement for destination competitiveness in terms of business environment and competitive advantages is a multi-faceted program, especially in the specific tourism setting; not only does a set of competitiveness indicators needs to represent the major elements comprising the generic tourism destination competitive attributes, but it also needs to be based on the business perspective. In the initial stage of this study, the primary items that are required to clearly reflect the particular characteristics of a destination business environment and its competitive advantages were carefully selected and classified after referring to the prior literature [3,7,12,13,55,60]. The content validity of the measurement instrument was verified through a Delphi technique employing 20 professionals and faculty members in tourism-related and business strategic management areas to assess the relative agreement of the characteristics interpreting the tourism business environment and competitive advantages, which contributes to the measurement appropriateness and practicality. Then, several tourism practitioners and professionals were invited into interview to discuss the rationality and face validity of the whole measurement scale. It is crucial to gain thorough insight into the thoughts of individuals who could respond to the questions regarding both two aspects. Lastly, a final survey instrument finalized with 37 items regarding the tourism destination business environment and 85 items regarding destination competitive advantages was utilized for data collection to generate the potential dimensions.

3.2. Data Collection and Samples

Researchers in the general management field commonly recruit business managers and tourism-related practitioners with not less than 2 years industry management experience as the survey participants. The managing directors or the most senior staff in the organization/firms have distinctive insights into the overall business environment and tourism attractors, and are knowledgeable about the major competition in the industry according to their substantial industry experience. It is normal for tourism industry practitioners as the appropriate survey participants to evaluate destination performance [63,64], particularly those who are experienced in dealing with tourists, which is in favor of the accurate measures of the tourism attractors because such “experts” have been observing tourists’ actual behaviors, and they are equipped to comment on what factors could evoke tourists’ different reactions and preferences, based on their working experience and that their opinions would be able to represent diverse groups of tourists [65]. Thus, this study employed convenience sampling to collect data from national tourism administration and main tourism agencies, chambers of commerce, as well as the universities that are known for tourism and business management majors in Busan, South Korea. The reason for utilizing this approach lies in the cost savings compared to a large-scale survey.
A well-trained survey team comprising several faculty members and graduate students was arranged to conduct the data collection. The screening questions (e.g., Are you in the middle or senior management position in the tourism field?) were queried to guarantee participant validity. Among the people approached by the survey team, 195 participants who are the middle and senior managers of travel agencies, top managements in the chamber of commerce with domestic and international business experience, stakeholders in the hospitality and tourism industry, tourism administration officials, as well as the faculty members in business and tourism management areas agreed to assist in the research. Then, the survey which utilized a 7-point Likert scale (1 = “strongly disagree”; 7 = “strongly agree”) was addressed to them. Additionally, to avoid unengaged response, researchers provided participants with a face-to-face introduction on the research purpose and replied to their confusion during the filling process, and the prepared gift vouchers were distributed to them when they submitted the survey.
Out of 195 cases, a total of 187 valid responses remained for the next data analysis, which represented an overall 96% response rate. Sample demographic characteristics are reported in Table 2. Among these respondents, about 65.8% were male, whereas 34.2% were female. The samples were largely distributed between the age groups from the 30s to the 50s. Most respondents (81.3%) have a bachelor’s degree or above, and about 61.5% of the participants stated that they are married. All participants’ work characteristics are closely related to tourism and business fields, with adequate working seniority and industry experience.

4. Results

4.1. Exploratory Factor Analysis

Before the Exploratory Factor Analysis (EFA), the collected data were conducted to internal consistency measures for verifying reliability [66]. Initially, the destination business environment and destination competitive advantages were measured with 37 items and 85 items to assess the internal consistency. In general, the obtained item-total correlation coefficient was above 0.5, which indicates the high internal consistency. Reliability of the multiple-item scale developed in this current study was further improved by removing the scale items that demonstrated low item-total correlations. After the further measurement refinement, 23 items for the DBE and 43 items for the DCA remained. The Cronbach’s Alpha values of DBE and DCA were at 0.95 and 0.94, respectively, indicating that the reliability of the destination business environment and competitive advantages was acceptable. Then, the two separate EFAs utilizing principal component analysis with the varimax rotation method were executed to identify the underlying dimensions of these two study constructs (i.e., DBE and DCA). The evaluation outcomes are presented in Table 3 and Table 4.
The EFA results on DBE exhibited a Kaiser–Meyer–Olkin value of 0.899, and Chi-square at the Barlett test of sphericity was 2258.384 at a significant level of 0.000. The results showed a satisfactory data fit. Six factors of DBE—dynamism, hostility, turbulence, investment, information technology, and governance—were identified to conduct the next analysis. The second EFA outcomes on DCA revealed a Kaiser–Meyer–Olkin score of 0.940, and Chi-square at the Barlett test of sphericity was 7002.325 at a significant level of 0.000. The outcomes were adequate to reflect a satisfactory data fit. Seven factors of DCA containing defensiveness, local acceptance, accessibility, reasonableness, uniqueness, supportiveness, and image sustainability were generated to continue the further analysis. The intercorrelation among the variables was examined in the EFA process at a significance level of 0.5, and all factors loaded above 0.5 except for the single item named as investment incentives in the factor of government, which is still a sufficient standard of factor loading.

4.2. Confirmatory Factor Analysis

Venkatraman and Grant [67] stated that a well-developed survey scale needs such main requirements that the scale should be composed of multiple and high credible items, and its internal consistency and construct validity should be reliable. Seager and Grover [68] argued that the use of EFA to assess construct validity has the following shortcomings: (1) not providing the convincing statistics on convergent and discriminant validity; (2) only one estimation is identified for factor loadings, even facing the infinite possible cases; (3) the arbitrary criterion used to remove or retain measurement items could cause a construct over-factor or under-factor. To avoid such defects, a confirmatory factor analysis (CFA) with the method of likelihood ratio chi-square statistic was employed to evaluate instrument validation and amend instruments for better psychometric properties, and to adjust the proposed model to a better model fit [69,70,71]. The confirmatory factor analysis for this study adopted R program language. Hence, 23 items of DBE and 43 items of DCA were subjected to a second-order CFA to examine the well-fitting measurement model.
The statistic outcomes of DBE scale with six underlying factors (i.e., dynamism, hostility, turbulence, investment, information technology, and governance) provide evidence that the differences of the predicted and actual matrices are non-significant, indicating an adequate fit. The chi-square value of this measurement model was 512.173 with 224 degrees of freedom (p < 0.000). In addition, the comparative fit index (CFI) was 0.869, the Tucker-Lewis index (TLI) was 0.853, and the root mean square error of approximation (RMSEA) was 0.083. The second-order measurement model of DBE fitted the experimental data well; the specific results are reported in Figure 1 and Table 5.
The second-order measurement model of DCA scale with seven underlying factors (i.e., defensiveness, local acceptance, accessibility, reasonableness, uniqueness, supportiveness, and image sustainability) was also proved to fit the data well. The chi-square statistic for this measurement model was 2198.325 with 812 degrees of freedom (p < 0.000). The goodness-of fit indices showed as: CFI = 0.815; TLI = 0.804; and RMSEA = 0.096. All study constructs are well retained for the satisfactory loadings and the recommendation of modification index. The specific outcomes are summarized in Figure 2 and Table 6.
Simultaneously, the second-order confirmatory factor analysis for both DBE and DCA was also conducted in this study. The chi-square statistic for the model was 4104.74 with 2001 degrees of freedom (p < 0.00). The additional model goodness-of fit statistics (CFI = 0.795; TLI = 0.785; and RMSEA = 0.074) indicated that the combined measurement model including DBE and DCA fitted data well; the overall measurement model was acceptable. The specific results are reported in Figure 3 and Table 7.

4.3. Measurement Model Validity

In brief, the convergent and discriminant validity were verified among study constructs. Convergent validity was evaluated through examining the t tests for the factor loadings of each indicator within the good-of-fit indices. The t values show that all variables are significantly associated with the particular constructs, verifying the posited relationships among indicators and constructs [72,73]. Once all t tests performed significantly, then the construct was effectively measured by these indicators. The outcomes revealed that all the t-values were prominently different from zero at p < 0.05. There was high explanation power among the DBE and DCA items. R-squares and F-values of these three measurement models were above 0.70 and 0.72, respectively, at the significant level of 0.000, which guaranteed the strong association between the attributes of DBE and DCA, and supported the measurement validity.
Furthermore, discriminant validity among constructs was examined by the chi-square difference test to check if the chi-square value of the large number of constructs was significantly different from that of the lower constructs [74,75]. Both the one-construct models of (DBE or DCA) and the two-construct combined model (DBE and DCA) were subjected to the chi-square difference examination. The chi-square of the one-construct model for DBE was 512.173 with 224 degrees of freedom and for DCA was 2198.325 with 812 degrees of freedom. The chi-square of the two-construct model was 4104.744 with 2001 degrees of freedom. The chi-square difference between the single-construct model for DBE and the two-construct model was 3592.571 with 1777 degrees of freedom. Similarly, the chi-square difference between the single-construct model for DCA and the two-construct model was 1906.419 with 1189 degrees of freedom. The critical chi-square value with 1777 degrees of freedom was 1876.182 at p = 0.05. The critical chi-square value with 1189 degrees of freedom was 1270.332 at p = 0.05. As such, the findings of chi-square difference examination ensured that the discriminant validity, and the discrepancy between DBE and DCA, was established.

5. Discussions

The two separated EFA outcomes generated six essential factors to be considered in the tourism destination business environment and seven distinct factors explicating destination competitive advantages, all of which keep consistent with prior studies [7,12,27,42,53,54]. The distinctive consideration with the business environment and competitive advantages in a destination substantially confirmed the significance of evaluating tourism destination competitiveness from a business perspective [2,3,25,27]. Enhancing destination sustainability and tourism competitiveness in an effective business view is inseparable from sensitive insights into the macro- and microbusiness environment including dynamism (e.g., company strategy and market demands), hostility (e.g., market potentials and international corporation), turbulence (e.g., government policy), investment (e.g., social infrastructure), information technology (e.g., communication facilities), and governance (e.g., policy-making transparency) [3,11,16,27,39,43]. The previous research on the associations between environmental competitiveness, entrepreneurship ecosystem, and tourism development demonstrated that determining such crucial significant factors affecting the sustainable business environment of a tourist destination is conductive to maintaining the continuous business benefits and tourism growth [27,44].
On the other hand, the diverse drivers including defensiveness, accessibility, local acceptance, reasonableness, uniqueness, supportiveness, and image sustainability have been playing a significant role in forming tourism attractiveness and destination competitive advantages [2,12,17,20,24,36]. It is worth addressing that the environmental protection and efficient management could represent a high level of destination distinctiveness [27,44,49]. Moreover, the analysis of competitive advantages must be based on multifaceted aspects including smooth communication, convenient accessibility, shopping, value-added service and products, appealing attractions, authentic cuisines, basic tourism infrastructure/facilities, hospitality, and community involvement; these identified aspects are always regarded as the vital indicators to evaluate the overall tourism performance and competitive advantages [5,27,75,76]. Overall, it is not surprising that the destination sustainability and competitiveness are formed thanks to the comprehensive consideration from both business environment and competitive advantages [3,18,27,44].

5.1. Implications

In terms of the theoretical perspective, although fewer tourism studies have thoroughly investigated this critical topic to date, the designed measurement scale and frameworks of competitiveness in the current research have efficiently uncovered the various determinants from both the inherent tourism destination competitive attractors/attributes and business perspectives related to firm or national competitiveness. The study could provide a more specific evaluation of the factors that affect a destination’s ability or skill to strengthen the attraction and sustainable economic performance in the face of the competitive tourist destinations, which is helpful for tourism practitioners and policy makers to review the weakness or strength of each factor for a specific destination, with reference to the specificity of our measurement scale when considering the feasibility of tourism destination development strategies.
With regard to the practical implications, the experimental analysis results obtained from the methodology process revealed that the relevant stakeholders, business practitioners, and tourism managers/operators must realize the necessity of two-aspect (DBE and DCA) considerations in practical blueprints and decisions for sustainable tourism destination strategies, and must adopt a more proactive approach to discovering the relevant competitors and collaborators, market potentials, and customer demands; complying with regional regulations and policies; utilizing information technology, government supports, and investment incentives; and comprehending the prominent tourism competitive attractors/attributes (e.g., infrastructure, service, hospitality, accessibility, distinctiveness, reasonableness, supporting resources, and image sustainability). Namely, the competitive advantages of the tourist destination itself and its internal and external business environment need to be sensitively discerned and employed.

5.2. Conclusions

The current and latent tourism flows to any destination are indissolubly linked to a destination’s comprehensive competitiveness. It is valuable to develop a series of destination competitiveness indicators that can serve as the applicable guidelines to identify which aspects or factors influence tourism operators’ investment and business concerns as well as tourists’ decision to visit any destination. A competitive tourism destination could not only bring about the greatest benefits to its tourists but also optimize the destination business investment environment, which contributes to the regional economic and social resources optimization. Overall, the study models proved to be adequate in evaluating destination competitiveness in terms of two major issues of the destination business environment and competitive advantages, including a variety of key but easily overlooked drivers, such as consumers’ demands, communication, and information management. The available theoretic and practical implications have been proposed based on the findings of this research. Additionally, the collaborative work from stakeholders, tourists, and tour operators is essential, which could precisely enhance the sustainable destination competitiveness.

5.3. Limitations and Recommendations for Future Research

In general, the outcomes of this study might be interpreted with caution owing to the limited sample population. After all, the data collection was conducted in the South Korean marketplace. Moreover, the work position of all participants does not cover all the relevant tourism and business management areas, and its structure could be further optimized. Hence, to increase the research creditability, further researchers could investigate with more specific and representative respondents from different countries and related industries (e.g., destination management organizations, government experts and agencies), which would help to determine inclusive factors affecting tourism competitiveness within the scope of business. Additionally, the later scholars could combine the qualitative approach, case study, and grounded theory to optimize the methodology process [27,40], performing in-depth interviews with officials, editors, academics and managers/directors of tourism and marketing field, as well as the stakeholders which could include restaurants, hotels, marketing organizations, suppliers, retailers, and transport companies. Future research adopting the same theoretic frameworks developed by this current study at differing regions would help enhance the generalization, which is worthy of encouragement because it helps scholars, practitioners, and shareholders to deepen their knowledge of tourism competition from destination competitive advantages and the business environment.

Author Contributions

Writing—original draft preparation, H.-K.S. and X.C.; writing—review and editing, X.C.; visualization, X.C. and H.H.; supervision, H.-K.S. and H.H.; funding acquisition, H.-K.S. and H.H. All authors have read and agreed to the published version of the manuscript.

Funding

This work was supported by the Ministry of Education of the Republic of Korea and the National Research Foundation of Korea (NRF-2016S1A5A2A01027078).

Conflicts of Interest

The authors declare no conflict of interest.

References

  1. Gao, J.; Wu, B. Revitalizing traditional villages through rural tourism: A case study of Yuanjia Village, Shaanxi Province, China. Tour. Manag. 2017, 63, 223–233. [Google Scholar] [CrossRef]
  2. Mendola, D.; Volo, S. Building composite indicators in tourism studies: Measurements and applications in tourism destination competitiveness. Tour. Manag. 2017, 59, 541–553. [Google Scholar] [CrossRef]
  3. Michael, N.; Resiger, Y.; Hayes, J.P. The UAE’s tourism competitiveness: A business perspective. Tour. Manag. Perspect. 2019, 30, 53–64. [Google Scholar] [CrossRef]
  4. Konovalova, E.E.; Yudina, E.V.; Bushueva, I.V.; Uhina, T.V.; Lebedev, K.A. Forming Approaches to Strategic Management and Development of Tourism and Hospitality Industry in the Regions. J. Environ. Manag. Tour. 2018, 2, 241–247. [Google Scholar] [CrossRef]
  5. Zehrer, A.; Semral, E.; Hallmann, K. Destination Competitiveness—A comparison of subjective and objective indicators for winter sports areas. J. Travel. Res. 2017, 56, 55–66. [Google Scholar] [CrossRef]
  6. Murphy, P.; Pritchard, M.P.; Smith, B. The destination product and its impact on traveler perceptions. Tour. Manag. 2000, 21, 43–52. [Google Scholar] [CrossRef]
  7. Crouch, G.I.; Ritchie, J.R.B. Tourism, competitiveness, and social prosperity. J. Bus. Res. 1999, 44, 137–152. [Google Scholar] [CrossRef]
  8. Pearce, D.G. Competitive destination analysis in South East Asia. J. Travel. Res. 1997, 35, 16–25. [Google Scholar] [CrossRef]
  9. De Holan, P.M.; Phillips, N. Sun, sand, and hard currency tourism in Cuba. Ann. Tour. Res. 1997, 24, 777–795. [Google Scholar] [CrossRef]
  10. Leong, S.M.; Tan, C.T. Assessing national competitive superiority an importance-performance matrix approach. Mark. Intell. Plann. 1992, 10, 42–48. [Google Scholar] [CrossRef]
  11. Zehrer, A.; Hallmann, K. A stakeholder perspective on policy indicators of destination competitiveness. J. Dest. Mark. Manag. 2015, 4, 120–126. [Google Scholar] [CrossRef]
  12. Enright, M.J.; Newton, J. Tourism destination competitiveness: A quantitative approach. Tour. Manag. 2004, 25, 777–788. [Google Scholar] [CrossRef]
  13. Porter, M.E. The competitive advantage of nations. Harv. Bus. Rev. 1990, 68, 73–93. [Google Scholar]
  14. Miles, R.; Snow, C. Organizational Strategy, Structure, and Process; McGraw-Hill: New York, NY, USA, 1978. [Google Scholar]
  15. Stevenson, H.; Jarillo, J.C. A paradigm of entrepreneurship: Entrepreneurial management. Strateg. Manag. J. 1990, 11, 17–27. [Google Scholar]
  16. Dwyer, L.; Dragićević, V.; Armenski, T.; Mihalič, T.; Cvelbar, L.K. Achieving destination competitiveness: An importance–performance analysis of Serbia. Curr. Issues. Tour. 2016, 19, 1309–1336. [Google Scholar] [CrossRef]
  17. Ritchie, J.; Crouch, G. The Competitive Destination: A Sustainable Tourism Perspective; CABI Publishing: Wallingford, UK, 2003. [Google Scholar]
  18. López-Sánchez, Y.; Pulido-Fernández, J.I. 15 Keys Strategies to Promote the Incorporation of Sustainability in Tourists’ Behaviour. In Sustainable Destination Branding and Marketing; CABI: Wallingford, UK, 2019. [Google Scholar]
  19. Croes, R. Measuring and explaining competitiveness in the context of small island destinations. J. Travel. Res. 2011, 50, 431–442. [Google Scholar] [CrossRef] [Green Version]
  20. Crouch, G.I. Destination competitiveness: An analysis of determinant attributes. J. Travel. Res. 2011, 50, 27–45. [Google Scholar] [CrossRef]
  21. Dwyer, L.; Kim, C. Destination competitiveness: Determinants and indicators. Curr. Issues Tour. 2003, 6, 369–414. [Google Scholar] [CrossRef]
  22. Croes, R. Value as a measure of tourism performance in the era of Globalization: Conceptual considerations and empirical findings. Tour. Anal. 2005, 9, 255–267. [Google Scholar] [CrossRef] [Green Version]
  23. Mazanec, J.A.; Ring, A. Tourism destination competitiveness: Second thoughts on the world economic forum reports. Tour. Econ. 2011, 17, 725–751. [Google Scholar] [CrossRef] [Green Version]
  24. Claver-Cortés, E.; Molina-Azorín, J.F.; Pereira-Moliner, J. Competitiveness in mass tourism. Ann. Tour. Res. 2007, 34, 727–745. [Google Scholar] [CrossRef]
  25. Sánchez-Fernández, M.D.; Álvarez-Bassi, D.; Ramón-Cardona, J. Management of Tourist Destinations: The Expectations of Guests on eWOM Generation in Maldonado (Uruguay). Sustainability 2020, 12, 6825. [Google Scholar] [CrossRef]
  26. Varelas, S.; Apostolopoulos, N. The Implementation of Strategic Management in Greek Hospitality Businesses in Times of Crisis. Sustainability 2020, 12, 7211. [Google Scholar] [CrossRef]
  27. Morant-Martínez, O.; Santandreu-Mascarell, C.; Canós-Darós, L.; Millet Roig, J. Ecosystem Model Proposal in the Tourism Sector to Enhance Sustainable Competitiveness. Sustainability 2019, 11, 6652. [Google Scholar] [CrossRef] [Green Version]
  28. Dwyer, L.; Forsyth, P.; Rao, P. The price competitiveness of travel and tourism: A comparison of 19 destinations. Tour Manag. 2000, 21, 9–22. [Google Scholar] [CrossRef]
  29. Hassan, S. Determinants of market competitiveness in an environmentally sustainable tourism industry. J. Travel. Res. 2000, 38, 239–245. [Google Scholar] [CrossRef]
  30. D’Hartserre, A. Lessons in managerial destination competitiveness in the case of Foxwoods casino resort. Tour. Manag. 2000, 21, 23–32. [Google Scholar]
  31. Enright, M.J.; Frances, A.; Scott-Saavedra, E. Venezuela: The Challenge of Competitiveness; St. Martin’s Press: New York, NY, USA, 1996. [Google Scholar]
  32. Law, C.M. Urban Tourism: Attracting Visitors to Large Cities; Mansell: New York, NY, USA, 1993. [Google Scholar]
  33. Dupeyras, A.; MacCallum, N. Indicators for Measuring Competitiveness in Tourism OECD; OECD Tourism Papers, 2013/02; OECD Publishing: Paris, France, 2013. [Google Scholar]
  34. Buhalis, D. Marketing the competitive destination of the future. Tour. Manag. 2000, 21, 97–116. [Google Scholar] [CrossRef] [Green Version]
  35. Kozak, M.; Rimmington, M. Measuring tourist destination competitiveness: Conceptual considerations and empirical findings. Int. J. Hosp. Manag. 1999, 18, 273–284. [Google Scholar] [CrossRef]
  36. Uysal, M.; Chen, J.S.; Williams, D.R. Increasing state market share through a regional positioning. Tour. Manag. 2000, 21, 89–96. [Google Scholar] [CrossRef]
  37. Ritchie, J.R.B.; Crouch, G.I. The competitive destination: A sustainability perspective. Tour. Manag. 2000, 21, 1–7. [Google Scholar]
  38. Mihajlović, I. The impact of global trends at the level of macro environment dimensions on the transformation of travel intermediaries: Case of the republic of Croatia. WSEAS Trans. Bus. Econ. 2014, 11, 663–674. [Google Scholar]
  39. Mihalič, T. Performance of environmental resources of a tourist destination. J. Travel. Res. 2013, 52, 614–630. [Google Scholar] [CrossRef]
  40. Azzopardi, E.; Nash, R. A framework for island destination competitiveness—Perspectives from the island of Malta. Curr. Issues Tour. 2016, 19, 253–281. [Google Scholar] [CrossRef]
  41. Pavlović, D.; Avlijaš, G.; Stanić, N. Tourist perception as key indicator of destination competitiveness. TEME 2016, 2, 853–868. [Google Scholar]
  42. Porter, M.E. Competitive Strategy: Techniques for Analyzing Industries and Competitors; The Free Press: New York, NY, USA, 1980. [Google Scholar]
  43. Kubickova, M.; Martin, D. Exploring the relationship between government and destination competitiveness: The TALC model perspective. Tour. Manag. 2020, 78, 104040. [Google Scholar] [CrossRef]
  44. Zhu, L.; Zhan, L.; Li, S. Is sustainable development reasonable for tourism destinations? An empirical study of the relationship between environmental competitiveness and tourism growth. Sustain. Dev. 2020, 1–13. [Google Scholar] [CrossRef]
  45. Dwyer, L.; Livaic, Z.; Mellor, R. Competitiveness of Australia as a tourism destination. J. Hosp. Tour. Manag. 2003, 10, 60–78. [Google Scholar]
  46. Tsai, H.; Song, H.; Wong, K. Tourism and hotel competitiveness research. J. Travel. Tour. Mark. 2009, 26, 522–546. [Google Scholar] [CrossRef] [Green Version]
  47. Duncan, R.G. Characteristics of organizational environments and perceived environmental uncertainty. Adm. Sci. Q. 1972, 17, 313–327. [Google Scholar] [CrossRef] [Green Version]
  48. Bahar, O.; Kozak, M. Advancing destination competitiveness research: Comparison between tourists and service providers. J. Travel. Tour. Mark. 2007, 22, 61–71. [Google Scholar] [CrossRef]
  49. Yang, X.; Li, H.; Chen, W.M.; Fu, H. Corporate community involvement and Chinese rural tourist destination sustainability. Sustainability 2019, 11, 1574. [Google Scholar] [CrossRef] [Green Version]
  50. Bourgeois, L.J. Strategic management and determinism. Acad. Manag. Rev. 1984, 9, 586–596. [Google Scholar] [CrossRef]
  51. Dill, W.R. Environment as an influence on managerial autonomy. Adm. Sci. Q. 1958, 2, 404–443. [Google Scholar] [CrossRef]
  52. Jin, X.; Weber, X. Exhibition destination attractiveness–organizers’ and visitors’ perspectives. Int. J. Contemp. Hosp. Manag. 2016, 28, 2795–2819. [Google Scholar] [CrossRef]
  53. Heath, E. Towards a model to enhance destination competitiveness: A Southern African perspective. J. Hosp. Tour. Manag. 2002, 10, 124–141. [Google Scholar]
  54. Azzopardi, E.; Nash, R. A review of Crouch and Ritchie’s, Heath’s, and Dwyer and Kim’s models of tourism competitiveness. Tour. Anal. 2017, 22, 247–254. [Google Scholar] [CrossRef]
  55. Go, F.M.; Govers, R. The Asian perspective: Which international conference destinations in Asia are the most competitive? J. Conv. Exhib. Manag. 1999, 1, 37–50. [Google Scholar]
  56. Opperman, M. Convention destination images: Analysis of association meeting planners’ perceptions. Tour. Manag. 1996, 17, 175–182. [Google Scholar] [CrossRef]
  57. Qu, H.; Li, L.; Chu, G.K.T. The comparative analysis of Hong Kong as an international conference destination in Southeast Asia. Tour. Manag. 2000, 21, 643–648. [Google Scholar] [CrossRef]
  58. Lee, C. Major determinants of international tourism demand for South Korea: Inclusion of marketing variable. J. Travel. Tour. Mark. 1996, 5, 101–118. [Google Scholar] [CrossRef]
  59. Abreu-Novais, M.; Ruhanen, L.; Arcodia, C. Destination competitiveness: What we know, what we know but shouldn’t and what we don’t know but should. Curr. Issues Tour. 2016, 19, 492–512. [Google Scholar] [CrossRef]
  60. Enright, M.J.; Scott, E.E.; Dodwell, D. The Hong Kong Advantage; Oxford University Press: Hong Kong, China, 1997. [Google Scholar]
  61. Go, F.; Zhang, W. Applying importance-performance analysis to Beijing as an international meeting destination. J. Travel. Res. 1997, 35, 42–49. [Google Scholar] [CrossRef]
  62. Go, F.; Pine, R.; Yu, R. Hong Kong: Sustaining competitive advantage in Asia’s hotel industry. Cornell Hotel Restaur. Adm. Q. 1994, 35, 50–60. [Google Scholar] [CrossRef]
  63. Evans, M.R.; Chon, K.S. Formulating and evaluating tourism policy using importance-performance analysis. Hosp. Educ. Res. J. 1989, 13, 203–213. [Google Scholar]
  64. Faulkner, B.; Oppermann, M.; Fredline, E. Destination competitiveness: An exploratory examination of South Australia’s core attractions. J. Vac. Mark. 1999, 5, 125–139. [Google Scholar] [CrossRef]
  65. Gearing, C.E.; Swart, W.W.; Var, T. Establishing a measure of touristic attractiveness. J. Travel. Res. 1974, 12, 1–8. [Google Scholar] [CrossRef]
  66. Cronbach, L.J. Coefficient alpha and the internal structure of tests. Psychometrika 1951, 16, 297–334. [Google Scholar] [CrossRef] [Green Version]
  67. Venkatraman, N.; Grant, J.H. Construct measurement in organizational strategy research: A critique and proposal. Acad. Manag. Rev. 1986, 11, 71–87. [Google Scholar] [CrossRef]
  68. Seagers, A.H.; Grover, V. Re-examining perceived ease of use and usefulness: A confirmatory factor analysis. MIS Q. 1993, 517–525. [Google Scholar] [CrossRef]
  69. DeVellis, R.F. Scale Development: Theory and Applications; Sage Publications: Newbury Park, CA, USA, 1991. [Google Scholar]
  70. Dooley, D. Social Research Methods; Prentice-Hall: Upper Saddle River, NJ, USA, 1990. [Google Scholar]
  71. Ennew, C.T.; Reed, G.V.; Binks, M.R. Importance-performance analysis and the measurement of service quality. Eur. J. Mark. 1993, 27, 59–70. [Google Scholar] [CrossRef]
  72. Hair, J.; Black, W.; Babin, B.; Anderson, R. Multivariate Data Analysis, 7th ed.; Pearson New International Edition; Pearson Education Limited: Essex, UK, 2014. [Google Scholar]
  73. Kline, P. Handbook of Psychological Testing; Routledge: London, UK, 2000. [Google Scholar]
  74. Chi, X.; Lee, S.K.; Ahn, Y.; Kiatkawsin, K. Tourist-Perceived Quality and Loyalty Intentions towards Rural Tourism in China. Sustainability 2020, 12, 3614. [Google Scholar] [CrossRef]
  75. Hatcher, L.H. A Step by Step Approach to Using the SAS System for Factor Analysis and Structural Equation Modeling; SAS Institute Inc.: Cary, NC, USA, 1994. [Google Scholar]
  76. Chi, X.; Han, H. Exploring slow city attributes in Mainland China: Tourist perceptions and behavioral intentions toward Chinese Cittaslow. J. Travel Tour. Mark. 2020, 37, 361–379. [Google Scholar] [CrossRef]
Figure 1. CFA model for destination business environment indirect impact.
Sustainability 12 08587 g001
Figure 2. CFA model for destination competitive advantages.
Sustainability 12 08587 g002
Figure 3. CFA model for destination business environment and destination competitive advantages.
Sustainability 12 08587 g003
Table 1. Factors influencing destination competitiveness.
(1) Macro- and microenvironment and business perspective:
Demographics, residents, employees, retailers, suppliers, stakeholders, transport companies, competitive trends (multinational and local firm competition), cooperation abilities, general business strategies of international and local firms, overall economic status, government policy support, investment incentives, political stability, tax regimes, legislation and regulation, strong currency, policy-making transparency.
(2) Sustainable drivers of tourism development:
Industrial and customer demands (product and service distinctiveness, customer-oriented and niche product/service development, and leisure, etc.), market potentials (China and other Asia Pacific markets, local market demands, and long-term blueprints, etc.), international positioning, industry commitment, corporate community involvement, corporate green behaviors.
(3) Main drivers of tourism attractiveness and supporting resources:
Physiography, climate, culture and history, special events and entertainment activities, tourism infrastructure, information supervision and communication, community institutions, accessibility, hospitality, tourism superstructure.
(4) Destination management and inputs:
Geographic location, transportation facilities, staff skills, local managerial skills, resource stewardship, safety, costs, image, banking and financial system, finance and venture capital, carrying capital, risk estimation, human resource management, visitor administration, additional infrastructure.
Note. Supporting literature [3,4,5,12,13,17,21,27,38,43,44,49,52,53,60,61,62].
Table 2. Demographic information of sample profiles.
VariableCategoryDistributionPercentage
GenderMale12365.8%
Female6434.2%
Age20s3217.1%
30s5227.8%
40s5529.4%
50s4423.5%
60s and over42.1%
Education levelMiddle school or below126.4%
High school2312.3%
Bachelor’s degree8847.1%
Master’s degree2915.5%
Doctorate or higher3518.7%
Marriage statusNot married6936.9%
Married11561.5%
Separated31.6%
Work positionSelf-employed tourism agency manger189.6%
Chamber of commerce management3217.1%
Faulty/researcher in tourism and business fields5428.9%
Tourism administration official8344.4%
Work seniorityLess than 5 years5529.4%
5 years to 10 years 3719.8%
11 years to 15 years 3820.3%
16 years to 20 years3217.1%
More than 20 years2513.4%
Table 3. EFA results for measurement items of the destination business environment (DBE).
VariablesDimensions
DYHOTUINITGO
DY1-Local company strategy0.7540.2180.2070.2650.0190.175
DY2-Local institution0.7650.1730.0970.2870.0900.194
DY3-Local competition0.8340.1710.0970.0760.1710.004
DY4-Local market demand 0.7370.1950.3710.0740.1920.060
HO1-Chinese market potential0.0500.6990.034−0.1080.4200.070
HO2-Local management potential0.2620.5590.246−0.0020.3510.209
HO3-Long-term market potential0.3400.5890.4770.195−0.0420.050
HO4-International corporation0.2930.7310.1820.289−0.045−0.004
HO5-Asia Pacific market potential0.1680.8100.0400.1920.0900.087
HO6-Educational institution0.0630.6550.0890.3400.0950.242
TU1-Government policy0.0930.0260.6790.0000.0990.431
TU2-Geographic location0.1910.0900.6920.1720.3960.146
TU3-Quality lodging facility 0.2710.1460.6870.1170.2050.027
TU4-Related industry support0.0930.2690.7090.3490.0890.167
IN1-Sound corporate cooperation0.2830.2510.1760.7220.0810.126
IN2-Corporate labor expenditure0.2390.3220.0710.7710.0820.092
IN3-Other social infrastructure0.1950.0400.3250.6960.1880.158
IT1-Communication facilities0.2320.1150.0540.1680.8040.162
IT2-Shopping and retail district0.1230.0790.4670.1860.616−0.178
IT3-Information accessibility0.0450.2210.3190.0530.6780.119
GO1-Government fairness0.1160.0560.2040.098−0.0190.817
GO2-Policy-making transparency0.1650.3310.0670.2310.2270.629
GO3-Investment Incentives0.1750.3880.2410.2570.1870.432
KMO Sampling Adequacy = 0.899, Barlett’s sphericity test: χ2 = 2258.384 (df = 276), p = 0.000
Note 1. DY = Dynamism, HO = Hostility, TU = Turbulence, IN = Investment, IT = Information Technology, GO = Governance. Note 2. Factor-loadings of identified dimensions are bolded.
Table 4. EFA results for measurement items of destination competitive advantages (DCA).
VariablesDimensions
DELAACREUNSUIS
DE1-Priority for environmental protection in attraction site0.6230.0390.2190.0110.2510.3000.208
DE2-Efforts for preservation in pristine attractions0.6610.1610.329−0.0780.2510.1710.090
DE3-Prioritized involvement for environmental protection0.7500.1040.1840.0190.2470.1820.168
DE4-Efficiency for cost savings in attractions and tourist spot0.7590.132−0.0630.2370.2220.1820.209
DE5-Efficient maintenance of attractions and tourist spot0.7400.2330.1010.189−0.0110.1990.297
DE6-Efficiency management and cost control in tourist spot0.6720.1590.0710.0820.0130.1460.415
LA1-Local community kind to travelers0.1670.5810.3520.1540.1590.3940.238
LA2-Cooperation of locals0.2830.6650.2500.1040.1020.2770.329
LA3-Easy to communicate with travelers0.2030.7630.1710.0890.1870.2460.233
LA4-Smooth communication between locals and travelers0.1490.7640.2110.1000.2190.1810.280
AC1-Easy to get visa0.2130.1760.5540.1650.3240.3150.245
AC2-Speedy immigration procedure0.1040.1590.7680.0910.1870.2560.280
AC3-Good attitude of immigration and customs personnel0.1710.2170.8020.0960.0560.2080.249
AC4-Conveniently and comfortably accessible to road or bridge0.2750.3360.5800.062−0.0430.2730.316
RE1-Reasonable and convenient lodging0.2600.2400.2590.6550.1250.2680.244
RE2-Reasonable shopping 0.1490.2660.2060.5760.1510.4090.301
RE3-Reasonable food and beverages0.1390.2550.2360.5700.1430.3500.288
UN1-High price but good value for tourist facilities0.2340.0260.1250.3320.5130.2910.230
UN2-Visually strong appeal for attractions0.2170.1800.1790.0380.7710.2300.163
UN3-Well-known landmark0.1610.1450.0340.0150.7890.3390.243
UN4-Strongly appealing attractions0.1920.2150.1000.0540.6910.2440.247
SU1-Delicious local food0.2800.1370.218−0.0870.1270.6320.304
SU2-Good night entertainment and activity0.1440.3450.298−0.249 0.1490.6340.285
SU3-Night attractions sightseeing and entertaining0.1380.3040.198−0.2790.2280.6050.318
SU4-Convenient communication establishment and service for travelers0.1570.0870.3340.1920.2620.5570.383
SU5-Nice security and safety for travelers0.1240.1260.3750.2650.3570.5290.239
SU6-Convenient shopping 0.1830.0310.2380.2290.2170.7050.314
SU7-Superior shopping facility 0.1950.0900.2650.1420.2420.7890.218
SU8-Superior quality to shopping items0.1880.1430.2070.1290.1970.8080.207
SU9-A variety of shopping product 0.2300.1410.1210.1540.2020.8050.201
SU10-Shopping value0.2060.2540.1130.2140.1700.7450.178
SU11-A variety of festivals tailored to a theme 0.1640.418−0.0080.1760.1870.6560.289
SU12-A variety of events tailored to a theme0.1380.4380.0340.1220.1610.6300.282
IS1-Active and sustainable tourism development for a specific theme0.2430.1820.1090.0610.3160.2900.665
IS2-Active and sustainable event development for a specific theme0.1450.2230.2210.0890.1900.3610.661
IS3-Consistent and sustainable support from governmental institutions0.3800.3410.1290.0580.1810.1480.603
IS4-Products with a specific image0.2750.1620.119−0.0030.3670.2960.678
IS5-Active ads and promotion0.1220.1870.0880.0800.2060.2320.787
IS6-Systematic operation in tourist site0.3610.2390.2310.1020.0650.2710.682
IS7-Active product development coordination with other institutes0.2750.1690.2590.1280.0900.1750.734
IS8-Efforts for timely improvement of service quality with traveler’s information0.1780.1790.2910.1110.1250.2900.723
IS9-Good service quality0.2290.1850.3370.2010.1610.4050.553
IS10-Convenient to use financial institutions0.1690.1130.2930.1690.1840.3740.560
KMO Sampling Adequacy = 0.940; Barlett’s Sphericity test: χ2 = 7002.325 (df = 861); p = 0.000
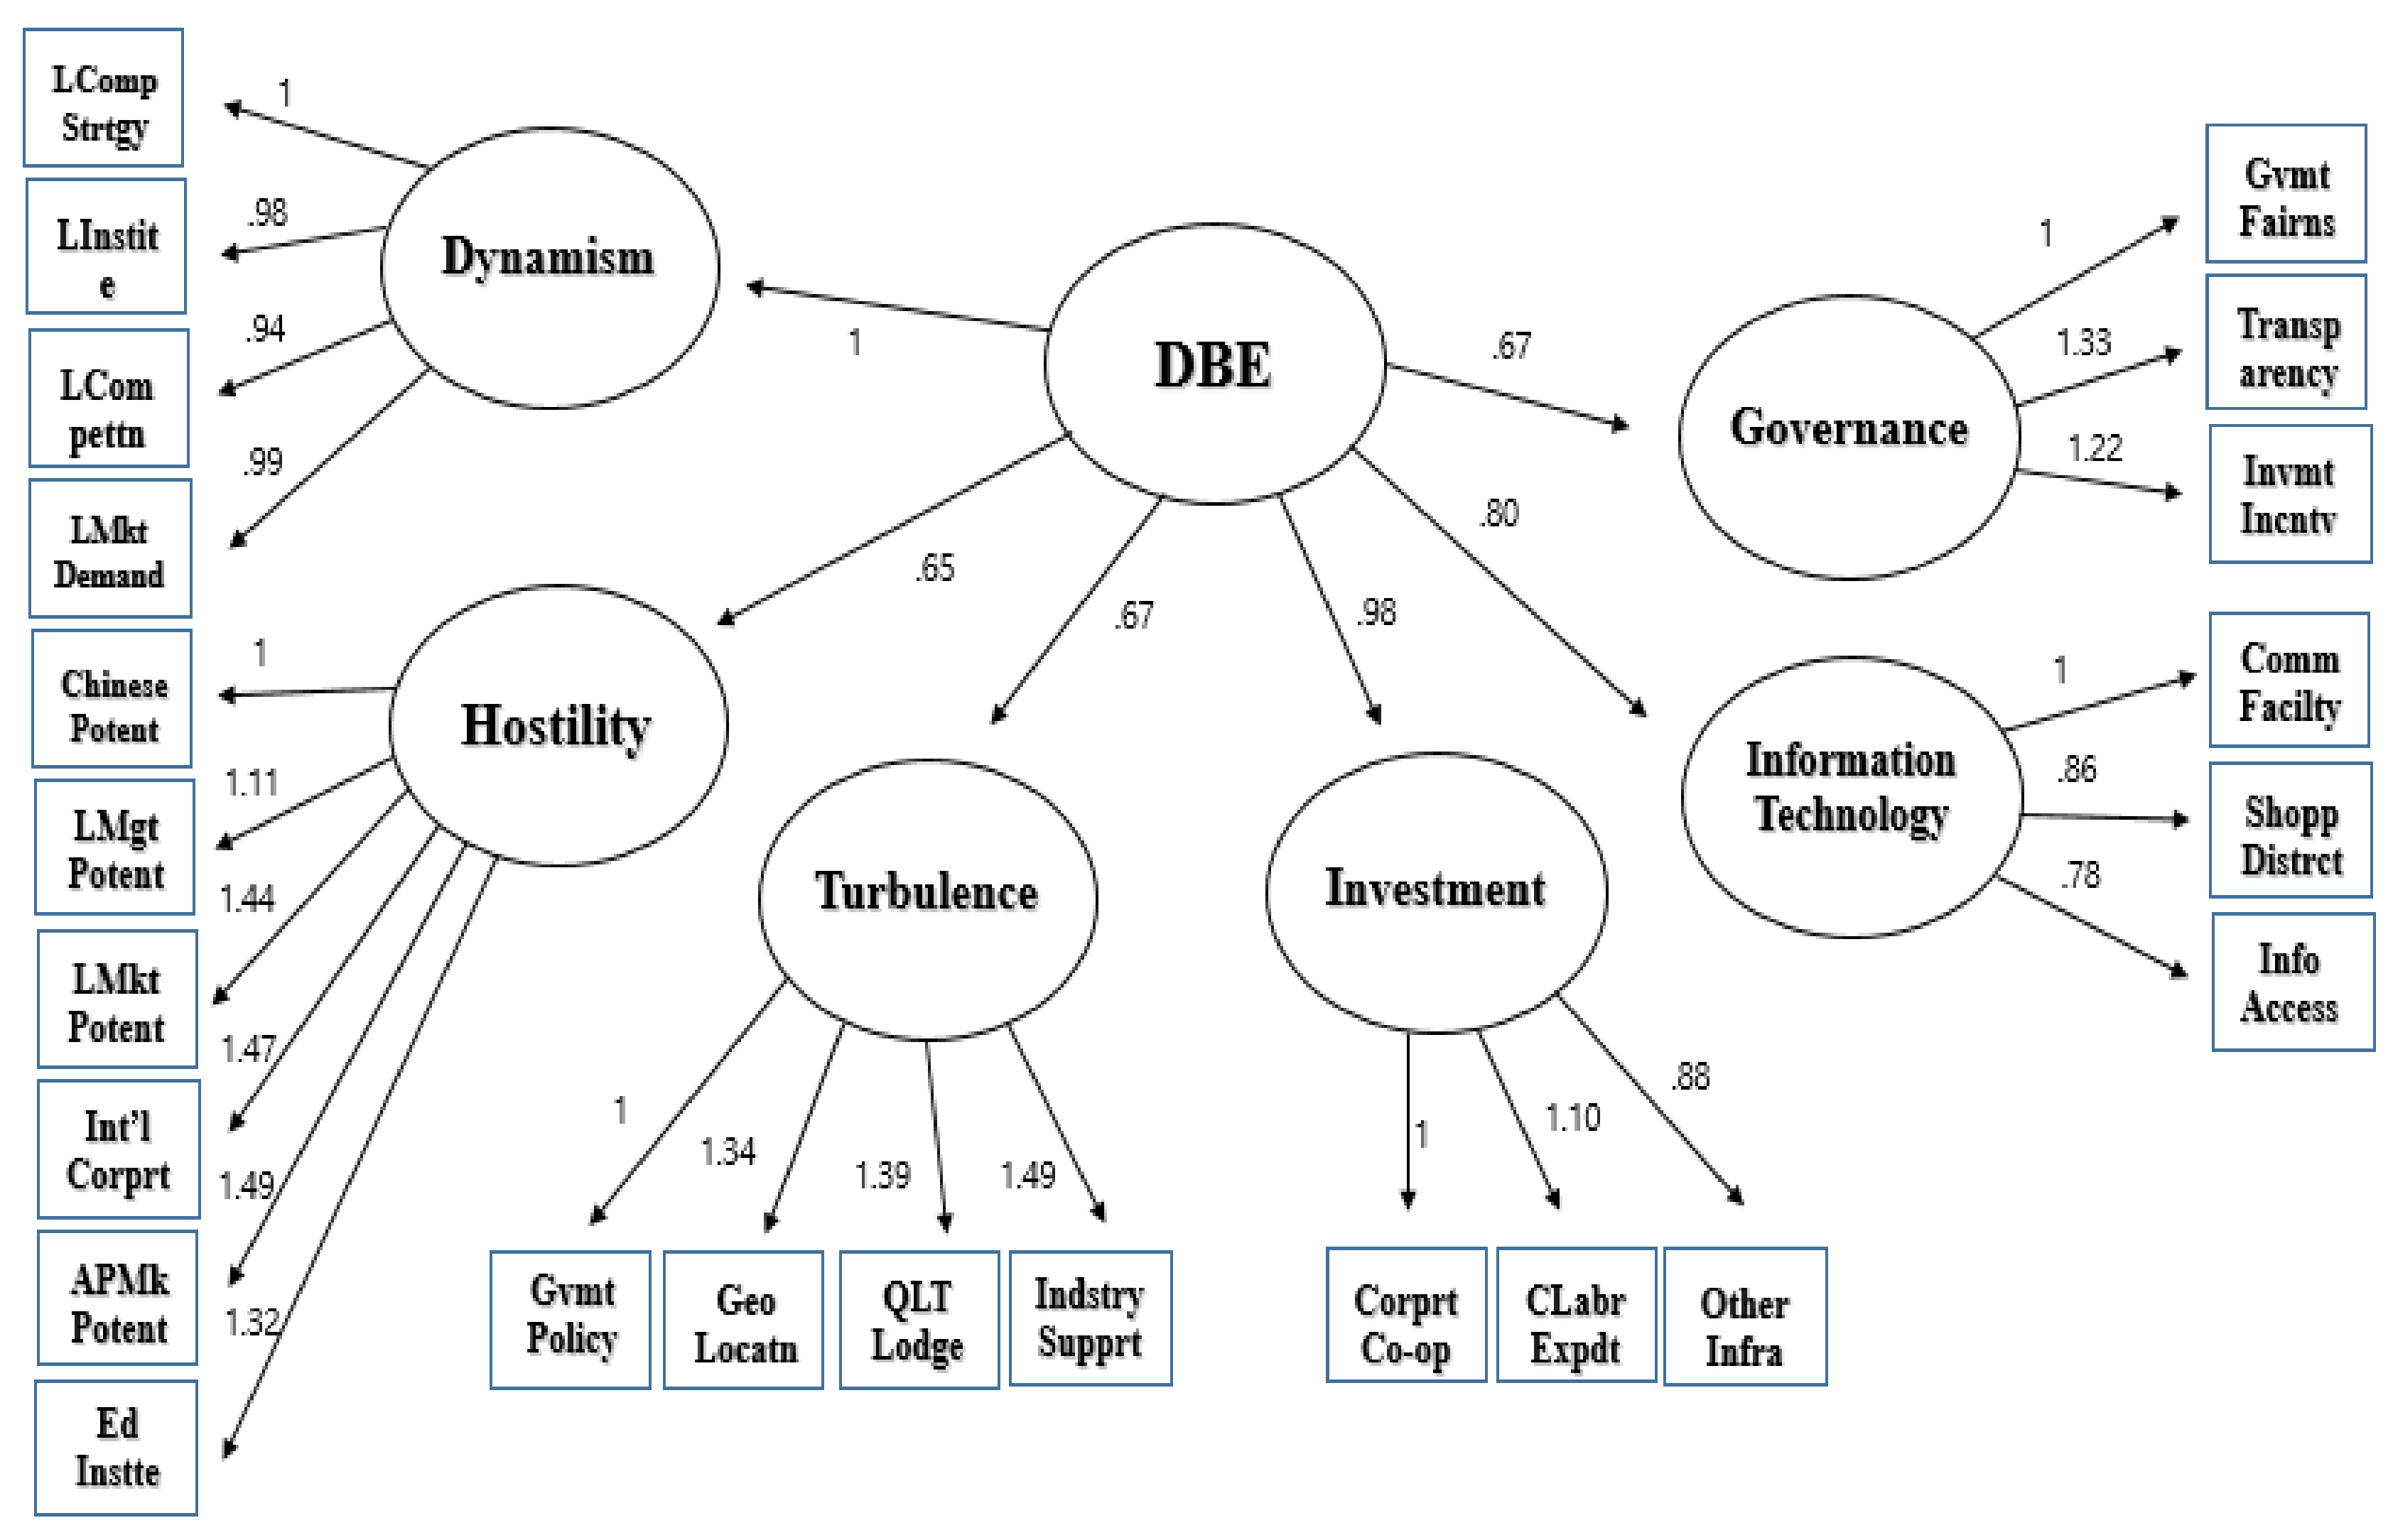
Note 1. DE = Defensiveness, LA = Local Acceptance, AC = Accessibility, RE =Reasonableness, UN = Uniqueness, SU = Supportiveness, IS = Image Sustainability. Note 2. Factor-loadings of identified dimensions are bolded.
Table 5. Second-order CFA results for the DBE.
IndicatorsCompletely
Standardized Loadings
Error
Variance
t-Value (sig.)
Dynamism
Local company strategy1.000
Local institution0.9860.07712.829 (0.000)
Local competition0.9430.08411.201 (0.000)
Local market demand0.9850.08012.328 (0.000)
Hostility
Chinese market potential1.000
Local management potential1.1100.1686.622 (0.000)
Long-term market potential1.4410.1967.355 (0.000)
International corporation1.4650.1937.590 (0.000)
Asia Pacific market potential1.4850.1967.596 (0.000)
Educational institution1.3160.1867.064 (0.000)
Turbulence
Government policy1.000
Geographic location1.3430.1827.388 (0.000)
Quality lodging facility 1.3870.1927.226 (0.000)
Related industry support1.4870.1957.619
Investment
Sound corporate cooperation1.000
Corporate labor expenditure1.1030.09311.818 (0.000)
Other social infrastructure0.7760.0987.891 (0.000)
Information Technology
Communication facilities1.000
Shopping and retail district1.3310.2295.802 (0.000)
Information accessibility1.2200.2205.547 (0.000)
Governance
Government fairness1.000
Policy-making transparency0.6500.1046.254 (0.000)
Investment Incentives 0.6660.1235.416 (0.000)
Destination Business Environment
Dynamism1.000
Hostility0.6500.1046.254 (0.000)
Turbulence0.6660.1076.213 (0.000)
Investment0.9820.1218.096 (0.000)
Information technology0.7950.1156.886 (0.000)
Governance0.6660.1235.416 (0.000)
Fit Statistics:
Chi-square = 512.173 (df = 224, p = 0.000);
CFI = 0.869; TLI = 0.853; RMSEA = 0.083
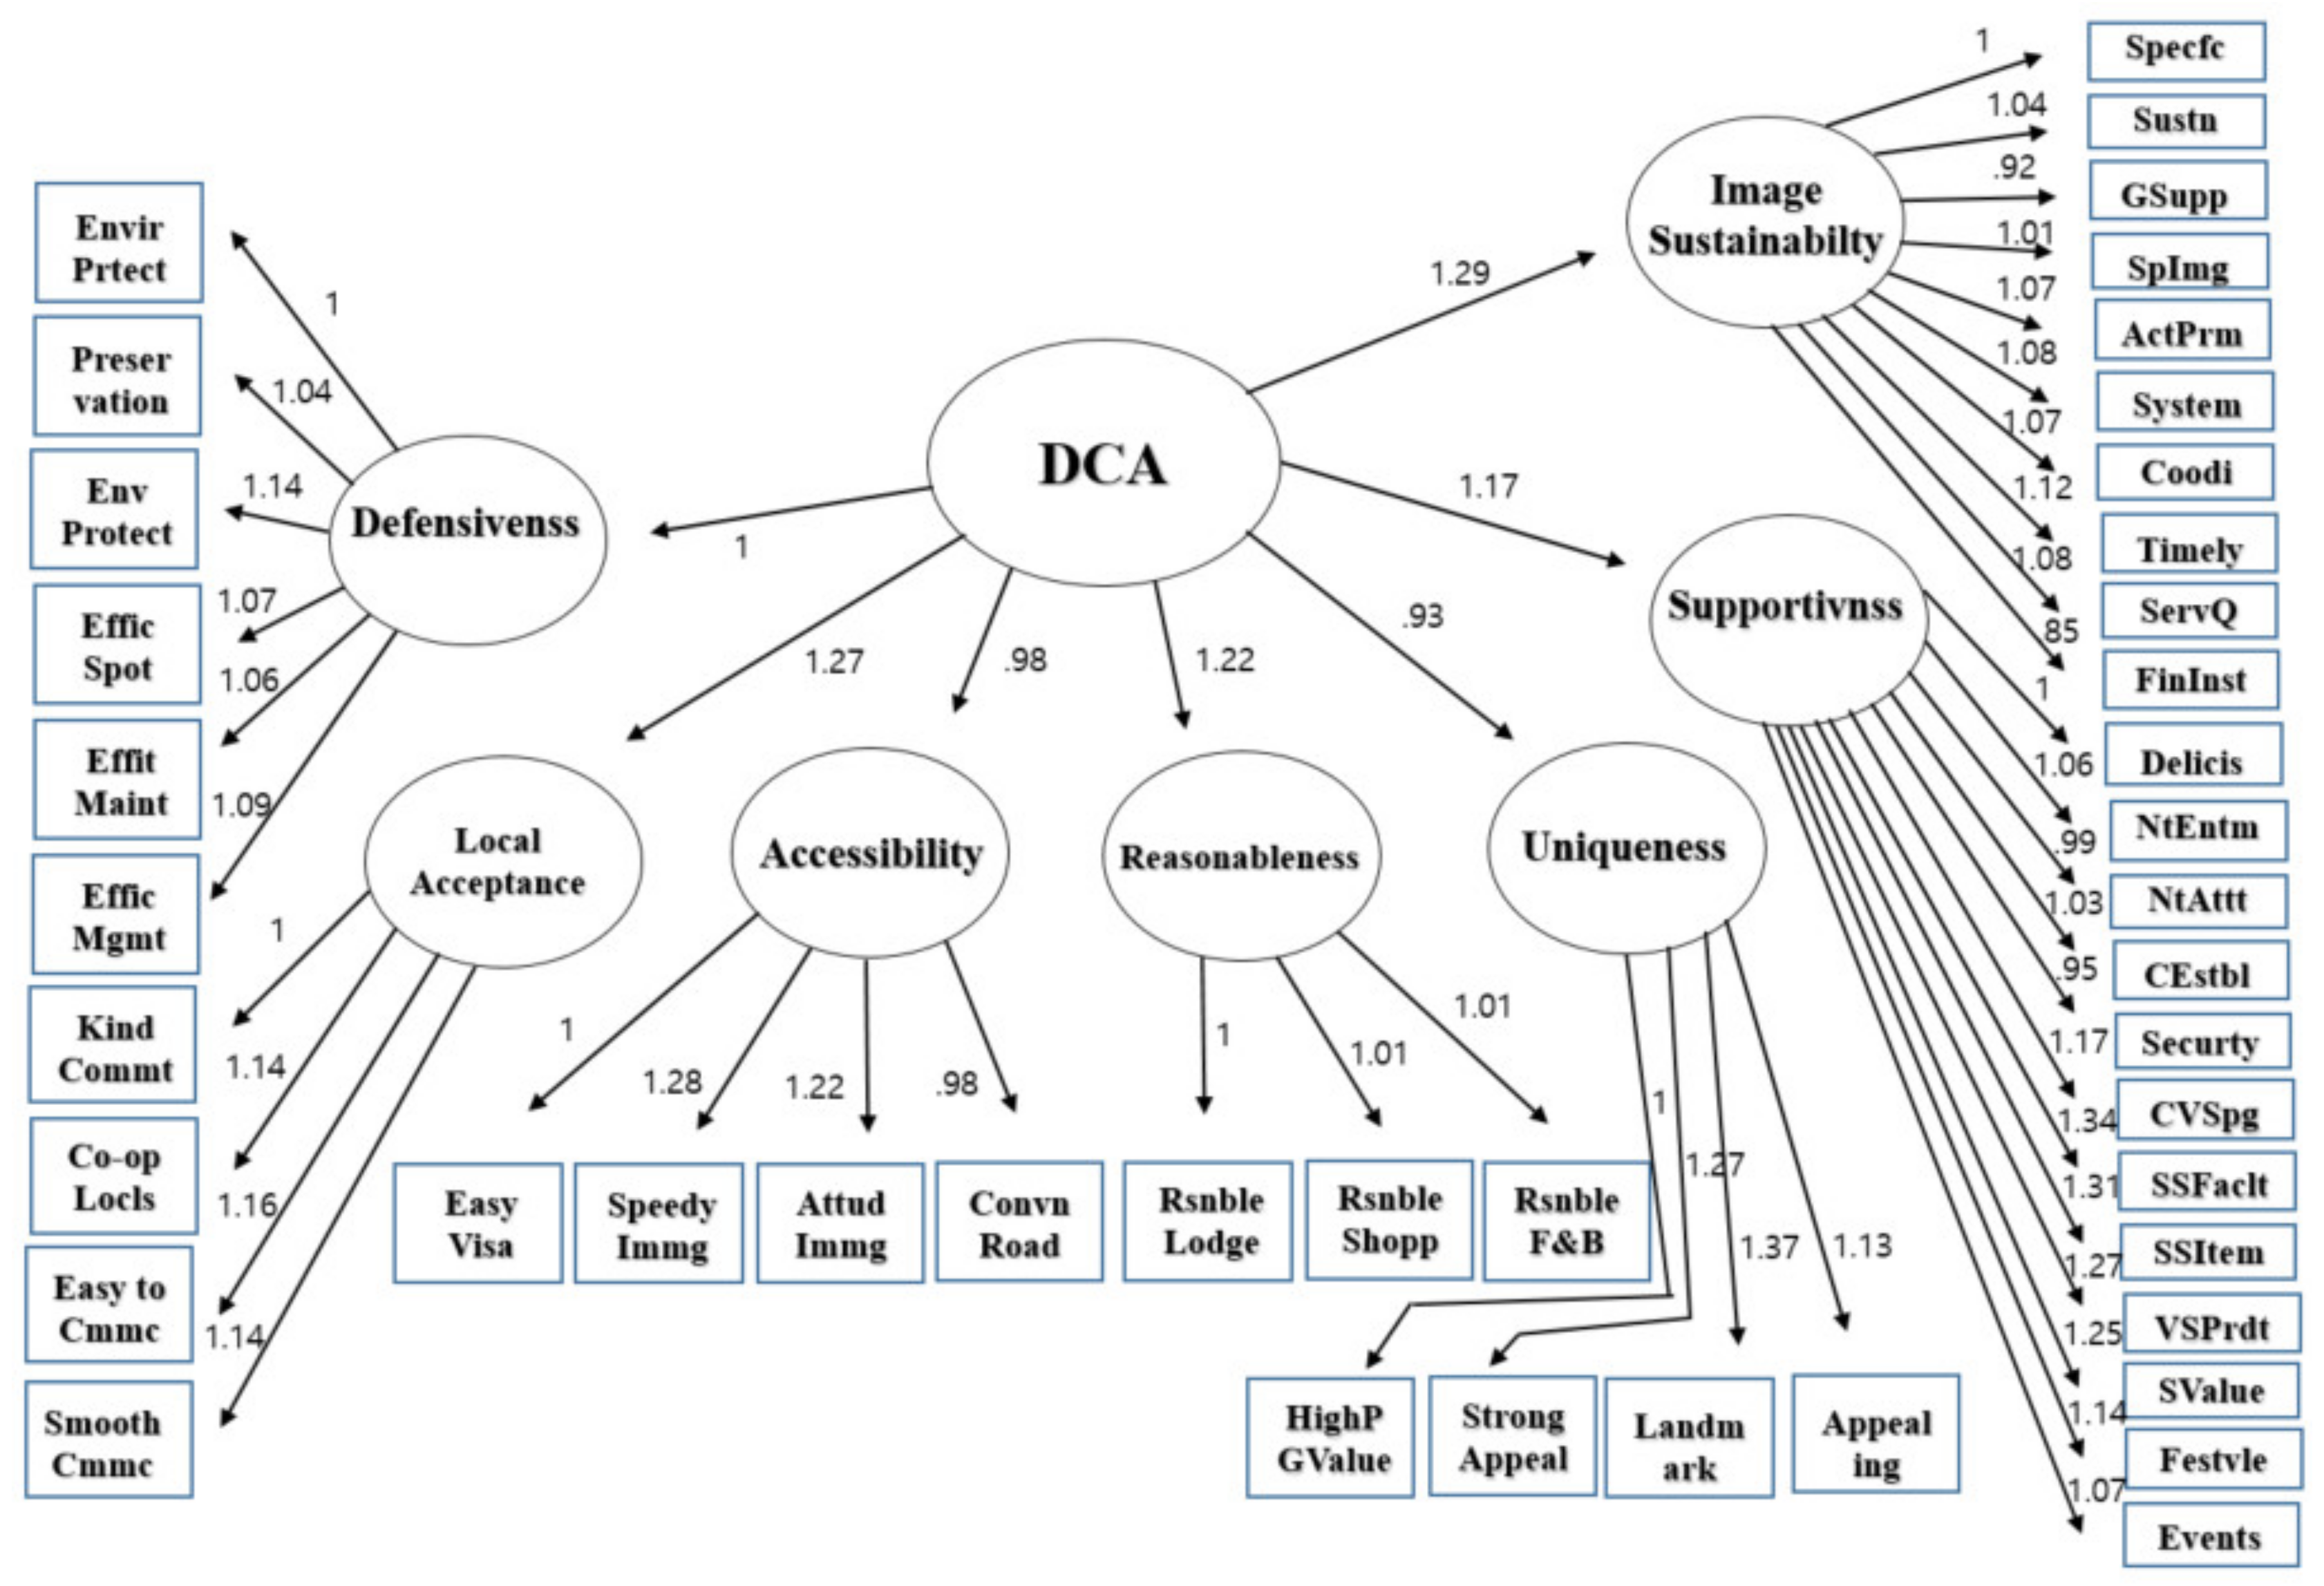
Table 6. Second-order CFA results for the DCA.
IndicatorsCompletely
Standardized Loadings
Error
Variance
t-Value (sig.)
Defensiveness
Priority for environmental protection in attraction site1.000
Efforts for preservation in pristine attractions1.0370.1129.239 (0.000)
Prioritized involvement for environmental protection1.1420.11110.305 (0.000)
Efficiency for cost savings in attractions and tourist spot1.0650.10110.537 (0.000)
Efficient maintenance in attractions and tourist spot1.0620.10610.056 (0.000)
Efficiency management and cost control in tourist spot1.0910.1109.871 (0.000)
Local Acceptance
Local community kind to travelers1.000
Cooperation of locals1.1430.07914.460 (0.000)
Easy to communicate with travelers1.1580.08513.599 (0.000)
Smooth communication between locals and travelers1.1400.08613.218 (0.000)
Accessibility
Easy to get visa1.000
Speedy immigration procedure1.2820.11011.601 (0.000)
Good attitude of immigration and customs personnel1.2150.10311.819 (0.000)
Conveniently and comfortably accessible to road or bridge0.9830.0999.929 (0.000)
Reasonableness
Reasonable and convenient lodging1.000
Reasonable shopping 1.0100.08012.626 (0.000)
Reasonable food and beverages1.0090.08112.457 (0.000)
Uniqueness
High price but good value for tourist facilities1.000
Visually strong appeal for attractions1.2740.1389.199 (0.000)
Well-known landmark1.3680.1439.596 (0.000)
Strongly appealing attractions1.1280.1278.912 (0.000)
Supportiveness
Delicious local food1.000
Good night entertainment and activity1.0630.10310.321 (0.000)
Night attractions sightseeing and entertaining0.9850.1019.796 (0.000)
Convenient communication establishment and service for travelers1.0260.09810.511 (0.000)
Nice security and safety for travelers0.9490.09310.162 (0.000)
Convenient shopping 1.1700.09712.011 (0.000)
Superior shopping facility 1.3370.10412.904 (0.000)
Superior quality of shopping items1.3140.10212.898 (0.000)
A variety of shopping products 1.2740.10212.520 (0.000)
Shopping value1.2510.10511.885 (0.000)
A variety of festivals tailored to a theme 1.1370.10311.050 (0.000)
A variety of events tailored to a theme1.0650.10110.490 (0.000)
Image Sustainability
Active and sustainable tourism development for a specific theme1.000
Active and sustainable event development for a specific theme1.0360.07813.251 (0.000)
Consistent and sustainable support from governmental institutions0.9160.07512.159 (0.000)
Products with a specific image1.0060.07613.295 (0.000)
Active ads and promotion1.0680.08113.154 (0.000)
Systematic operation in tourist site1.0840.07614.179 (0.000)
Active product development coordination with other institutes1.0720.07913.532 (0.000)
Efforts for timely improvement of service quality with traveler’s information1.1220.08014.029 (0.000)
Good service quality1.0770.08412.884 (0.000)
Convenient to use financial institutions0.8460.07611.202 (0.000)
Destination Competitive Advantages
Defensiveness1.000
Local Acceptance1.2670.1637.781 (0.000)
Accessibility0.9820.1456.769 (0.000)
Reasonableness1.2200.1667.331 (0.000)
Uniqueness0.9250.1456.366 (0.000)
Supportiveness1.1670.1557.511 (0.000)
Image Sustainability1.2860.1578.204 (0.000)
Fit Statistics:
Chi-square = 2198.325 (df = 815, p = 0.000);
CFI = 0.815; TLI = 0.804; RMSEA = 0.096
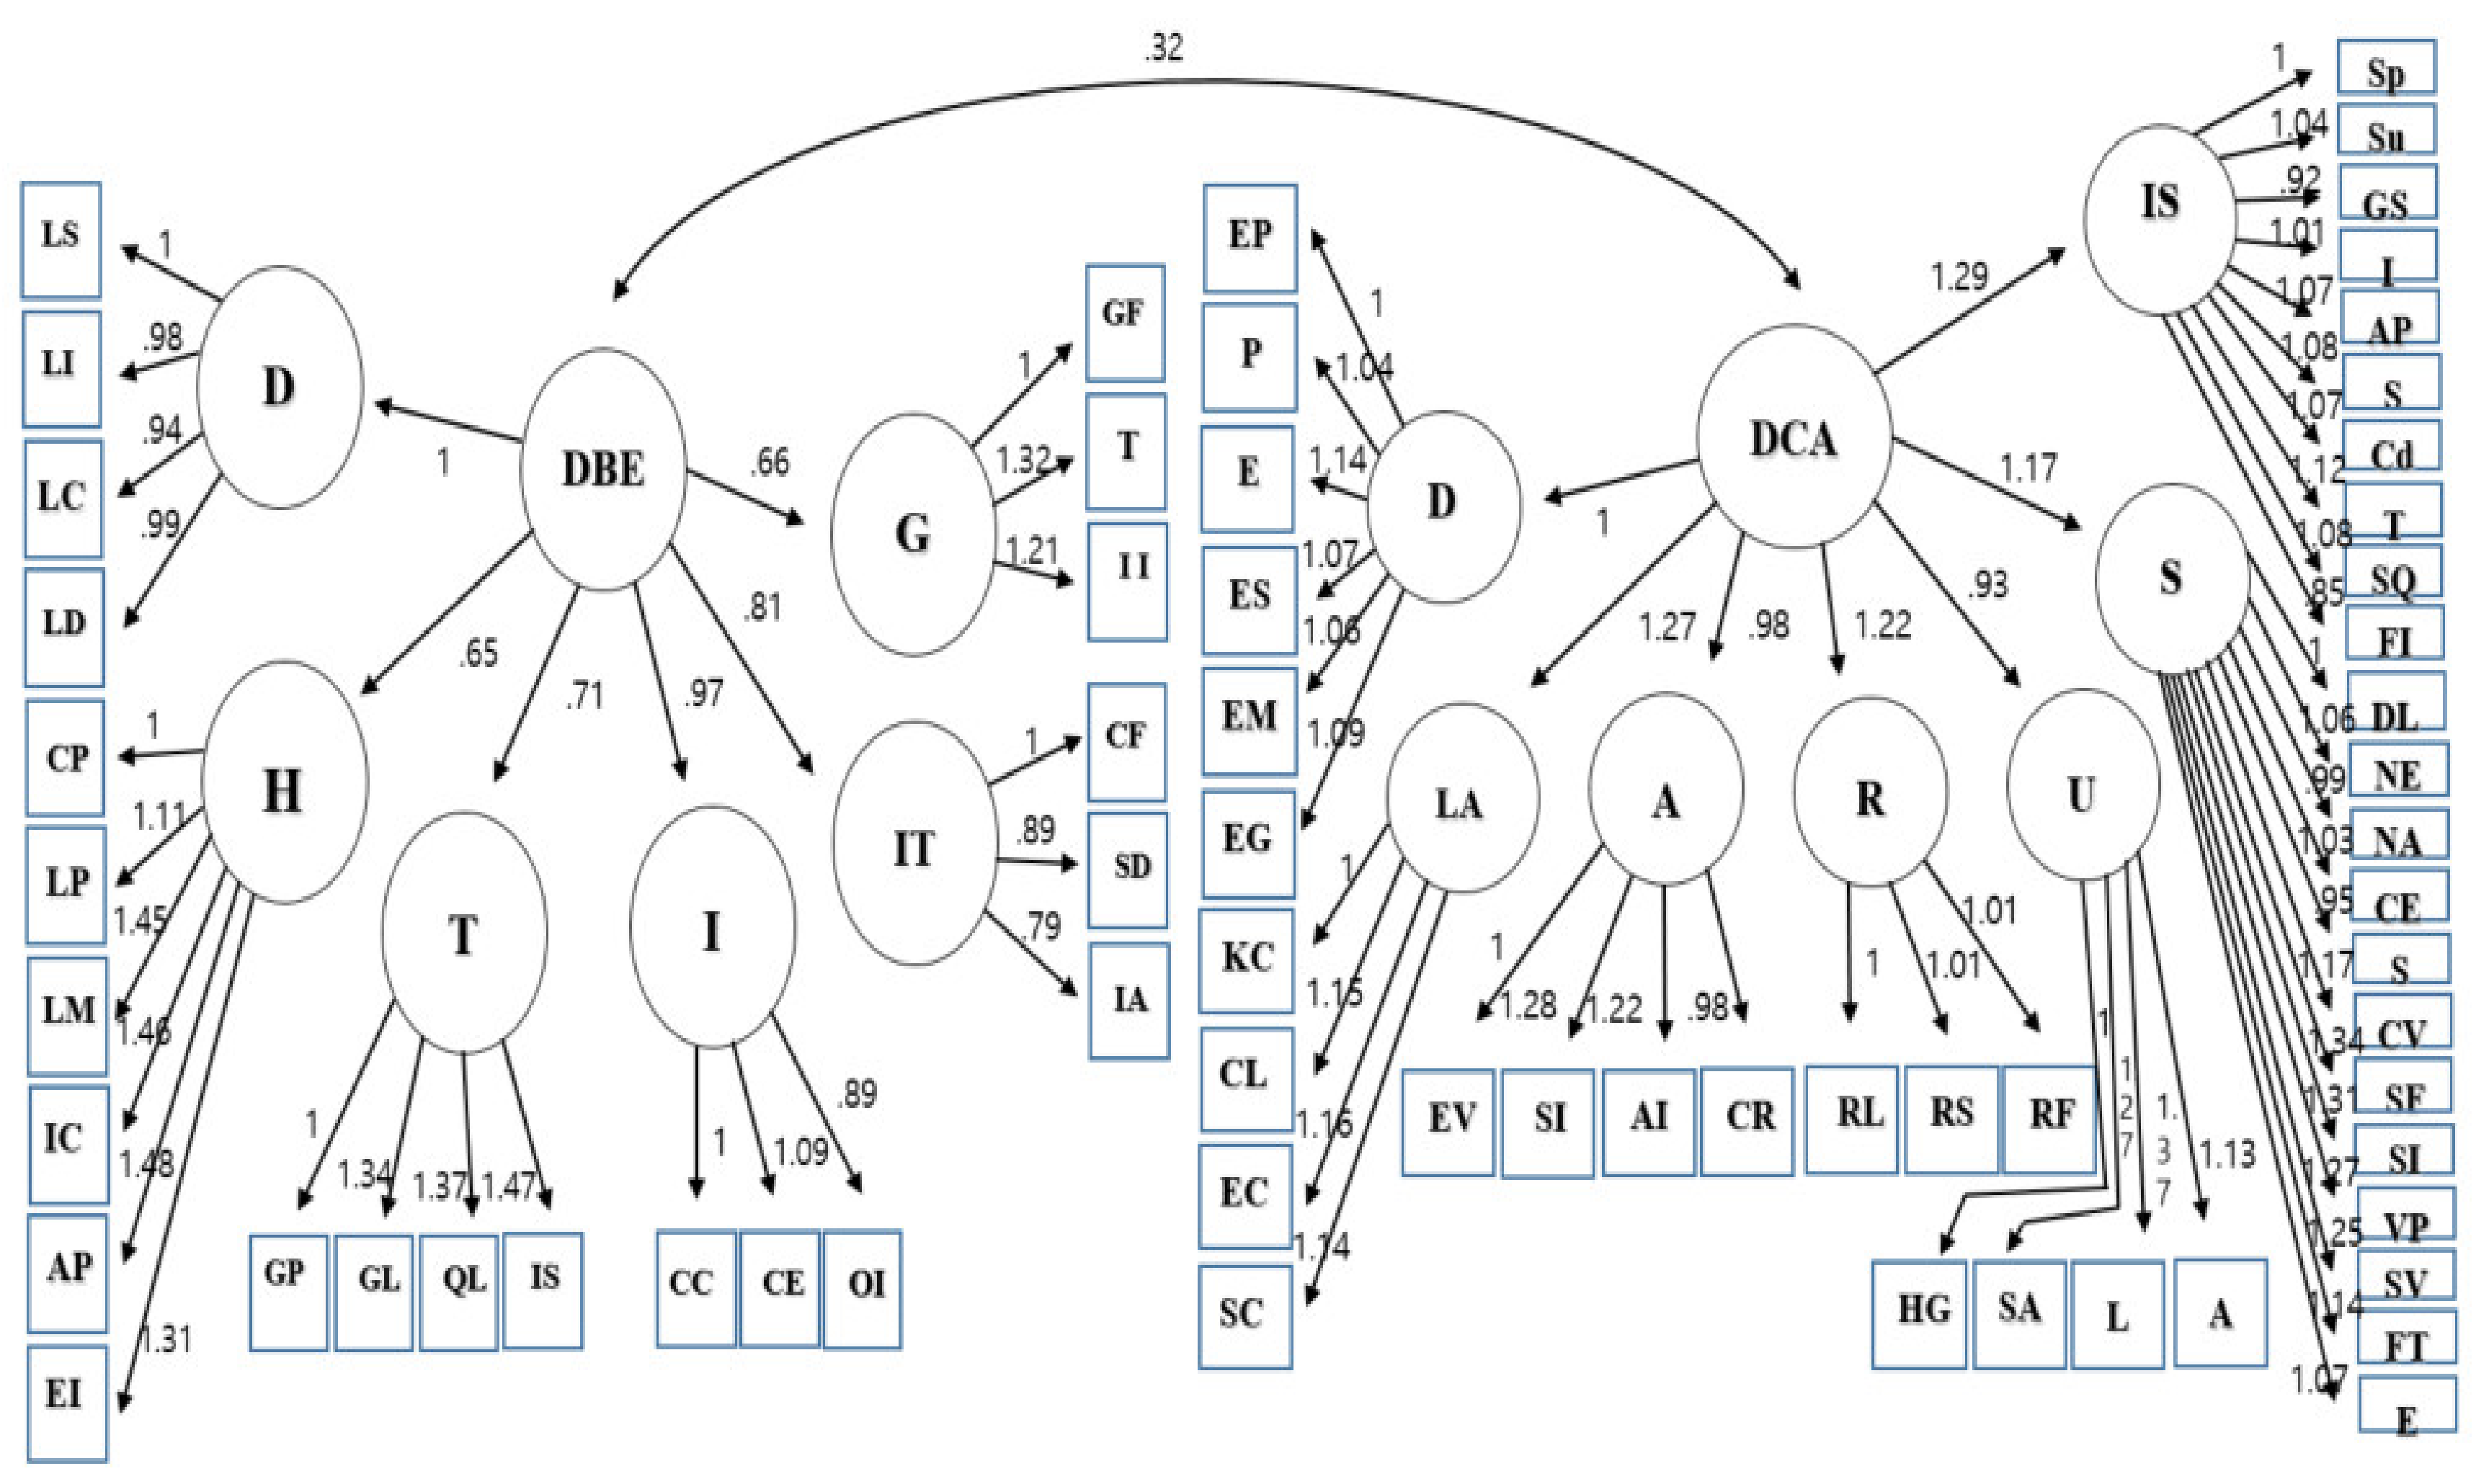
Table 7. Second-order CFA results for the DBE and DCA.
IndicatorsCompletely
Standardized Loadings
Error
Variance
t-Value (sig.)
Dynamism
Local company strategy1.00
Local institution0.9810.07712.715 (0.000)
Local competition0.9420.08411.161 (0.000)
Local market demand0.9940.08012.430 (0.000)
Hostility
Chinese market potential1.000
Local management potential1.1140.1686.639 (0.000)
Long-term market potential1.4490.1967.380 (0.000)
International corporation1.4620.1937.585 (0.000)
Asia Pacific market potential1.4790.1957.583 (0.000)
Educational institution1.3070.1867.040 (0.000)
Turbulence
Government policy1.000
Geographic location1.3440.1797.507 (0.000)
Quality lodging facility 1.3680.1887.275 (0.000)
Related industry support1.4740.1917.714 (0.000)
Investment
Sound corporate cooperation1.000
Corporate labor expenditure1.0990.09411.659 (0.000)
Other social infrastructure0.8920.08810.106 (0.000)
Information Technology
Communication facilities1.000
Shopping and retail district0.8900.1058.448 (0.000)
Information accessibility0.7930.1007.923 (0.000)
Governance
Government fairness1.000
Policy-making transparency1.3200.2285.785 (0.000)
Investment Incentives1.2060.2185.531 (0.000)
Destination Business Environment
Dynamism1.000
Hostility0.6450.1046.214 (0.000)
Turbulence0.7110.1116.395 (0.000)
Investment0.9700.1227.971 (0.000)
Information Technology0.8120.1166.973 (0.000)
Governance0.6580.1235.367 (0.000)
Defensiveness
Priority for environmental protection in attraction site1.000
Efforts for preservation in pristine attractions1.0360.1129.267 (0.000)
Prioritized involvement for environmental protection1.1410.11010.344 (0.000)
Efficiency for cost savings in attractions and tourist spot1.0620.10110.549 (0.000)
Efficient maintenance in attractions and tourist spot1.0580.10510.066 (0.000)
Efficiency management and cost control in tourist spot1.0900.1109.908 (0.000)
Local Acceptance
Local community kind to travelers1.000
Cooperation of locals1.1450.07914.447 (0.000)
Easy to communicate with travelers1.1590.08513.581 (0.000)
Smooth communication between locals and travelers1.1410.08613.205 (0.000)
Accessibility
Easy to get visa1.000
Speedy immigration procedure1.2820.11111.590 (0.000)
Good attitude of immigration and customs personnel1.2150.10311.814 (0.000)
Conveniently and comfortably accessible to road or bridge0.9840.0999.932 (0.000)
Reasonableness
Reasonable and convenient lodging1.000
Reasonable shopping 1.0050.08012.548 (0.000)
Reasonable food and beverages
Uniqueness
High price but good value for tourist facilities1.000
Visually strong appeal for attractions1.2760.1399.199 (0.000)
Well-known landmark1.3680.1439.587 (0.000)
Strongly appealing attractions1.1280.1278.905 (0.000)
Supportiveness
Delicious local food1.000
Good night entertainment and activity1.0630.10310.322 (0.000)
Night attractions sightseeing and entertaining0.9850.1009.802 (0.000)
Convenient communication establishment and service for travelers1.0250.09810.507 (0.000)
Nice security and safety for travelers0.9490.09310.161 (0.000)
Convenient shopping 1.1700.09712.011 (0.000)
Superior shopping facility 1.3370.10412.909 (0.000)
Superior quality of shopping items1.3140.10212.904 (0.000)
A variety of shopping products 1.2740.10212.527 (0.000)
Shopping value1.2510.10511.889 (0.000)
A variety of festivals tailored to a theme 1.1360.10311.047 (0.000)
A variety of events tailored to a theme1.0640.10110.485 (0.000)
Image Sustainability
Active and sustainable tourism development for a specific theme1.000
Active and sustainable event development for a specific theme1.0350.07813.242 (0.000)
Consistent and sustainable support from governmental institutions.9180.07511.192 (0.000)
Products with a specific image1.0070.07613.323 (0.000)
Active ads and promotion1.0680.08113.162 (0.000)
Systematic operation in tourist site1.0840.07614.191 (0.000)
Active product development coordination with other institutes1.0720.07913.537 (0.000)
Efforts for timely improvement of service quality with traveler’s information1.1210.08014.027 (0.000)
Good service quality1.0760.08412.876 (0.000)
Convenient to use financial institutions0.8450.07611.192 (0.000)
Destination Competitive Advantages
Defensiveness1.000
Local Acceptance1.2380.1577.908 (0.000)
Accessibility0.9550.1406.835 (0.000)
Reasonableness1.1860.1607.408 (0.000)
Uniqueness0.9040.1406.434 (0.000)
Supportiveness1.1340.1497.603 (0.000)
Image Sustainability1.2580.1518.359 (0.000)
DBE—DCA0.3190.0674.759 (0.000)
Fit Statistics:
Chi-square = 4104.744 (df = 2001, p = 0.000);
CFI = 0.795; TLI = 0.785; RMSEA = 0.074
Publisher’s Note: MDPI stays neutral with regard to jurisdictional claims in published maps and institutional affiliations.

