Abstract
The imbalance between resource availability and population increase requires transformative approaches to inform policy, decision-making and practice on coherent adaptation strategies for improved livelihoods and resilient communities. Nexus approaches are built on an understanding that natural processes do not operate in isolation within a system; hence, an emergent challenge in one unit obviously disturbs the whole system. This study applied an integrated water-energy-food (WEF) nexus analytical model to holistically assess resource availability, distribution, use and management at a local level in Sakhisizwe Local Municipality, South Africa. The aim was to inform strategies and guidelines on improving livelihoods of resource-poor rural communities. The calculated municipal composite index of 0.185, coupled with a deformed spider graph, represents a marginally sustainable resource management result. The analysis simplified the relationship between the intricately interlinked socio-ecological components and facilitated the identification of priority areas for intervention. The process provides pathways that steer resource use efficiencies and attainment of Sustainable Development Goals (SDGs). Unlike current linear approaches, integrated and transformative approaches like the WEF nexus provide a multidisciplinary platform for stakeholder engagement to sustainably enhance cross-sectoral coordination of resource management and harmonisation of policies and strategies. The WEF nexus approach is useful for informing decisions on improving livelihoods, enhancing resource securities, identifying priority areas for intervention and providing transformative pathways towards sustainable development.
1. Introduction
Water, energy and food are essential resources that sustain life and livelihoods [1]. The three resources are interlinked and interdependent in such a way that any disturbance on any one of the three will affect the other two [2,3]. For example, water and energy are important requirements in food production; energy is also important in water management (extraction, treatment and redistribution); and energy generation needs water [2]. This intricate relationship is known as the water-energy-food (WEF) nexus [3,4]. Nexus planning is based on a systems approach, for example, its use in understanding socio-ecological systems as primary point of reference in understanding sustainable livelihoods [2]. The WEF nexus is just one of the many nexuses that have been suggested in literature; the term “nexus” means seeing and analysing different, but interconnected, components together [5,6]. For example, one of the many nexuses is the atmospheric pollution-climate change-human health nexus, in which the linkages in the three sectors is evident through atmospheric pollution exacerbating climate change and causing respiratory related diseases. Thus, addressing climate change alone without attempting to reduce atmospheric pollution does not provide the required sustainable solutions [7,8]. As WEF sectors are interlinked, so are the challenges, so much that focusing on one sector can potentially aggravate and/or transfer stresses to other sectors [9]. This interconnectedness, and challenges that arise thereof, requires systemic and transformative approaches such as circular economy, scenario planning, sustainable food systems and nexus planning to manage trade-offs and synergies and achieve sustainability [10].
Early work related to the three-way mutual interlinkages among the WEF sectors emerged in 2008 [11]. The approach then grew in appeal after the World Economic Forum held in 2011, where it was given prominence by the Stockholm Environment Institute (SEI) [12]. Since then, the concept has evolved into an important and transformative approach in sustainability circles, and a search of the term on search engines today yields a vast publication profile. The WEF nexus is increasingly being recognised as a transformative approach that increases resources use efficiencies and informs coherent strategies for sustainable natural resources management [10,13]. When applied as a conceptual tool, the WEF nexus provides a framework for understanding the complex interrelations, synergies and trade-offs among water, energy and food [14]. The WEF nexus, when applied as an analytical tool, has evolved into a vital cog in assessing progress towards Sustainable Development Goals (SDGs), particularly Goals 2 (zero hunger), 3 (good health and wellbeing), 6 (clean water and sanitation), 7 (affordable and clean energy) and 13 (climate action) [10,15]. In the current study, we adopt the WEF nexus as an analytical tool for assessing progress towards achieving sustainable livelihoods at a local scale.
Current sector-based approaches to development and service delivery in South Africa has an influence at lower administrative scales, where each sector pursues its own strategies and policies [10]. Given this background, the management of the three sectors in Sakhisizwe Municipality, Eastern Cape Province, South Africa, also falls under sector specific institutions, with sector-driven mandates as is derived from the national government setting. Sectoral policies and institutions are formulated to function in silos, an arrangement that inadvertently creates imbalances and often leads to duplication of developmental activities, which often translates to failure due to resource use inefficiencies [3]. In the absence of integration, intentioned sector-based approaches may actually increase the vulnerability of communities and livelihoods due to continued resource degradation and depletion [16]. Similar to other growing communities, the challenge of resource insecurities in Sakhisizwe Municipality requires greater cross-sectoral coordination for sustainable service delivery and livelihoods [17]. In this regard, nexus planning can contribute towards informing strategies for sustainable and inclusive socio-economic development, ensuring resource securities and improving the livelihoods of vulnerable communities [1].
We therefore applied the WEF nexus integrated analytical model [10] to understand and quantify the interrelatedness among WEF sectors and develop adaptation strategies for sustainable livelihoods at local level in Sakhisizwe Local Municipality in the Eastern Cape Province, South Africa. Further to this, we also developed a contextualised municipal nexus framework to inform policy and decision-making at a local level. The application of the WEF nexus at a local scale provides another dimension to the applicability of the approach at various scales. Previous work has mostly focused on such at household [18], national [10], basin [19] and regional [1] scales. The application at local level is particularly essential as local government is at the front of service delivery of essential goods and services. Apart from the unique application scale, this study also provides and compares two integrated models for WEF nexus analysis. For South Africa, where service delivery is the mandate of local municipalities, a better understanding of nexus planning at a local scale has potential to unlock meaningful opportunities for achieving sustainable livelihoods, poverty alleviation and building resilient communities.
2. Methods
2.1. Methodological Framework
The rationale of the study is based on establishing quantitative relationships among the intricately connected, broad and multiple interactions within the water, energy and food resources at a local or community level. Besides simplifying the intricate interactions among these interlinked resources, the analysis provides useful insights for planning, risk identification and mitigation, and enhances resilience (Figure 1). The aim is to enhance resource availability and accessibility, improve on resource productivity at a local level and attain related SDGs, by understanding the socio-economic and environmental interactions. Nexus planning is the main approach used to understand these complex interactions and inform policy on priority interventions that enhance sustainable socio-ecological outcomes (Figure 1) [10,20]. Figure 1 presents the methodological framework used to achieve these aims, showing pathways towards water, energy and food security, resilience and adaptation, as well as improved livelihoods and nutrition [21].
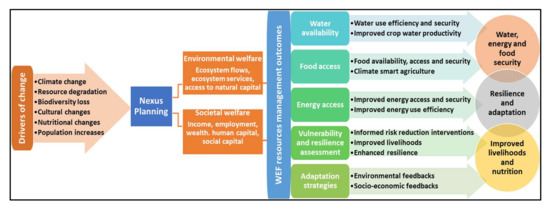
Figure 1.
A water-energy-food (WEF) nexus methodological framework illustrating the processes and interactions involved in achieving sustainability and resource security at local/community level.
Therefore, the focus is on (a) the drivers of change, (b) risk and exposure, (c) nexus planning, and (d) resource security. The drivers of change (both socio-economic and environmental) affect resource availability, accessibility and their productivity [22], and thus determine community vulnerability and resilience, or formulation of adaptation strategies. Knowledge of these interactions is critical for providing transformative pathways towards sustainable socio-economic development. The study is concerned with defining, measuring and modelling progress towards sustainable development, through a set of indicators formulated around resource utilisation, accessibility and availability [10]. The knowledge-based tools provided the WEF resources management outcomes.
2.2. Description of the Study Area
Sakhisizwe Municipality is an administrative area in the Eastern Cape Province, South Africa, located at 26°41′ S, 30°55′ E (Figure 2), with an area of 2556 km2. It is comprised of gently undulating “table land” forming the Drakensberg foothills, with elevation ranging between 750 m and 2600 m [23]. The rocky and undulating landscape makes it difficult for smallholder farmers to be productive and be food secure. The highly variable elevation shapes the soil types, where low areas are dominated by clay soils that are highly erodible, but the hills in the surrounding areas are made up of strong lithosols [23]. It receives an average annual rainfall of between 600 mm and 1000 mm.
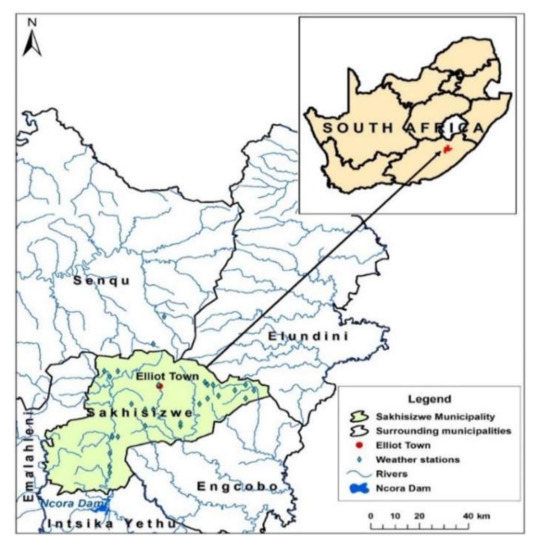
Figure 2.
Location of Sakhisizwe Municipality in South Africa and surrounding municipalities.
The municipality has a diverse and multi-racial population of about 66,097 people, of which 97.7% are black Africans, 1.1% whites, 0.8% coloureds and 0.2% Asians [23]. The population is largely rural, comprising of 61% rural population and 39% urban. Most of the rural communities are clustered in the former homeland of the former Transkei area. The land use is, therefore, shaped by historical setup with vast and fertile lands under commercial farming and the majority in unproductive lands of the former Transkei [24]. Most of the land in the former homeland is unproductive, and the smallholder farmers still use old farming practices that are environmentally unsustainable. As a result of these socioeconomic inequalities, communities residing in the former homelands are persistently vulnerable to climate change impacts. The vegetation is generally grassland, with scattered shrubs, which is typical of a savanna land and areas where the black majority settled.
2.3. WEF Resources Endowment in Sakhisizwe Municipality
The provision of water and sanitation in the municipality remains a major challenge as 39% of the population has no access to reliable and clean water, and 51% are without proper sanitation [23]. Although agriculture uses the bulk of the freshwater resources, crop production remains very low, often failing to meet the food requirements of a growing population [23]. Freshwater is not always guaranteed as most is allocated to commercial farms, and poor agricultural practices contribute to water pollution. Rainfall has been declining due to high climatic variability and change, exacerbating the challenge of water scarcity. Some water sources have gone dry due to drought, and groundwater use has increased as a result. Consequently, the municipality often undertakes strict water rationing measures, and poor communities often receive water supplies from mobile water tankers. Inequality also manifests itself in the water sector as commercial farmers have private dams and boreholes [23]. This has been the general trend over the past years and, as such, water supply has been diminishing.
Hydro-electricity is the major source of energy in the municipality, currently accounting for over 97% of energy supply, with 79% of households having access to electricity, and the remaining 21% relying on gas and biomass [23]. A power station at Ncora Dam provides the electricity used for irrigation, but the frequency of droughts has been threatening electricity supply in recent years. However, water transfers have been sustaining water supply and agriculture through inter-basin water transfers by diverting water from nearby river basins to supplement the water shortages [16]. The threat of drought and degrading water resources requires transitioning from hydro-power to other renewable energy sources like solar energy.
Agriculture potential is very high in Sakhisizwe Municipality as it is endowed with vast fertile soils but remains under-utilised [23]. Approximately 40% of the land in the municipality is arable. The combination of scattered vegetation and high rainfall makes the land susceptible to soil erosion. Rainfed agriculture is predominant among smallholder farmers and irrigated agriculture among commercial farmers. Due to the increasing uncertainty in resource availability, the viability and sustainability of rainfed cropping systems is gradually declining. Population growth raises the demand for more space to settle and demand for food, at the same time reducing the arable land. As the population increases, more land is cleared for new settlements and other economic activities. This is of major concern in a municipality where farming is the major economic activity, providing employment opportunities and a food security anchor.
Sixty-one percent of the population living in rural areas relies on natural systems for their livelihoods, exposing them to climate change risks. Resource distribution and access is shaped by historical imbalances. This highlights why most of the people in the municipality depend on social grants from the government [25]. The need to reduce vulnerability from climate risks and provide adaptation strategies to build resiliency and achieve sustainable livelihoods is high in a municipality beset with multiple historical inequalities [17].
2.4. The WEF Nexus-Livelihoods Conceptual Framework
Livelihoods security, the basis for sustainable development, is determined by socio-ecological interactions, which themselves are driven by population growth, urbanisation, climate change and natural hazards [26,27]. Some of the evidence of socio-ecological changes are manifesting through the increased frequency and intensity of extreme weather events and emergence of novel infectious diseases with origins from wildlife [28]. These novel socio-ecological interactions are a risk to human health and are increasing the vulnerability of communities to the vagaries of climate change [29]. Thus, livelihoods and the environment are intricately interlinked in such a way that any disturbance on the environment has direct impact on livelihoods (Figure 3). Addressing socio-ecological challenges, therefore, should consider maintaining food security and universal access to freshwater, as well as access to clean and affordable energy, and promote inclusive economic growth, whilst sustaining key environmental systems functionality, particularly in the advent of climatic and environmental changes [30]. The close socio-ecological interactions and the intricate interlinkages between livelihoods and the environment suits well with nexus planning, which integrates distinct components together by establishing numerical relationships among those components [10]. Nexus planning is essential for livelihoods analysis as it facilitates sustainable livelihoods development.
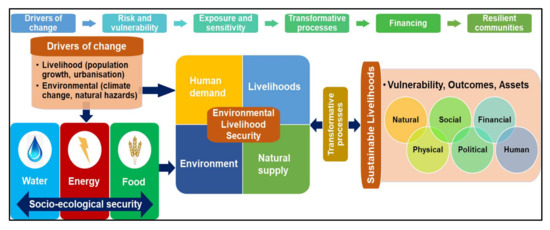
Figure 3.
The WEF nexus framework for building resilient communities at local level, integrating the drivers of change with the elements of sustainable livelihoods to attain a sustainable balance between natural supply and human and environmental demands.
To comprehend socio-ecological interactions in the context of sustainable livelihoods and nexus planning, we identified six thematic areas based on literature search, which include (a) drivers of change, (b) risk and vulnerability, (c) exposure and sensitivity, (d) transformative processes, (e) financing, and (f) resilient communities [30,31]. The thematic areas are identified as the main drivers towards sustainable livelihoods and are the basis for the development of the WEF nexus-livelihoods conceptual framework (Figure 3). The WEF nexus-livelihoods conceptual framework illustrates the pathways towards sustainable livelihoods and healthy environments capable of supplying humans needs at all times [1]. Sustainable livelihood is achieved when a balance between human demands and natural supply from the environment is attained, without compromising the health of the environment [2]. The delicate and intricate socio-ecological relationship is reinforced by the concepts of environmental security and livelihood security [32]. Thus, sustainable development and livelihoods are at the centre of the socio-ecological interactions, and was the basis for the formulation of SDGs [9].
Socio-ecological systems are, therefore, well linked not only to the WEF nexus, but also to other transformative approaches such as circular economy and sustainable food systems, which both form an integral part of sustainable environment and are designed to ensure the most efficient use and management of resources [33]. Efficient use and management of resources through informed strategies from transformative processes leads to sustainable livelihoods, which determine the vulnerability, outcomes and assets of a community, which in turn are determined by the natural, physical, social, political, human and financial aspects of society [31].
Thus, sustainable livelihoods are based on comprehending available options to access assets that typically include natural, human, social, physical and financial capital (Figure 3). In the context of livelihoods, and particularly at local level, access to assets is analysed through (a) climate change, population dynamics, history and macro-economic conditions, (b) institutional and social processes that include institutions and land tenure, and (c) the livelihood strategies that are used, which include combinations of activities people practice to achieve their livelihood goals [34,35]. This knowledge facilitates informed interventions to improve livelihoods based on the understanding of existing coping strategies that are designed to protect and enhance resilience and the factors that influence them [35]. The approach is suitable for Sakhisizwe Municipality, which is administratively a local area, is based on the WEF nexus-livelihoods framework (Figure 2), and aims to provide sustainable pathways towards sustainable human-environment interactions in the municipality and build resilient communities and achieve related SDGs.
2.5. Mathematical Representation of Distinct Components of a System
There are two main methods to establish quantitative relationships among different but interlinked components of a system through nexus modelling that are suggested in the literature: (a) differential equations and (b) multi-criteria decision method (MCDM). Both methods were experimented in the context of the WEF nexus to integrate sustainability indicators representing the securities of water, energy and food, which represent the WEF nexus [10]. WEF nexus analytical modelling unpacks the complex interlinkages and dynamics among sectors and mathematically represents those dynamics between the inputs and outputs taking place within a livelihoods-environment system. The main outcomes of a socio-ecological system include sustainable livelihoods and healthy ecosystems [36]. The numerical representation facilitates classifying a system into either sustainable or unsustainable level [10]. The outcomes are dependent on the balance between human demands and natural supply. WEF nexus sustainability indicators (Table 1) are the basis on which to establish the numerical relationships among the interlinked WEF sectors as related to the livelihoods-environment system [10].

Table 1.
Sustainability indicators and to quantify WEF nexus interactions.
Of the two methods, MCDM and differential equations, the MCDM was preferred as it provides indices for each indicator, which can be shown on a spider graph to give an overview of resource management, yet the differential equation produces a single composite index that may not indicate priority areas for intervention [10]. However, the choice of the method depends on the objective of the work being done. In this study, we aim to provide an integrated relationship between different components of the same system.
2.5.1. Integration through Differential Equations
The state of variables (x) of a system provides the least information necessary to define the state of a system at a given time. A quantitative relationship of variables (x), together with the information on the same variables at an original time (t0) and the inputs of the system for time (t), indicates data to estimate future system changes and outputs for all time (t) [37]. Outcomes (y) are functions for characterising the input–output relationships. Thus, one way to represent the processes taking place in a system is through differential equations (with time being the independent variable). These transitional equations are formulated in state-space form that has a certain matrix structure and is commonly expressed as [38,39]:
where y are outcomes, h is a vector function with n components for the n outputs y of interest. The variables are dependent on time t. The equation is a transitional function as it models the current state of a system into its future state [38]. In vector representation, the differential equation is expressed as:
where (f) is a vector function. The status of a system at any given (t) represents a point in an m-dimensional state-space, and the dynamic state response xt is a trajectory traced out in state-space [38].
In addition to the differential Equations (1) and (2), other Equations (3) and (4) are essential for accounting for feedbacks to the inputs [37]. The main challenge of parameter estimation is data availability at a given spatial scale. However, some of the data can be modelled from remote sensing or obtained from open data sources like the World Bank Indicators and AQUASTAT.
2.5.2. The Multi-Criteria Decision Method to Integrate WEF Nexus Sectors
An alternative method is the Analytic Hierarchy Process (AHP), a MCDM tool for structuring and solving complex decisions and planning problems that involve multiple criteria [40]. The MCDM facilitates the calculation of integrated composite indices between distinct but interrelated components, using a pairwise comparison matrix (PCM). The MCDM is a cross-sectoral planning tool to overcome the increasing demand for essential resources with a vision of sustainable development [41]. The sustainability indicators (Table 1) are useful for conveying information on the state of a system through composite indices, represented through a spider graph, and indicate areas of priority intervention to reduce risk and vulnerability.
The AHP was critical for integrating WEF nexus sectors as it was used to derive ratio scales from both discrete and continuous paired comparisons to help decision-makers to set priorities and make the best decisions [42,43,44]. As already alluded to, the AHP provides comparison matrix that allows comparing two indicators at a time using Saaty’s scale, which ranges between 1/9 and 9 [44]. The process calculates the indices for the indicators, through matrix A for the priority ranking. The priority ranking is set to the right of the PCM vector w of the comparison matrix A. Therefore, the method is to calculate the maximum value λ and its corresponding vector w such that [45,46]:
The matrix, A, of n criteria, is determined using Saaty’s scaling ratios, in the order (n × n) [47]. A is a matrix with elements aij. The matrix reciprocal and is expressed as:
Once the matrix is generated, it is normalised as a matrix B with elements bij and expressed as:
Each weight value wi is computed as:
The integrated composite index is then expressed as the weighted average of the indices and is an indicator of the general performance of resource management within a system.
Consistency is an important component of a PCM and an acceptable consistency ratio (CR) of less than 0.1 or 10% is always recommended [48]. The CR is expressed as [49]:
where: CI refers to the consistency index, RI is the random index [44]. CI is calculated as:
where: represents the main eigenvalue, and n refers to the number of criteria or sub-criteria in each PCM.
2.6. Modelling Vulnerability and Resilience
Vulnerability can be assessed through large-scale computer simulations at local scale [50]. Such an assessment is essential to better understand resilience from past knowledge on exposure and responses to shocks and stressors so as to identify areas for current and future policy support [51]. Trajectory analyses are essential for formulating policies that enhance resilience as they offer insights into temporal livelihoods-environment interactions that consider both past and future conditions, as the present state is defined by the legacy of the past [52]. Resilience is needed where there is vulnerability, for where there is need of resilience, there is some degree of vulnerability [53]. Human vulnerability and resilience to socio-ecological changes are adversely influenced and affected by changes in the physical, natural, social, political, human and financial set-up (Figure 1).
Vulnerability and resilience are composed of three components: exposure, sensitivity and resilience [53]. Thus, vulnerability (V) is a function of the components’ recovery potential (RP) and potential impacts (PI), which are expressed through exposure (E) and sensitivity (S) as [39]:
Outlining vulnerability and resilience is important to illustrate different elements of a system, including establishing numerical relationships and calculating composite indices. The method is an alternative approach in assessing risk and exposure and for formulating strategies to build resilience and achieve sustainable livelihoods.
3. Results and Discussion
3.1. Integrating WEF Nexus Sectors
The WEF nexus-based PCM for Sakhisizwe Municipality is presented in Table 2. The diagonal numbers are values of unity (i.e., when an indicator is compared with itself the relationship is always 1). Because the PCM is symmetrical, only the upper triangle (yellow shaded) is determined and the lower triangle represents the reciprocals. As already alluded to, the matrices are established by using a scale between 1/9 to 9 (1/9 is the lowest and most insignificant relationship and 9 is the highest and most important relationship). Due to lack of data at a local level, the PCM was developed based on expert advice and general knowledge of the municipality [44].
Table 2.
Pairwise comparison matrix for WEF nexus indicators in Sakhisizwe Municipality.
3.1.1. Normalised Pairwise Comparison Matrix for WEF Nexus Indicators
The normalised matrix (resulting using Equations (7) and (8)) is given in Table 3. A CR of 0.09 is acceptable, and the weighted average, which is the integrated index, is classified according to the categories given in Table 4.
Table 3.
Normalised pairwise comparison matrix and composite indices.
Table 4.
WEF nexus indicators performance classification categories.
The indices are ranked according to their weight, the highest being ranked 6 and the lowest ranked 1 in order to calculate the weighted average. The composite index for Sakhisizwe Municipality is 0.185, which classifies the municipality as marginally sustainable. The indices vary between 0 and 1, where 0 represents unsustainable resource management and 1 represents highly sustainable resource management (Table 4).
3.1.2. Classification Categories for Indicators and the WEF Nexus Integrated Index
The classification categories (Table 4) represent resource management levels, which are essential for determining the intensity on the importance of an indicator [10].
3.2. Interpretation of the Indices
The calculated WEF nexus indices are presented as a spider graph (Figure 4) to give a general overview of the numerical relationship of the indicators in a simplified manner. The graph provides the interactions and interdependences of the WEF sectors as seen together, giving an integrated synopsis on the status of resources in the context of use and management. The deformed shape of the centrepiece (Figure 4) is an indication of an imbalanced resource management. The further an index is from the centre of the axis of the spider graph, the better the level of sustainable development, and the closest to the axis signifies unsustainable development. The representation of the indices numerically unbundles the complex interlinkages between WEF sectors.
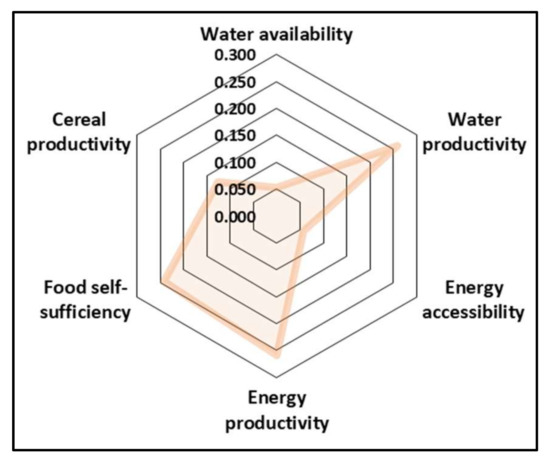
Figure 4.
Resource performance in Sakhisizwe Municipality in 2018.
There is an evidently better water productivity and energy productivity (both at 0.259) in Sakhisizwe Municipality, followed by food self-sufficiency (0.243). The better water productivity in the municipality could be motivated by limited water resources or low water availability (0.053), which often results in water being used sparingly and efficiently. This is a general trend in the whole of South Africa as the country is water-scarce [10]. Although energy production is high, accessibility is still very low at 0.058, as 21% of the population has no access to electricity. The situation is worsened by depleting water resources due to drought and compromises hydro-electricity generation, which is the main source of energy [23]. The effects of drought also highlight low water availability in the municipality, which affects energy accessibility and cereal productivity. Water management is an area that still needs to be improved in the municipality to ensure water, energy and food security, as 61% of the population live in the rural areas and are highly vulnerable to climate change impacts [23]. Overall, an integrated composite index of 0.185 classifies the municipality into a marginally sustainable category.
4. Way Forward
The challenges currently facing humankind are systemic, complex and interlinked, whereby an emerging stress in one sector only exacerbates the stresses in other related sectors [54]. This interconnectedness and the need to achieve sustainability have reignited the importance and use for integrated and systemic approaches in achieving national and global goals that are anchored on sustainable development [55]. The importance of transformative and integrated approaches has increased the prominence of the WEF nexus in recent years to address existing complex problems [13]. For example, the COVID-19 pandemic started as a health challenge; however, the subsequent lockdowns triggered a chain of other challenges such as company closures, unemployment and disruptions in the global demand and supply chain, among other challenges [56]. Thus, sector-based or system-specific resilience initiatives such as health systems are usually accompanied with systemic risks, which originate from strategies that lead to suboptimal efficiencies in that targeted sector at the expense of other sectors [3,56,57]. As a result of the risks associated with sector-based approaches, there has been an emergence of other nexuses, apart from the WEF nexus, such as the water-energy-food-environment (WEFE) nexus, water-unemployment-migration (WEM) nexus, water-health-environment-nutrition (WHEN) nexus and the rural-urban nexus, among others [6,58]. This underlines the urgency to address intricate trade-offs between interlinked sectors in an integrated manner, and highlights the importance of transformative approaches in addressing the systemic and interlinked shocks and in informing policy on formulating coherent policies and strategies [59].
While nexus planning was initially meant to address global challenges and achieve sustainability at a global level, it is at a local scale (household and community) and natural scale (catchment) where nexus issues are mostly evident and where adaptation and resilience-building processes should take place [60,61] but cascade from these local scales to natural spatial scales (catchments) and jurisdictional scales (political units such as cities, municipalities or provinces). It is at a jurisdictional scale where policies and governance structures that affect households and communities are formulated and implemented [62,63]. The temporal scale is equally critical in nexus planning as it is essential in scenario planning (an important component of nexus planning) and for interpreting future climatic and environmental changes, resource availability or population projections at different time intervals [64]. Each spatial scale has its own dynamics, particularly when it comes to data availability [65].
Besides the envisaged importance of nexus planning, the approach has had its own share of criticisms, particularly for lack of procedures to turn the approach into an operational framework [4]. Others have even branded it as a repackaging of the Integrated Water Resources Management (IWRM) [66,67]. It is only recently when analytical models have been developed to provide practical applicability in a real-life situation and guide policy and decision-making in formulating informed strategies that lead to sustainable development [10]. The WEF nexus analytical model has been successfully applied in Southern Africa to transform rural livelihoods, and in South Africa for assessing resource use and management to inform policy on priority areas for intervention and study applies the approach at local/community level [1,10]. The model is in its early stage of application and there is still room for improvement.
One critical limitation of the model is the complication in achieving consistency with more than nine indicators. Future research is needed to develop scenarios that inform policy and decision-making on achieving a circular shape of the spider graph and attain sustainable development.
Adaptation Strategies to Ensure Sustainable Livelihood-Environmental Security
Comprehending socio-ecological complexities is essential for formulating informed adaptive responses that ensure sustainable livelihoods and healthy environments. Nexus planning is best suited for assessing polycentric and complex systems like socio-ecological interactions as it simplifies the interlinkages by providing numerical relationships among the diverse but connected components. As already alluded to, the deformed shape of the centrepiece of the spider graph (Figure 4) indicates an imbalance in resource management. A balanced and sustainable resource management is attained when the centrepiece of the spider graph achieves a circular shape. The circular shape is best when all the indicators reach the highest possible index. In the case of Sakhisizwe Municipality, this is achieved when the other indicators attain the value of the best managed indicators, water productivity and energy productivity (0.259). Thus, nexus planning informs policy and decision-making on interventional strategies to priorities developmental initiatives. The approach is also a platform for stakeholder engagement to harmonise strategies and policies, besides being an analytical, conceptual and discourse framework [10]. Current sectoral approaches only exacerbate current challenges associated with climate change and increase the vulnerability of communities.
Achieving a circular shape at 0.259 for all the indicators would not only achieve a balanced resource management but would also assist the municipality to achieve a moderately sustainable category (Table 4). A circular shape is, therefore, an indicator of a well-managed resource base. The WEF nexus analytical model is a lens for decision-makers to integrate strategies and polices that increase resource use efficiency. The WEF nexus analytical model is, thus, a decision support tool for monitoring resource utilisation, management and performance, as it captures the interactions among the sectors. It is essential for setting developmental targets and achieve the goals stipulated in the Integrated Development Plan (IDP), National Development Plan (NDP) and relevant SDGs. For policy and decision-makers, the model provides tools to:
- establish quantitative relationships and simplify the intricate interlinkages between water, energy and food resources with livelihoods security;
- identify trade-offs and synergies within a socio-ecological system and formulate informed strategies to achieve sustainable livelihoods and build resilience;
- guarantee the required balance between human demands and the supply of natural resource to achieve livelihoods sustainability;
- plan timely interventions on priority areas and reduce pressures and stresses on a system
- monitor progress towards a sustainable socio-ecological system; and
- inform transformative solutions to complex socio-ecological systems from a nexus planning perspective.
5. Conclusions
We developed a conceptual framework to illustrate the interlinked socio-ecological components and establish the quantitative relationships of those components. This facilitated an understanding of socio-ecological connections and sustainable livelihoods-environment co-benefits at a local scale. This was essential to developing coherent adaptive strategies to alleviate poverty, which is a central goal of sustainable livelihoods. Assessing the relationship between sustainable livelihoods and environmental outcomes through nexus planning is useful to developing context-specific transformative pathways at a local level. WEF resource securities are key to reducing poverty as they ensure sustainable and equitable resource availability and access. Concurrently, preserving ecosystems is vital for sustaining healthy natural environments and maintaining the ecosystems services they provide, which directly or indirectly provide foundations for livelihoods in rural resource-poor communities. The applicability of the WEF nexus integrative analytical model at a local level highlights the applicability of the WEF nexus approach at various scales, especially localised scales that are important for informing human outcomes.
Author Contributions
Conceptualization, B.N. and L.N.; methodology, B.N.; validation, S.M., T.M. and L.N.; formal analysis, B.N.; investigation, B.N. and L.N.; resources, B.N.; data curation, S.M. and S.M.; writing—original draft preparation, B.N.; writing—review and editing, L.N., S.M. and T.M.; supervision, L.N.; project administration, L.N.; funding acquisition, L.N. and S.M. All authors have read and agreed to the published version of the manuscript.
Funding
This research was funded by the Water Research Commission of South Africa (WRC) and the APC was funded through the Research and Development Branch of the Water Research Commission.
Acknowledgments
The authors are grateful to the Water Research Commission of South Africa (WRC), and the College of Agricultural and Environmental Sciences (CAES) of UNISA for student support from where this paper emanates.
Conflicts of Interest
The authors declare no conflict of interest.
References
- Mabhaudhi, T.; Nhamo, L.; Mpandeli, S.; Nhemachena, C.; Senzanje, A.; Sobratee, N.; Chivenge, P.P.; Slotow, R.; Naidoo, D.; Liphadzi, S. The Water–Energy–Food Nexus as a Tool to Transform Rural Livelihoods and Well-Being in Southern Africa. Int. J. Environ. Res. Public Health 2019, 16, 2970. [Google Scholar] [CrossRef]
- Rasul, G.; Sharma, B. The nexus approach to water–energy–food security: An option for adaptation to climate change. Clim. Policy 2016, 16, 682–702. [Google Scholar] [CrossRef]
- Nhamo, L.; Ndlela, B.; Nhemachena, C.; Mabhaudhi, T.; Mpandeli, S.; Matchaya, G. The water-energy-food nexus: Climate risks and opportunities in southern Africa. Water 2018, 10, 567. [Google Scholar] [CrossRef]
- Albrecht, T.R.; Crootof, A.; Scott, C.A. The Water-Energy-Food Nexus: A systematic review of methods for nexus assessment. Environ. Res. Lett. 2018, 13, 43002. [Google Scholar] [CrossRef]
- Boas, I.; Biermann, F.; Kanie, N. Cross-sectoral strategies in global sustainability governance: Towards a nexus approach. Int. Environ. Agreem. Polit. Law Econ. 2016, 16, 449–464. [Google Scholar] [CrossRef]
- Liu, J.; Hull, V.; Godfray, H.C.J.; Tilman, D.; Gleick, P.; Hoff, H.; Pahl-Wostl, C.; Xu, Z.; Chung, M.G.; Sun, J. Nexus approaches to global sustainable development. Nat. Sustain. 2018, 1, 466–476. [Google Scholar] [CrossRef]
- D’amato, G.; Pawankar, R.; Vitale, C.; Lanza, M.; Molino, A.; Stanziola, A.; Sanduzzi, A.; Vatrella, A.; D’amato, M. Climate change and air pollution: Effects on respiratory allergy. Allergy Asthma Immunol. Res. 2016, 8, 391–395. [Google Scholar] [CrossRef]
- Manisalidis, I.; Stavropoulou, E.; Stavropoulos, A.; Bezirtzoglou, E. Environmental and health impacts of air pollution: A review. Front. Public Health 2020, 8. [Google Scholar] [CrossRef]
- UNGA. Transforming Our World: The 2030 Agenda for Sustainable Development; United Nations General Assembly: New York, NY, USA, 2015; p. 35. [Google Scholar]
- Nhamo, L.; Mabhaudhi, T.; Mpandeli, S.; Dickens, C.; Nhemachena, C.; Senzanje, A.; Naidoo, D.; Liphadzi, S.; Modi, A.T. An integrative analytical model for the water-energy-food nexus: South Africa case study. Environ. Sci. Policy 2020, 109, 15–24. [Google Scholar] [CrossRef]
- Hellegers, P.; Zilberman, D.; Steduto, P.; McCornick, P. Interactions between water, energy, food and environment: Evolving perspectives and policy issues. Water Policy 2008, 10, 1–10. [Google Scholar] [CrossRef]
- Hoff, H. Understanding the Nexus: Background Paper for the Bonn2011 Conference: The Water, Energy and Food Security Nexu; Stockholm Environment Institute (SEI): Stockholm, Sweden, 2011; p. 52. [Google Scholar]
- Mabhaudhi, T.; Mpandeli, S.; Luxon Nhamo, V.G.; Chimonyo, A.S.; Naidoo, D.; Liphadzi, S.; Modi, A.T. Emerging Water-Energy-Food Nexus Lessons, Experiences, and Opportunities in Southern Africa. In Environmental Management of Air, Water, Agriculture, and Energy; Ahmad, V.-B.-H., David, S.T., Eds.; CRC Press: Boca Raton, FL, USA, 2020; p. 141. [Google Scholar]
- Terrapon-Pfaff, J.; Ortiz, W.; Dienst, C.; Gröne, M.-C. Energising the WEF nexus to enhance sustainable development at local level. J. Environ. Manag. 2018, 223, 409–416. [Google Scholar] [CrossRef] [PubMed]
- Stephan, R.M.; Mohtar, R.H.; Daher, B.; Embid Irujo, A.; Hillers, A.; Ganter, J.C.; Karlberg, L.; Martin, L.; Nairizi, S.; Rodriguez, D.J. Water–energy–food nexus: A platform for implementing the Sustainable Development Goals. Water Int. 2018, 43, 472–479. [Google Scholar] [CrossRef]
- Matchaya, G.; Nhamo, L.; Nhlengethwa, S.; Nhemachena, C. An Overview of Water Markets in Southern Africa: An Option for Water Management in Times of Scarcity. Water 2019, 11, 1006. [Google Scholar] [CrossRef]
- Tapela, B.N. Social Water Scarcity and Water Use; Water Research Commission (WRC): Pretoria, South Africa, 2012; p. 175. [Google Scholar]
- Wa’el, A.H.; Memon, F.A.; Savic, D.A. An integrated model to evaluate water-energy-food nexus at a household scale. Environ. Model. Softw. 2017, 93, 366–380. [Google Scholar]
- Geressu, R.; Siderius, C.; Harou, J.J.; Kashaigili, J.; Pettinotti, L.; Conway, D. Assessing river basin development given water-energy-food-environment interdependencies. Earth’s Future 2020, 8, e2019EF001464. [Google Scholar]
- Ericksen, P.J. Conceptualizing food systems for global environmental change research. Glob. Environ. Change 2008, 18, 234–245. [Google Scholar] [CrossRef]
- Namany, S.; Al-Ansari, T.; Govindan, R. Sustainable energy, water and food nexus systems: A focused review of decision-making tools for efficient resource management and governance. J. Clean. Prod. 2019, 225, 610–626. [Google Scholar] [CrossRef]
- Misra, A.K. Climate change and challenges of water and food security. Int. J. Sustain. Built Environ. 2014, 3, 153–165. [Google Scholar] [CrossRef]
- IDP. Sakhisizwe Muncipality: Integrated Development Plan—Review 2015–2016; Sakhisizwe Muncipality: Elliot, South Africa, 2015; p. 234. [Google Scholar]
- Van Koppen, B.; Nhamo, L.; Cai, X.; Gabriel, M.J.; Sekgala, M.; Shikwambana, S.; Tshikolomo, K.; Nevhutanda, S.; Matlala, B.; Manyama, D. Smallholder Irrigation Schemes in the Limpopo Province, South Africa; International Water Management Institute (IWMI): Colombo, Sri Lanka, 2017; Volume IWMI, p. 36, Working Paper 174. [Google Scholar]
- StatsSA. Mid-Year Population Estimates 2018; Statistics South Africa (StatsSA): Pretoria, South Africa, 2018; p. 26. [Google Scholar]
- Newman, R.J.S.; Capitani, C.; Courtney-Mustaphi, C.; Thorn, J.P.R.; Kariuki, R.; Enns, C.; Marchant, R. Integrating insights from social-ecological interactions into sustainable land use change scenarios for small Islands in the western Indian ocean. Sustainability 2020, 12, 1340. [Google Scholar] [CrossRef]
- Kok, M.; Lüdeke, M.; Lucas, P.; Sterzel, T.; Walther, C.; Janssen, P.; Sietz, D.; de Soysa, I. A new method for analysing socio-ecological patterns of vulnerability. Reg. Environ. Change 2016, 16, 229–243. [Google Scholar] [CrossRef]
- Jones, K.E.; Patel, N.G.; Levy, M.A.; Storeygard, A.; Balk, D.; Gittleman, J.L.; Daszak, P. Global trends in emerging infectious diseases. Nature 2008, 451, 990–993. [Google Scholar] [CrossRef] [PubMed]
- Bennett, N.J.; Blythe, J.; Tyler, S.; Ban, N.C. Communities and change in the anthropocene: Understanding social-ecological vulnerability and planning adaptations to multiple interacting exposures. Reg. Environ. Change 2016, 16, 907–926. [Google Scholar] [CrossRef]
- Biggs, E.M.; Bruce, E.; Boruff, B.; Duncan, J.M.; Horsley, J.; Pauli, N.; McNeill, K.; Neef, A.; Van Ogtrop, F.; Curnow, J. Sustainable development and the water–energy–food nexus: A perspective on livelihoods. Environ. Sci. Policy 2015, 54, 389–397. [Google Scholar] [CrossRef]
- Reed, M.; Podesta, G.; Fazey, I.; Geeson, N.; Hessel, R.; Hubacek, K.; Letson, D.; Nainggolan, D.; Prell, C.; Rickenbach, M. Combining analytical frameworks to assess livelihood vulnerability to climate change and analyse adaptation options. Ecol. Econ. 2013, 94, 66–77. [Google Scholar] [CrossRef]
- Mensah, J.; Ricart Casadevall, S. Sustainable development: Meaning, history, principles, pillars, and implications for human action: Literature review. Cogent Soc. Sci. 2019, 5, 1653531. [Google Scholar] [CrossRef]
- Jurgilevich, A.; Birge, T.; Kentala-Lehtonen, J.; Korhonen-Kurki, K.; Pietikäinen, J.; Saikku, L.; Schösler, H. Transition towards circular economy in the food system. Sustainability 2016, 8, 69. [Google Scholar] [CrossRef]
- Krantz, L. The Sustainable Livelihood Approach to Poverty Reduction: An Introduction; Swedish International Development Cooperation Agency (SIDA): Stockholm, Sweden, 2001; p. 44. [Google Scholar]
- Nhamo, L.; Chilonda, P. Climate change risk and vulnerability mapping and profiling at local level using the Household Economy Approach (HEA). J. Earth Sci. Clim. Chang. 2012, 3, 2. [Google Scholar]
- Connell, D.J. Sustainable livelihoods and ecosystem health: Exploring methodological relations as a source of synergy. EcoHealth 2010, 7, 351–360. [Google Scholar] [CrossRef]
- Åström, K.J.; Murray, R.M. Feedback Systems: An Introduction for Scientists and Engineers; Princeton University Press: Princeton, NJ, USA, 2010; p. 404. [Google Scholar]
- Rowell, D. State-space representation of LTI systems. In Analysis and Design of Feedback Control Systems; MIT: Cambridge, UK, 2002; p. 18. [Google Scholar]
- Allen, T.; Prosperi, P. Modeling sustainable food systems. Environ. Manag. 2016, 57, 956–975. [Google Scholar] [CrossRef]
- Kumar, A.; Sah, B.; Singh, A.R.; Deng, Y.; He, X.; Kumar, P.; Bansal, R. A review of multi criteria decision making (MCDM) towards sustainable renewable energy development. Renew. Sustain. Energy Rev. 2017, 69, 596–609. [Google Scholar] [CrossRef]
- Siksnelyte, I.; Zavadskas, E.; Streimikiene, D.; Sharma, D. An overview of multi-criteria decision-making methods in dealing with sustainable energy development issues. Energies 2018, 11, 2754. [Google Scholar] [CrossRef]
- Saaty, R.W. The analytic hierarchy process—what it is and how it is used. Math. Model. 1987, 9, 161–176. [Google Scholar] [CrossRef]
- Triantaphyllou, E.; Mann, S.H. Using the analytic hierarchy process for decision making in engineering applications: Some challenges. Int. J. Ind. Eng. Appl. Pract. 1995, 2, 35–44. [Google Scholar]
- Saaty, T.L. A scaling method for priorities in hierarchical structures. J. Math. Psychol. 1977, 15, 234–281. [Google Scholar] [CrossRef]
- Stewart, S.; Thomas, M.O. Process-object difficulties in linear algebra: Eigenvalues and eigenvectors. In Proceedings of the 30th Conference of the International Group for the Psychology of Mathematics Education, Prague, Czech Republic, 16–21 July 2006; p. 480. [Google Scholar]
- Saaty, T.L. Eigenvector and logarithmic least squares. Eur. J. Oper. Res. 1990, 48, 156–160. [Google Scholar] [CrossRef]
- Rao, M.; Sastry, S.; Yadar, P.; Kharod, K.; Pathan, S.; Dhinwa, P.; Majumdar, K.; Sampat Kumar, D.; Patkar, V.; Phatak, V. A Weighted Index Model for Urban Suitability Assessment—A GIS Approach; Bombay Metropolitan Regional Development Authority: Bombay, India, 1991. [Google Scholar]
- Alonso, J.A.; Lamata, M.T. Consistency in the analytic hierarchy process: A new approach. Int. J. Uncertain. Fuzziness Knowl. Based Syst. 2006, 14, 445–459. [Google Scholar] [CrossRef]
- Teknomo, K. Analytic Hierarchy Process (AHP) Tutorial; Ateneo de Manila University: Manila, Philippines, 2006; pp. 1–20. [Google Scholar]
- Van den Broeck, W.; Gioannini, C.; Gonçalves, B.; Quaggiotto, M.; Colizza, V.; Vespignani, A. The GLEaMviz computational tool, a publicly available software to explore realistic epidemic spreading scenarios at the global scale. BMC Infect. Dis. 2011, 11, 37. [Google Scholar]
- Patel, S.S.; Rogers, M.B.; Amlôt, R.; Rubin, G.J. What do we mean by ’community resilience’? A systematic literature review of how it is defined in the literature. PLoS Curr. 2017, 9. [Google Scholar] [CrossRef]
- Stringer, L.; Quinn, C.; Berman, R.; Le, H.; Msuya, F.; Orchard, S.; Pezzuti, J. Combining Nexus and Resilience Thinking in a Novel Framework to Enable More Equitable and Just Outcomes; Paper No 73; Sustainability Research Institute (SRI): Leeds, UK, 2014; p. 24. [Google Scholar]
- Miller, F.; Osbahr, H.; Boyd, E.; Thomalla, F.; Bharwani, S.; Ziervogel, G.; Walker, B.; Birkmann, J.; Van der Leeuw, S.; Rockström, J. Resilience and vulnerability: Complementary or conflicting concepts? Ecol. Soc. 2010, 15, 11. [Google Scholar] [CrossRef]
- Birkel, H.S.; Veile, J.W.; Müller, J.M.; Hartmann, E.; Voigt, K.-I. Development of a risk framework for Industry 4.0 in the context of sustainability for established manufacturers. Sustainability 2019, 11, 384. [Google Scholar] [CrossRef]
- Burch, S.; Gupta, A.; Inoue, C.Y.; Kalfagianni, A.; Persson, Å.; Gerlak, A.K.; Ishii, A.; Patterson, J.; Pickering, J.; Scobie, M. New directions in earth system governance research. Earth Syst. Gov. 2019, 1, 100006. [Google Scholar] [CrossRef]
- WHO. Coronavirus Disease 2019 (COVID-19): Situation Report; World Health Organization (WHO): Geneva, Switzerland, 2020; p. 9. [Google Scholar]
- Hanefeld, J.; Mayhew, S.; Legido-Quigley, H.; Martineau, F.; Karanikolos, M.; Blanchet, K.; Liverani, M.; Yei Mokuwa, E.; McKay, G.; Balabanova, D. Towards an understanding of resilience: Responding to health systems shocks. Health Policy Plan. 2018, 33, 355–367. [Google Scholar] [CrossRef] [PubMed]
- Lehmann, S. Implementing the Urban Nexus approach for improved resource-efficiency of developing cities in Southeast-Asia. City Cult. Soc. 2018, 13, 46–56. [Google Scholar] [CrossRef]
- UNEP; ILRI. Preventing the Next Pandemic: Zoonotic Diseases and How to Break the Chain of Transmission; United Nations Environment Programme (UNEP) and International Livestock Research Institute (ILRI): Nairobi, Kenya, 2020; p. 82. [Google Scholar]
- McGrane, S.J.; Acuto, M.; Artioli, F.; Chen, P.Y.; Comber, R.; Cottee, J.; Farr-Wharton, G.; Green, N.; Helfgott, A.; Larcom, S. Scaling the nexus: Towards integrated frameworks for analysing water, energy and food. Geogr. J. 2018, 185, 419–431. [Google Scholar] [CrossRef]
- Mpandeli, S.; Nhamo, L.; Moeletsi, M.; Masupha, T.; Magidi, J.; Tshikolomo, K.; Liphadzi, S.; Naidoo, D.; Mabhaudhi, T. Assessing climate change and adaptive capacity at local scale using observed and remotely sensed data. Weather. Clim. Extrem. 2019, 26, 100240. [Google Scholar] [CrossRef]
- Termeer, C.J.; Dewulf, A.; Van Lieshout, M. Disentangling scale approaches in governance research: Comparing monocentric, multilevel, and adaptive governance. Ecol. Soc. 2010, 15, 29. [Google Scholar] [CrossRef]
- Landauer, M.; Juhola, S.; Klein, J. The role of scale in integrating climate change adaptation and mitigation in cities. J. Environ. Plan. Manag. 2018, 62, 741–765. [Google Scholar] [CrossRef]
- Bhave, A.G.; Conway, D.; Dessai, S.; Stainforth, D.A. Water resource planning under future climate and socioeconomic uncertainty in the Cauvery River Basin in Karnataka, India. Water Resour. Res. 2018, 54, 708–728. [Google Scholar] [CrossRef]
- Da Silva, L.P.B.; Hussein, H. Production of scale in regional hydropolitics: An analysis of La Plata River Basin and the Guarani Aquifer System in South America. Geoforum 2019, 99, 42–53. [Google Scholar] [CrossRef]
- Benson, D.; Gain, A.K.; Rouillard, J.J. Water governance in a comparative perspective: From IWRM to a’nexus’ approach? Water Altern. 2015, 8, 756–773. [Google Scholar]
- Allouche, J.; Middleton, C.; Gyawali, D. Nexus Nirvana or Nexus Nullity? A Dynamic Approach to Security and Sustainability in the Water-Energy-Food Nexus; Social, Technological and Environmental Pathways to Sustainability (STEPS) Centre: Brighton, UK, 2014; p. 37. [Google Scholar]
Publisher’s Note: MDPI stays neutral with regard to jurisdictional claims in published maps and institutional affiliations. |
© 2020 by the authors. Licensee MDPI, Basel, Switzerland. This article is an open access article distributed under the terms and conditions of the Creative Commons Attribution (CC BY) license (http://creativecommons.org/licenses/by/4.0/).